 Zhihao Xie1†
 Jiayi Zhu1†
 Xiaofeng Xie1Lei Huang2Jianhua Ren3,4
 Ruben Martin-Payo5,6
 Mengying Qiu7
 Fengying Zhang1*
- 1Nursing Key Laboratory of Sichuan Province, West China School of Nursing, West China Hospital, Sichuan University, Chengdu, Sichuan, China
- 2Department of Dermatology and Venerology, West China Hospital, Sichuan University, Chengdu, Sichuan, China
- 3Department of Nursing, West China Second University Hospital, Sichuan University, Chengdu, Sichuan, China
- 4Key Laboratory of Birth Defects and Related Diseases of Women and Children (Sichuan University), Ministry of Education, Chengdu, Sichuan, China
- 5Faculty of Medicine and Health Sciences, Universidad de Oviedo, Oviedo, Spain
- 6PRECAM Research Group, Health Research Institute of Asturias (ISPA), Oviedo, Spain
- 7School of English Studies, Sichuan International Studies University, Chongqing, China
Introduction: Acute respiratory infections (ARIs) represent a significant threat to global public health, particularly among older adults residing in long-term care facilities (LTCFs), where high-density living conditions facilitate the rapid transmission of infections. The perception of risk regarding ARIs among caregivers is critical, as it directly influences their protective behaviors and decision-making during epidemic outbreaks. Despite the importance of this perception, there is currently no validated instrument specifically designed to assess caregivers’ risk perception of ARIs within the context of LTCFs. This study aims to address this gap by developing a reliable and accessible scale to measure caregivers’ risk perception.
Methods: We developed an initial scale through a comprehensive literature review and two rounds of Delphi consultations with 19 experts in related field. A total of 428 participants in LTCFs were surveyed, yielding 343 valid responses and efficiency rate of 80.14%. Following a systematic scale development process that encompassed pretest, item analysis, and exploratory factor analysis (EFA) involving 123 respondents, we refined the scale to its robustness. Confirmatory factor analysis (CFA) was conducted with an additional 220 participants, alongside rigorous tests for reliability, stability, and validity, to evaluate the final scale.
Results: The developed scale consists of nine items categorized into three dimensions: severity, controllability, and susceptibility, all of which meet essential criteria for reliability and validity. The overall Cronbach’α coefficients for the scale was 0.795, with each dimension coefficient of 0.795, 0.707, and 0.791, respectively.
Discussion: In its current form, this scale serves as a valuable tool for managers and practitioners, enabling them to preliminarily assess caregivers’ risk perceptions regarding ARIs in LTCFs. By enhancing our understanding of caregivers’ behaviors, this instrument has the potential to inform targeted interventions.
1 Introduction
Acute respiratory infections (ARIs) represent a major worldwide health problem associated with high morbidity and mortality Diseases GBD (1), which poses a serious threat to human beings globally. As a public health problem, ARIs have contributed to numerous deaths and huge financial losses (2, 3). The most notable recent public health crisis, the COVID-19 pandemic, has led to over 153 million cases of disability (4) and approximately 5 million deaths (5). This underscores the urgent need for effective prevention and management strategies to mitigate the impact of ARIs on populations globally.
Controlling sources of infections, interrupting routes of transmission, and protecting susceptible populations are the three most crucial strategies for the preventing ARIs. Among all susceptible populations, individuals aged 65 years and older are particularly vulnerable (5). Compared to other age groups, older adults not only exhibit a higher susceptibility to ARIs but are also more likely to experience severe complications during the ARIs epidemics (6–9).
In long-term care facilities (LTCFs), where older adults are concentrated, the risk of ARI transmission is significantly heightened. Many residents in LTCFs also suffer from conditions such as dementia, strokes, or other chronic diseases, which may mask the symptoms of ARIs and delay the implementation of effective preventive measures (10). Therefore, LTCFs require broader concerns in the prevention and control of ARIs to safeguard the health of this vulnerable population.
Risk perception was first introduced by Raymond Bauer in 1960, who defined it as the consumer’s perception of uncertainty regarding the outcomes of purchasing decisions (11). In the realm of public health, risk perception is closely linked to the adoption of healthy behaviors (12–14). It plays a crucial role in the individual decision to take preventive actions (15).
For caregivers, their perception of risk significantly influences their care behaviors, which directly affect disaster risk prevention for older adults inhabiting LTCFs. Risk perception encompasses the public’s intuitive judgments about risks (16), and it could shape individuals’ coping behavior and then contributes to the adoption of protective measures while facing risks (17).
Additionally, individual risk perception not only aids in the formulation of public health interventions, but also impacts the implementation and effectiveness of those interventions (18, 19). Therefore, assessing caregivers’ risk perception regarding ARIs is crucial for managers and researchers for LTCF. This understanding enables them to evaluate potential risks and design effective training programs or interventions for caregivers. Ultimately, enhancing caregivers’ awareness and understanding of ARI risks contributes to the prevention of ARIs outbreaks and helps maintain the well-being of older adults in these facilities.
However, existing scales measuring risk perception related to ARIs have not specifically addressed the perception of caregivers in LTCFs. Recognizing the uniqueness and importance of caregivers’ risk perception, this study aims to develop an available instrument for caregivers to assess their risk perception of ARIs among the older adults they care for in LTCFs. This instrument will be essential for effective risk management within these facilities, providing valuable insights that can guide training and intervention strategies to enhance the safety and well-being of residents.
2 Methods
2.1 Research procedures
This study adhered to the recommended “three phases and nine steps of scale development and validation” procedure (20) in the development of risk perception scale on ARI for caregivers in LTCFs (RPSACL) (Figure 1).
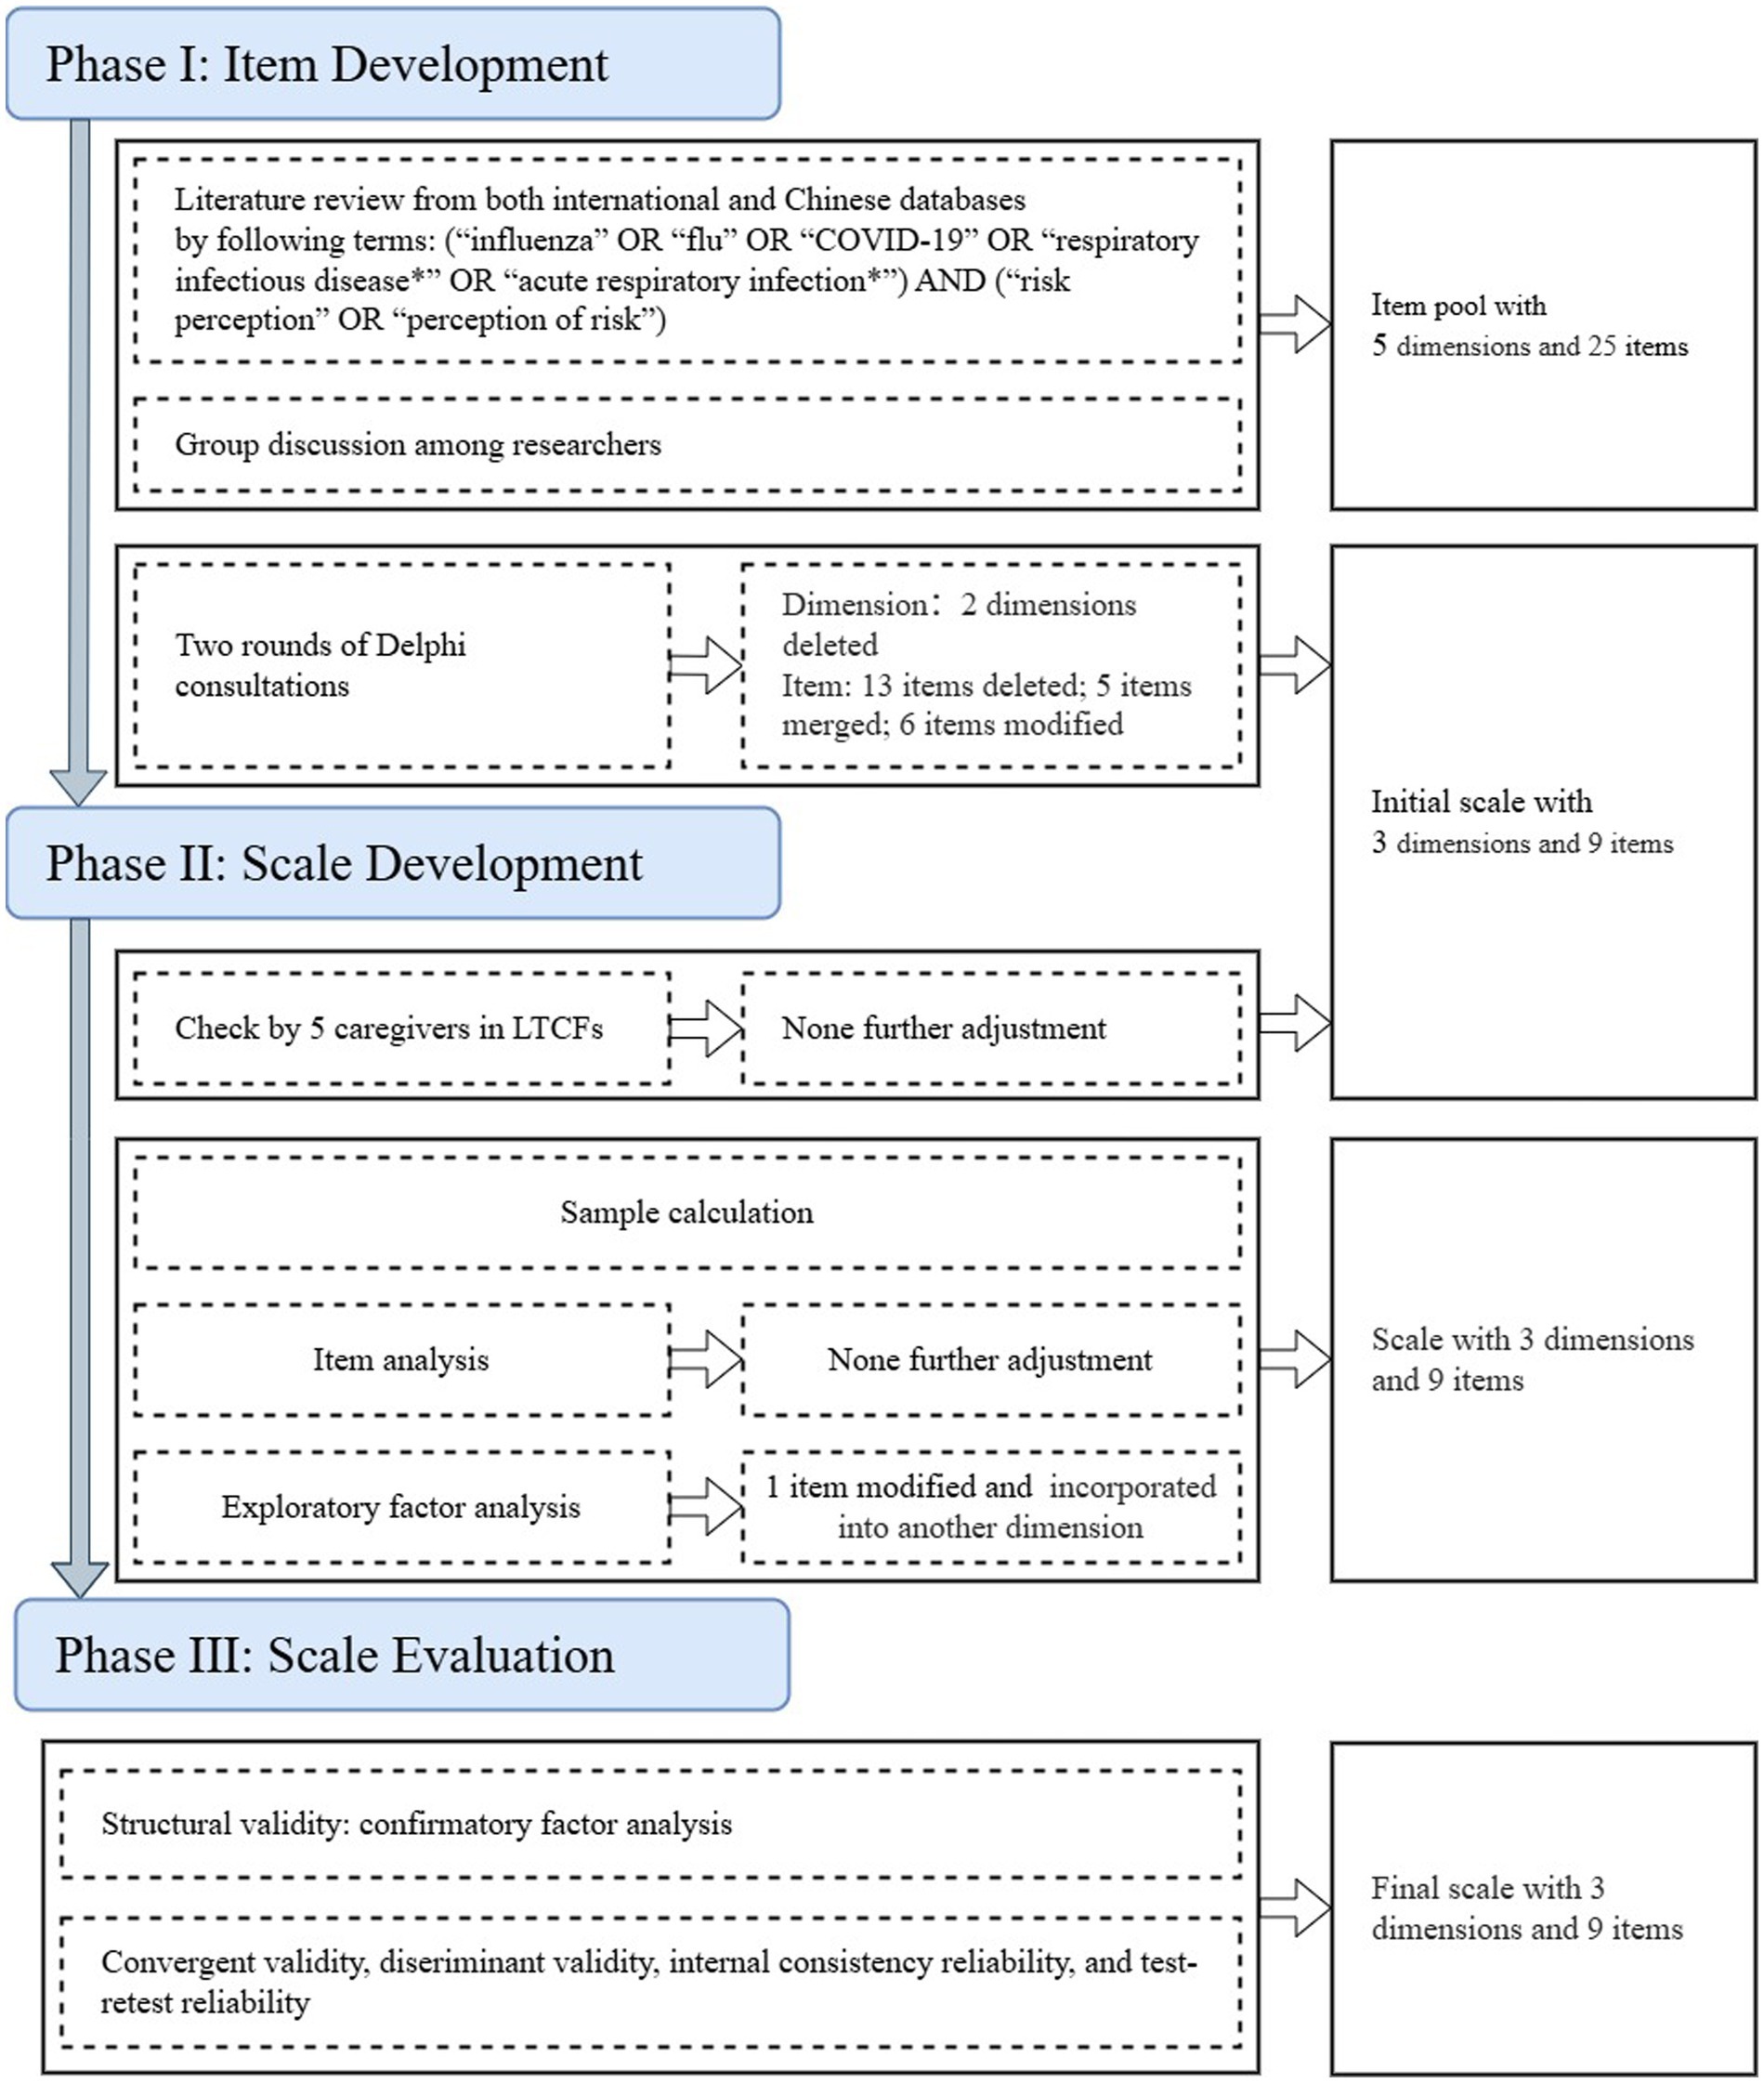
Figure 1. Study flow.
2.1.1 Construction of item pool
The initial scale was formed based on extensive literature review and Delphi consultation method. Firstly, we searched literature from database establishment to September 30, 2021 in English and Chinese using the following terms: (“influenza” OR “flu” OR “COVID-19” OR “respiratory infectious disease*” OR “acute respiratory infection*”) AND (“risk perception” OR “perception of risk”). We identified 863 correlated studies and only 7 of those studies developed scales that are relevant (21–27). Initial Item pool was developed (Table 1) based on a comprehensive literature review and discussion between research team members.

Table 1. Item pool.
2.1.2 Delphi method
After forming the item pool, the Delphi method was conducted involving 10–20 experts in LTCF management, geriatric nursing, and risk management (28, 29). Experts were required to assess the importance and feasibility of every dimension and item by scoring. This approach was designed to ensure a broad range of perspectives while maintaining manageability. Invitation letters containing the initial scale were sent to the experts via email, which included clear instructions for participation. Each expert completed the questionnaire and returned their feedback within a 14-day timeframe. This iterative process continued until a consensus was reached or until there were no significant changes in the responses. The primary task of experts was to evaluate the importance and feasibility of each dimension and item within the scale. They utilized a scoring system ranging from 0 to 5 points for their assessments. In addition to providing these ratings, experts were encouraged to suggest modifications to enhance each item. To ensure the reliability of the consultation, expert authority coefficients were calculated based on academic standard weight, judgment weight, and familiarity weight (Supplementary material 1). According to established guidelines, an expert authority coefficient greater than 0.7 indicates a reliable consultation process (30). The items whose feasibility or importance scores have a maximum score ratio of over 80% and a coefficient of variation over 25% was the preliminary screening principle for each dimension and item (29). At the conclusion of the Delphi consultation questionnaire, the experts reflected on their judgments and assessed their familiarity with the content being evaluated. This reflective component allowed for a deeper understanding of their perspectives and ensured that their insights were well-informed. Throughout the consultation, we engaged in a critical evaluation of the scale’s dimensions and items, leveraging our collective expertise to refine and validate the tool effectively.
2.1.3 Pre-test
To make sure each item could be well understanded by respondents, pre-test was conducted on caregivers in LTCFs after Delphi method. Necessary adjustment would be made if any item were not concise and understandable according to responders’ feedback. Then the scale was used to verify its reliability and validity.
2.1.4 Sample calculation
We calculated the sample size with more than 10 times the number of items, which was recommended by Nunnally (31). So, we collected two groups of samples, one for item analysis and exploratory factor analysis, and the other for confirmatory factor analysis, as well as assessing Cronbach’α coefficient, test–retest reliability, and construct validity.
2.1.5 Item analysis
We employed item discrimination and a homogeneity test to conduct item analysis. Conceptually, items within a scale should effectively differentiate between subjects in favorable and unfavorable conditions. Moreover, items designed to measure the same construct should share similar characteristics. We ranked participants based on their scores on the scale and classified the top 27% as the high group, while the bottom 27% as the low group (32). We then carried out independent samples t-tests to identify significant differences between these two groups (20). Items that did not exhibit statistically significant differences were deemed to lack discriminatory power and were removed from further analysis. For the homogeneity test, we calculated the correlation coefficients between items. Items with the absolute t-values were more than three indicated insufficient homogeneity (20). After completing the item analysis, only those items demonstrating both discriminative ability and homogeneity were retained for subsequent factor analysis.
2.1.6 Exploratory factor analysis
Kaiser-Meyer-Olkin (KMO) test was conducted to determine whether the sample is qualified for exploratory factor analysis (EFA). The sample whose cut-off value was larger than 0.50 and the Bartlett’s test reaches a significant level was qualified for EFA (33). The maximum variance method was used in EFA. Items with factor loadings larger than 0.55 were included (32). Besides, the scale was proved to have good univariance contribution rate of more than 60% (34).
2.1.7 Scale evaluation
Based on the result of EFA, we conducted confirmatory factor analysis (CFA) via structural equation modeling (SEM). Due to the sample size calculated in this research was less than 500, and questionnaires were scored as continuous variables, we conducted the generalized least square (GLS) method in this study (32). We adopted the following indicators to evaluate the model fit. Several indices of the CFA were retained to examine the model:
(1) χ2/degrees of freedom (χ2/DF): When the χ2/DF value is close to 1, it suggests that the model exhibits a strong explanatory power for the data. When this value falls between 1 and 3, the model fit can be considered moderate. However, when it is greater than 3, it is generally regarded as an indication that the model does not fit the data well, and it may be necessary to review and potentially modify the model (35).
(2) Normed Fit Index (NFI), Incremental Fit Index (IFI), and Comparative Fit Index (CFI): the values of these indexes are greater than 0.90 is considered acceptable (36).
(3) Root Mean Square Error of Approximation (RMSEA): When the model exhibits good fitness, the RMSEA is less than 0.05. Conversely, when the model fitness is poor, the RMSEA is higher than 0.1, indicating that modification is required. If the RMSEA value lies between 0.050 and 0.100, it implies that while the model is not highly satisfactory, it is still acceptable (36).
For reliability, we calculated the Cronbach’s α coefficient of the RPSACL and each dimension. The reliability was considered to be high when the Cronbach’s α coefficient was over 0.70 (37). To evaluate retest reliability of RPSACL, we selected 59 participants to evaluate their retest reliability after an interval of 4 weeks (38).
In order to verify the construct validity, we calculated the convergent validity and discriminant validity. Convergent validity mainly focuses on the degree of consistency among different measurement indicators within the same construct of a scale. Generally, when the composite reliability (CR) value is greater than 0.7, it indicates that the scale has good internal consistency (39). Discriminant validity aims to examine whether the scale can distinguish between different constructs. When the square root of the Average Variance Extracted (AVE) for a particular construct exceeds the correlation coefficients between said construct and others, and concurrently, its Composite Reliability (CR) value is greater than 0.7, it provides substantial evidence that the construct can be distinctly discriminated from other constructs. This indicates effective discriminant validity, highlighting the scale’s ability to distinguish between different constructs (39).
2.2 Sampling
Participants who meet the following criteria were included: (1) provide care for older adults; (2) work in LTCF; (3) have worked over 6 months; (4) fully understand and voluntarily participate in this study. Besides, those who meet the following criteria were excluded: (1) have resigned or retired; (2) refuse to participate in this survey.
A wide-ranging online survey was conducted among caregivers in LTCFs in China. Participants recruited were invited to fill out the online questionnaire connected to the Wenjuanxing platform1 after informed consent was given. It was guaranteed that their answer and private information would be confidential and processed anonymously.
2.3 Study instruments
This study utilized the questionnaires consisting of two parts. One was general demographic data questionnaire, including gender, age, education, marital status, working years in LTCF, charge of the LTCF, and another was the initial RPSACL. The initial RPSACL contains nine items, which measured risk perception from severity, controllability, and susceptibility. Besides, a five-point Likert scale was taken to score individuals’ level of risk perception. Items were assessed on a five-point Likert scale (1 = strongly disagree; 2 = disagree; 3 = neither agree nor disagree; 4 = agree; 5 = strongly agree), with higher score indicating higher level of risk perception. The total score ranged from 5 to 45 points.
2.4 Statistical methods
The data was analyzed by IBM SPSS 26.0 and IBM AMOS 25.0. Items analysis and exploratory factor analysis were taken to filter items. Besides, the reliability of the RPSACL was tested by calculating Cronbach’s α coefficient and stability was tested by Pearson correlation analysis. Hence, structural equation modeling was employed to regress RPSACL dimensions (using the validated RPSACL) on the identified risk perception factors.
2.5 Common method bias
Common method bias may influence the validity and reliability of the research results (40). To address this issue, we implemented several strategies aimed at mitigating its effects (41). First, we ensured anonymity and confidentiality for respondents, which is crucial for reducing social desirability bias and fostering more honest and reflective responses. Additionally, we incorporated attention-check questions in the survey to identify participants who may not be responding thoughtfully, allowing us to exclude inattentive responses from our analysis. Furthermore, we utilized statistical techniques, such as confirmatory factor analysis, to detect and control for the presence of common method bias within our dataset (42). These strategies aimed to enhance the overall quality of the data collected and ensure more reliable research outcomes.
2.6 Ethical considerations
This study has been approved by Ethics Committee on Biomedical Research, West China Hospital of Sichuan University [2020 Review (No. 1270)]. To ensure the informed consent of respondents and their voluntary participation, each respondent was required to review and sign the informed consent form prior to providing responses.
3 Results
3.1 Delphi consultation
We invited 19 experts majoring in LTCF management, geriatric nursing, and risk management as an expert panel (Table 2). Two rounds of Delphi consultations were conducted in total, during which consensus was ultimately achieved. A total of 19 consultation questionnaires were distributed in each round, and the effective recovery rate of expert consultation questionnaires consistently remained at 94.74%, indicating the comprehensive collection and analysis of data (43).
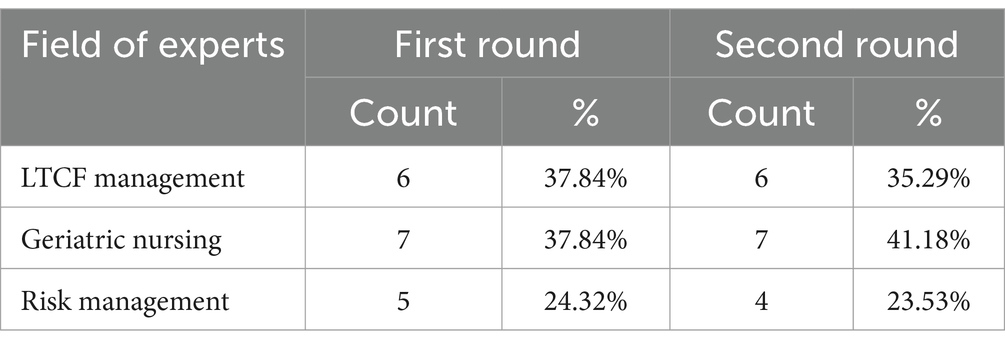
Table 2. Information of experts panel.
In the first round of Delphi consultation, the overall expert authority coefficient for this study was calculated to be 0.85, with individual authority coefficient for valid experts ranged from 0.75 to 0.93 (Table 3). Detailed information regarding the dimensions of the questionnaire and the scores of each item can be found in Table 4. Then we engaged in-depth discussions with every expert to decide the revisions of the items according to the suggestions given by experts. Based on their input and the scores in expert questionnaire, we made revisions to the items and dimensions (Table 5).
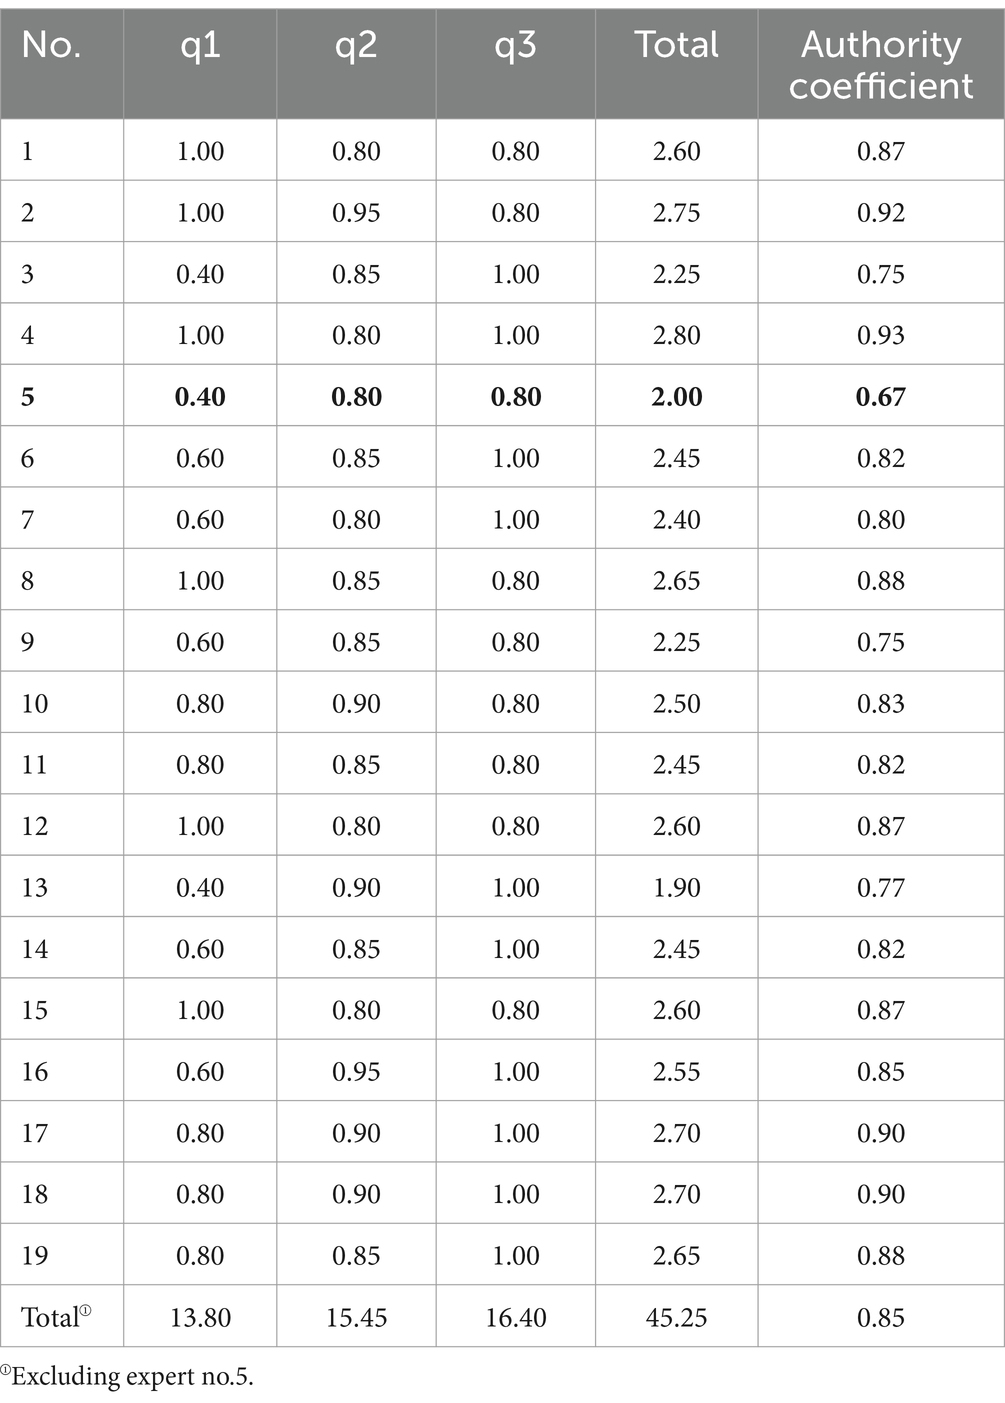
Table 3. Experts authority coefficient.
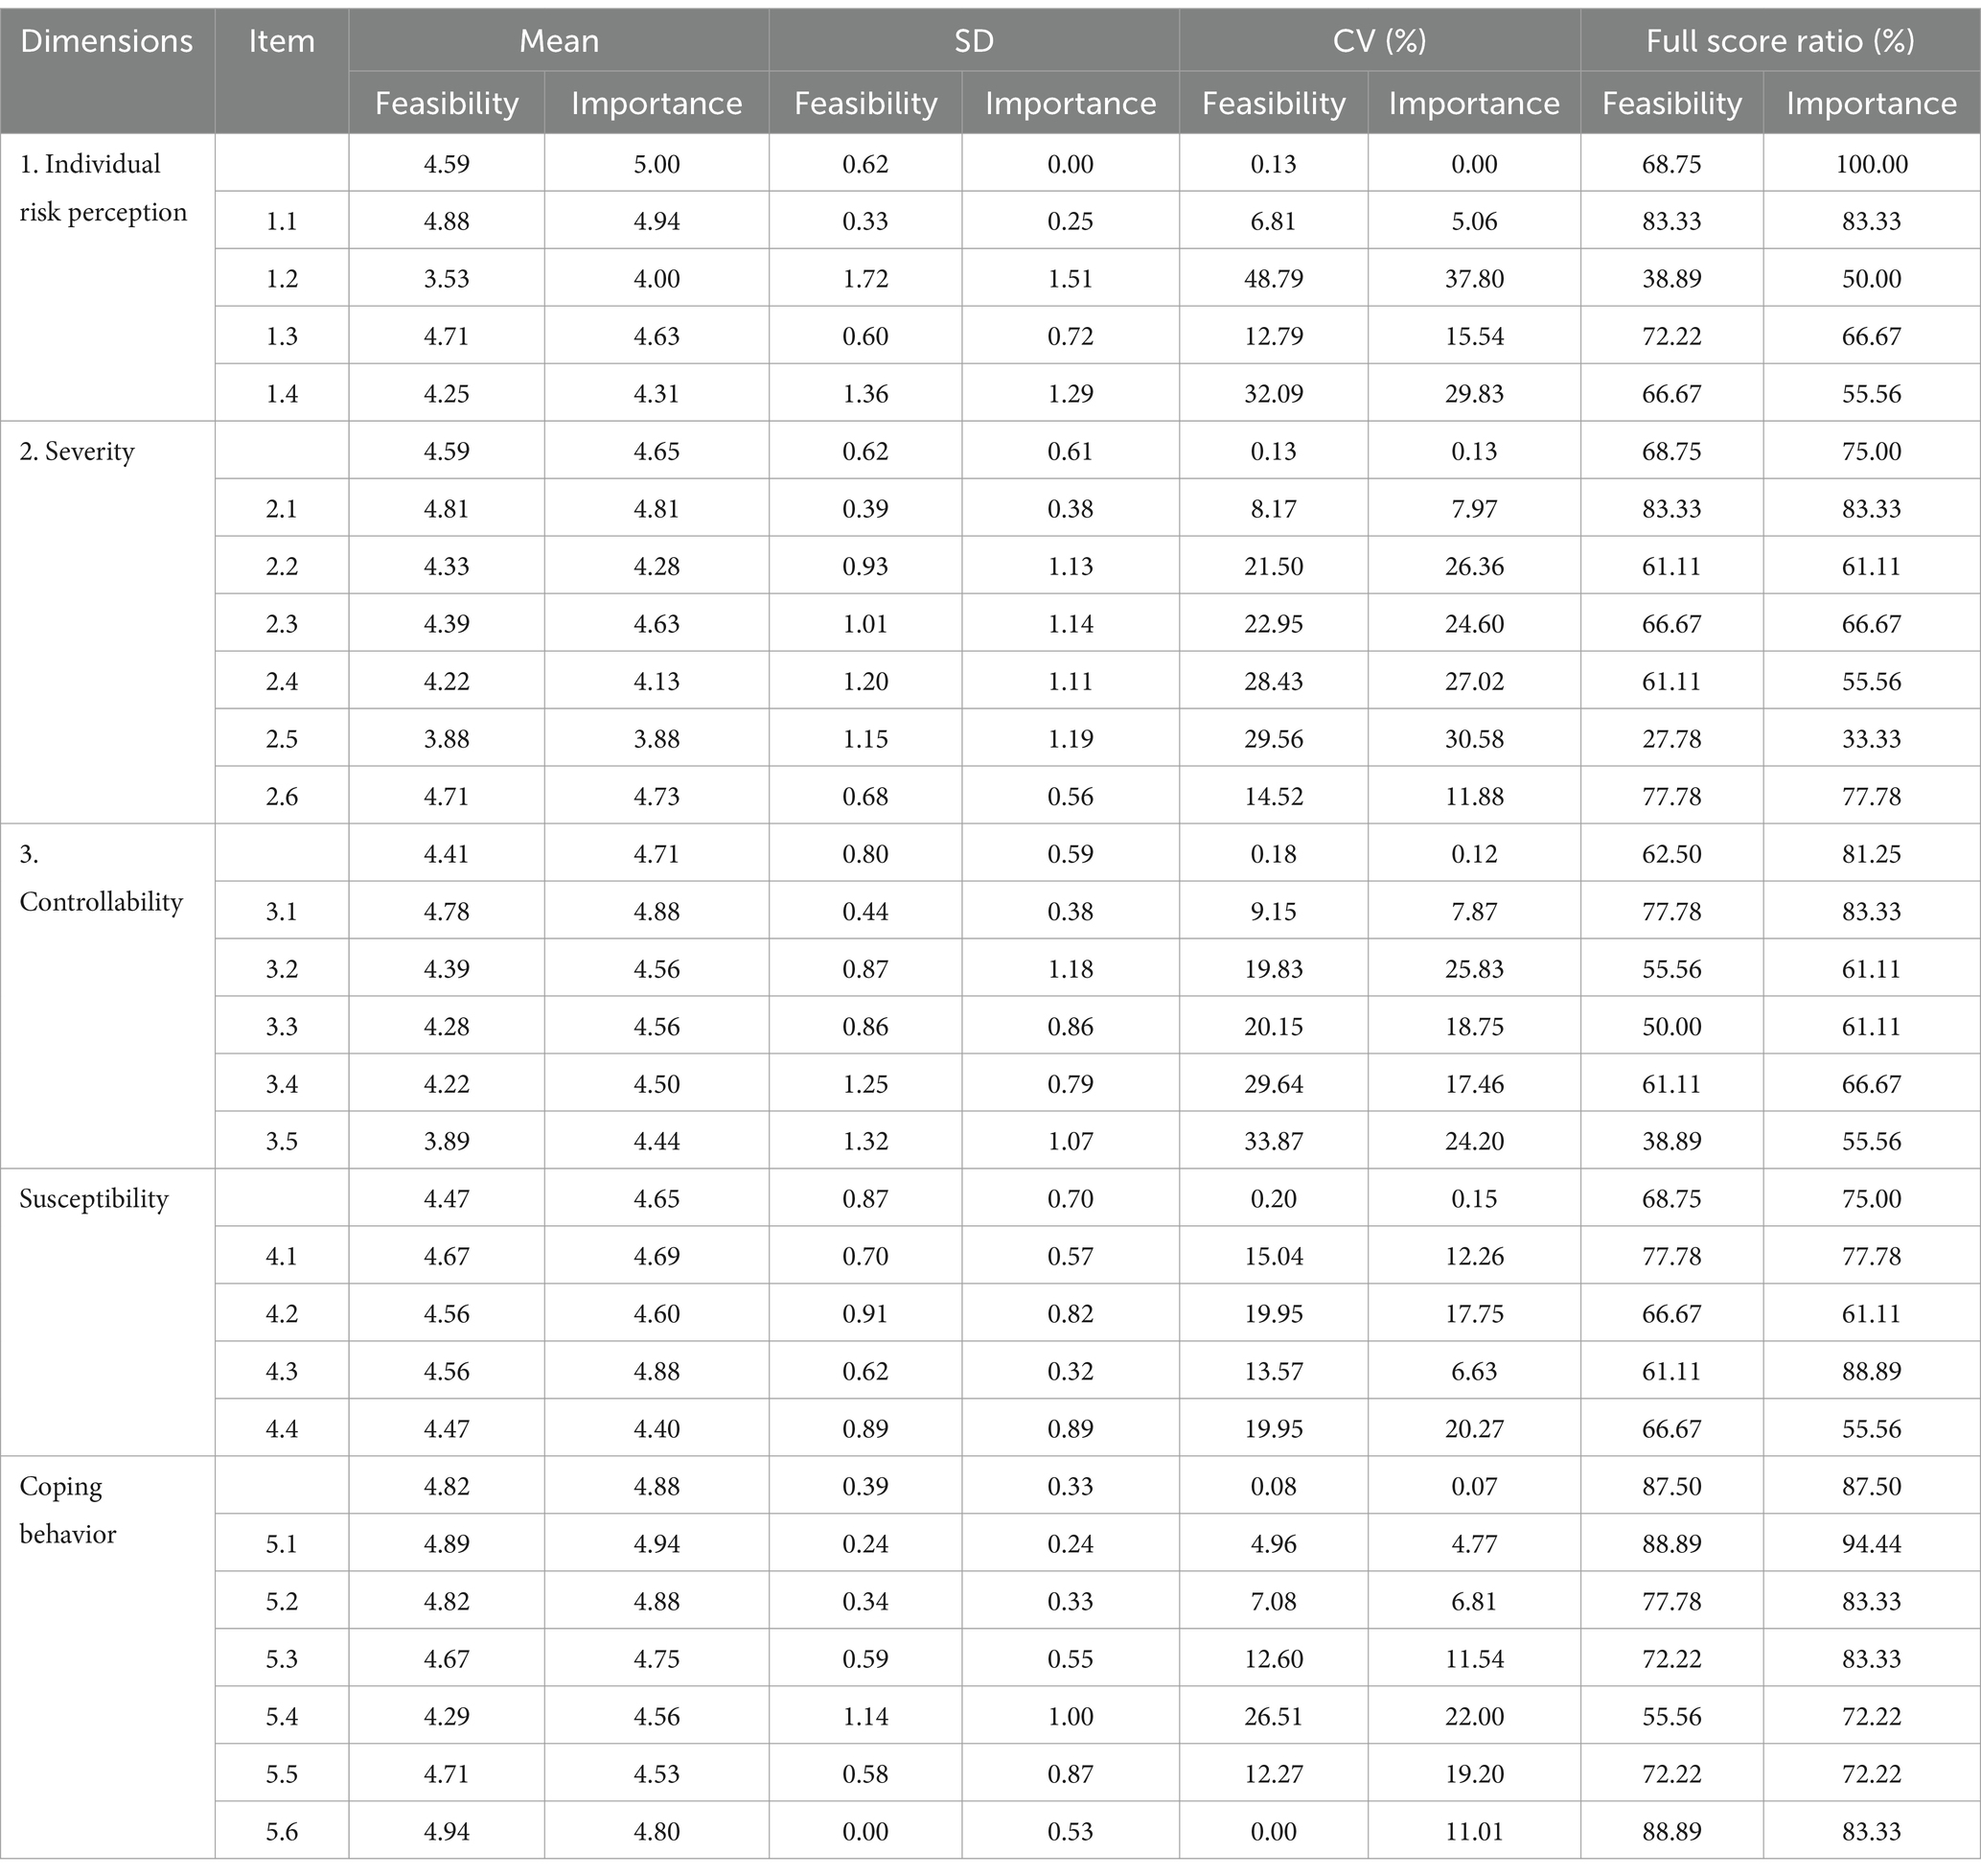
Table 4. Result of the first round consultation.
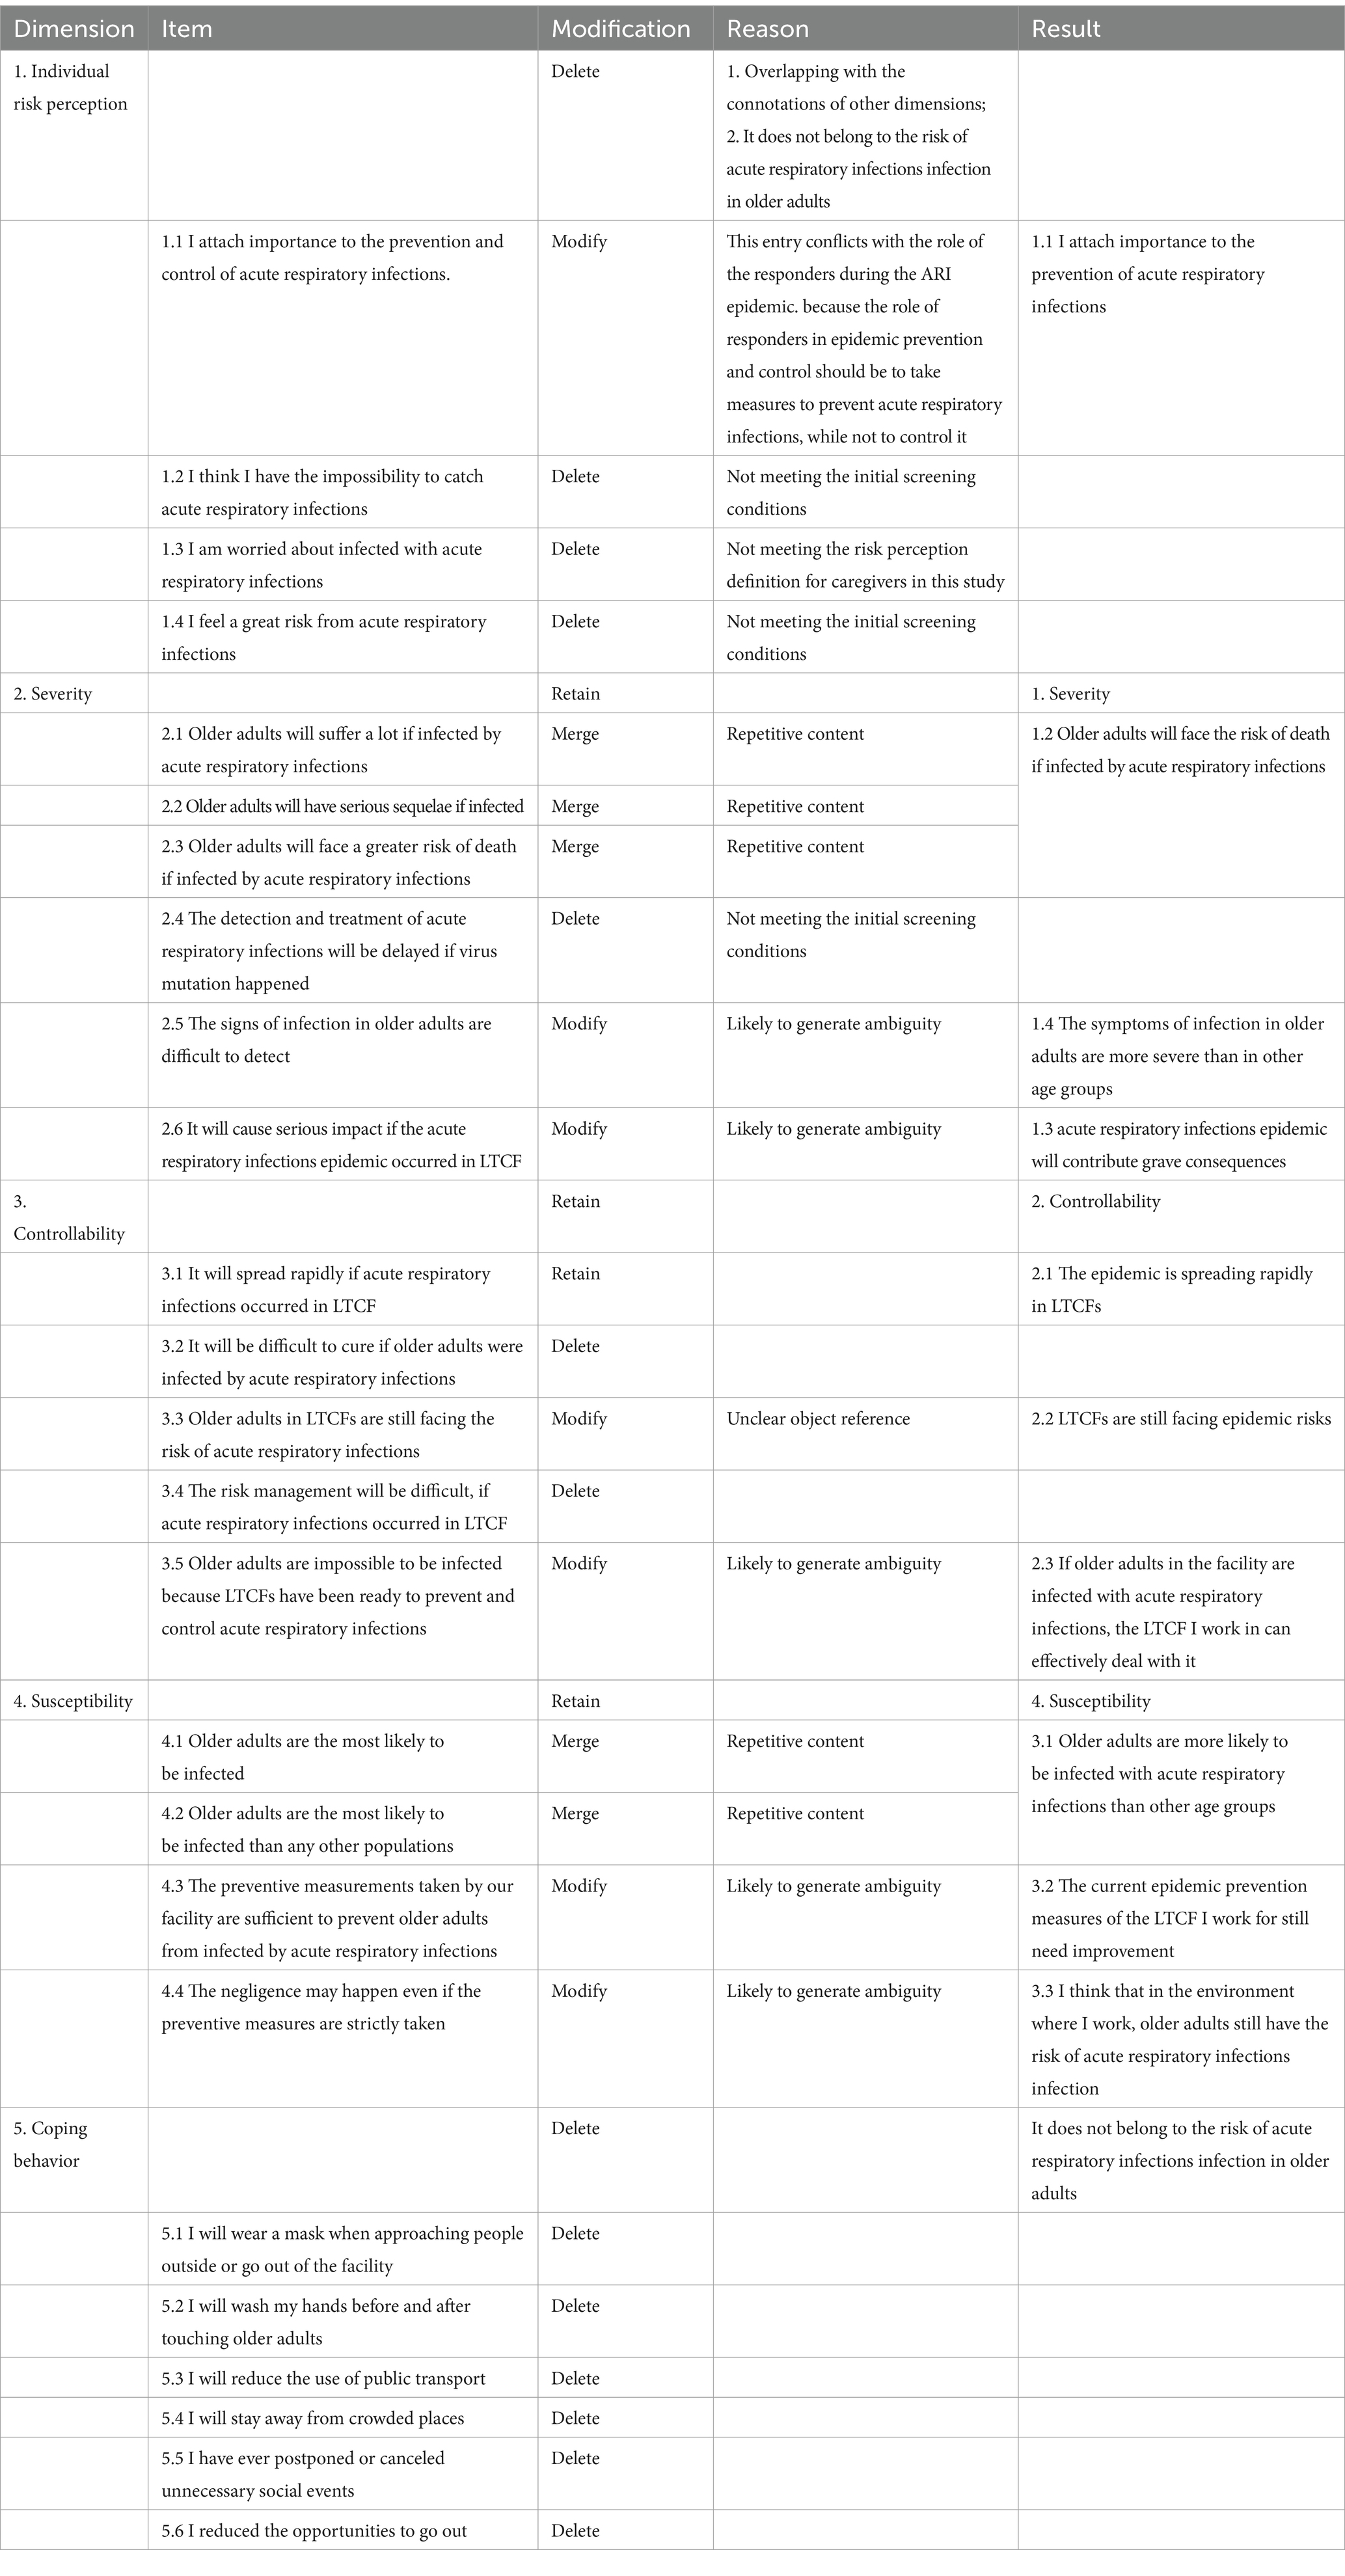
Table 5. Adjustment of items and dimensions.
In the second round of Delphi consultation, we repeated the process established in the first round. After thorough evaluation and discussion, consensus was achieved among all experts. As a result, an initial scale was developed, comprising three dimensions and nine items (Table 6).
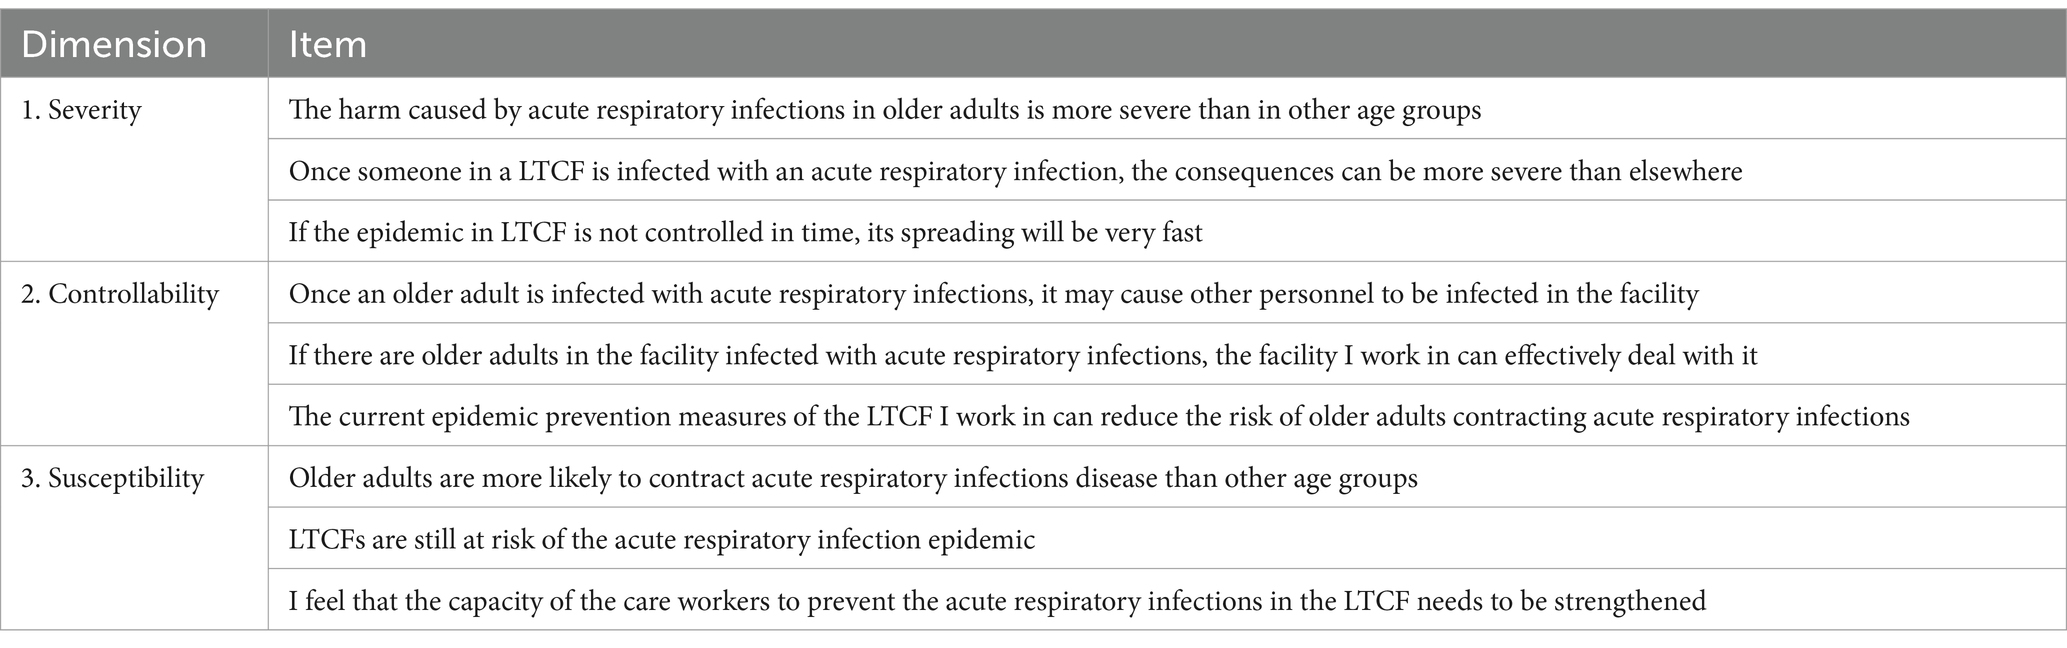
Table 6. The initial scale.
3.2 Pre-test
Five caregivers from LTCFs were invited to evaluate the 9-items scale to assess the clarity and comprehensibility of the items. All the respondents demonstrated a strong understanding of the items, indicating that the questions were clear and effectively communicated. As a result, no further adjustments were deemed necessary, confirming the scale’s readiness for broader application.
3.3 Participants
We collected three rounds of data collection, resulting in a total of 343 valid questionnaires from an initial pool of 428 collected questionnaires, yielding a validation rate of 80.14%. Samples 1 and 2 were collected from January to February 2022, while Sample 3 was gathered from August to September 2024. Among the respondents, 16.91% were male, with the median age of the participants ranging between 41 and 50 years (Table 7). Sample 1 consisted of 123 participants and was employed for item analysis and exploratory factor analysis (EFA). Sample 2 included 120 participants and was employed for confirmatory factor analysis (CFA), calculation of Cronbach’ α coefficient, and construct validity. Sample 3 served as a supplementary collection to address the insufficient sample size of Sample 2 for conducting CFA.
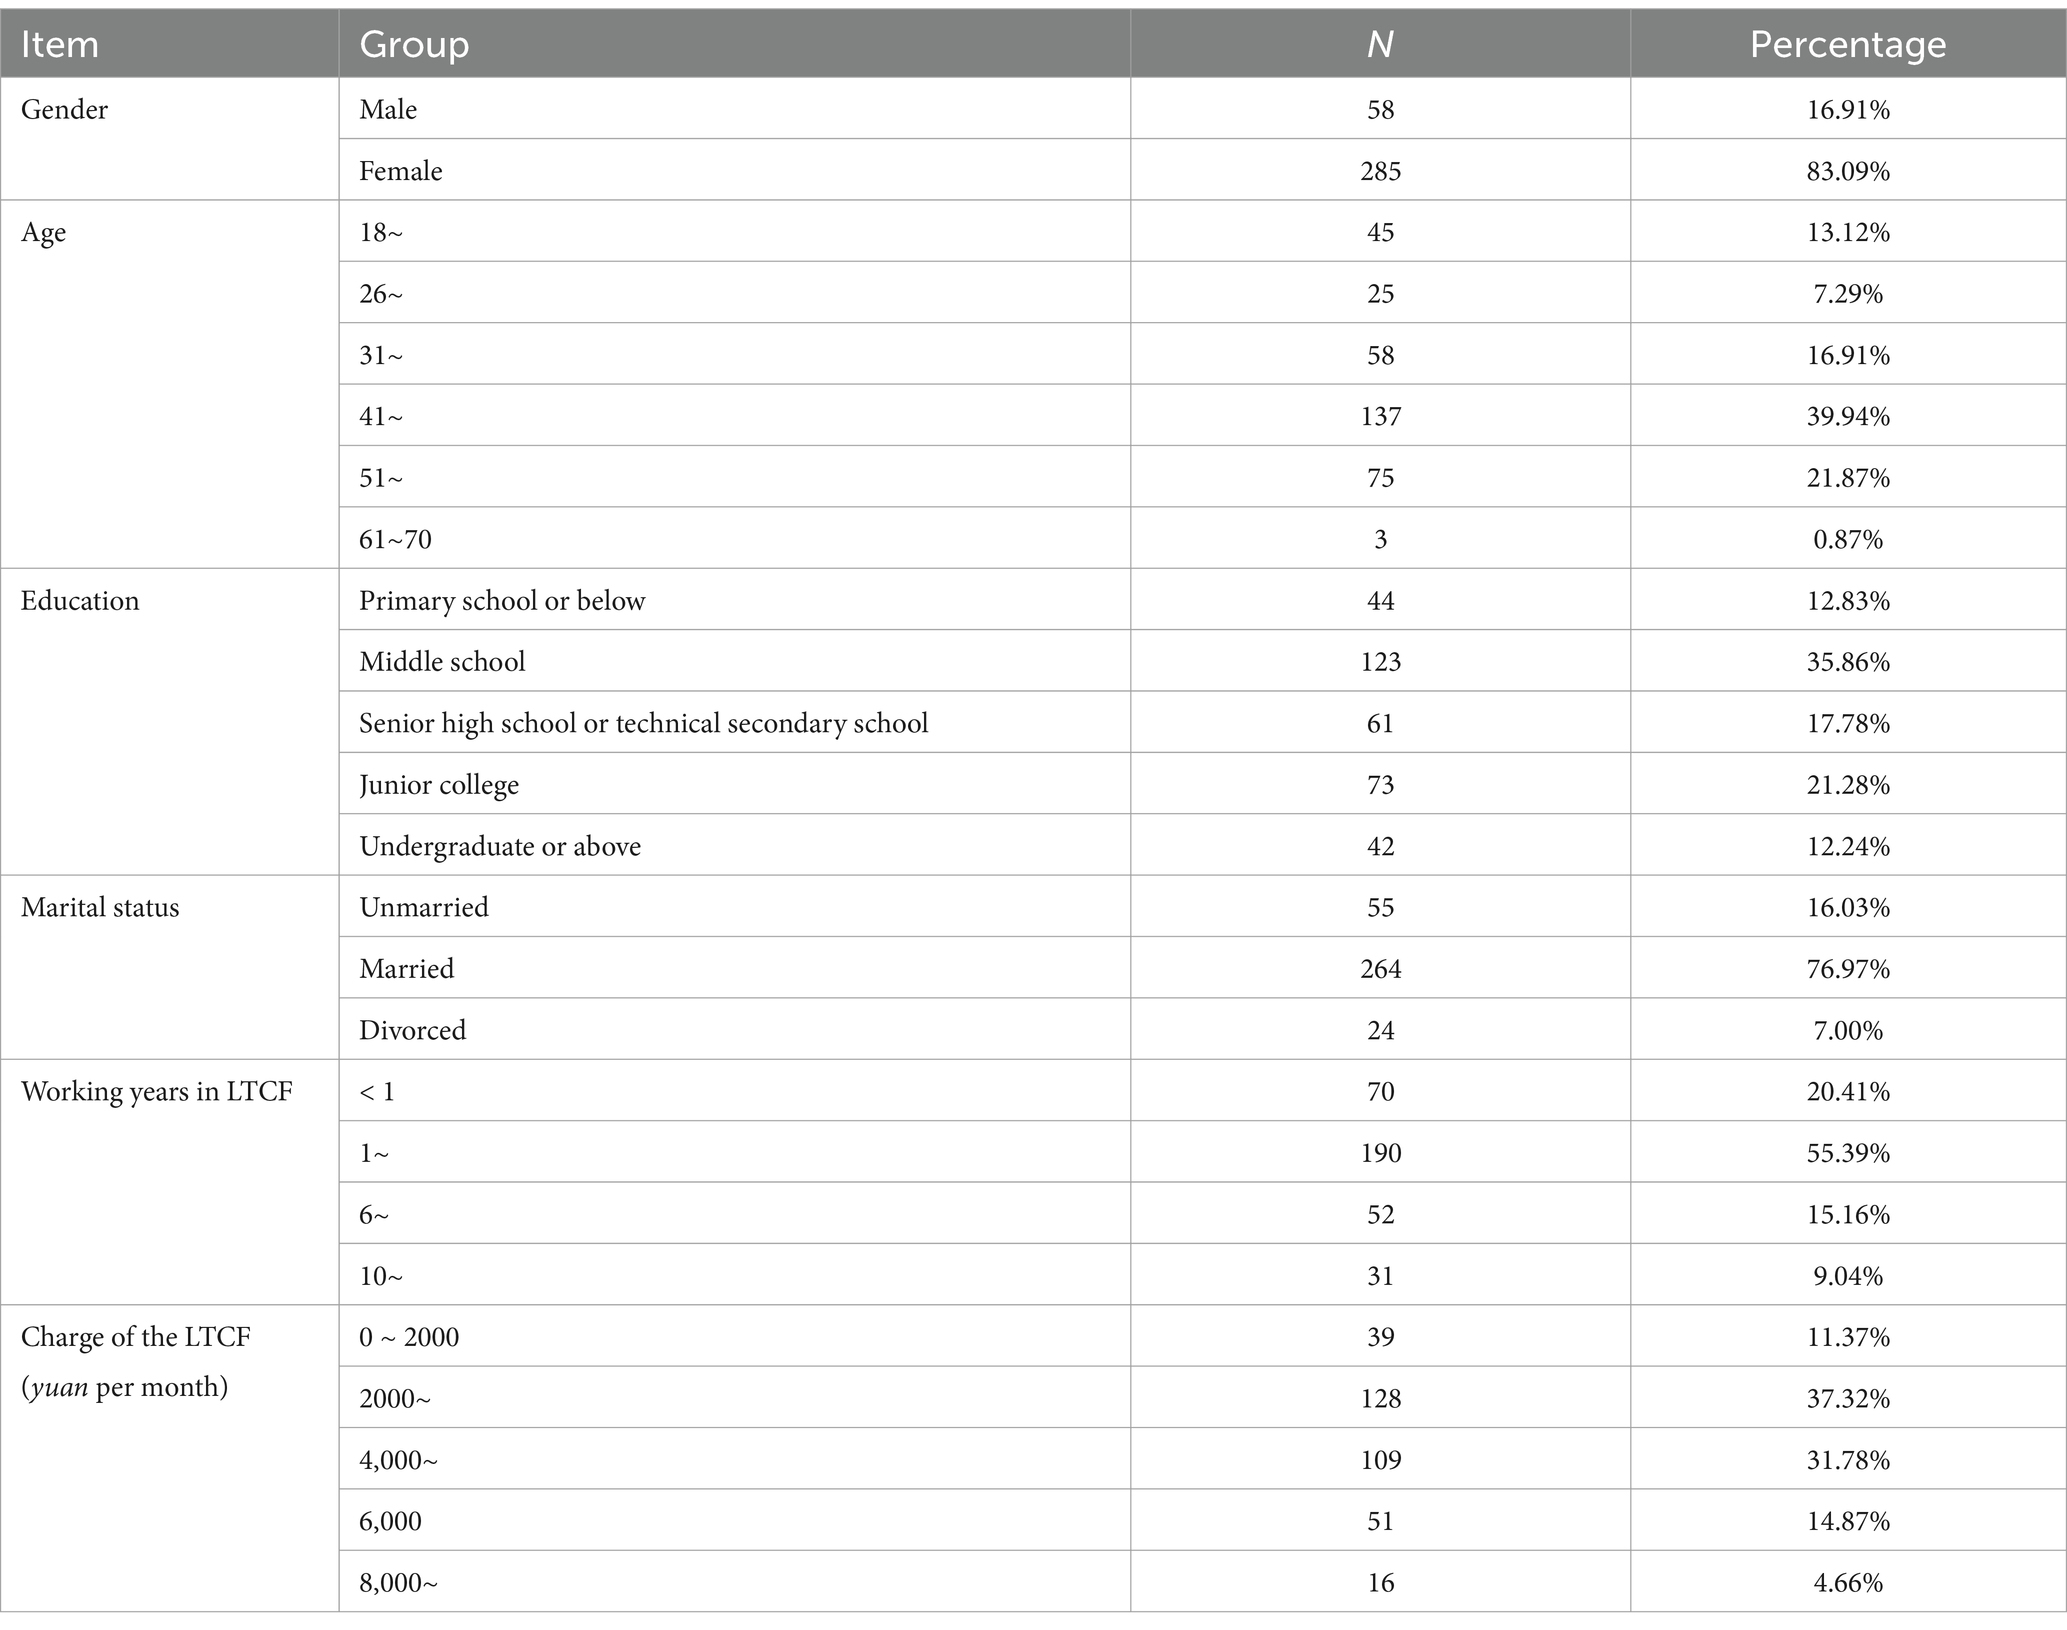
Table 7. Demographic information of participants (n = 343).
3.4 Item analysis
The results revealed that the absolute t-values for each item in the scale were all exceeded 3 (p < 0.05) (Table 8), which indicated that all items had satisfactory discriminatory power and should be retained.

Table 8. Item analysis (sample 1, n = 123).
3.5 Exploratory factor analysis
The Kaiser-Meyer-Olkin (KMO) value of all items in the scale was 0.746, which exceeds the recommended cut-off value of 0.50. Additionally, Barlett’s test yielded a statistic of 318.241 (p < 0.001), indicating that the risk perception scale is qualified for EFA.
EFA was conducted using principal component analysis with the maximum variance method, resulting in the extraction of three factors (Table 9). The factor loadings for each item were all greater than 0.55, and the total variance explained by these factors was 68.366%. This suggests that the scale effectively captures the underlying constructs related to risk perception.
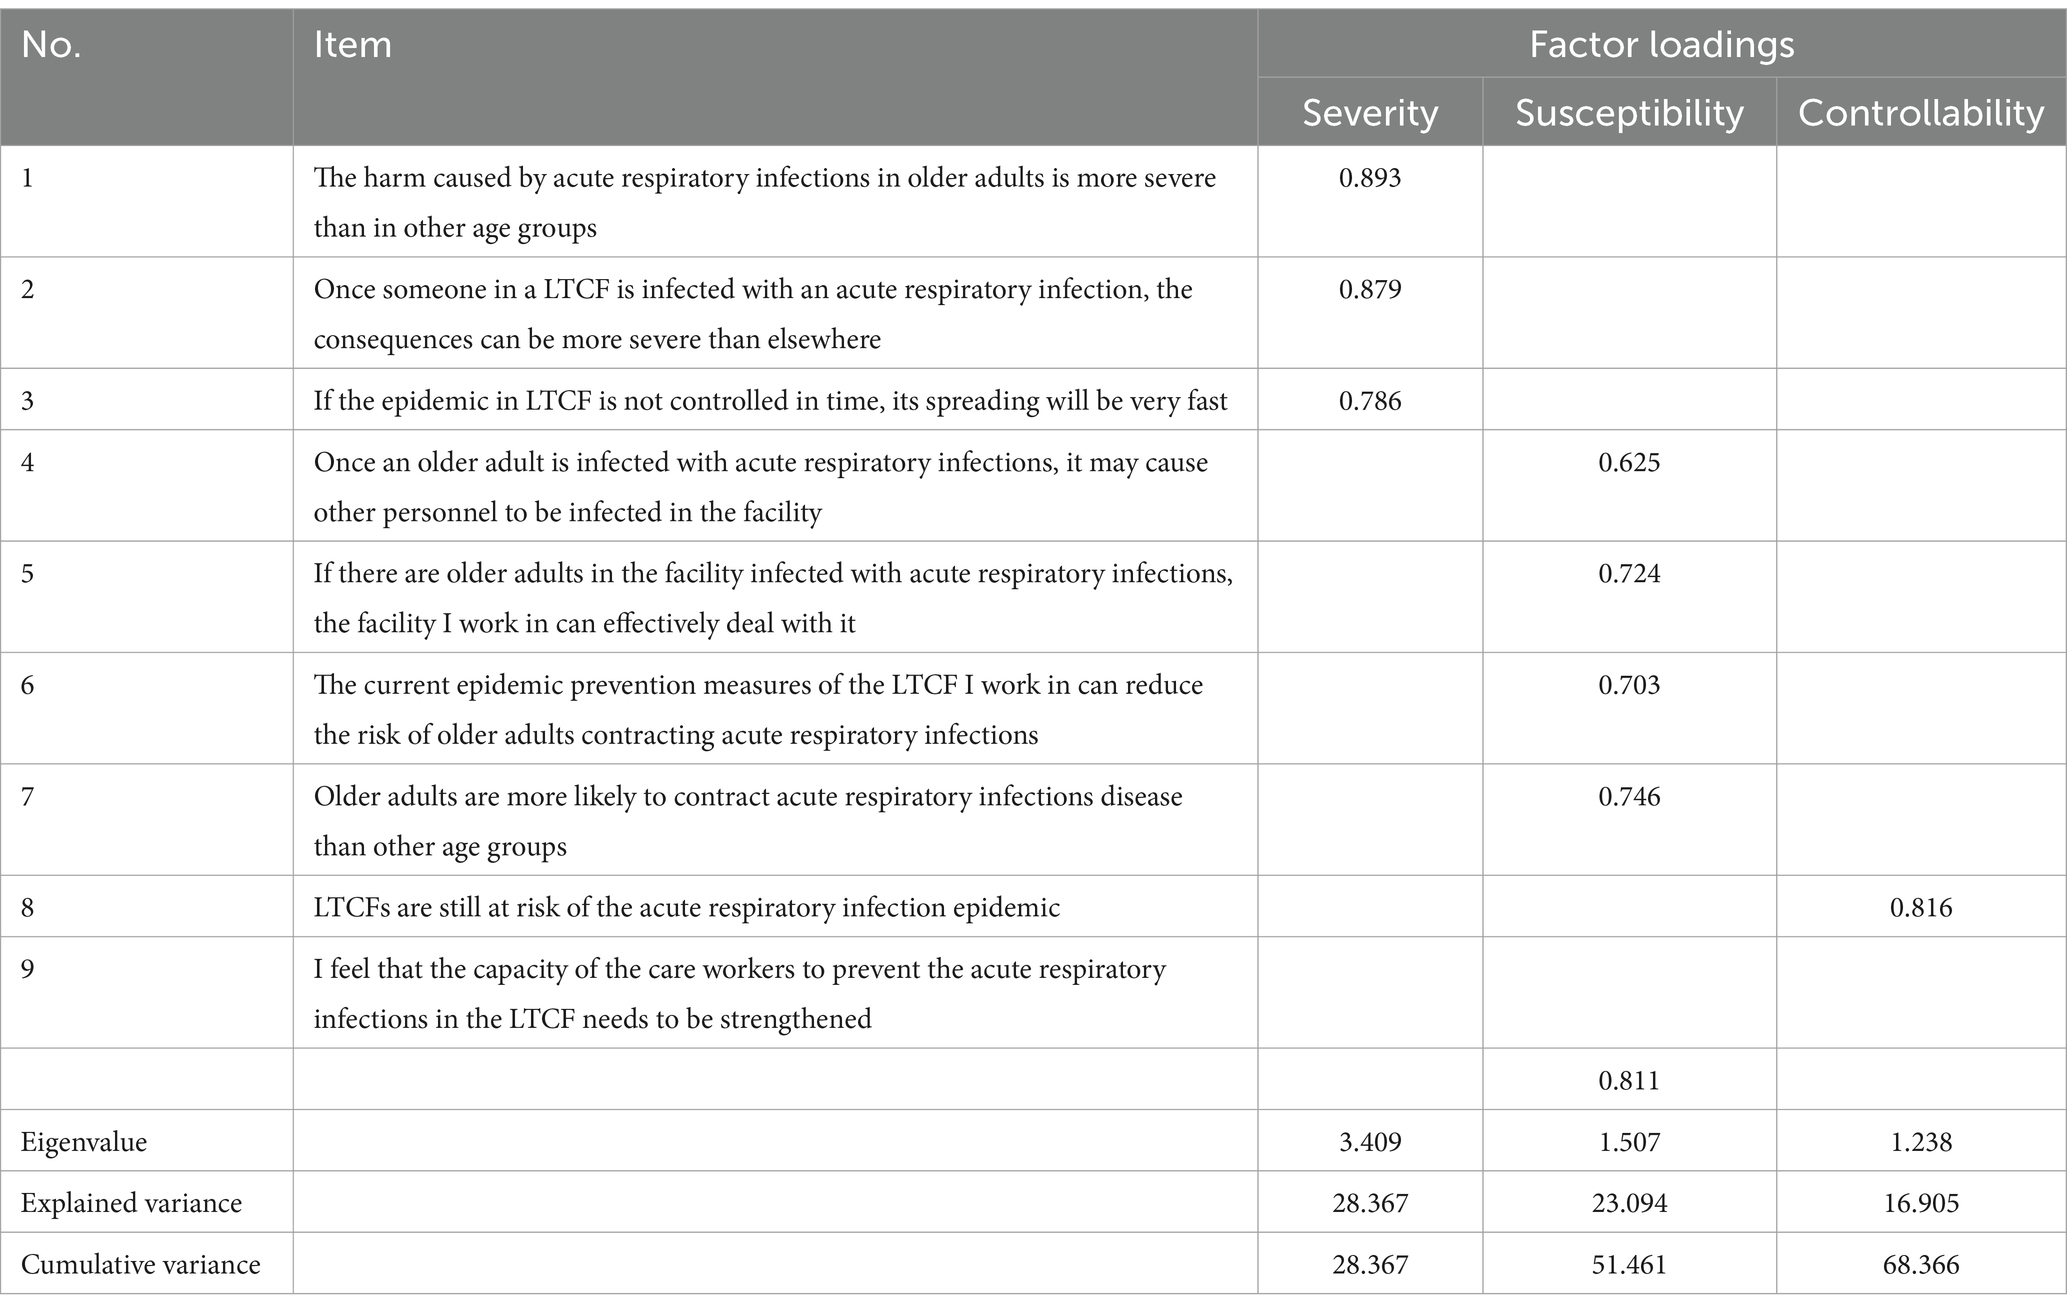
Table 9. Exploratory factor analyses for the RPSACL (sample 1, n = 123).
3.6 Confirmatory factor analysis
The model fit statistics of the model developed by CFA were as follows: χ2/DF (120) = 3.800, with a NFI of 0.810, an IFI of 0.852, a CFI of 0.848, and a RMSEA of 0.153 (Figure 2). These results suggest that the model fit is not satisfactory.
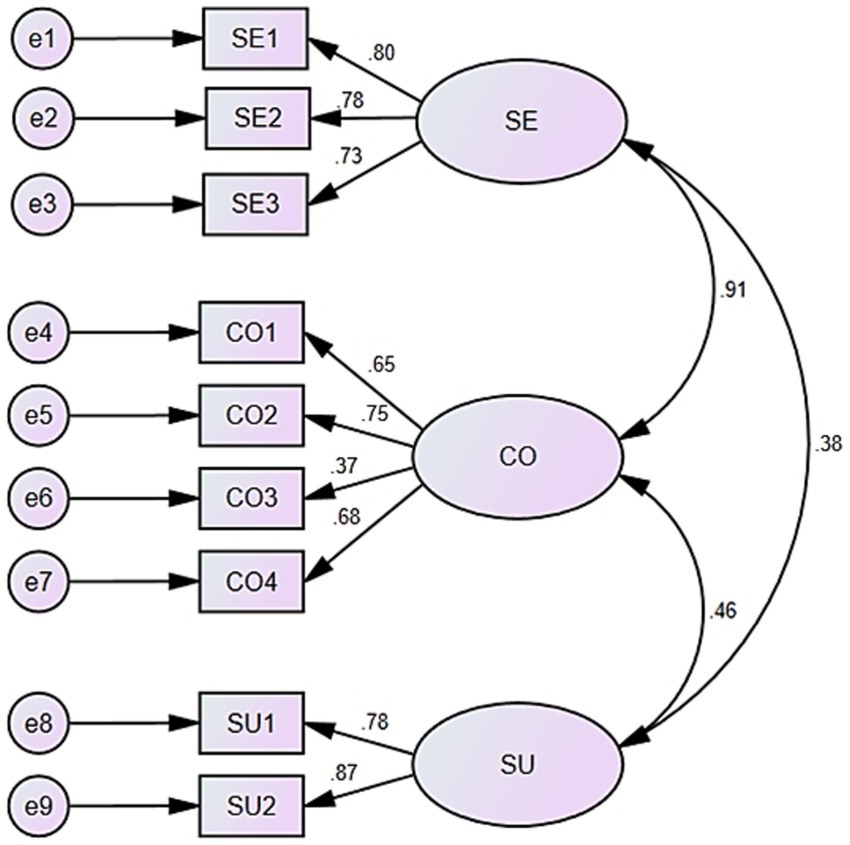
Figure 2. Three—factor confirmatory factor analysis model. SE, severity; CO, controllability; SU, susceptibility.
3.7 Reliability and stability
The Cronbach’s α coefficient of the RPSACL was 0.795, which indicated that the whole scale demonstrates acceptable reliability. The Cronbach’s α coefficients for the three extracted factors were 0.795, 0.707, and 0.791, respectively.
The Pearson correlation coefficient between the two sets of responses was 0.564 (p < 0.01), indicating a moderate degree of stability within the scale. This suggests that the RPSACL is not only reliable but also stable over time, reinforcing its utility in measuring risk perception.
3.8 Convergent validity and discriminant validity
To assess the convergent validity of the dimensions within the scale, both the composite reliability (CR) value and the square root of average variance extracted (SAVE) value were calculated. The result indicated that the AVE for each dimension was greater than the correlation values with other factors (Table 10). This finding suggests that each dimension not only demonstrates good convergent validity—indicating that the items within each dimension are measuring the same underlying construct—but also shows strong discriminant validity, as the dimensions are sufficiently distinct from one another. Overall, these results support the robustness and validity of the scale in measuring the intended constructs.
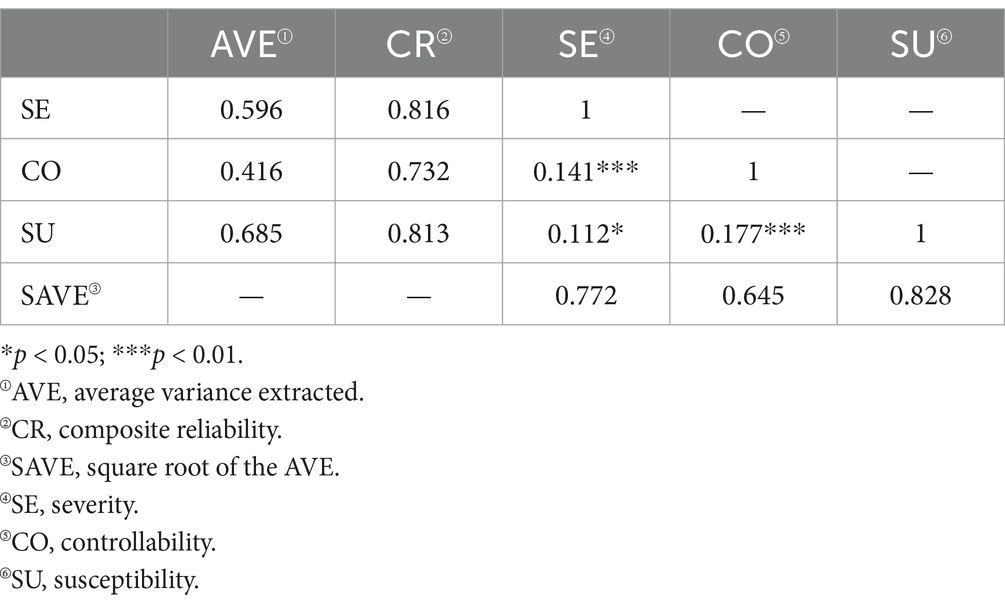
Table 10. The convergent validity and discriminant validity (sample 2, n = 120).
3.9 Further improvement of the scale structure
Given the suboptimal fit of the confirmatory factor analysis model, we systematically explored multiple approaches to resolve this limitation. According to Kyriazos’ research (44), we contributed it to insufficient sample size. To rectify this, we collected an additional 100 samples from August to September 2024. Subsequently, we merged newly collected samples with those from the previous CFA, resulting in a total of 220 samples. We then re-executed the CFA, which significantly improved model fit: χ2/DF (220) = 2.998, with a Normed Fit Index (NFI) of 0.913, an Incremental Fit Index (IFI) of 0.940, a Comparative Fit Index (CFI) of 0.939, and a Root Mean Square Error of Approximation (RMSEA) of 0.096 (Figure 3). These results indicate the model fit is now acceptable.
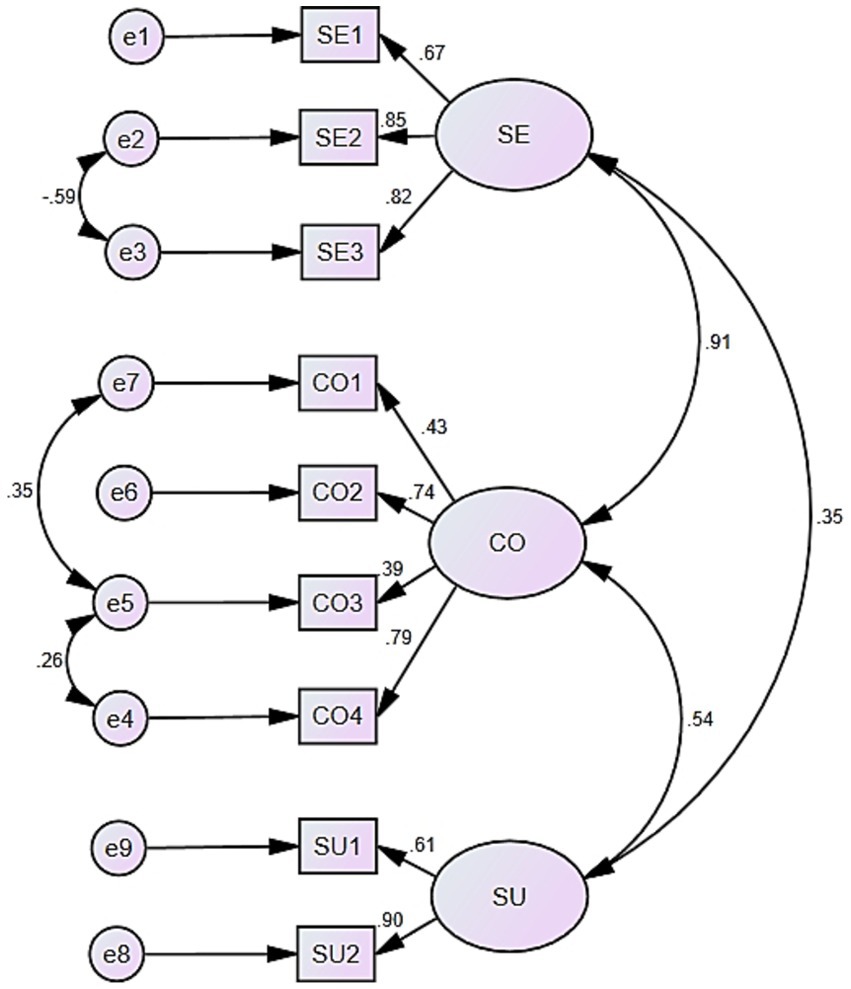
Figure 3. Three—factor confirmatory factor analysis model with larger sample size. SE, severity; CO, controllability; SU, susceptibility.
4 Discussion and implications
RPSACL, aiming to measure risk perception of infection of care recipients, is shown to have adequate psychometric properties to apply to caregivers. Moreover, there is no existing instrument available that has the same characteristics as the RPSACL. Caregivers’ perception of risk can directly influence their coping behaviors, which in turn affect the health of older adults during ARIs outbreaks (17). Thus, understanding and measuring caregivers’ risk perception through tools like the RPSACL is vital for enhancing protective measures and safeguarding the health of older adults in these vulnerable settings.
This study represents an innovative explorations of risk management within long—term care facilities, focusing specifically on caregivers who support vulnerable populations with limited self-care capabilities. Protective behaviors exhibited by caregivers are essential in preventing the spread of ARIs within LTCFs. Previous research showed the significance of risk perception in promoting caregivers’ protective behaviors (45), highlighting its critical role in the prevention of ARI transmission. Through the integration of risk perception with the role and responsibilities of caregivers, the research enriches both the conceptual understanding and practical application of risk perception in this context.
Despite a number of related ARI risk perception scales developed, such as the Pandemic Risk Perception Scale (PRPS) (46), the public health emergency risk perception scale (PHERPS) (47), and the Questionnaire on Perception, Risk, Coping, Knowledge, COVID-19 (PRCK-COVID-19) (48), none of these instruments adequately address the specific needs of measuring the risk perception among caregivers in LTCFs. These existing scales primarily focus on the potential risks encountered by the general public in common public settings and their coping intentions, rather than the unique context in which caregivers operate. Caregivers in LTCFs face unique challenges. Given their work environments and the needs of care recipients, risk perception assessment must be tailored to them. There is a need for an assessment tool that accurately reflects caregivers’ risk perceptions and protective intentions. In LTCFs, caregivers must manage their own risks and proactively reduce infection risks for care recipients. This dual responsibility underscores the importance of acknowledging protective intentions in risk assessment. The lack of attention to these factors in existing scales hinders the ability to conduct targeted assessments that are crucial for developing effective risk management strategies tailored to the needs of caregivers and the vulnerable populations they serve.
Moreover, the study provides new insights into understanding and addressing public health risks within LTCFs. Notably, it addresses a significant gap in the existing literature by developing a specialized risk perception scale tailored specifically for caregivers, as current assessment instruments have not adequately met this need. Utilizing a rigorous psychometric methodology, the newly established scale facilitates a comprehensive evaluation of caregivers’ perceptions regarding ARI risks confronted by care recipients. By providing LTCFs with this essential tool, the research equips LTCFs with a critical tool for implementing more refined and effective risk management strategies, ultimately enhancing the safety and well-being of older adults in these care settings.
Based on previous studies about risk perception and Delph method, this study specifically addresses the particular context of caregiver in LTCFs and developed RPSACL. This scale aims to accurately assess caregivers’ perceptions of risk related to acute respiratory infections (ARIs) by integrating elements of their work responsibilities and explicitly defining the concept of risk perception within this population. To ensure the scale’s robustness and validity, a systemic development and evaluation process was undertaken, which included item analysis, exploratory factor analysis, confirmatory factor analysis, reliability test, and construct validity. This comprehensive approach utilized data collected from caregivers employed in LTCFs, ultimately contributing to a more nuanced understanding of risk perception in this critical workforce and providing a valuable tool for enhancing infection control measures in these settings.
This study employed small group analysis for item analysis, revealing a significant correlation between the high and low score group, which justified the retention of all items. Following the establishment of criteria for factor analysis, an exploratory factor analysis (EFA) was conducted carried out involving maximum variance method. The EFA results indicated that the identified factors accounted for 68.366% of the variance in the data, suggesting acceptable interpretability of the sample. Specifically, item No.7, which states that “older adults are more likely to contract acute respiratory infections disease than other age groups,” was assigned to factor 2 based on the EFA findings. After extensive discussions with the expert panel and careful consideration, we decided to align with the EFA results and reposition item No.7 within the second dimension. As a result, the revised scale, consisting of three dimensions and nine items, which were subsequently used for further evaluation. Drawing from a comprehensive literature review, leveraging specialized professional expertise, and incorporating suggestions from the expert panel, we identified three factors: severity, controllability, and susceptibility, respectively (47, 49).
After necessary modification, the final scale contains nine items and three dimensions (Table 11). The dimension of severity includes three items. This dimension assesses caregivers’ perceptions regarding the potential consequences of ARI spread in LTCFs (50). The dimension of controllability containing four items aims to evaluate individuals’ perceptions of the LTCF’s capacity to manage and control ARI outbreaks (51), which is an important influencing factor of risk perception (52). Lastly, the dimension of susceptibility includes two items. These items assess caregivers’ preliminary judgments regarding the likelihood of older adults contracting ARIs within LTCFs.
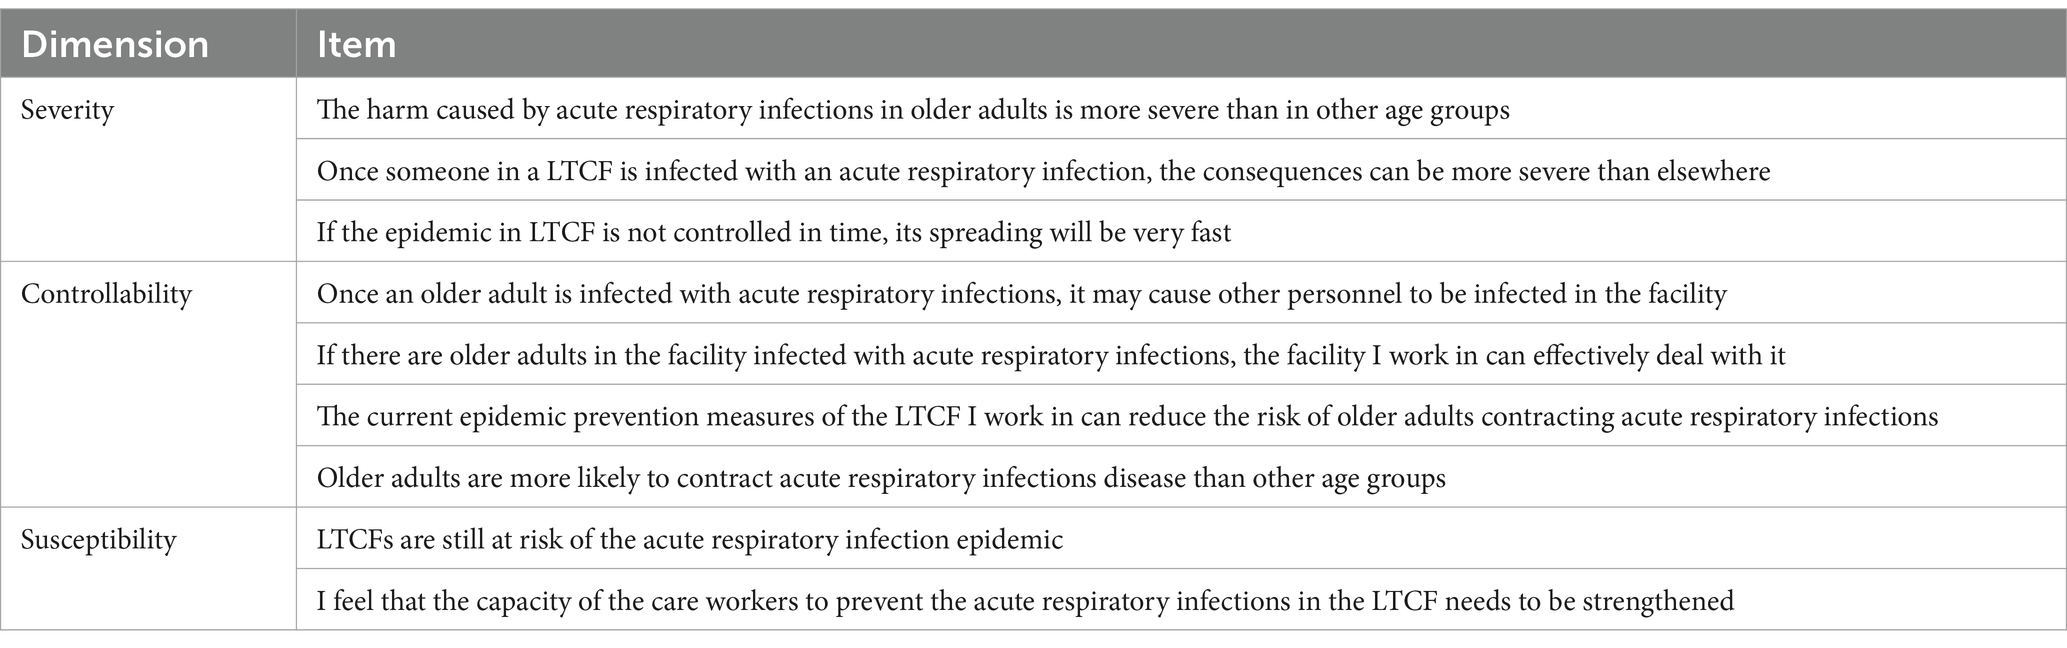
Table 11. The risk perception scale on acute respiratory infections for caregivers in long-term care facilities.
This study conducted CFA to evaluate the scale. The model revealed that the overall model fit could be improved, as the RMSEA value exceeds the commonly accepted threshold of 0.10 (36). To improve the model fit, we tried to find out the main causes and contributed it to be insufficient sample size (44). Then, we procured an additional 100 responses. Integrating these with the previously gathered 120, we amassed a total of 220. All the questionnaires underwent CFA in a unified dataset. Eventually, the model fit got significantly improved with lager sample size. Additionally, The Cronbach’s α coefficients of three dimensions and the overall scale exceed 0.7, suggesting that each factor and the overall scale exhibit a satisfactory level of internal consistency (20). Moreover, the RPSACL showed moderate stability, and it also showed good convergent and discriminant validity between each dimension in scale evaluation.
In the context of global aging, long-term care facilities (LTCFs) are increasingly diverse, encompassing various cultural regions with distinct caregivers and care recipients. When applying measurement scales, cross-cultural adaptability becomes essential. The RPSACL scale utilized in this study is derived from data collected from nursing staff in Chinese LTCFs; however, future research should aim to extend its applicability across different cultural contexts. Cultural differences significantly impact how individuals perceive disease severity, controllability, and susceptibility. For example, in collectivist cultures, nurses may be more inclined to depend on institutional support. While in individualist cultures, there may be a greater emphasis on personal coping strategies. To assess the RPSACL scale’s cross-cultural applicability, we need to gather data from nurses of diverse cultural backgrounds, considering regional nursing practices, cultural norms, and disease perspectives. By comparing data across different cultural groups, researchers can evaluate the scale’s reliability and validity, allowing for necessary adjustments to ensure accurate measurement of acute respiratory infection (ARI) risk perception among nurses from diverse cultural settings. This approach will not only enhance the scale’s utility but also contribute to a more comprehensive understanding of ARI risk perception in the global context of long-term care.
In prospective application scenarios, managers of long-term care facilities could consider implementing the following strategies to incorporate the RPSACL scale into their risk management frameworks. First, regularly use the scale to assess nurses’ ARI risk perception. Design targeted training for those with low risk perception. For those with high risk perception but possess inadequate coping skills, specialized skill—enhancement programs should be offered to improve their ability to manage these risks effectively. Secondly, the assessment results should be comprehensively integrated into daily management processes. This includes optimizing infection prevention and control measures, rationally adjusting staff allocation, material stockpiling strategies, and work procedures in accordance with the assessment findings. Additionally, an efficient feedback mechanism should be established to continuously monitor the evaluation outcomes, thereby enabling the timely adaptation of management strategies. By implementing these measures, it is anticipated that the LTCFs will achieve a significant improvement in ARI prevention and control efficacy, thereby effectively safeguarding the health and safety of care recipients.
5 Limitations
Nevertheless, this study has several limitations. The RPSACL scale has primarily been employed as a preliminary measurement tool for managers to assess caregivers’ risk perceptions of acute respiratory infections (ARIs) within long-term care facilities (LTCFs), rather than serving as a comprehensive evaluation approach. Additionally, due to cultural differences across various countries and regions, the RPSACL is currently applicable to caregivers in Mainland China. Therefore, further studies are necessary to determine its validity and reliability in different cultural contexts. Future research should focus on testing the scale in a larger and more diverse population to assess its cross-cultural applicability and make any necessary adjustments to ensure it accurately reflects the risk perceptions of caregivers in other countries or regions. This will help to establish a more robust understanding of ARI risk perception globally and enhance the effectiveness of risk management strategies in LTCFs worldwide.
6 Conclusion
This study developed and validated a risk perception scale tailored for caregivers in LTCFs through a systematic process. The risk perception of caregivers in older adult care institutions encompasses three dimensions: severity, controllability, and susceptibility. It demonstrates that the RPSACL exhibits strong reliability and validity. Managers of LTCFs can utilize this scale to regularly assess and gain insights into the risk perception levels of their caregivers, enabling them to refine and develop strategies for epidemic prevention and formulate targeted employee training programs. Moreover, researchers can leverage this scale to investigate the risk perception status of caregivers in specific regions or during particular timeframes within LTCFs, as well as to explore its interaction with caregiver behaviors. Ultimately, these efforts will contribute to preventing the spread of ARIs in LTCFs, enhancing the quality of care provided, and promoting the overall health of older adults.
Data availability statement
The raw data supporting the conclusions of this article will be made available by the authors, without undue reservation.
Ethics statement
The studies involving humans were approved by Ethics Committee on Biomedical Research, West China Hospital of Sichuan University. The studies were conducted in accordance with the local legislation and institutional requirements. The participants provided their written informed consent to participate in this study.
Author contributions
ZX: Conceptualization, Data curation, Formal analysis, Investigation, Methodology, Project administration, Visualization, Writing – original draft. JZ: Data curation, Formal analysis, Investigation, Methodology, Project administration, Visualization, Writing – original draft. XX: Conceptualization, Funding acquisition, Resources, Writing – review & editing. LH: Formal analysis, Methodology, Writing – review & editing. JR: Writing – review & editing. RM-P: Writing – review & editing. MQ: Writing – review & editing. FZ: Conceptualization, Funding acquisition, Methodology, Project administration, Resources, Validation, Visualization, Writing – review & editing.
Funding
The author(s) declare that financial support was received for the research and/or publication of this article. This research was supported by the National Natural Science Foundation of China (grant nos. 71871147 and 72271172), Science and Technology Department of Sichuan Province Project (grant no. 2024YFFK0128), and the Humanities and Social Science Fund of Ministry of Education of China (grant No. 21YJC630142).
Acknowledgments
We would thank all the experts in our expert panel and all the caregivers from LTCFs who fill out questionnaires.
Conflict of interest
The authors declare that the research was conducted in the absence of any commercial or financial relationships that could be construed as a potential conflict of interest.
Generative AI statement
The authors declare that no Gen AI was used in the creation of this manuscript.
Publisher’s note
All claims expressed in this article are solely those of the authors and do not necessarily represent those of their affiliated organizations, or those of the publisher, the editors and the reviewers. Any product that may be evaluated in this article, or claim that may be made by its manufacturer, is not guaranteed or endorsed by the publisher.
Supplementary material
The Supplementary material for this article can be found online at: https://www.frontiersin.org/articles/10.3389/fpubh.2025.1527905/full#supplementary-material
Footnotes
1. ^www.wjx.cn
References
1. GBD 2019 Diseases and Injuries Collaborators. Global burden of 369 diseases and injuries in 204 countries and territories, 1990-2019: a systematic analysis for the global burden of disease study 2019. Lancet. (2020) 396:1204–22. doi: 10.1016/S0140-6736(20)30925-9
2. Dube, K, Nhamo, G, and Chikodzi, D. Covid-19 cripples global restaurant and hospitality industry. Curr Issue Tour. (2021) 24:1487–90. doi: 10.1080/13683500.2020.1773416
3. Weinberger, DM, Chen, J, Cohen, T, Crawford, FW, Mostashari, F, Olson, D, et al. Estimation of excess deaths associated with the Covid-19 pandemic in the United States, March to May 2020. JAMA Intern Med. (2020) 180:1336–44. doi: 10.1001/jamainternmed.2020.3391
4. IHME. Gbd 2019 cause and risk summary: [respiratory infections and tuberculosis]. Seattle: IHME (2020).
5. WHO. (2024). Confirmed CovlD-19 deaths by age Available online at: https://app.powerbi.com/view?r=eyJrIjoiY2UyNmQ0mwqtYjdizc00MmIylwi5YmYtZmRizwjkzdcymdmwIiwidci6ImY2mtbjmgi3lwjkMjQtngizos04mtbiltnkYzI4mgfmYjU5mcisImMiOjh9 (Accessed August 19, 2024).
6. Chen, N, Zhou, M, Dong, X, Qu, J, Gong, F, Han, Y, et al. Epidemiological and clinical characteristics of 99 cases of 2019 novel coronavirus pneumonia in Wuhan, China: a descriptive study. Lancet. (2020) 395:507–13. doi: 10.1016/S0140-6736(20)30211-7
7. Chen, Y, Klein, SL, Garibaldi, BT, Li, H, Wu, C, Osevala, NM, et al. Aging in Covid-19: vulnerability, immunity and intervention. Ageing Res Rev. (2021) 65:101205. doi: 10.1016/j.arr.2020.101205
8. Jordan, RE, Adab, P, and Cheng, KK. Covid-19: risk factors for severe disease and death. BMJ. (2020) 368:m1198–8. doi: 10.1136/bmj.m1198
9. Liu, D, Cui, P, Zeng, S, Wang, S, Feng, X, Xu, S, et al. Risk factors for developing into critical Covid-19 patients in Wuhan, China: a multicenter, retrospective, cohort study. Eclinicalmedicine. (2020) 25:100471. doi: 10.1016/j.eclinm.2020.100471
10. D'adamo, H, Yoshikawa, T, and Ouslander, JG. Coronavirus disease 2019 in geriatrics and long-term care: the Abcds of Covid-19. J Am Geriatr Soc. (2020) 68:912–7. doi: 10.1111/jgs.16445
11. Bauer, R. A. (1960). Consumer behavior as risk taking. In: R.S. Hancock, editor. Dynamic Marketing for a Changing World, Proceedings of the 43rd. Conference of the American Marketing Association, 389–398.
12. Baek, J, Kim, KH, and Choi, JW. Determinants of adherence to personal preventive behaviours based on the health belief model: a cross-sectional study in South Korea during the initial stage of the Covid-19 pandemic. BMC Public Health. (2022) 22:944. doi: 10.1186/s12889-022-13355-x
13. Hareru, HE, Mamo, TT, Abebe, M, and Debela, BG. Health-promoting behavior and its determinants towards non-communicable diseases among adult residents of the Gedeo zone, South Ethiopia: the application of the health belief model. Front Public Health. (2024) 12:1453281. doi: 10.3389/fpubh.2024.1453281
14. Wang, K, Liu, C, Yang, X, and Wang, Y. Health risk perception and exercise intention of college students: a moderated mediation model of health anxiety and lay theories of health. Front Psychol. (2024) 15:1375073. doi: 10.3389/fpsyg.2024.1375073
15. Augeraud-Véron, E, and Leandri, M. Optimal self-protection and health risk perceptions: exploring connections between risk theory and the health belief model. Health Econ. (2024) 33:1565–83. doi: 10.1002/hec.4826
17. Majid, U, Wasim, A, Bakshi, S, and Truong, J. Knowledge, (mis-)conceptions, risk perception, and behavior change during pandemics: a scoping review of 149 studies. Public Underst Sci. (2020) 29:777–99. doi: 10.1177/0963662520963365
18. Ferrer, RA, and Klein, WMP. Risk perceptions and health behavior. Curr Opin Psychol. (2015) 5:85–9. doi: 10.1016/j.copsyc.2015.03.012
19. Michalsen, A. Risk assessment and perception. Inj Control Saf Promot. (2003) 10:201–4. doi: 10.1076/icsp.10.4.201.16782
20. Boateng, GO, Neilands, TB, Frongillo, EA, Melgar-Quiñonez, HR, and Young, SL. Best practices for developing and validating scales for health, social, and behavioral research: a primer. Front Public Health. (2018) 6:149. doi: 10.3389/fpubh.2018.00149
21. Cui, X, Hao, Y, Tang, S, and Al, E. Reliability and validity of a self-designed Covid-19 risk perception scale-a large online empirical study. Chin J Public Health. (2021) 37:1086–9. doi: 10.11847/zgggws1133952
22. De Bruin, WB. Age differences in Covid-19 risk perceptions and mental health: evidence from a National US Survey Conducted in March 2020. J Gerontol Series B Psychol Sci Soc Sci. (2021) 76:E24–9. doi: 10.1093/geronb/gbaa074
23. Kan, S, Hongxia, F, Jianming, J, Zhaoli, S, Jing, G, Xuefeng, C, et al. The risk perceptions of Sars and socio-psychological behaviors of urban people in China. Acta Psychol Sin. (2003) 35:546–54.
24. Liu, JT, Hammitt, JK, Wang, JD, and Tsou, MW. Valuation of the risk of SARS in Taiwan. Health Econ. (2005) 14:83–91. doi: 10.1002/hec.911
25. Xi Juzhe, SZ, and Kang, J. The Covid-19 risk perception scale construction and lts validity assessment. J Capit Norm Univ. (2020):131–41. doi: 10.3969/j.issn.1004-9142.2020.04.016
26. Xie Xiaofei, ZR, and Dongmei, X. Analysis on psychological panic phenomenon of Sars. Acta Sci Nat Univ Pekin. (2005) 41:628–39. doi: 10.3321/j.issn:0479-8023.2005.04.017
27. Zenker, S, Braun, E, and Gyimóthy, S. Too afraid to travel? Development of a pandemic (Covid-19) anxiety travel scale (PATS). Tour Manag. (2021) 84:104286. doi: 10.1016/j.tourman.2021.104286
28. Ding Jin-Fei, TL-F, Zai-Xiang, T, and Yue-Ping, S. Delphi method in public health: a review of its application and Prospect. J Environ Occup Med. (2012) 29:727–30. doi: 10.13213/j.cnki.jeom.2012.11.011
29. Zhang Xinwei, CG, Zhimin, X, Zhaoyun, C, Yinling, Z, and Baohua, C. Formation of risk perception questionnaire for nurses. Chin Nurs Res. (2016) 30:2353–5. doi: 10.3969/j.issn.1009-6493.2016.19.012
30. Keeney, S., Hasson, F., and Mckenna, H. P. The Delphi technique in nursing and Health Research. (2011) Wiley-Blackwell.
32. Chen, P-Y, Ho, W-C, Lo, C, and Yeh, T-P. The Chinese inventory of psychosocial balance short-form questionnaire for the older adults: validity and reliability study. Front Psychol. (2022) 13:799967. doi: 10.3389/fpsyg.2022.799967
33. Fatricia, RS, Daryanto, A, and Sutanto, J. Developing and validating a scale for anxiety over land and forest fire. Int J Disast Risk Reduct. (2023) 95:103850. doi: 10.1016/j.ijdrr.2023.103850
34. Brown, T, and Onsman, A. Exploratory factor analysis: a five-step guide for novices. Austr J Paramed. (2010) 8:1–13. doi: 10.33151/ajp.8.3.93
35. Tay, L, and Drasgow, F. Adjusting the adjusted χ2/df ratio statistic for dichotomous item response theory analyses: does the model fit? Educ Psychol Meas. (2012) 72:510–28. doi: 10.1177/0013164411416976
36. Gu, Y, Wang, L, Lyu, S, Dong, J, Liu, B, and Wang, X. Assessing potential driving factors of the ecosystem service value of mariculture shellfish in China using a structural equation modeling approach. Front Mar Sci. (2023) 10:1232211. doi: 10.3389/fmars.2023.1232211
37. Taber, KS. The use of Cronbach’s alpha when developing and reporting research instruments in science education. Res Sci Educ. (2018) 48:1273–96. doi: 10.1007/s11165-016-9602-2
38. Chen, W, Shao, K, Xiao, Q, and Mai, Y. Development and validation of Chinese college students' future employability scale. Front Psychol. (2023) 14:1063437. doi: 10.3389/fpsyg.2023.1063437
39. Cheung, GW, Cooper-Thomas, HD, Lau, RS, and Wang, LC. Reporting reliability, convergent and discriminant validity with structural equation modeling: a review and best-practice recommendations. Asia Pac J Manag. (2024) 41:745–83. doi: 10.1007/s10490-023-09871-y
40. Baumgartner, H, and Steenkamp, J-BEM. Response styles in marketing research: a cross-national investigation. J Mark Res. (2001) 38:143–56. doi: 10.1509/jmkr.38.2.143.18840
41. Podsakoff, PM, Mackenzie, SB, Lee, JY, and Podsakoff, NP. Common method biases in behavioral research: a critical review of the literature and recommended remedies. J Appl Psychol. (2003) 88:879–903. doi: 10.1037/0021-9010.88.5.879
42. Curran, PG. Methods for the detection of carelessly invalid responses in survey data. J Exp Soc Psychol. (2016) 66:4–19. doi: 10.1016/j.jesp.2015.07.006
43. Mao, X, Loke, AY, and Hu, X. Developing a tool for measuring the disaster resilience of healthcare rescuers: a modified Delphi study. Scand J Trauma Resusc Emerg Med. (2020) 28:4. doi: 10.1186/s13049-020-0700-9
44. Kyriazos, T. Applied psychometrics: sample size and sample power considerations in factor analysis (EFA, CFA) and SEM in general. Psychology. (2018) 9:2207–30. doi: 10.4236/psych.2018.98126
45. Qin, C, Wang, R, Tao, L, Liu, M, and Liu, J. Association between risk perception and acceptance for a booster dose of Covid-19 vaccine to children among child caregivers in China. Front Public Health. (2022) 10:834572. doi: 10.3389/fpubh.2022.834572
46. Vieira, KM, Grigion Potrich, AC, Bressan, AA, Klein, LL, Diniz Pereira, BA, and Machado Pinto, NG. A pandemic risk perception scale. Risk Anal. (2022) 42:69–84. doi: 10.1111/risa.13802
47. Shen, Z, Zhong, Z, Xie, J, Ding, S, Li, S, and Li, C. Development and psychometric assessment of the public health emergency risk perception scale: under the outbreak of Covid-19. Int J Nurs Sci. (2021) 8:87–94. doi: 10.1016/j.ijnss.2020.12.012
48. González-López, JR, Serrano-Gómez, D, Velasco-González, V, Alconero-Camarero, AR, Cuesta-Lozano, D, García-García, E, et al. Design and validation of a questionnaire on risk perception, coping behaviors and preventive knowledge against Covid-19 among nursing students. J Pers Med. (2022) 12:515. doi: 10.3390/jpm12040515
49. Man, SS, Chan, AHS, and Alabdulkarim, S. Quantification of risk perception: development and validation of the construction worker risk perception (CoWorp) scale. J Saf Res. (2019) 71:25–39. doi: 10.1016/j.jsr.2019.09.009
50. Zhang, W, Sun, Z, Wang, J, and Wu, Y. Development and validation of the sarcopenia disease risk perception scale for older adults. BMC Geriatr. (2024) 24:876. doi: 10.1186/s12877-024-05487-z
51. Bai, L, Li, S, Zheng, M, Zhang, Z, and Gong, S. Consumer brand and category switching behaviors after food safety incidents: factors and mechanisms. Appetite. (2024) 195:107234. doi: 10.1016/j.appet.2024.107234
Keywords: risk perception, acute respiratory infection, caregiver, long-term care facility, scale development
Citation: Xie Z, Zhu J, Xie X, Huang L, Ren J, Martin-Payo R, Qiu M and Zhang F (2025) Development and validation of a risk perception scale on acute respiratory infections for caregivers in long-term care facilities. Front. Public Health. 13:1527905. doi: 10.3389/fpubh.2025.1527905
Edited by:
Federica Pulvirenti, Accademic Hospital Policlinico Umberto, ItalyReviewed by:
Xin Long Xu, Hunan Normal University, ChinaSudipto Roy, Indian Council of Medical Research (ICMR), India
Copyright © 2025 Xie, Zhu, Xie, Huang, Ren, Martin-Payo, Qiu and Zhang. This is an open-access article distributed under the terms of the Creative Commons Attribution License (CC BY). The use, distribution or reproduction in other forums is permitted, provided the original author(s) and the copyright owner(s) are credited and that the original publication in this journal is cited, in accordance with accepted academic practice. No use, distribution or reproduction is permitted which does not comply with these terms.
*Correspondence: Fengying Zhang, emhhbmdmZW5neWluZ0BzY3UuZWR1LmNu
†These authors have contributed equally to this work and share first authorship