 Shengxian Bi1
 Huawei Tan
 Dandan Guo
 Yingchun Chen
- 1School of Medicine and Health Management, Tongji Medical College, Huazhong University of Science and Technology, Wuhan, China
- 2College of Education for the Future, Beijing Normal University, Zhuhai, China
- 3Key Research Institute of Humanities & Social Sciences of Hubei Provincial Department of Education, Research Centre for Rural Health Service, Wuhan, China
Background: Satisfaction with healthcare security is a critical indicator of the effectiveness of health systems. Social equity and trust and the financial burden of healthcare are key socioeconomic factors that can significantly influence residents’ perceptions of healthcare security. This study aims to investigate the impact of social equity and trust and medical burden on satisfaction with healthcare security and to analyze their potential interaction mechanisms.
Methods: Using data from 7,052 participants in the 2021 China General Social Survey, this study employed machine learning methods, including neural networks (NN), random forests (RF), and logistic regression (LR), to predict and classify satisfaction with healthcare security. Additionally, causal inference techniques were applied to identify the key determinants and estimate their effects on satisfaction levels, thereby uncovering the underlying causal mechanisms.
Results: The predictive performance of the three machine learning methods was similar (p < 0.001). In the original models, the AUCs for LR, NN, and RF were 0.549, 0.563, and 0.534, respectively. After including factors related to social equity and trust, the AUCs for LR, NN, and RF improved to 0.633, 0.638, and 0.611, respectively. Among the three ML models, medical expenses and social equity and trust were identified as the most influential factors. Further causal analysis confirmed that higher levels of social equity and trust increased satisfaction with healthcare security, while a heavier medical burden reduced it. The analysis also revealed significant marginal effects, suggesting that the impact of social equity and trust varied across different levels.
Conclusion: This study highlights the complex relationship between social equity and trust, medical burden, and satisfaction with healthcare security, offering theoretical support for understanding residents’ perceptions of healthcare security in various social contexts.
1 Introduction
Satisfaction with healthcare security refers to individuals’ overall assessment of the adequacy of their health system’s ability to provide medical care, social health insurance coverage and quality of services. It reflects public approval of national health policies and serves as a key indicator of the success of government health policies (1). While it shares similarities with related concepts such as patient satisfaction or satisfaction with the quality of care, it differs in scope. Patient satisfaction typically focuses on specific interactions between patients and healthcare providers, whereas satisfaction with healthcare security encompasses a wider range of social factors, including the accessibility, affordability and equity of the healthcare system (2, 3). Furthermore, unlike health equity, which measures disparities in health outcomes and healthcare accessibility, satisfaction with healthcare security specifically assesses the extent to which individuals believe their healthcare security needs are met, considering both healthcare services and the supporting social systems (4). In China, the importance of this concept is particularly pronounced. Since 2009, the Chinese government has implemented a series of profound and systematic healthcare reforms aimed at achieving universal healthcare coverage and effectively reducing the financial burden of healthcare on the public (5). These reforms have not only facilitated the popularization and equalization of healthcare services, but have also played a crucial role in addressing challenges such as urban–rural disparities and regional development imbalances. Against this backdrop, satisfaction with healthcare security has become an important measure of the effectiveness of these reforms and provides a unique perspective for understanding the public’s true attitudes toward the healthcare system.
Recent studies of satisfaction with healthcare security have mainly used traditional statistical methods, such as linear or logistic regression, which typically assume linear relationships between variables (6). However, while this linear assumption simplifies the analysis, it fails to capture the complex non-linear relationships and interactions between variables, leading to significant limitations. For example, in studies of patient satisfaction, researchers often focus on socio-economic status and type of health insurance as primary variables, but tend to overlook the combined effects of factors such as living conditions and quality of health care services (7). As a result, these studies do not fully reflect the mechanisms underlying satisfaction. Moreover, in China’s complex social context, where principles of fairness and trust are of paramount importance, their causal relationship with satisfaction with healthcare security remains insufficiently examined (8). Although machine learning techniques have recently shown promise in addressing high-dimensional data and non-linear relationships in satisfaction research, their explanatory capacity is constrained by a limited integration with theoretical or qualitative analysis (9–11). Therefore, applying ensemble machine learning methods to investigate the causal mechanisms underlying satisfaction with healthcare security offers both theoretical and practical value.
Based on the above, this study uses high-dimensional data from the 2021 China General Social Survey (CGSS) and employs an ensemble machine learning (ML) approach that integrates neural networks, random forests, and logistic regression. This study examines the core factors influencing public satisfaction with China’s healthcare system. It focuses on the relative importance of medical burden, and social equity and trust. Additionally, through theoretical analysis, we explore the causal relationships underlying satisfaction with healthcare security.
The following research questions have been proposed to address these objectives:
(1) What are the key determinants of public satisfaction with healthcare security in China?
(2) How do medical burden, social equity and trust interact to shape public satisfaction with healthcare security?
(3) Can ensemble machine learning methods effectively capture and explain these relationships?
The following hypotheses are thus developed (12):
H1: Residents with similar medical conditions experience no significant differences in medical burden.
H2: Residents make rational assessments of their healthcare security status based on their personal circumstances.
H3: Residents’ satisfaction with healthcare security increases with perceived social equity and trust but decreases as medical burden rises.
This study contributes to the existing literature by integrating ensemble machine learning with theoretical analysis to establish causal relationships, thereby providing insights for improving public approval of China’s healthcare system.
2 Data and research methods
2.1 Data sources and preprocessing
2.1.1 Data sources
The CGSS, initiated by the Chinese Academy of Social Sciences, is a large-scale continuous sample survey and an authoritative data source for studying work and employment, family and social life, and residents’ social attitudes (13). Conducted in accordance with the ethical principles of the Declaration of Helsinki, the CGSS ensures the protection of participants’ rights and privacy throughout the data collection process. The 2021 CGSS adopted a longitudinal study design and used a multi-stage stratified sampling method to ensure the representativeness of the sample across different regions and populations. The survey covered 31 provinces in China, including 151 counties, 604 administrative villages, and more than 10,000 households. A total of 10,136 questionnaires were collected in 2021. After excluding responses with missing key variables, invalid responses, or those responses inconsistent with the research objectives, 7,052 valid participants were retained for analysis.
2.1.2 Data preprocessing
The outcome variable in this study is satisfaction with healthcare security, which refers to individuals’ overall evaluation of the healthcare services and social health insurance provided by the government (14). Respondents were asked, “How would you rate the medical security provided by the government to the people?” using a scale of 1 to 10, with the ratings reflecting their subjective perceptions of the adequacy and quality of healthcare coverage. While ‘medical security’ could also refer to aspects such as cybersecurity in healthcare (e.g., privacy), in this context it refers specifically to the provision of healthcare services and insurance. A score of 5 or below indicates dissatisfaction, while a score above 5 reflects satisfaction with the healthcare security system.
The four main categories of predictor variables are as follows:
(a) Living conditions: region (15), age (16), education level (17), household registration (18), job or occupation, personal income, insurance expenses and subsistence allowance (19).
(b) Insurance status: health insurance and critical illness insurance (20, 21).
(c) Medical services: medical institution, clinic distance, doctor appointment time, waiting time, medical expenses and medical level (22–25).
(d) Social equity and trust: trust in hospitals, fairness of medical treatment, and fairness of urban and rural rights (26, 27).
2.2 Research methods
2.2.1 LR
Logistic regression is a generalized linear model commonly used for classification tasks, especially when the outcome variable is binary or ordinal (28). In this study, we employed logistic regression to predict the probability of satisfaction with healthcare security based on the explanatory variables. The model maps the linear combination of inputs to a logistic function, producing a probability value between 0 and 1. The parameters of the model are estimated using maximum likelihood estimation, which provides interpretable insights into the relationship between each predictor variable and the outcome (29). Although logistic regression assumes a linear relationship between the log odds and the predictors, it serves as a baseline model for comparison with more complex machine learning methods, highlighting the added value of capturing non-linear relationships in the data.
2.2.2 NN
Artificial neural networks simulate the structure of biological neurons and typically consist of an input layer, one or more hidden layers, and an output layer (30, 31). In our study, the input layer receives data from the explanatory variables, including living conditions, insurance status, medical services, and social equity and trust. The hidden layers process these inputs through weighted links and activation functions, capturing the non-linear relationships between the predictors and the outcome. The output layer is responsible for predicting satisfaction with healthcare security. We used back-propagation (BP) neural networks, which learn the mapping relationships through forward signal propagation and adjust the network weights and thresholds through backward error propagation.
2.2.3 RF
The core principle of the random forest algorithm is to combine weak classifiers into a strong classifier by aggregating multiple decision trees, thereby improving the accuracy and robustness of predictions (32, 33). This algorithm constructs decision trees by repeatedly performing random sampling with replacement on the training data set. Each tree is built using a subset of the explanatory variables, including living conditions, insurance status, medical services, and social equity and trust. The final prediction is determined by the majority vote of all trees, ensuring a balanced consideration of the various factors influencing satisfaction with healthcare security. This method is particularly effective in dealing with high-dimensional data and evaluating the relative importance of variables.
2.2.4 Model evaluation
ML algorithms are typically evaluated using confusion matrices and model performance is assessed using the area under the receiver operating characteristic (ROC) curve (AUC) (34). The horizontal axis of the ROC curve represents the false positive (FP) rate, while the vertical axis represents the true positive (TP) rate. The true negative (TN) and false negative (FN) rates can also be derived from the curve. The combination of these four categories forms the test indicators for machine learning algorithms: accuracy, sensitivity, specificity, Youden’s index, positive predictive value (PPV), negative predictive value (NPV) and the balanced score (F1 score).
The values of the indicators range from 0 to 1, with a value close to 1 indicating a superior model prediction, and vice versa. Additionally, DeLong’s test is used to compare the performance of the ROC curves, with a p-value of less than 0.05 indicating a significant difference between the two curves (35).
The data were processed and analysed using Python 3.11, with missing values addressed, outliers (via the IQR method) identified, and inconsistencies resolved. Descriptive statistics were employed to summarize the key data characteristics. Chi-square tests were employed to explore associations between outcome and predictors. In addition, Python 3.11 was utilized for the development of ML models and the execution of DeLong’s test for the comparison of classifier performance. Statistical significance was assessed at a threshold of p < 0.05.
In addition to model evaluation, this study conducted a causal analysis of the key factors identified by machine learning. Based on the variable importance rankings from the LR, NN, and RF models, the most influential predictors of satisfaction with healthcare security were selected for further causal exploration (36). A mathematical schematic was developed using Microsoft Visio to illustrate the hypothesized causal relationships among key variables. By integrating empirical results with a structured causal framework, this approach enhances both the explanatory power and practical relevance of the findings.
3 Results
3.1 Characteristics of participants
Table 1 shows the analysis of the CGSS dataset, which includes 7,052 participants, 5,038 of whom expressed satisfaction with their healthcare security. A positive correlation was identified between the predictor variables and satisfaction with healthcare security. Specifically, higher levels of education and income, greater health insurance compensation, easier access to medical care, greater confidence in social equity and trust, and higher satisfaction with healthcare security were all associated. With the exception of medical institutions, the effects of all other variables on satisfaction with healthcare security were statistically significant (p < 0.05). Detailed descriptive statistics are provided in Supplementary Table 1.
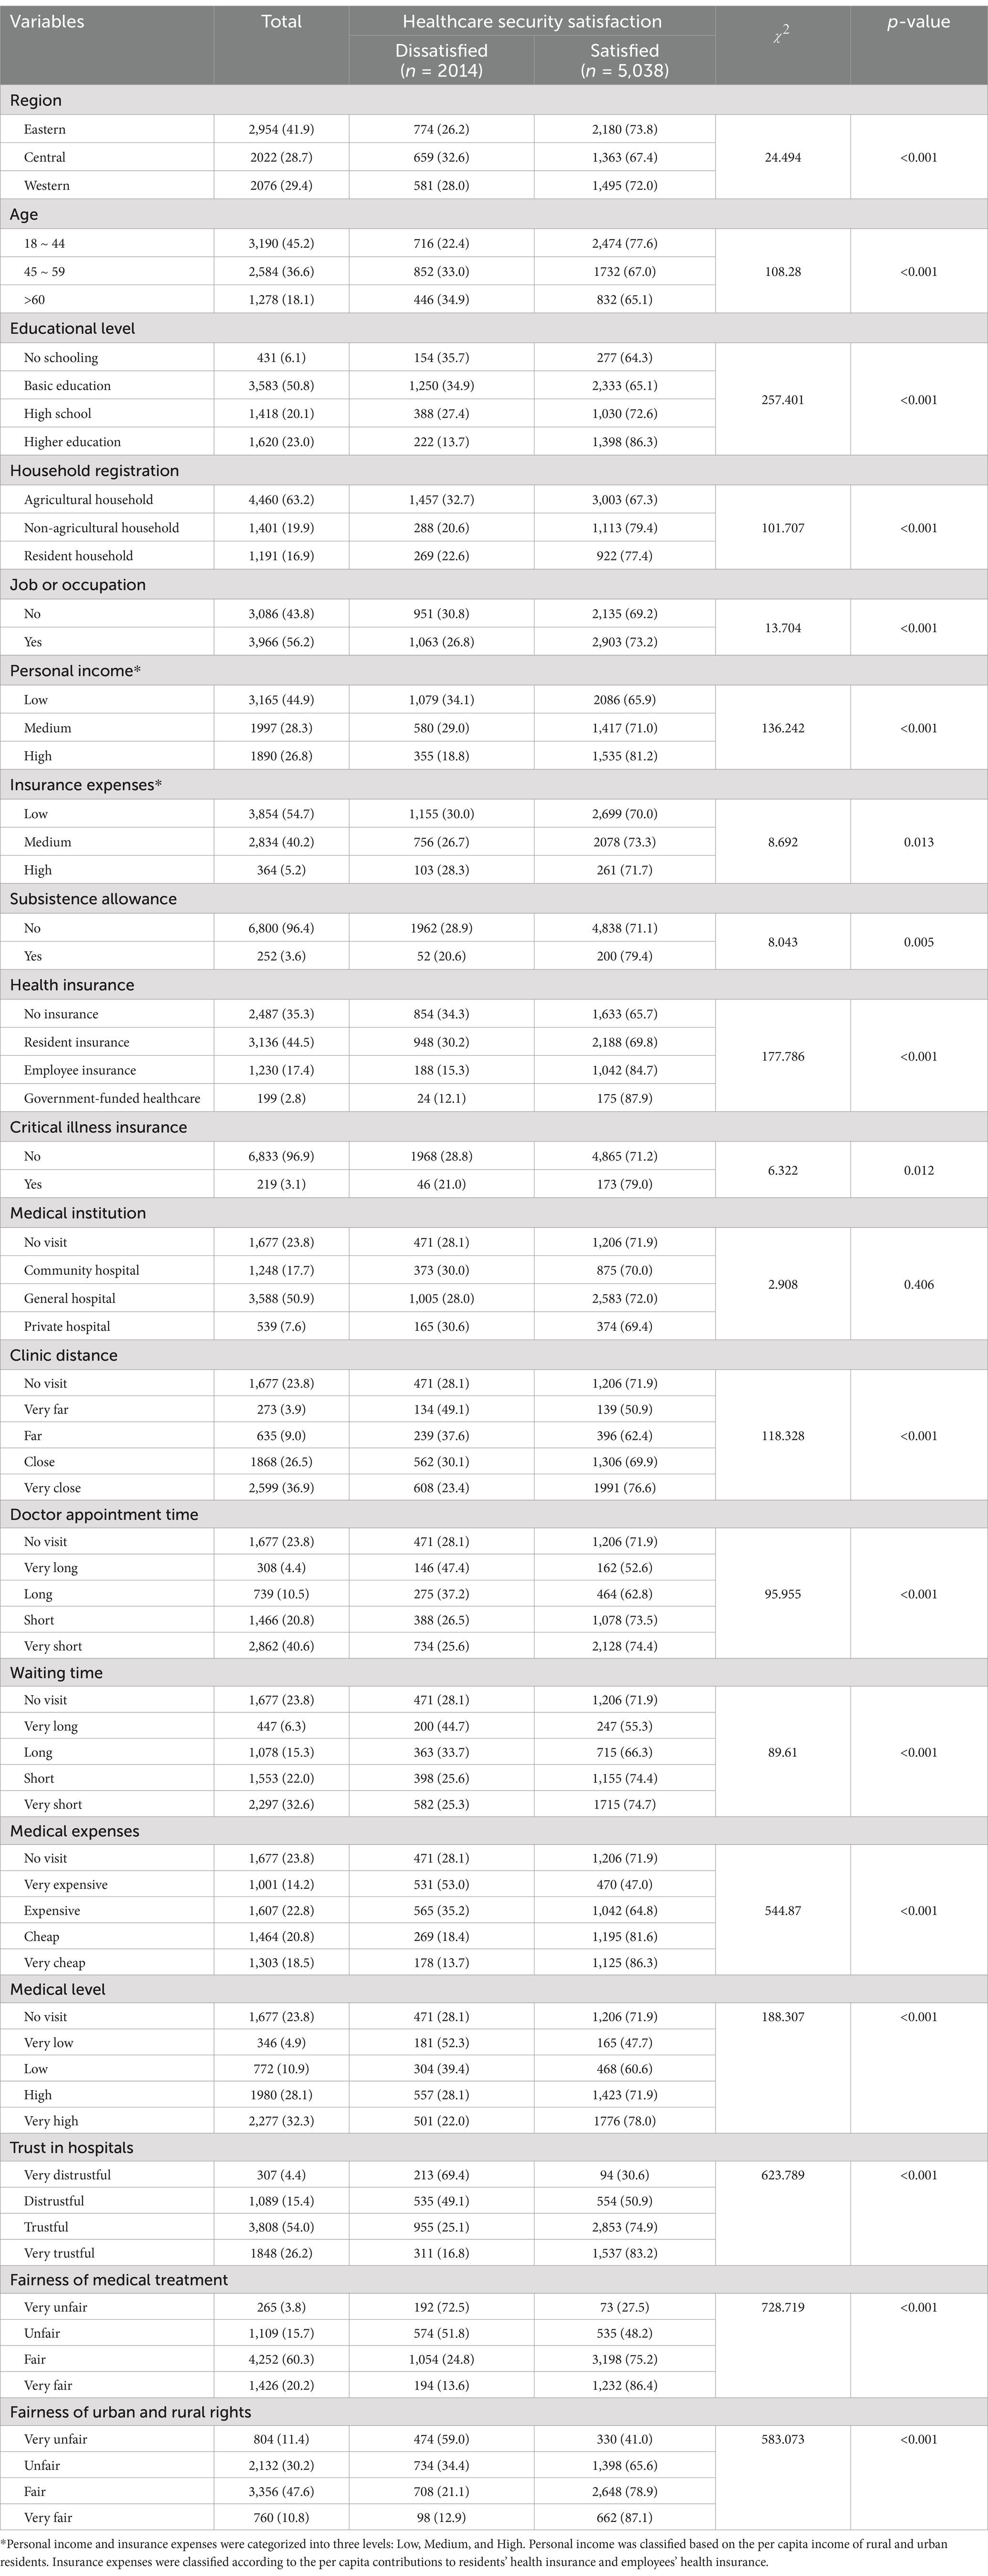
Table 1. Characteristics of satisfaction with healthcare security.
3.2 Prediction results of ML
Table 2 shows the predictive performance of three ML algorithms used to predict satisfaction with healthcare security. In the original model, which included living conditions, insurance status and medical services as predictor variables, the AUC was 0.549 for LR, 0.563 for NN and 0.534 for RF. After adding social equity and trust as additional predictor variables, the models were re-estimated, resulting in significant improvements in predictive performance. The AUC increased to 0.633 for LR, 0.638 for NN and 0.611 for RF. Accuracy, sensitivity, specificity, Youden’s index, PPV, NPV and F1 score all showed significant improvement. DeLong’s test showed no significant differences in predictive performance between NN, RF and LR (p < 0.001), underscoring their robustness across diverse predictive frameworks.
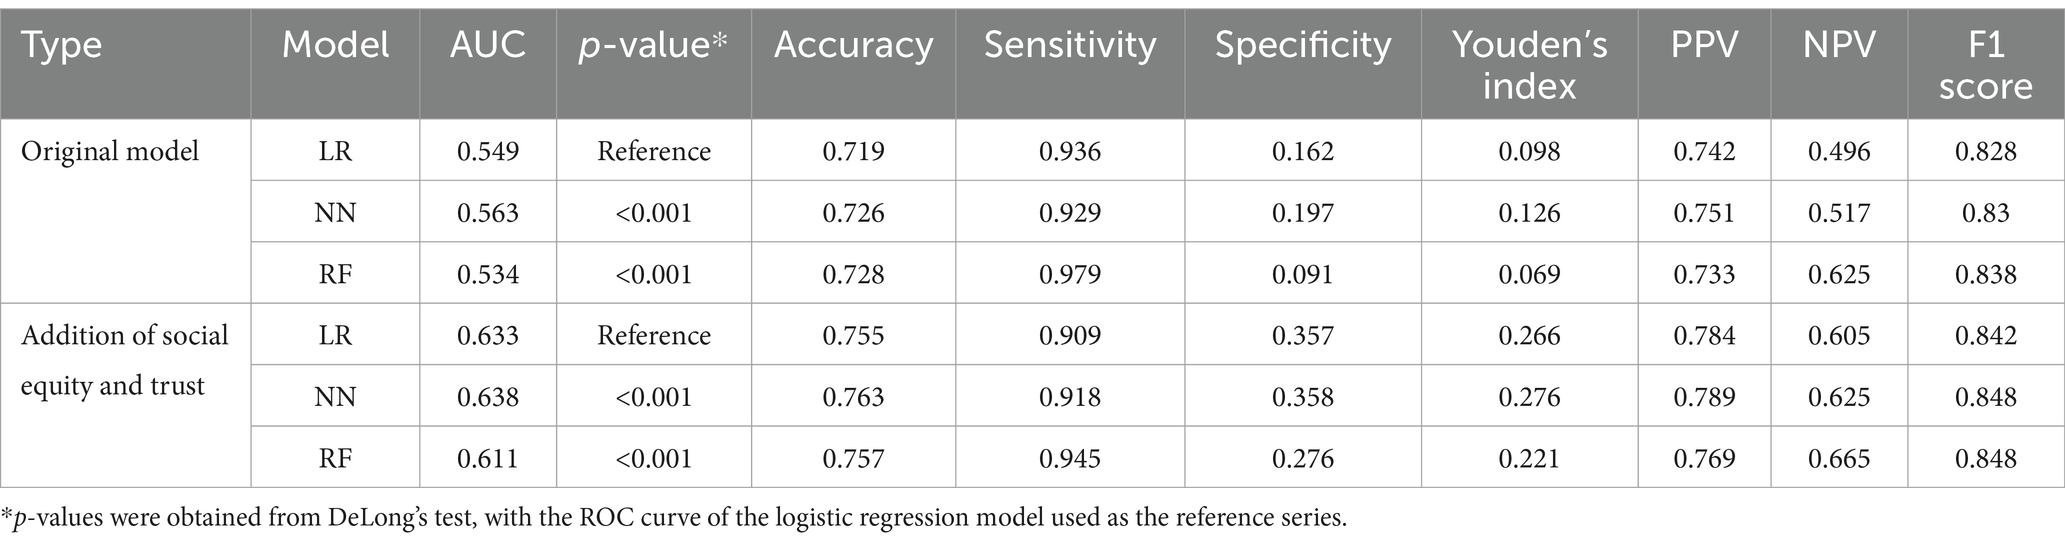
Table 2. Performance metrics of ML.
3.3 Variable contribution analysis
Figures 1, 2 show the contributions of predictors in the original and enhanced models, respectively. Figures 1a–c present the variable contributions for LR, NN, and RF in the original model. In this model, medical expense was the most significant predictor in all three models, followed by clinic distance and doctor appointment time. Following the incorporation of social equity and trust as additional predictors, the models were re-estimated, as shown in Figures 2a–c. In the modified models, although medical expense remained the dominant factor in LR and RF, fairness of medical treatment and trust in hospitals became more prominent predictors. Notably, the relative importance of the predictors remained largely consistent across LR, NN and RF in both the original and modified models. This consistency suggests minimal heterogeneity in variable contributions across the different modeling approaches, further reinforcing the robustness of these predictors in explaining outcomes.
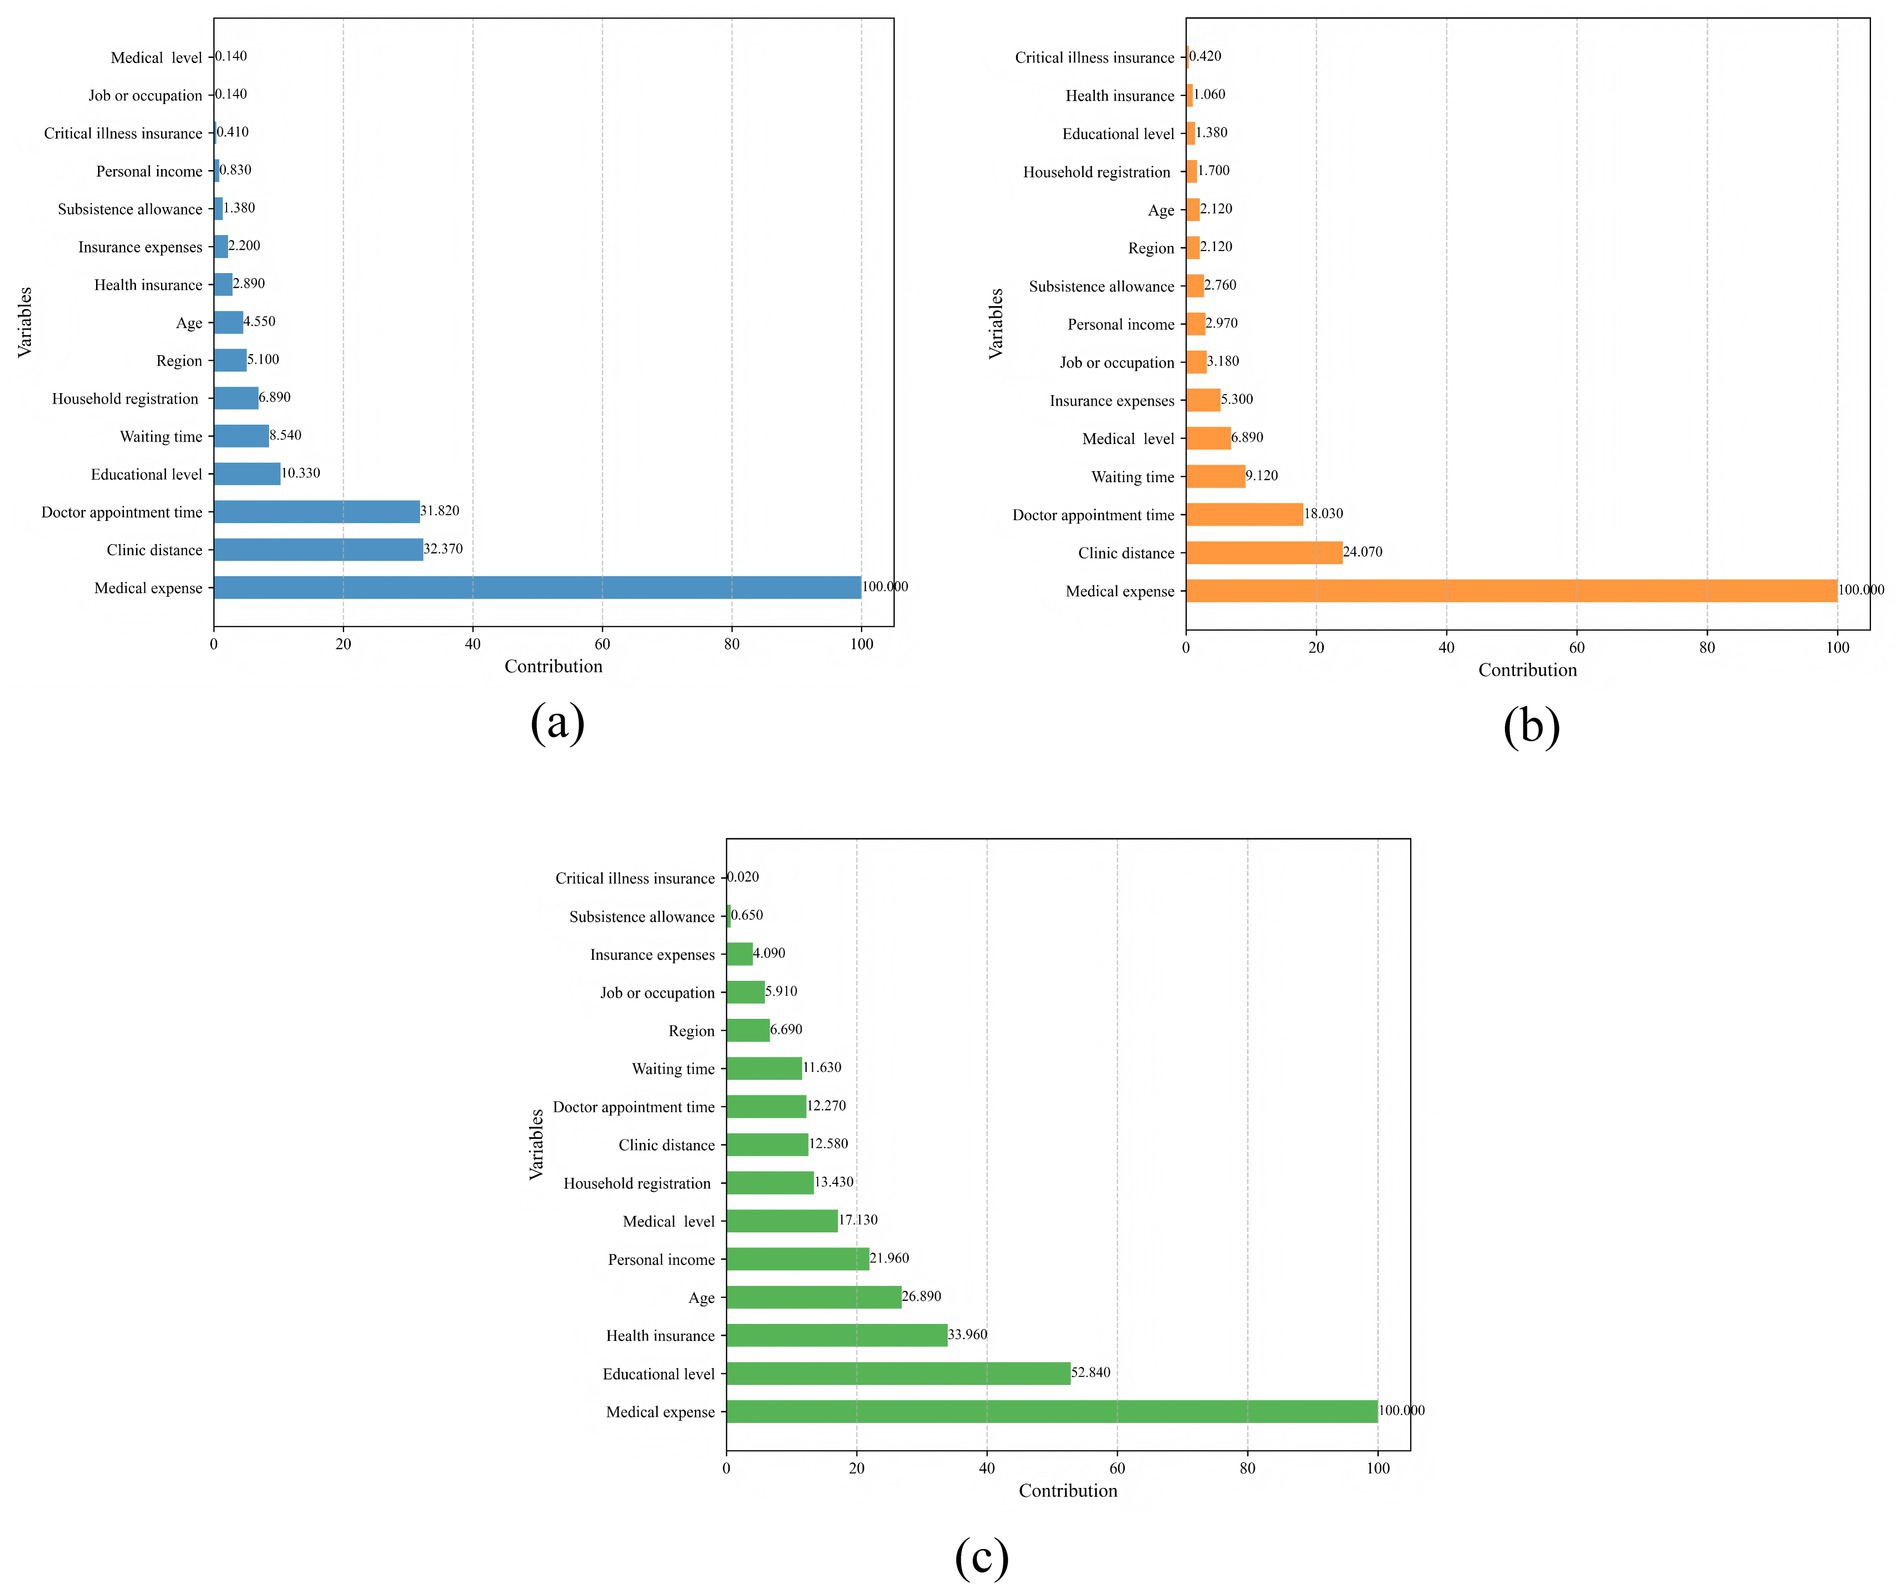
Figure 1. Variable contributions in original models. (a) LR; (b) NN; (c) RF.
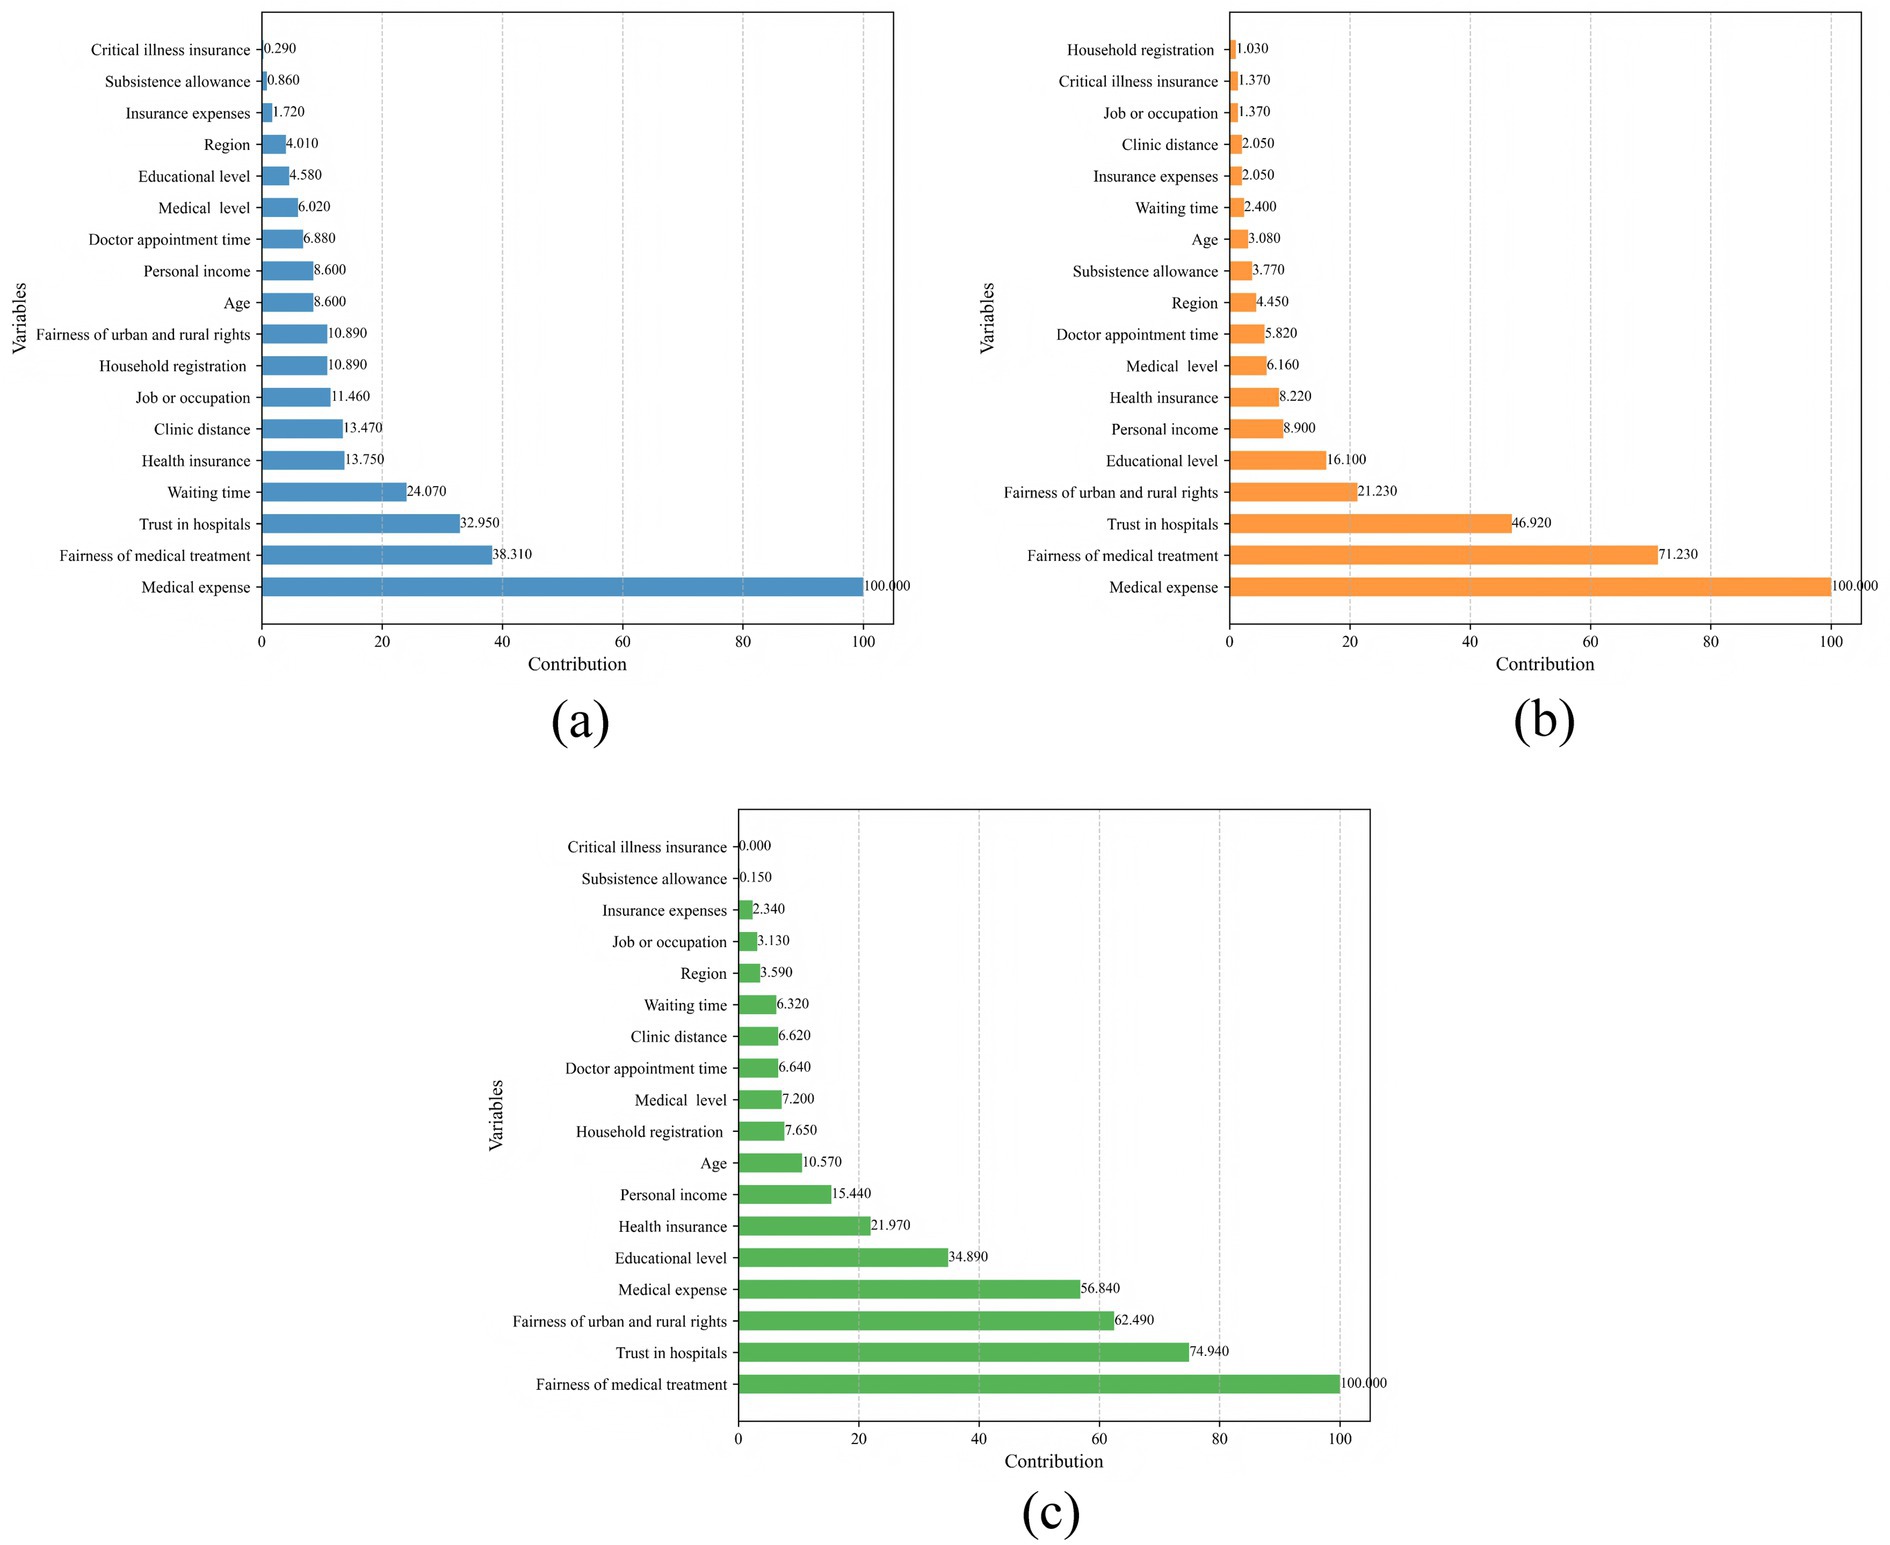
Figure 2. Variable contributions with social equity and trust. (a) LR; (b) NN; (c) RF.
4 The relationship between social equity and trust, medical burden and satisfaction with healthcare security
The ML algorithms identified that social equity and trust and medical expenses were the primary factors influencing participants’ satisfaction with healthcare security. In this section, we present a theoretical framework for understanding healthcare security satisfaction from a social equity and trust perspective. First, we describe the mechanism by which a single factor - social equity and trust - affects satisfaction with health security, as shown in Figure 3. In this figure, the horizontal axis represents the level of social equity and trust, while the vertical axis represents healthcare security satisfaction.
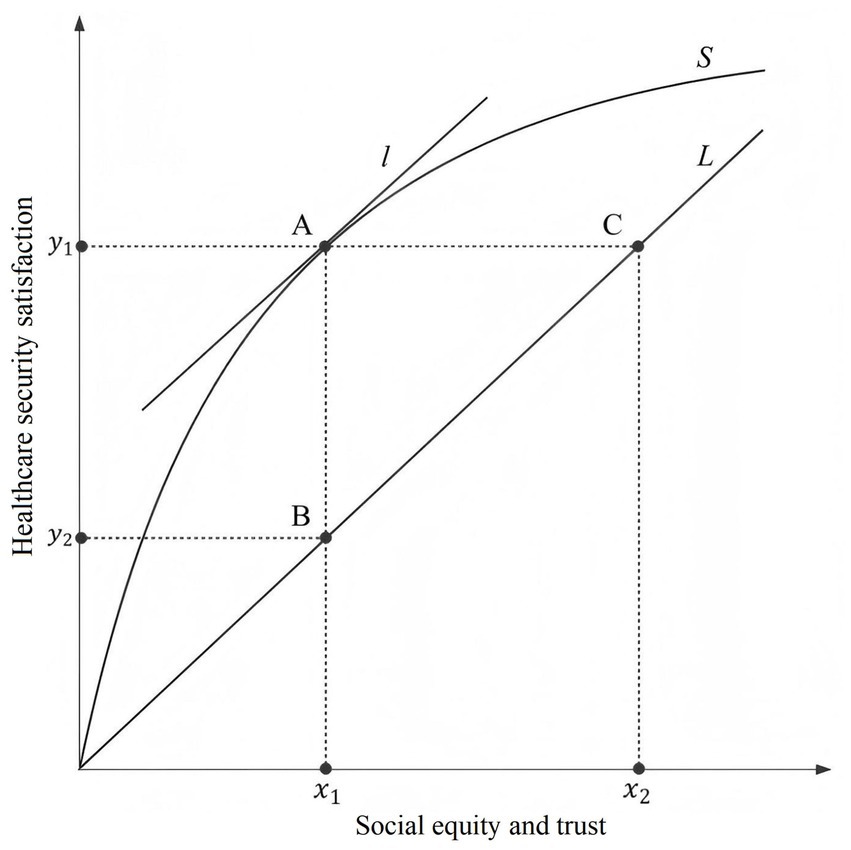
Figure 3. Schematic of function between social equity and trust and healthcare security satisfaction.
Ideally, satisfaction with healthcare security is a linear function of social equity and trust, represented by the ideal straight line L in the schematic. However, both satisfaction with healthcare security and social equity and trust are shaped by residents’ subjective feelings and influenced by psychological biases (37). As a result, satisfaction with healthcare security exhibits different growth patterns under varying degrees of social equity and trust, as shown by the actual curve S in the schematic. If the line L is the tangent at point A on the curve S, then the slope KA = KL. Point A is called the social equity and trust threshold point, with the horizontal coordinate corresponding to point A representing the social equity and trust threshold. Let point D be an arbitrary point assumed to the left of curve S at point A, and point E an arbitrary point assumed to the right of curve S at point A. It is easy to see that the relationship between the slopes of the tangents at these three points is KD > KA > KE. In other words, the slope of the tangent on curve S decreases as social equity and trust increases. This suggests that, all other things being equal, the rate of increase in satisfaction with healthcare security decreases as the level of social equity and trust increases by the same proportion (see Figure 3). This phenomenon is known as the marginal effect of social equity and trust. The marginal effect of social equity and trust indicates that in the early stages of increasing social equity and trust, the growth in healthcare security satisfaction is much higher than the ideal policy level. However, once the effect of social equity and trust reaches the ideal policy level, the growth trend in healthcare security satisfaction slows down. To illustrate this, we refer to China’s rural health insurance system in the 1960s and 1970s and the current health insurance system (38). When the overall level of social development was low, modest investment in health insurance led to high satisfaction among residents (39). However, as the economic level improved significantly, despite substantial increases in health insurance premiums each year, the growth trend in residents’ satisfaction with healthcare security became less pronounced (40).
In the schematic, we refer to the horizontal difference between the actual curve and the ideal straight line as the social equity and trust deviation, and the vertical difference as the satisfaction deviation. These deviations reflect the impact of policy implementation. Assuming the existence of multiple curves, where each curve represents the outcome of a different policy, we found that a large deviation indicates a strong policy stimulus but challenges in ensuring long-term policy sustainability. In contrast, a small deviation indicates a weak policy stimulus and slow progress toward health equity. The social equity and trust deviation and satisfaction deviation suggest that a robust and sustainable policy is the optimal choice to promote health equity. In addition, it is important to consider the conditions at both ends of the curve. As the degree of social equity and trust approaches infinity, satisfaction with healthcare security will asymptotically approach 1, but will never reach 1 due to the law of diminishing marginal benefits (41). If the degree of social equity and trust is zero, it will be difficult for residents to make a rational assessment of their health security status, which contradicts the assumptions made in the model.
Building on the previous analysis of how social equity and trust influence satisfaction with healthcare security, we introduced the medical burden as an additional factor. This allowed us to further examine its effect on satisfaction under varying levels of social equity and trust (see Figure 4). In Figure 4, the horizontal axis represents the medical burden. This measure considers residents’ income relative to their medical expenses, providing a comprehensive indication of their ability to afford healthcare. The vertical axis represents satisfaction with healthcare security. S1 and S0 are the perceptual difference curves depicting residents’ healthcare security satisfaction at high and low levels of social equity and trust, respectively, while L1 and L0 are the tangents to the corresponding curves with slopes K1 = K0.

Figure 4. Schematic of function between medical burden, social equity and trust, and healthcare security satisfaction.
Ideally, S1 and S0 would represent straight lines for healthcare security satisfaction, reflecting changes in medical burden. However, due to residents’ psychological affordability limits, the downward trend in healthcare security satisfaction remains subtle until the medical burden reaches the threshold of affordable health expenditure (hereafter referred to as the burden threshold). Beyond this point, satisfaction with healthcare security declines rapidly as the medical burden exceeds residents’ affordability range. The burden threshold also varied due to differences in residents’ perceptions of medical burden across varying levels of equity. This effect is particularly noticeable among residents with high perceived equity (42). In contrast, residents with low perceived equity tend to have lower expectations of their health security status, resulting in a relatively higher burden threshold. In the schematic, if point A represents the burden threshold on curve S1, then ideally point B with the same medical burden index would correspond to the burden threshold on curve S0. However, the slope of the tangent at point B is less than that at point A for the reasons given above. If point D has the same slope as point A, it would represent the burden threshold at level S0. The horizontal distance between points x2 and x1 can then be interpreted as the burden threshold deviation. Similarly, the vertical difference between y1 and y3 reflected the satisfaction threshold deviation between the two threshold points. These deviations reflect differences in affordability and satisfaction at the inflection point of the healthcare security satisfaction curve. Larger deviations suggest greater disparities in social equity and trust. The deviation in the load threshold from point B to point D on S0 is captured by the vertical difference y2-y3, which we call the equity deviation. This represents the satisfaction gap between the theoretical and actual inflection points of the curve. To further explain the different downward trends of the curves before and after the burden threshold, we combine the two curves. Before the load threshold is reached, the slope KB of the tangent at point B is less than the slope KBD of the straight line BD, and point B on the straight line BD has the same slope as point D. At point D, we find that the slope of the straight line BD and the tangent both satisfy the relationship KBD < K0. We have used KBD as an intermediary to establish the relationship KB < K0 between the tangents at points B and D. Similarly, for the trend of the curve after the load threshold is reached, we examine the transfer effect of line AE. Using this, we derived the slope K1 of the tangent at point A. We then find that the slope KE of the tangent at point E satisfied the relationship K1 < KE.
In the discussion above, we primarily considered the case of the load threshold. Next, we held either the x-axis or the y-axis constant to further explore the difference between the two curves. When the medical burden was fixed at x1, the vertical difference between S1 and S0 was defined as the satisfaction gap. Conversely, when satisfaction with healthcare security was fixed at y3, the horizontal difference between S1 and S0 was defined as the burden gap. Both gaps measure the degree of variation in social equity and trust. Finally, it is necessary to examine the endpoints of the curve. When the medical burden was close to zero, residents’ satisfaction with healthcare security reflected a strong sense of access to high-quality medical and health services. This was particularly evident among residents covered by government-funded health insurance. In contrast, when satisfaction with healthcare security was close to zero, the situation was markedly different. At this point, the severity of illness and the cost of diagnosis and treatment far exceeded the household’s financial capacity. In some cases, residents were entering the end-of-life stage. Under such circumstances, it became difficult for them to make rational assessments or judgments about their medical security status (43). These two situations contradicted our assumptions that residents experience no significant differences in medical burden (H1) and that they make rational assessments of their healthcare security status (H2). Therefore, we did not fully analyse the two ends of the curve. Taken together, Figures 3, 4 provide empirical support for Hypothesis 3, while partially disproving Hypotheses 1 and 2 due to the deviations observed at both extremes of the curve.
5 Discussion
This study extends the empirical analysis by using ML algorithms to examine the causal relationship between outcome equity and opportunity equity in healthcare security. Using the latest data from the CGSS, with satisfaction with healthcare security serving as a comprehensive indicator, this research elucidates how social and economic factors shape individuals’ perceptions of healthcare security. By integrating predictive modeling with causal inference, this approach not only strengthens the analytical rigour of the research, but also enhances the policy relevance of its findings.
First, social equity and trust and healthcare security satisfaction are mutually influential. Our findings indicate that social equity and trust is a significant contributing factor to healthcare security satisfaction, while healthcare security satisfaction itself is a crucial component of social equity. The relationship between these two variables is not a simple positive linear one, but has a non-linear marginal effect. Specifically, as the level of social equity and trust increases, the rate of improvement in healthcare security satisfaction slows down. Conversely, when healthcare security satisfaction improves, social equity and trust tends to increase more rapidly. This result suggests that improvements in social policies not only enhance healthcare security satisfaction but also foster broader social equity and trust (44).
Secondly, medical burden is the most significant factor influencing satisfaction with healthcare security. As the medical burden increases, residents’ satisfaction with healthcare security gradually declines. By analyzing the inflection point of the satisfaction curve, we introduce a new definition of catastrophic healthcare expenditure: when medical burden reaches a certain threshold, residents’ satisfaction with healthcare security drops sharply (45). This critical point is not only related to the financial burden of health care costs, but also to the psychological capacity of residents to bear such burdens. In other words, catastrophic health expenditure reflects not only an economic burden but also the psychological and emotional resilience of residents.
Third, regarding the satisfaction curve for healthcare security under varying levels of equity, we find that it does not resemble the indifference curves found in economics. In areas with higher health equity, the critical threshold for the burden on residents is lower, and satisfaction with health care tends to decline more easily. International comparisons support this finding: residents in developed countries may protest more strongly against cuts in health services, while in regions such as sub-Saharan Africa, despite lower levels of health care, residents may react less strongly to cuts (46, 47). This disparity suggests that satisfaction with health care is shaped not only by economic factors, but also by the social context and cultural expectations of the population (48). Future CGSS data can be used to test this model by examining non-linear relationships between perceived equity and satisfaction, and identifying potential threshold effects across regions and social groups.
There are several limitations to this study. First, the data used in this study are from a large survey database in China, where healthcare data are subject to recall bias due to self-reporting, which may lead to inaccuracies. Additionally, this study does not analyze the potential mediating relationships between social equity and trust, satisfaction with healthcare security and medical burden, which limits our understanding of the complex interactions among these variables. Furthermore, the schematic illustrations of healthcare security satisfaction in this study are not based on specific mathematical equations estimated from the data, but rather serve as conceptual visualizations of possible functional patterns to support causal reasoning. While such diagrams help in illustrating theoretical mechanisms, they do not provide definitive empirical evidence to confirm or reject the proposed hypotheses. Future research could address these limitations by using more comprehensive datasets and exploring the mediating factors between key variables to gain deeper insights into their interrelationships.
6 Conclusion
This study utilizes the CGSS database and ML algorithms to predict and classify healthcare security satisfaction, aiming to identify its key determinants and explore the underlying mechanisms through causal analysis. The findings indicate that social equity and trust and medical burden are core factors influencing satisfaction with healthcare security. An increase in social equity and trust is positively correlated with higher satisfaction with healthcare security, whereas an increase in medical burden significantly diminishes it. The study also reveals the marginal effects between social equity and trust and healthcare satisfaction: at higher levels of social equity and trust, the rate of improvement in satisfaction with healthcare security decelerates; conversely, greater satisfaction with healthcare security accelerates the rise in social equity and trust. These findings effectively explain the mechanisms that shape health satisfaction in different social contexts and provide valuable insights for improving the equity of health policies worldwide. To this end, policymakers should implement targeted financial assistance programmes to reduce the burden of health care and prevent excessive out-of-pocket costs for low-income populations. In addition, increasing the transparency of health care governance and improving the efficiency of services can further enhance public trust and satisfaction.
Data availability statement
The datasets presented in this study can be found in online repositories. The names of the repository/repositories and accession number(s) can be found at: Chinese General Social Survey (cgss.ruc.edu.cn).
Author contributions
SB: Conceptualization, Data curation, Formal analysis, Methodology, Resources, Validation, Visualization, Writing – original draft, Writing – review & editing. HT: Conceptualization, Supervision, Validation, Writing – review & editing. DG: Data curation, Investigation, Validation, Writing – review & editing. XP: Data curation, Investigation, Validation, Writing – review & editing. QY: Data curation, Investigation, Validation, Writing – review & editing. T-hW: Writing – review & editing. YC: Conceptualization, Supervision, Validation, Writing – review & editing.
Funding
The author(s) declare that financial support was received for the research and/or publication of this article. This study was funded by the National Natural Science Foundation of China (Grant No: 72374076) and the Fundamental Research Funds for the Central Universities (Grant No: YCJJ20242412). The funder did not participate in study design, data collection, analysis, interpretation of data and manuscript writing. The contents of this publication were solely the views of the authors.
Acknowledgments
We would like to thank the study participants and collaborators. This study used a de-identified administrative dataset that is publicly accessible without additional legal requirements for ethics review or informed consent. As such, no ethics board approval was required. All data were obtained from the official China General Social Survey (CGSS) website: http://cgss.ruc.edu.cn.
Conflict of interest
The authors declare that the research was conducted in the absence of any commercial or financial relationships that could be construed as a potential conflict of interest.
Generative AI statement
The authors declare that no Gen AI was used in the creation of this manuscript.
Publisher’s note
All claims expressed in this article are solely those of the authors and do not necessarily represent those of their affiliated organizations, or those of the publisher, the editors and the reviewers. Any product that may be evaluated in this article, or claim that may be made by its manufacturer, is not guaranteed or endorsed by the publisher.
Supplementary material
The Supplementary material for this article can be found online at: https://www.frontiersin.org/articles/10.3389/fpubh.2025.1529964/full#supplementary-material
References
1. Kang, L, Zhang, T, Xian, B, Li, C, and Khan, MM. Public satisfaction with health system after healthcare reform in China. Health Res Policy Syst. (2023) 21:128. doi: 10.1186/s12961-023-01067-6
2. Zhu, Y, Li, Y, Wu, M, and Fu, H. How do Chinese people perceive their healthcare system? Trends and determinants of public satisfaction and perceived fairness, 2006–2019. BMC Health Serv Res. (2022) 22:22. doi: 10.1186/s12913-021-07413-0
3. Ferreira, DC, Vieira, I, Pedro, MI, Caldas, P, and Varela, M. Patient satisfaction with healthcare services and the techniques used for its assessment: a systematic literature review and a bibliometric analysis. Healthcare (Basel). (2023) 11:639. doi: 10.3390/healthcare11050639
4. Jakovljevic, M, Chang, H, Pan, J, Guo, C, Hui, J, Hu, H, et al. Successes and challenges of China's health care reform: a four-decade perspective spanning 1985-2023. Cost Eff Resour Alloc. (2023) 21:59. doi: 10.1186/s12962-023-00461-9
5. Tao, W, Zeng, Z, Dang, H, Lu, B, Chuong, L, Yue, D, et al. Towards universal health coverage: lessons from 10 years of healthcare reform in China. BMJ Glob Health. (2020) 5:e002086. doi: 10.1136/bmjgh-2019-002086
6. Peng, X, and Zhang, JH. Socioeconomic inequality in public satisfaction with the healthcare system in China: a quantile regression analysis. Arch Public Health. (2022) 80:165. doi: 10.1186/s13690-022-00925-z
7. Alemu, AT, Bogale, EK, Bogale, SK, Desalew, EG, Andarge, GA, Seid, K, et al. Patient satisfaction and associated factors with inpatient health services at public hospitals in Ethiopia: a systematic review and meta-analysis. BMC Health Serv Res. (2024) 24:1042. doi: 10.1186/s12913-024-11552-5
8. Gong, X, and Zhang, J. Effects of medical security satisfaction and trust in doctors on subjective well-being: evidence from China. Int J Manag Sustain. (2019) 8:133–50. doi: 10.18488/journal.11.2019.83.133.150
9. Liu, C, Li, Y, Fang, M, and Liu, F. Using machine learning to explore the determinants of service satisfaction with online healthcare platforms during the COVID-19 pandemic. Serv Bus. (2023) 17:449–76. doi: 10.1007/s11628-023-00535-x
10. Darko, AP, Antwi, CO, Adjei, K, Zhang, B, and Ren, J. Predicting determinants influencing user satisfaction with mental health app: an explainable machine learning approach based on unstructured data. Expert Syst Appl. (2024) 249:123647. doi: 10.1016/j.eswa.2024.123647
11. Bühlmann, P, and van de Geer, S. Statistics for high-dimensional data: Methods, theory and applications. Berlin Heidelberg: Springer (2011).
12. Yu, GB, Joshanloo, M, and Sirgy, MJ. The impact of citizens’ satisfaction with national-level institutions and conditions on their subjective wellbeing: evidence from 137 countries. Appl Res Qual Life. (2024) 19:3219–35. doi: 10.1007/s11482-024-10374-1
13. Niu, G, and Zhao, G. Survey data on political attitudes of China's urban residents compiled from the Chinese general social survey (CGSS). Data Brief. (2018) 20:591–5. doi: 10.1016/j.dib.2018.08.146
14. Peng, X, Tang, X, Chen, Y, and Zhang, J. Ranking the healthcare resource factors for public satisfaction with health system in China—based on the grey relational analysis models. Int J Environ Res Public Health. (2021) 18:995. doi: 10.3390/ijerph18030995
15. Missinne, S, Meuleman, B, and Bracke, P. The popular legitimacy of European healthcare systems: a multilevel analysis of 24 countries. J Eur Soc Policy. (2013) 23:231–47. doi: 10.1177/0958928713480065
16. Zhang, JH, Peng, X, Liu, C, Chen, Y, Zhang, H, and Iwaloye, OO. Public satisfaction with the healthcare system in China during 2013–2015: a cross-sectional survey of the associated factors. BMJ Open. (2020) 10:e034414. doi: 10.1136/bmjopen-2019-034414
17. Footman, K, Roberts, B, Mills, A, Richardson, E, and McKee, M. Public satisfaction as a measure of health system performance: a study of nine countries in the former Soviet Union. Health Policy. (2013) 112:62–9. doi: 10.1016/j.healthpol.2013.03.004
18. Li, H, and Yu, W. Enhancing community system in China's recent health reform: an effort to improve equity in essential health care. Health Policy. (2011) 99:167–73. doi: 10.1016/j.healthpol.2010.08.006
19. Munro, N, and Duckett, J. Explaining public satisfaction with health-care systems: findings from a nationwide survey in China. Health Expect. (2016) 19:654–66. doi: 10.1111/hex.12429
20. Wang, X, Chen, X, Li, L, and Zhou, D. The impacts of basic medical insurance for urban–rural residents on the perception of social equity in China. Cost Eff Resour Alloc. (2024) 22:57. doi: 10.1186/s12962-024-00565-w
21. Hsu, J, Flores, G, Evans, D, Mills, A, and Hanson, K. Measuring financial protection against catastrophic health expenditures: methodological challenges for global monitoring. Int J Equity Health. (2018) 17:69. doi: 10.1186/s12939-018-0749-5
22. Bleustein, C, Rothschild, DB, Valen, A, Valatis, E, Schweitzer, L, and Jones, R. Wait times, patient satisfaction scores, and the perception of care. Am J Manag Care. (2014) 20:393–400.
23. Ala, A, and Chen, F. Appointment scheduling problem in complexity systems of the healthcare services: a comprehensive review. J Healthc Eng. (2022) 2022:5819813. doi: 10.1155/2022/5819813
24. Zacharias, J, and Liu, X. The role of the access environment in metro commute travel satisfaction. Sustain For. (2022) 14:15322. doi: 10.3390/su142215322
25. Hu, R, Liao, Y, Du, Z, Hao, Y, Liang, H, and Shi, L. Types of health care facilities and the quality of primary care: a study of characteristics and experiences of Chinese patients in Guangdong Province, China. BMC Health Serv Res. (2016) 16:335. doi: 10.1186/s12913-016-1604-2
26. Chen, L, and Cheng, M. Exploring Chinese elderly’s trust in the healthcare system: empirical evidence from a population-based survey in China. Int J Environ Res Public Health. (2022) 19:16461. doi: 10.3390/ijerph192416461
27. Weeks, WB, Chang, JE, Pagán, JA, Lumpkin, J, Michael, D, Salcido, S, et al. Rural-urban disparities in health outcomes, clinical care, health behaviors, and social determinants of health and an action-oriented, dynamic tool for visualizing them. PLOS Glob Public Health. (2023) 3:e0002420. doi: 10.1371/journal.pgph.0002420
28. Kullolli, T, Trebicka, B, and Fortuzi, S. Understanding customer satisfaction factors: a logistic regression analysis. J Educ Soc Res. (2024) 14:218–30. doi: 10.36941/jesr-2024-0038
29. John, LH, Kors, JA, Reps, JM, Ryan, PB, and Rijnbeek, PR. Logistic regression models for patient-level prediction based on massive observational data: do we need all data? Int J Med Inform. (2022) 163:104762. doi: 10.1016/j.ijmedinf.2022.104762
30. Zhao, X, and Rios, A. A marker-based neural network system for extracting social determinants of health. J Am Med Inform Assoc. (2023) 30:1398–407. doi: 10.1093/jamia/ocad041
31. Kalinić, Z, Marinković, V, Kalinić, L, and Liébana-Cabanillas, F. Neural network modeling of consumer satisfaction in mobile commerce: an empirical analysis. Expert Syst Appl. (2021) 175:114803. doi: 10.1016/j.eswa.2021.114803
32. Simsekler, MCE, Alhashmi, NH, Azar, E, King, N, Luqman, RAMA, and al Mulla, A. Exploring drivers of patient satisfaction using a random forest algorithm. BMC Med Inform Decis Mak. (2021) 21:157. doi: 10.1186/s12911-021-01519-5
33. Li, C, Liao, C, Meng, X, Chen, H, Chen, W, Wei, B, et al. Effective analysis of inpatient satisfaction: the random forest algorithm. Patient Prefer Adherence. (2021) 15:691–703. doi: 10.2147/PPA.S294402
34. Fawcett, T. An introduction to ROC analysis. Pattern Recogn Lett. (2006) 27:861–74. doi: 10.1016/j.patrec.2005.10.010
35. DeLong, ER, DeLong, DM, and Clarke-Pearson, DL. Comparing the areas under two or more correlated receiver operating characteristic curves: a nonparametric approach. Biometrics. (1988) 44:837–45. doi: 10.2307/2531595
36. Matthay, EC, Neill, DB, Titus, AR, Desai, S, Troxel, AB, Cerdá, M, et al. Integrating artificial intelligence into causal research in epidemiology. Curr Epidemiol Rep. (2025) 12:6. doi: 10.1007/s40471-025-00359-5
37. Javed, SA, and Liu, SF. Evaluation of outpatient satisfaction and service quality of Pakistani healthcare projects: application of a novel synthetic Grey incidence analysis model. Grey Syst Theory App. (2018) 8:462–80. doi: 10.1108/GS-04-2018-0018
38. Zhang, D, and Unschuld, PU. China's barefoot doctor: past, present, and future. Lancet. (2008) 372:1865–7. doi: 10.1016/S0140-6736(08)61355-0
39. Yip, W, and Hsiao, W. The Chinese health system at a crossroads. Health Aff. (2008) 27:460–8. doi: 10.1377/hlthaff.27.2.460
40. Fan, X, Su, M, Si, Y, Zhao, Y, and Zhou, Z. The benefits of an integrated social medical insurance for health services utilization in rural China: evidence from the China health and retirement longitudinal study. Int J Equity Health. (2021) 20:126. doi: 10.1186/s12939-021-01457-8
41. Layard, R, Mayraz, G, and Nickell, S. The marginal utility of income. J Public Econ. (2008) 92:1846–57. doi: 10.1016/j.jpubeco.2008.01.007
42. Li, N, and He, M. Social security satisfaction and people’s subjective wellbeing in China: the serial mediation effect of social fairness and social trust. Front Psychol. (2022) 13:855530. doi: 10.3389/fpsyg.2022.855530
43. Wang, W, and Cao, Y. How individual social capital affects residents’ satisfaction with medical services: based on the evidence from urban residents in China. Front Psychol. (2022) 13:1077144. doi: 10.3389/fpsyg.2022.1077144
44. Wu, L, and Wang, G. Fairness, trust, and well-being among young adults: evidence from 2021 Chinese general social survey (CGSS). Healthcare. (2024) 12:2186. doi: 10.3390/healthcare12212186
45. Haakenstad, A, Bintz, C, Knight, M, Bienhoff, K, Chacon-Torrico, H, Curioso, WH, et al. Catastrophic health expenditure during the COVID-19 pandemic in five countries: a time-series analysis. Lancet glob. Health. (2023) 11:e1629–39. doi: 10.1016/S2214-109X(23)00330-3
46. AlSaud, AM, Taddese, HB, and Filippidis, FT. Trends and correlates of the public’s perception of healthcare systems in the European Union: a multilevel analysis of Eurobarometer survey data from 2009 to 2013. BMJ Open. (2018) 8:e018178. doi: 10.1136/bmjopen-2017-018178
47. Deaton, AS, and Tortora, R. People in sub-Saharan Africa rate their health and health care among the lowest in the world. Health Aff (Millwood). (2015) 34:519–27. doi: 10.1377/hlthaff.2014.0798
Keywords: healthcare security, satisfaction, machine learning, social equity and trust, medical expenses
Citation: Bi S, Tan H, Guo D, Peng X, Yang Q, Weng T-h and Chen Y (2025) How do Chinese people perceive their healthcare system? Inequality in public satisfaction with healthcare security. Front. Public Health. 13:1529964. doi: 10.3389/fpubh.2025.1529964
Edited by:
Chao Ma, Southeast University, ChinaReviewed by:
Emma Kurnat-Thoma, Consultant, Bethesda, MD, United StatesYi Zeng, Zhongnan University of Economics and Law, China
Copyright © 2025 Bi, Tan, Guo, Peng, Yang, Weng and Chen. This is an open-access article distributed under the terms of the Creative Commons Attribution License (CC BY). The use, distribution or reproduction in other forums is permitted, provided the original author(s) and the copyright owner(s) are credited and that the original publication in this journal is cited, in accordance with accepted academic practice. No use, distribution or reproduction is permitted which does not comply with these terms.
*Correspondence: Tsung-han Weng, dGh3ZW5nQGJudS5lZHUuY24=; Yingchun Chen, Y2hlbnlpbmdjaHVuaHVzdEAxNjMuY29t