 Yiwen Cao
 Xiaoyun Zhou2*
 Zaixiang Tang
- 1The Second Affiliated Hospital of Soochow University, School of Public Health, Jiangsu Key Laboratory of Preventive and Translational Medicine for Major Chronic Non-communicable Diseases, MOE Key Laboratory of Geriatric Diseases and Immunology, Suzhou Medical College of Soochow University, Suzhou, China
- 2Department of Chronic Disease Prevention and Control, Rudong Center for Disease Control and Prevention, Nantong, China
Background: The impact of air pollutants on cardiovascular disease (CVD) mortality remains inadequately studied in Rudong, an eastern coastal area of China. This study aimed to investigate the association between air pollutants and CVD mortality in Rudong.
Methods: Daily number of deaths from CVD, meteorological and air pollutants data in Rudong from 2013 to 2022 were collected. The generalized additive model (GAM) was employed to analyze the relationship between air pollutants and CVD mortality, and stratified analyses were conducted by gender, age, and season.
Results: There was a significant association between air pollutants and CVD mortality. A total of 36,972 deaths from CVD-related deaths were included in the study. We observed that short-term exposure to PM2.5, PM10, SO2, CO, and O3 was positively correlated with CVD mortality. Per 10 μg/m3 increment in PM2.5 (lag05), PM10 (lag05), SO2 (lag05), CO (lag04), and O3 (lag06) (per 1 mg/m3 increment in CO), the excess risk of CVD mortality were 1.00% (95%CI:0.37%, 1.64%), 1.05% (95%CI:0.15%, 1.96%), 7.65% (95%CI:4.47%,10.94%), 13.82% (95%CI:4.47%,23.99%), and 1.82% (95%CI:1.02%, 2.62%), respectively. Overall, the estimated impact of air pollutants was greater in the warm season. In addition, susceptibility to air pollution exposure varied across different genders and age groups, with females and those over 65 years old being more sensitive.
Conclusion: Exposure to air pollutants increased the risk of CVD mortality. Furthermore, the health effects of air pollution may be influenced by season, gender, and age. In conclusion, reducing pollutant concentrations to lower levels may provide greater cardiovascular benefits.
1 Introduction
In recent years, many studies have shown that air pollution is closely related to the occurrence, development and mortality of CVD (1–4). In China, air pollution remains a critical environmental challenge. Particulate matter (PM) is major component of air pollutants, with fine particles less than 2.5 μm in diameter (PM2.5) being particularly concerning due to their small size and large surface area. These particles can adsorb toxic and harmful substances, remain suspended in the atmosphere for extended periods, and be inhaled into the human respiratory system. Once inhaled, PM2.5 deposits in the respiratory and cardiovascular systems, leading to varying degrees of health damage, including increased mortality risk. In addition to particulate matter, gaseous pollutants such as sulfur dioxide (SO₂), nitrogen dioxide (NO2), carbon monoxide (CO), and ozone (O3) also pose serious threats to human health. Gaseous pollutants are more likely to spread through the respiratory tract, stimulating areas such as the lungs, organs, and bronchi, causing irreversible damage to the body. Upon entering the bloodstream, they may induce systemic effects, such as respiratory distress and hypoxia. Then they will affect cardiovascular function and lead to the occurrence of diseases and death.
Currently, CVD remains the leading cause of death worldwide and its burden is increasing. From 1990 to 2019, the global prevalence of CVD increased from 271 million to 523 million cases, while CVD-related deaths rose from 12.1 million to 18.6 million (5). In 2019, CVD accounted for 46.74 and 44.26% of all deaths in rural and urban areas in China (6). According to the “China Cardiovascular Health and Disease Report 2023,” it is estimated that there are 330 million CVD patients in China. With the process of population aging and social urbanization, the incidence rate and prevalence of related diseases are still rising in China.
The pathogenesis of CVD is complex, influenced not only by biological factors but also by social and environmental determinants (7). The Global Burden of Disease Study indicated that in 2019, ambient particulate matter pollution (APMP) was responsible for 14.78% of total CVD deaths, and the age-standardized mortality rate (ASMR) in low- and middle-income regions was 2.3 times higher than in high-income regions (8). Compared to genetic factors or individual behaviors, air pollution could be mitigated at the population level through policy interventions, whereas traditional behavioral interventions (such as smoking cessation) were effective but more difficult to implement (9). Therefore, studying the association between air pollution and CVD mortality holds significant public health value.
Numerous studies have examined the impact of particulate matter on CVD mortality. Research based on the China-PAR project demonstrated that each 10 μg/m3 elevation in PM2.5 concentration was associated with a 22% heightened risk of CVD mortality (10). Furthermore, gaseous pollutants also exert a significant influence on CVD mortality rates. Large-scale time-series studies conducted in China found that each increment of 10 μg/m3 in SO2, NO2, CO, and O3 concentrations corresponded to increases in CVD mortality risk of 0.7, 0.9, 1.12%, and 0.27%, respectively (11–14). Similarly, a major Canadian cohort study confirmed that both O3 and NO2 contribute to an increased risk of CVD mortality (15). Collectively, these findings indicate that various air pollutants exhibit differential hazardous effects on CVD-related fatalities.
Time series models are widely employed to investigate the acute health effects of air pollution. Among these, the generalized additive model (GAM) is the most commonly used due to its ability to capture both linear and nonlinear relationships between air pollutants and health outcomes. GAMs are particularly valuable because they allow for the incorporation of meteorological factors, long-term trends, and co-pollutants, enabling effective multi-factor adjustments. This capacity to control for confounding variables enhances the accuracy of assessments of the environmental impact on public health. Consequently, GAMs provide a more precise evaluation of how environmental factors affect population health.
Coastal areas, characterized by dense industrial activity, developed transportation networks, and high levels of urbanization, face a challenging air pollution situation. The combination of the sea-land wind system and high humidity climate in these regions tends to facilitate the secondary formation of pollutants, thereby exacerbating the toxicity of particulate matter. Additionally, it is widely recognized that the older adult population is at high risk for CVD. In recent years, the aging process in coastal areas has accelerated significantly, leading to a more pronounced burden of CVD in these areas. It is of great significance to study the relationship between air pollution and CVD mortality in coastal areas. Therefore, this study aims to evaluate the association between air pollutants and CVD mortality in Rudong, a coastal area of eastern China, from 2013 to 2022. Additionally, stratified analyses by age, gender, and season were conducted to identify particularly susceptible subpopulations.
2 Materials and methods
2.1 Study population
Rudong, a coastal city in eastern China with a developed economy and ample medical resources, experiences distinct air pollution patterns due to its subtropical monsoon climate. In recent years, rapid industrial growth has worsened air pollution. At the end of 2022, Rudong had a population of approximately 986,000, of which about 29.0% were aged 65 and above. The older adult are commonly regarded as the primary risk group for CVD. These factors—climatic specificity, unique pollution profiles, and an aging society—render Rudong an epidemiologically significant location for studying the environmental health impacts on CVD burdens (Figure 1).
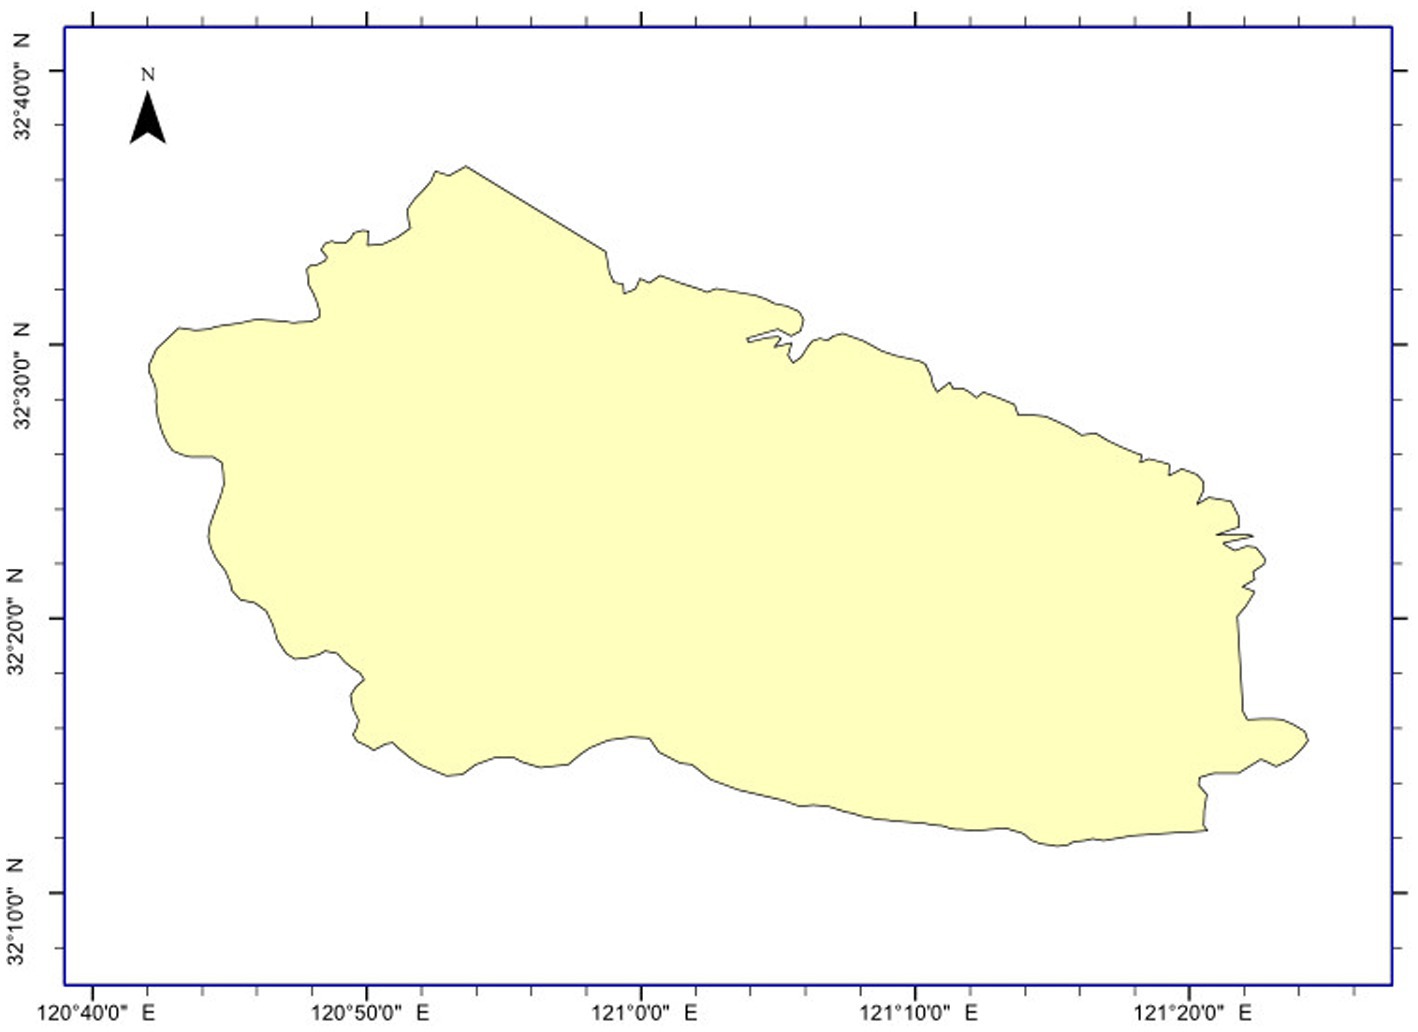
Figure 1. Schematic diagram of the geographical location of Rudong.
We obtained daily death data from the Center for Disease Control and Prevention from January 1, 2013 to December 31, 2022. The dataset includes the deceased’s age, gender, date of death, and primary cause of death coded according to the 10th edition of the International Classification of Diseases (ICD-10), where cardiovascular diseases (CVD) are classified as I00–I99.
2.2 Meteorological and pollution data
Daily air pollution data were provided by National Tibetan Plateau / Third Pole Environment Data Center (http://data.tpdc.ac.cn)(16–26). The dataset provides raster data on PM2.5, PM10, SO2, NO2, CO, and O3. We computed the daily average concentration of air pollutants within the study area based on spatial grid data and administrative boundaries. Daily meteorological data, including mean temperature and relative humidity, were obtained from the National Meteorological Science Data Center. These data were matched with air pollution data using spatial averaging methods to ensure consistency across the study region.
2.3 Statistical analysis
The main objective of this study is to evaluate the relationship between short-term exposure to air pollutants and CVD mortality. We conducted descriptive analysis on daily CVD deaths, air pollutants, and meteorological variables. Spearman correlation analysis was used to examine the correlation between air pollutants and meteorological variables.
The daily mortality of residents due to CVD is a low-probability event, and its distribution tends to follow a Poisson distribution. Consequently, our study employed a Generalized Additive Model (GAM) to analyze the association between air pollutant exposure and daily CVD mortality among residents while accounting for the confounding effects of other pollutants and meteorological factors. The formula for GAM is as follows:
where represents the estimated number of deaths caused by CVD at day t; α represents the intercept of the regression model; denotes the daily average concentration of air pollutants at day t, measured in μg/m3; represents the logarithm of the relative rate of daily CVD mortality associated with a 10 μg/m3 increase in pollution concentration ( ) (with CO set at 1 μg/m3); , as a binary variable, divided into weekdays and weekends, is introduced into the model as a factor variable, excluding natural fluctuations in daily deaths over the week; is a natural cubic spline smoothing function that adjusts for death dates (time) based on multi-year and seasonal trends; and are natural cubic spline smoothing functions for two weather variables ( ); denotes degrees of freedom. The Akaike Information Criterion (AIC) was used to evaluate the goodness of fit of a model, and the smaller the AIC, the better the goodness of fit of the model. In this model, (per year) was chosen as the time variable, and both temperature and relative humidity were set at .
To assess lagged effects, we constructed both single-day lag models (lag 0 to lag 7, where lag 0 represents same-day exposure and lag 7 represents exposure 7 days prior) and multi-day moving average models (lag 01 to lag 07, where lag 01 represents the average concentration of the current and previous day, and lag 07 represents the 7-day moving average). In addition, we also conducted stratified analysis based on sex (male, female) and age (20 ~ 64 years, 65 ~ years). Seasonal effects were examined by analyzing warm (April–September) and cold (October–March) seasons separately. The results reported the excess risk (ER) and 95% confidence interval (CI) of daily CVD deaths associated with a 10 μg/m3 increase in air pollutants (1 mg/m3 increase in CO).
We selected the lag time corresponding to the maximum ER value for each pollutant, then fitted multi-pollutant models. We verified model robustness by comparing results between single- and multi-pollutant models. Besides, we conducted sensitivity analysis to evaluate the robustness of the results by changing the (6–8) of time. Models are considered robust if the effect estimated derived from these models did not show significant differences. Lastly, the exposure-response (ER) curve depicting the relationship between CVD mortality and air pollutants was constructed based on GAM.
All statistical analyses were conducted in the R software (version 4.3.1), with the mgcv package for GAM modeling and ggplot2 for visualization.
3 Results
3.1 Descriptive results
Table 1 presents descriptive statistics for daily CVD deaths, air pollutants, and meteorological data from January 1, 2013, to December 31, 2022. A total of 36,972 CVD deaths were recorded, with an average daily mortality of 10.13. Of these, 51.9% were female, and 93.5% were over 65 years old. The daily average concentrations of PM10, PM2.5, NO2, SO2, CO, and O3 were 67.15 μg/m3, 40.45 μg/m3, 25.71 μg/m3, 15.45 μg/m3, 0.73 mg/m3, and 105.10 μg/m3, respectively. Throughout the study, the average concentrations of NO2, SO2, and CO remained below primary air quality standards, while PM10, PM2.5, and O3 exceeded primary standards but stayed below secondary standards. The daily average temperature was 16.3°C, with a relative humidity of 77.4%.
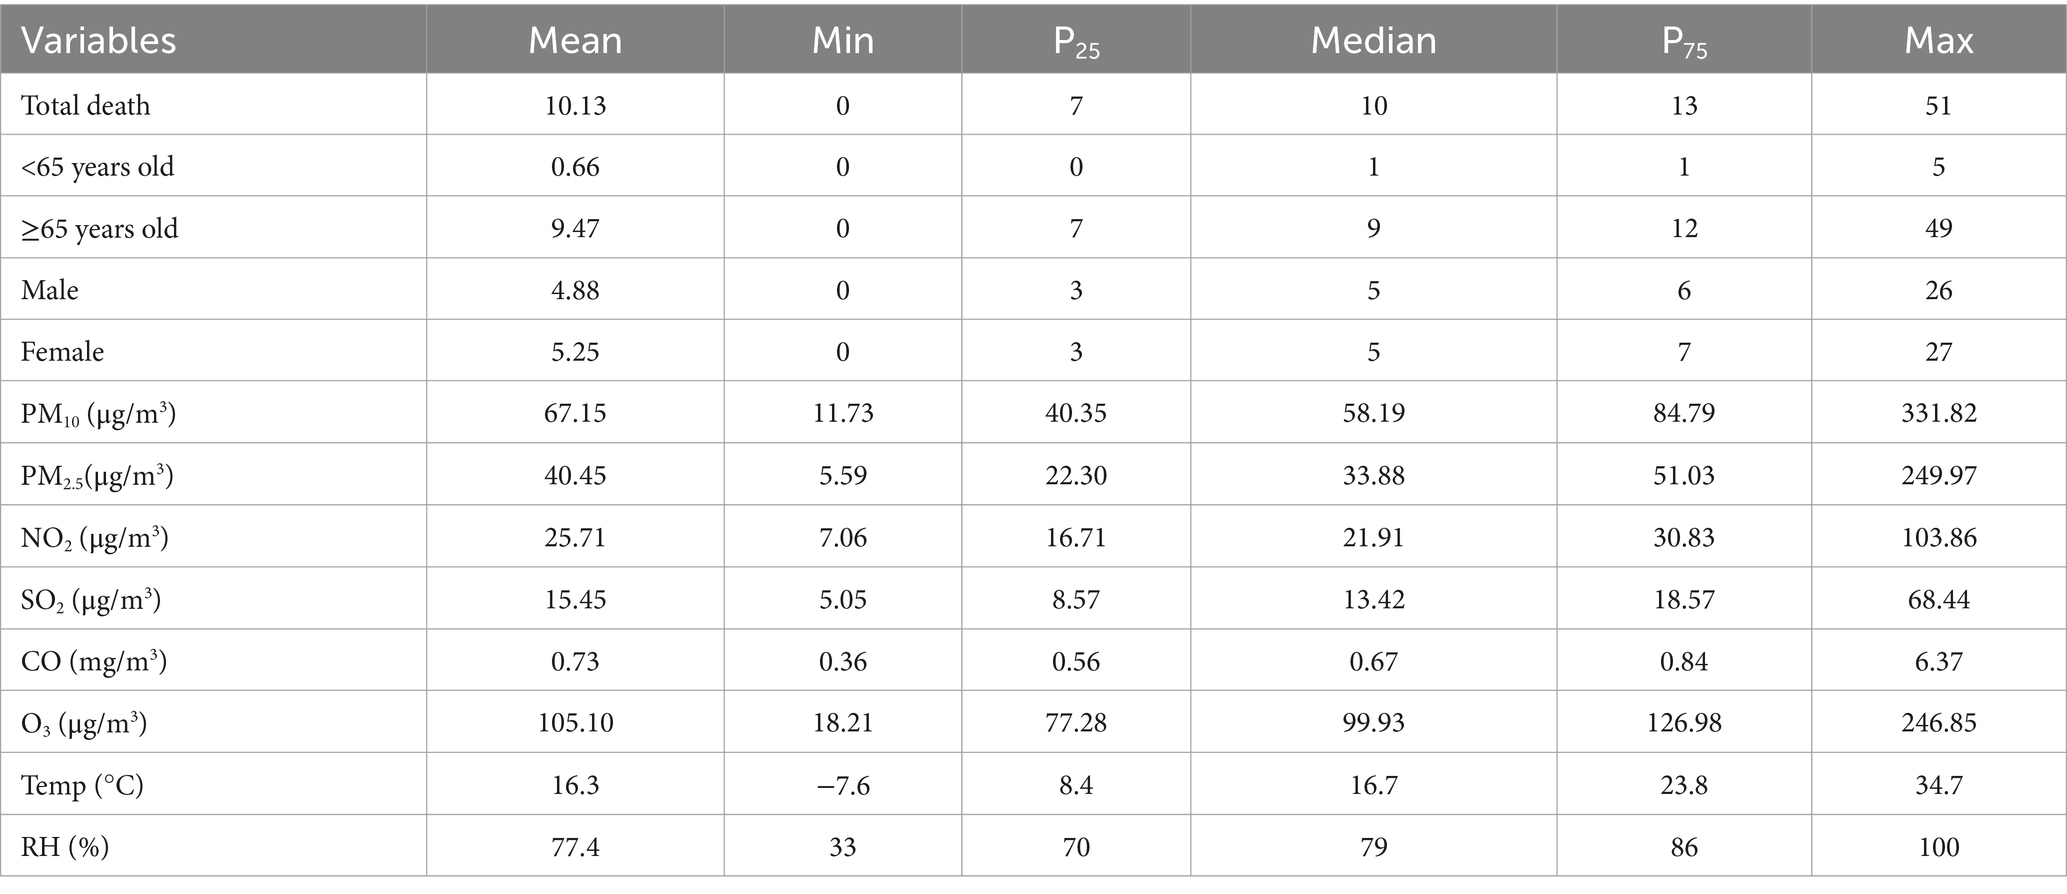
Table 1. Descriptive statistics of daily CVD deaths, air pollutants and meteorological data from 2013 to 2022.
Figure 2 illustrates the time series of daily air pollutants and CVD deaths from 2013 to 2022. CVD deaths exhibited clear seasonality, peaking in winter and dipping in summer, with a consistent annual trend. Air pollutants (except O3) also followed this seasonal pattern. In contrast, O3 concentrations were higher in summer and lower in winter.

Figure 2. The distribution of air pollutant concentrations, and daily CVD deaths from 2013 to 2022.
3.2 Correlation analysis
Pearson correlation analysis revealed that O3 was negatively correlated with PM10, PM2.5, NO2, SO2, and CO, and positively correlated with temperature. Excluding O3, the other five pollutants were positively correlated with each other, with the strongest correlation between PM2.5 and PM10 (r = 0.96, p < 0.01). Temperature was negatively correlated with all pollutants except O3, while relative humidity was negatively correlated with all pollutants and positively correlated with temperature. Additionally, daily CVD deaths were positively correlated with PM10, PM2.5, NO2, SO2, and CO concentrations, and negatively correlated with O3, temperature, and relative humidity, with all correlations being statistically significant (Figure 3).
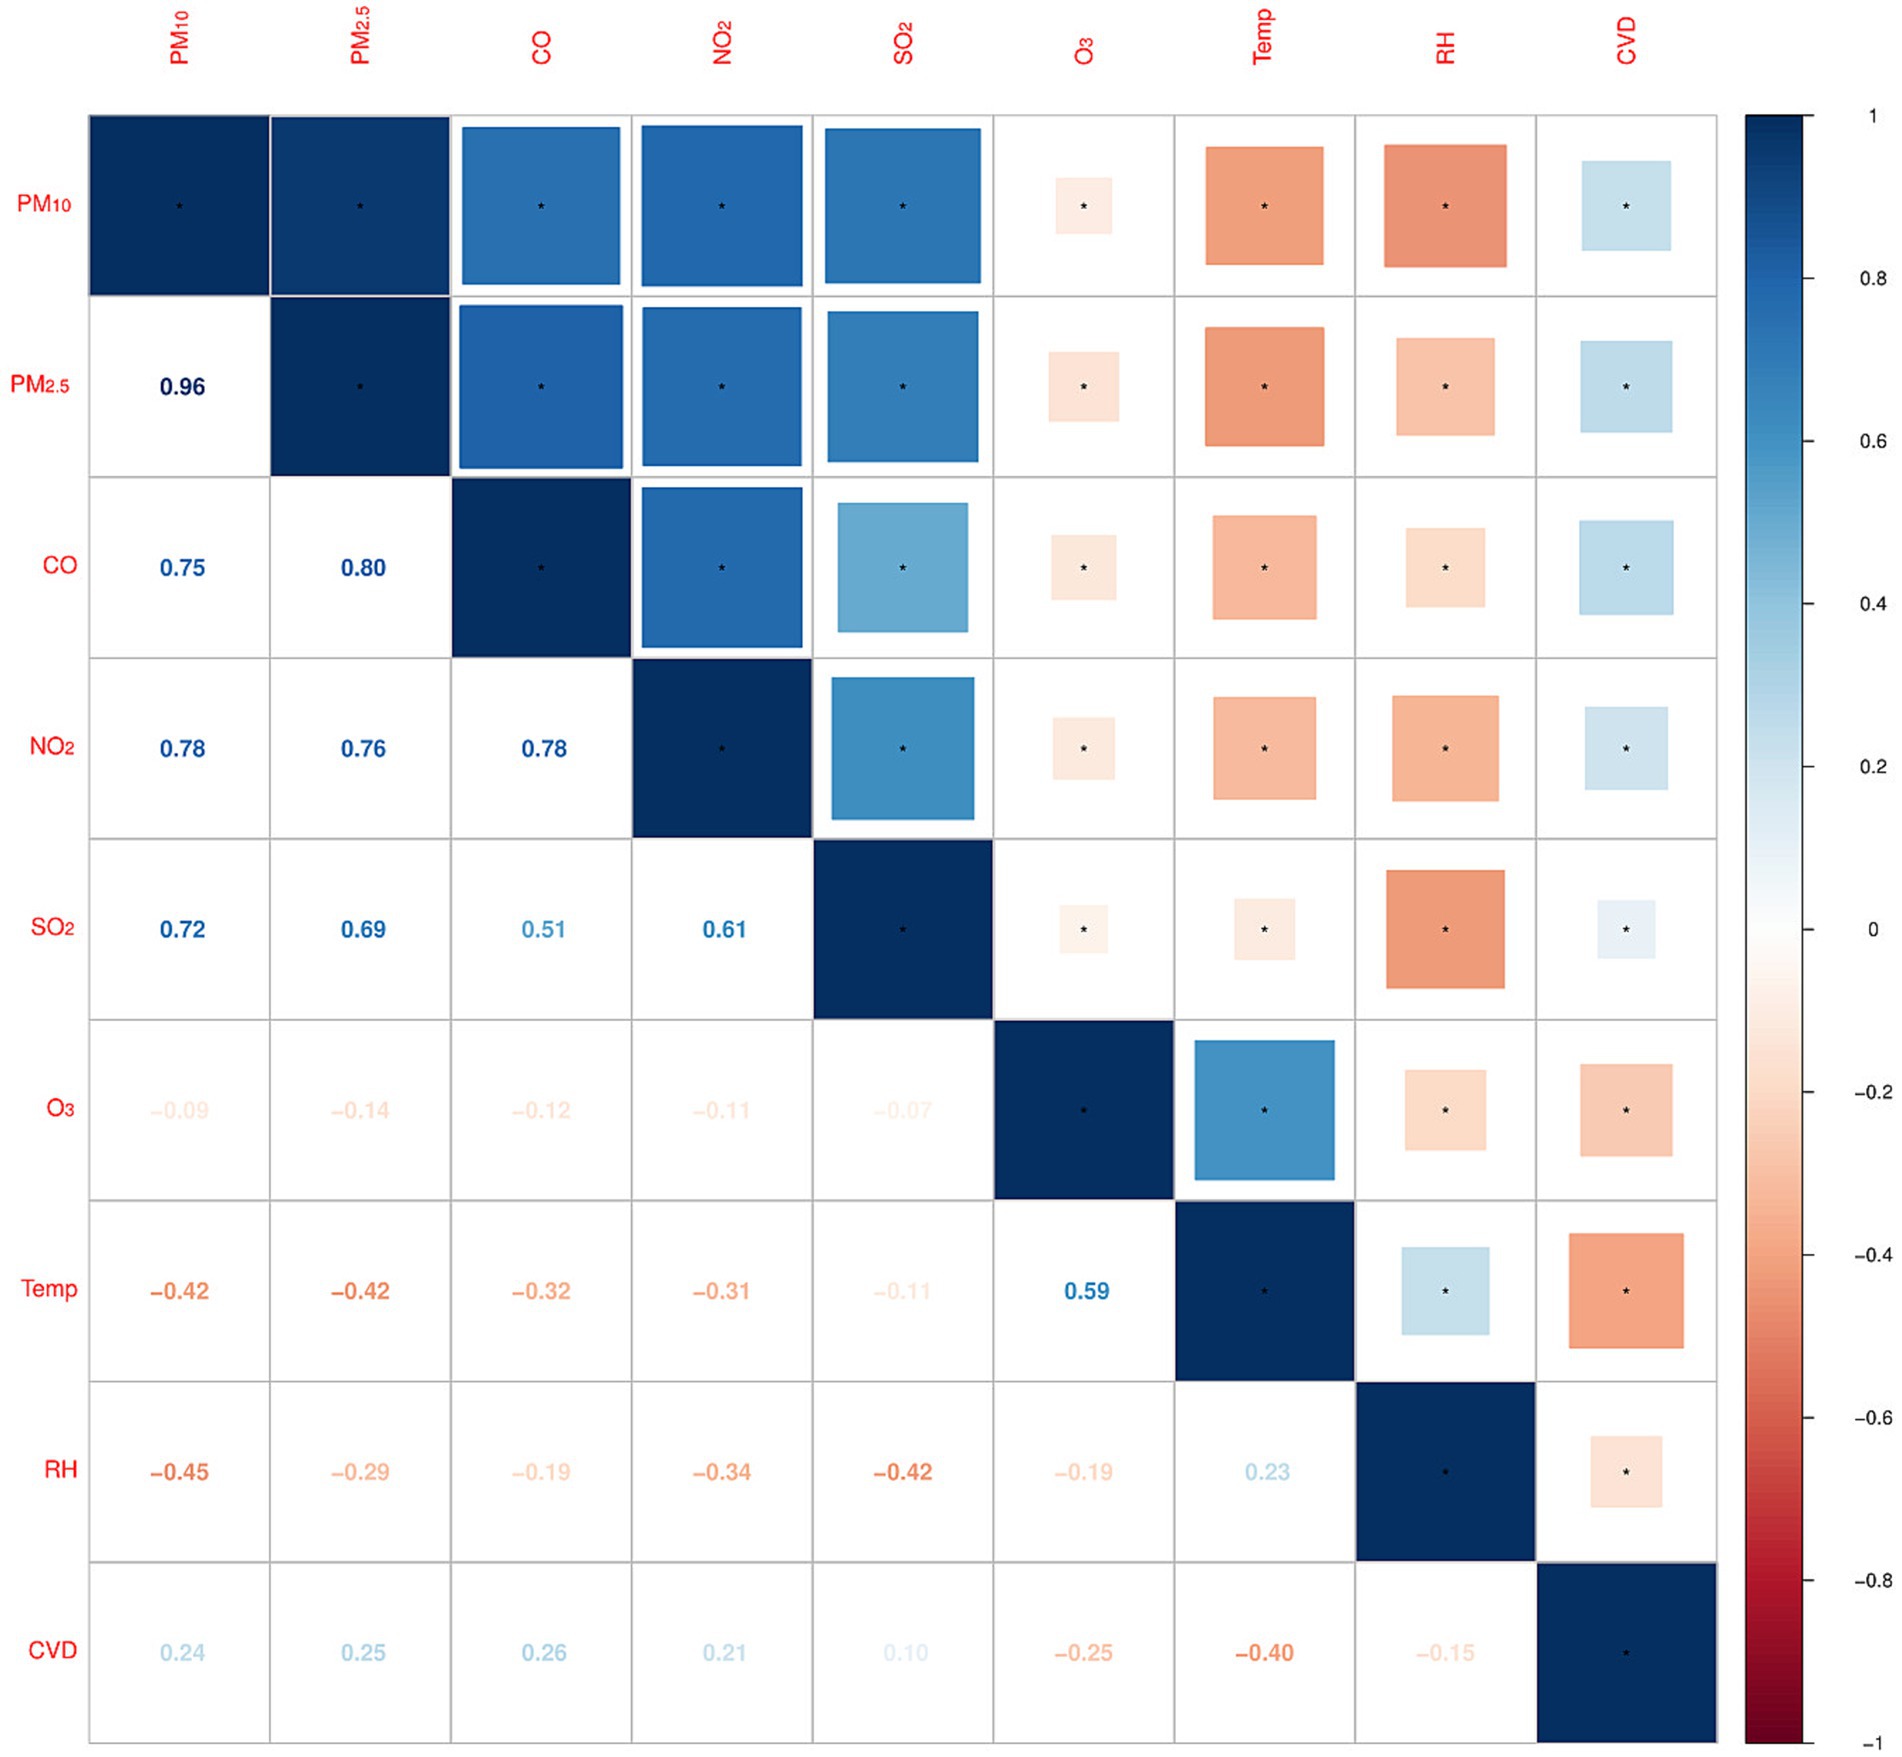
Figure 3. Spearman correlation between daily meteorological factors and air pollutants. (*Correlation is significant at the 0.01 level).
3.3 Regressive results
Table 2 shows the lag-response of the association between air pollutants and CVD mortality. In addition to NO2, all air pollutants had a significant positive correlation with CVD mortality. For single-day lags, the greatest effect of air pollutants on CVD mortality was found at lag3. For 10 μg/m3 increase in PM10, SO2 and O3, the ER of CVD mortality was 0.45% (95%CI:0.08%, 0.83%), 3.26% (95%CI: 1.45%, 5.10%), 0.94% (95%CI: 0.50%, 1.39%). For multi-day lags, we observed that the estimated impact of all cumulative exposures was greater than that of single-day lags. Generally, the estimated ER in CVD mortality associated with a 10 μg/m3 increment in pollutant concentrations mostly reached a maximum at lag 05, up to 1.00% (95%CI: 0.37%,1.64%) for PM10, 1.05% (95%CI:0.15%, 1.96%) for PM2.5, 7.65% (95%CI: 4.47%, 10.94%) for SO2,1.82% (95%CI: 1.02%, 2.62%) for O3, respectively. The largest estimate for CO was found at lag 04, the ER was 13.82% (95%CI: 4.47%, 23.99%).
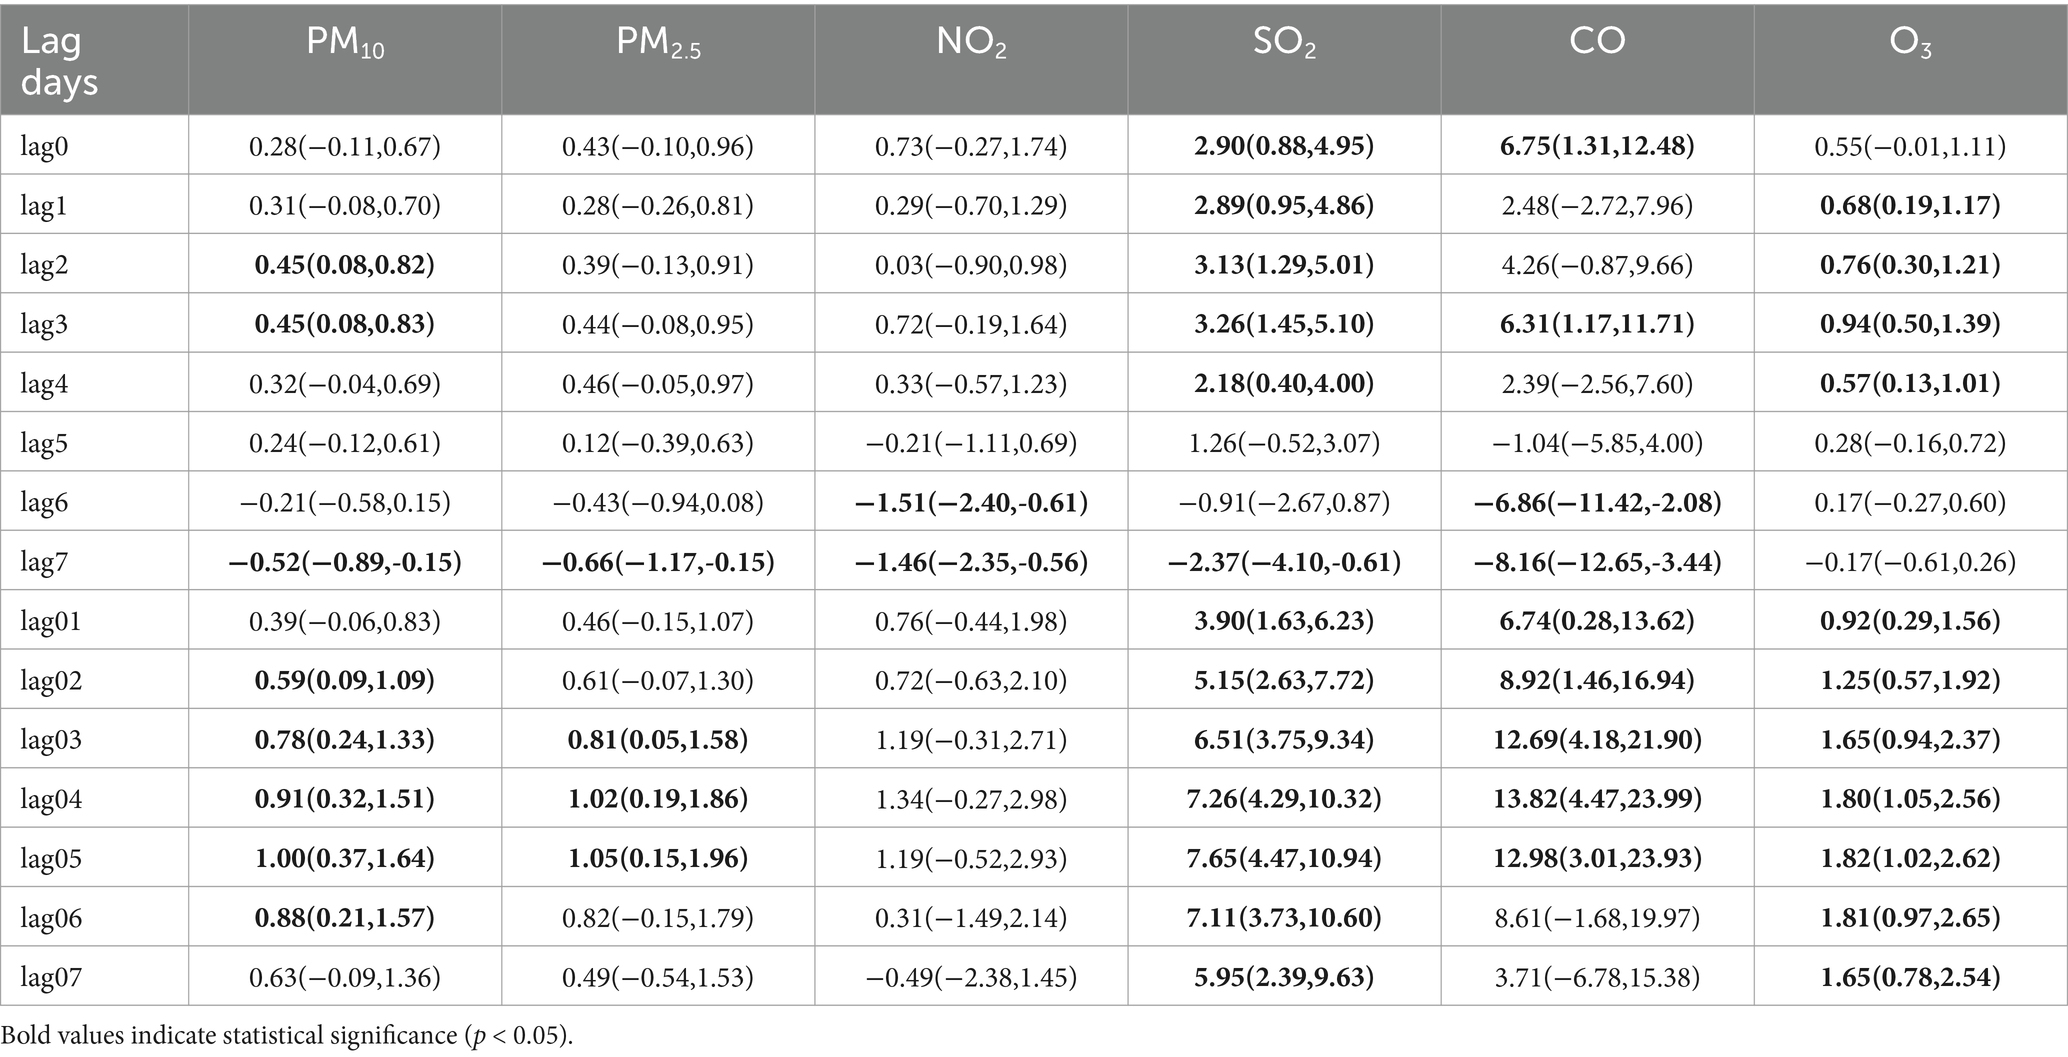
Table 2. Excess relative risk (ER) and 95% confidence interval (CI) of CVD mortality associated with a 10 μg/m3 increment in air pollutant concentration (1 mg/m3 in CO), 2013–2022.
Figure 4 shows ER with 95%CI of CVD mortality associated with air pollutants at different lag times stratified by age. For those aged 20–64 years, PM10, PM2.5, SO2, and CO were significantly positively correlated with CVD mortality. For those over 65 years old, all pollutants except PM2.5 and NO2 had a significant impact on CVD mortality. In our study, during a lag period of 0 to 3 days, the adverse effects of air pollutants (excluding O3) were marginally more pronounced in individuals under the age of 65 compared to those over 65. After a lag period exceeding 3 days, the impact of air pollutants on individuals aged 65 and above was significantly greater.
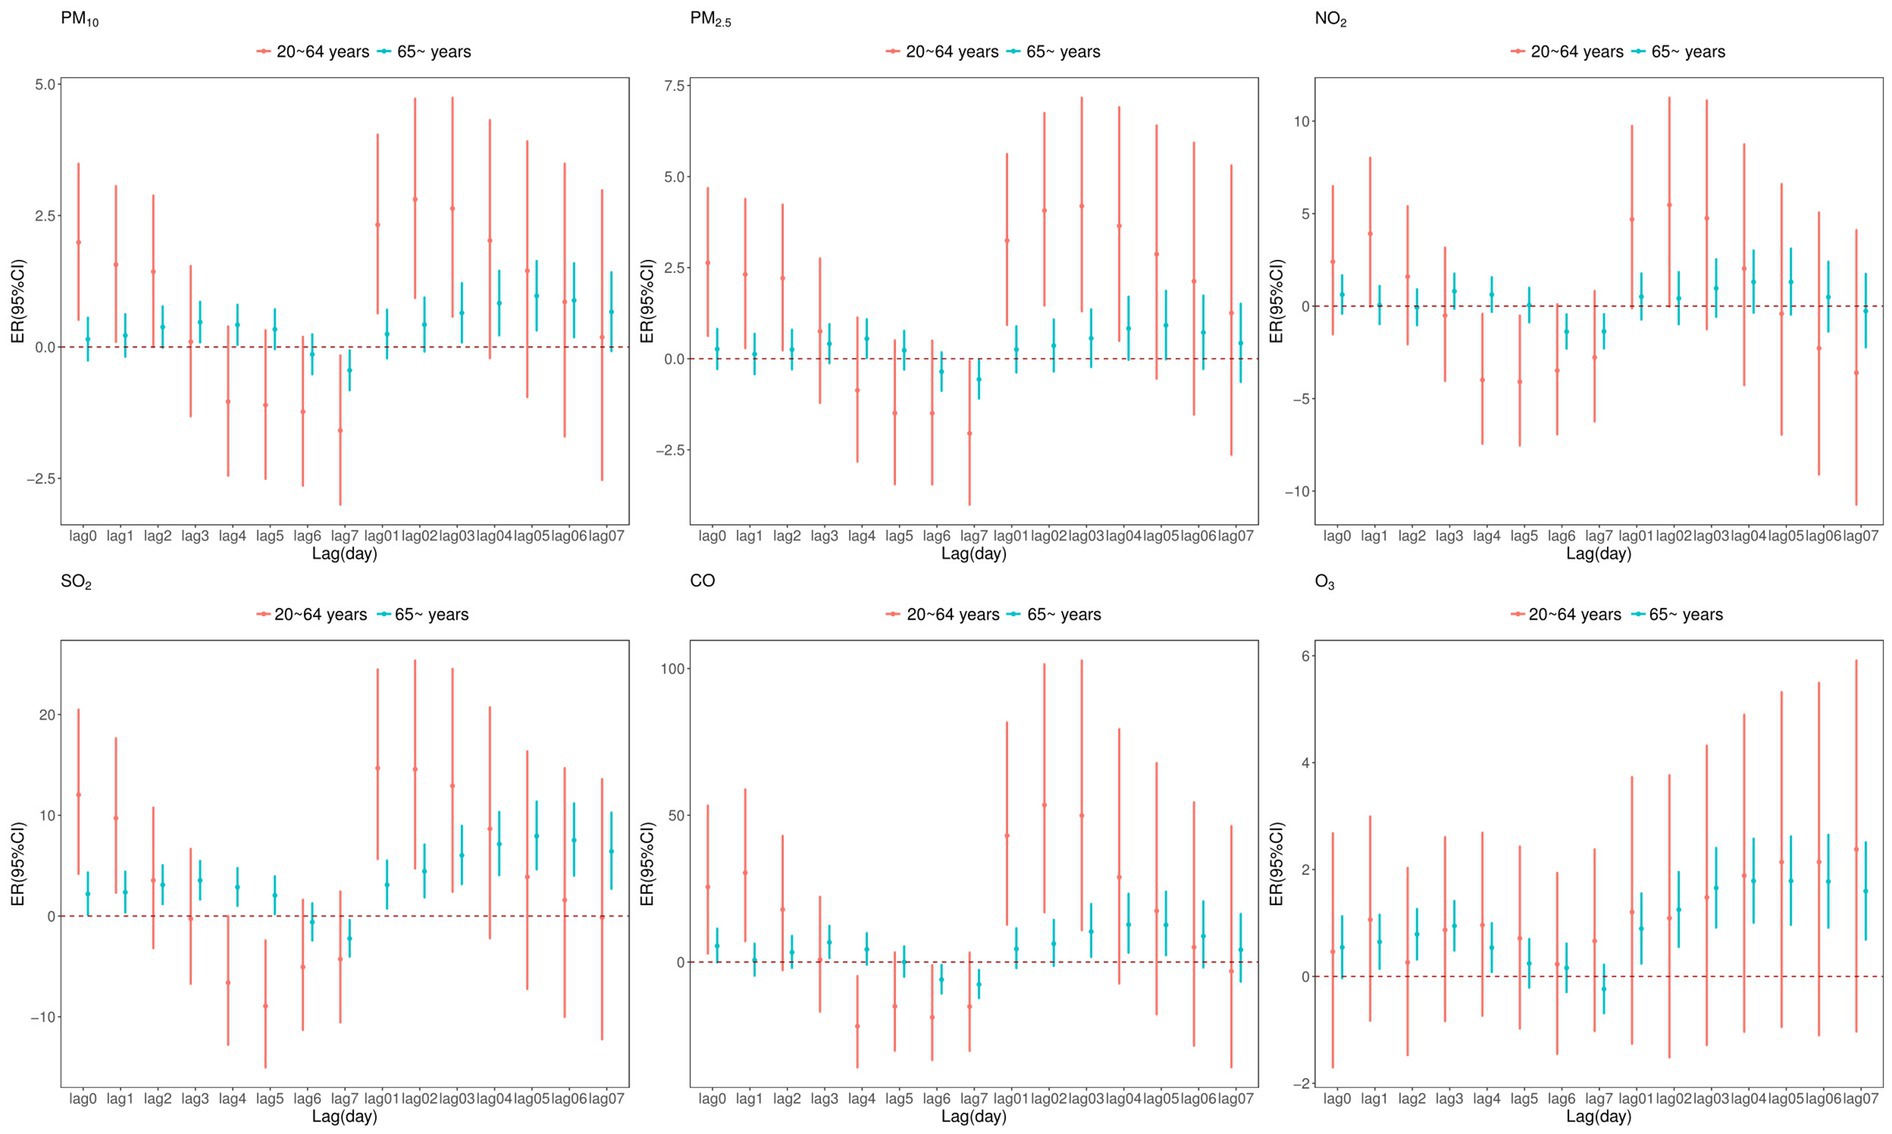
Figure 4. Excess relative risk (ER) and 95% confidence interval (CI) of CVD mortality associated with air pollutants (per 10 μg/m3 increase and 1 mg/m3 increase in CO) at various lags stratified by age in single pollutant model.
Figure 5 presents a gender-stratified analysis of the impact of air pollutants on CVD mortality. The results show that exposure to all pollutants increased the risk of CVD mortality in female, whereas for male, only exposure to SO2, CO and O3 was associated with an increased risk. Furthermore, the effect of air pollution on CVD mortality was more pronounced in female.
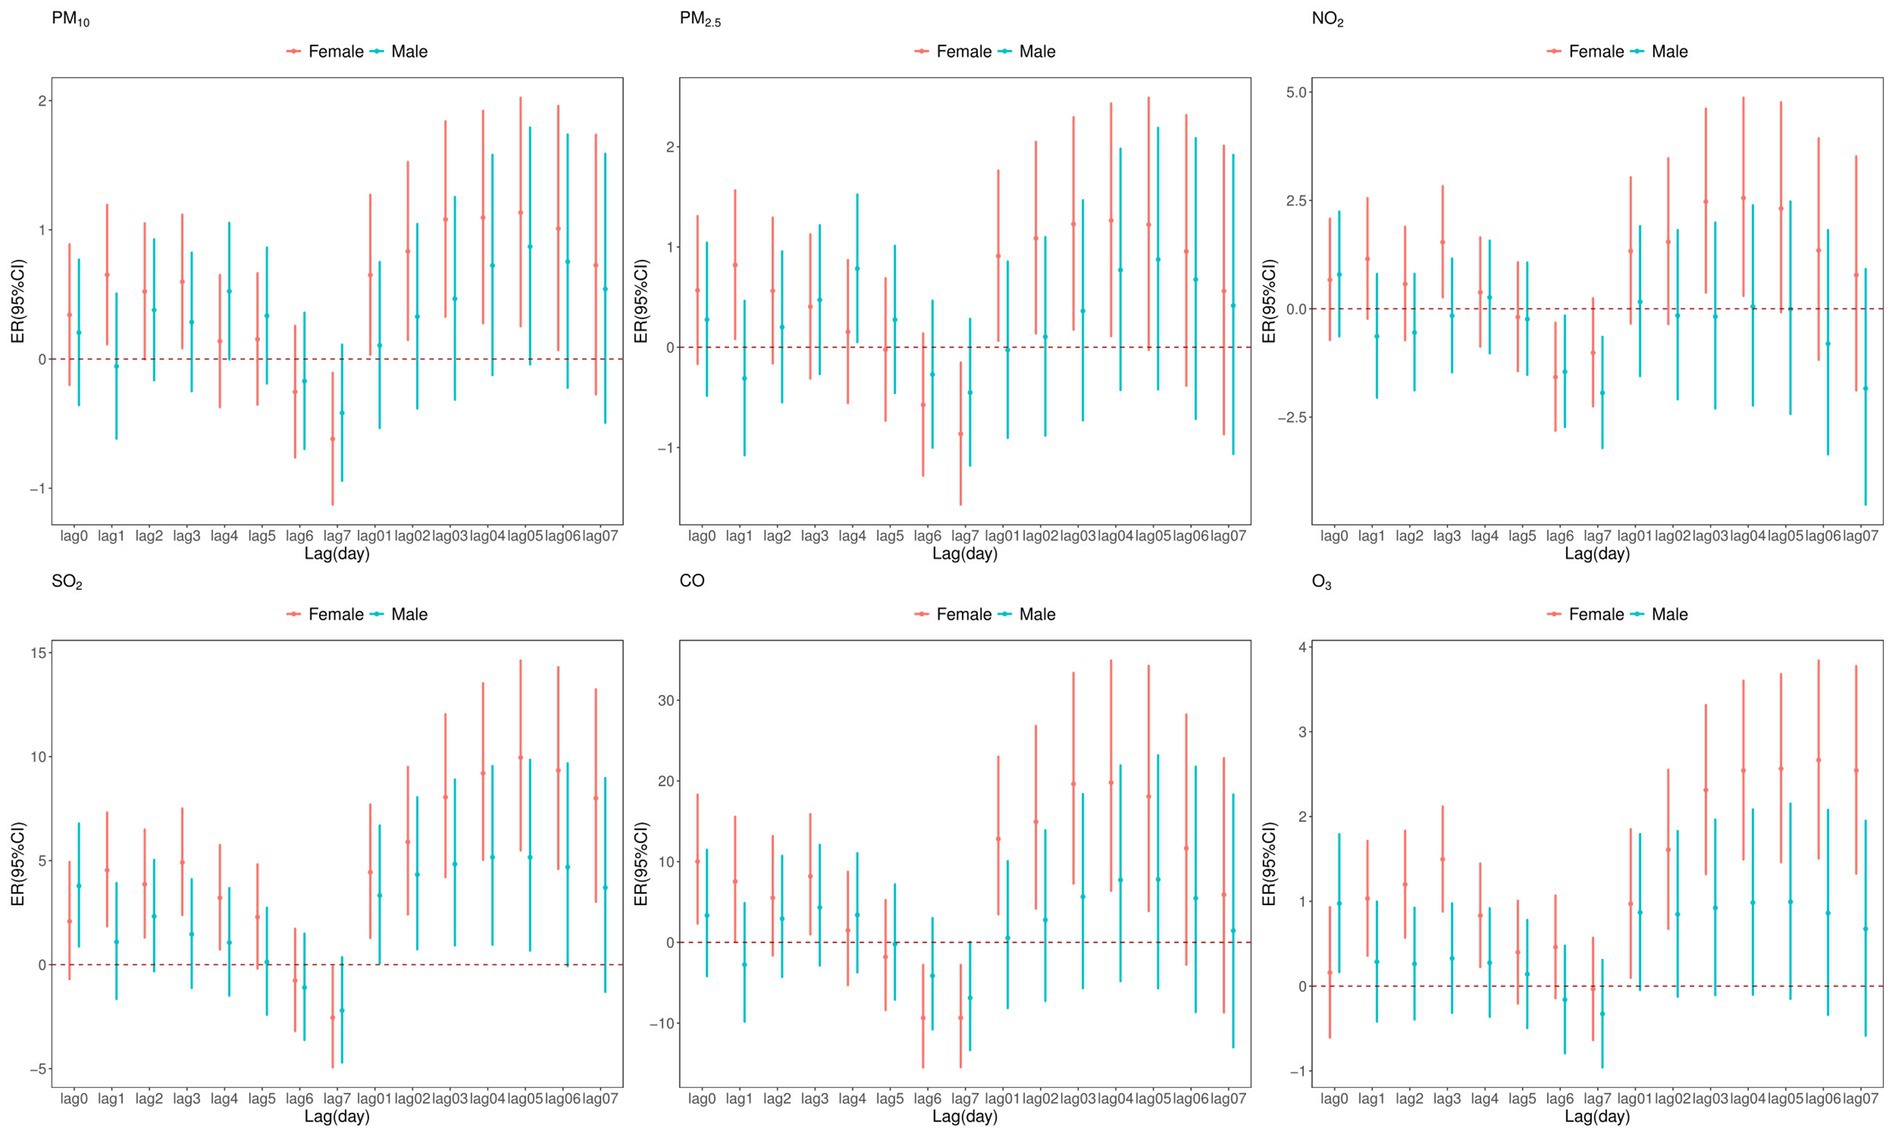
Figure 5. Excess relative risk (ER) and 95% confidence interval (CI) of CVD mortality associated with air pollutants (per 10 μg/m3 increase and 1 mg/m3 increase in CO) at various lags stratified by sex in single pollutant model.
Figure 6 displays exposure-response (E-R) curves between air pollutants and CVD mortality. Overall, these curves exhibited a positive nonlinear trend, indicating that higher exposure to air pollution might be associated with a non-proportional increase in CVD mortality. The E-R curves for PM2.5, PM10, and CO initially exhibited a steady increase at low concentrations, but once they reached a certain level, the curves no longer possessed statistical significance. Conversely, the E-R relationship curves for NO2, SO2, and O3 demonstrated a gradual increase in the initial stages, followed by a rapid growth without threshold once they attained a specific concentration.

Figure 6. Exposure-response curves between air pollutants and CVD mortality.
According to the seasonal stratification analysis (Figure 7, Tables 3, 4), short-term exposure to all pollutants during the warm season was significantly positively correlated with CVD mortality, while only SO2 and CO had a statistically significant adverse effect on CVD mortality during the cold season. The impact of air pollutants on CVD was greater in warm seasons than in cold seasons.
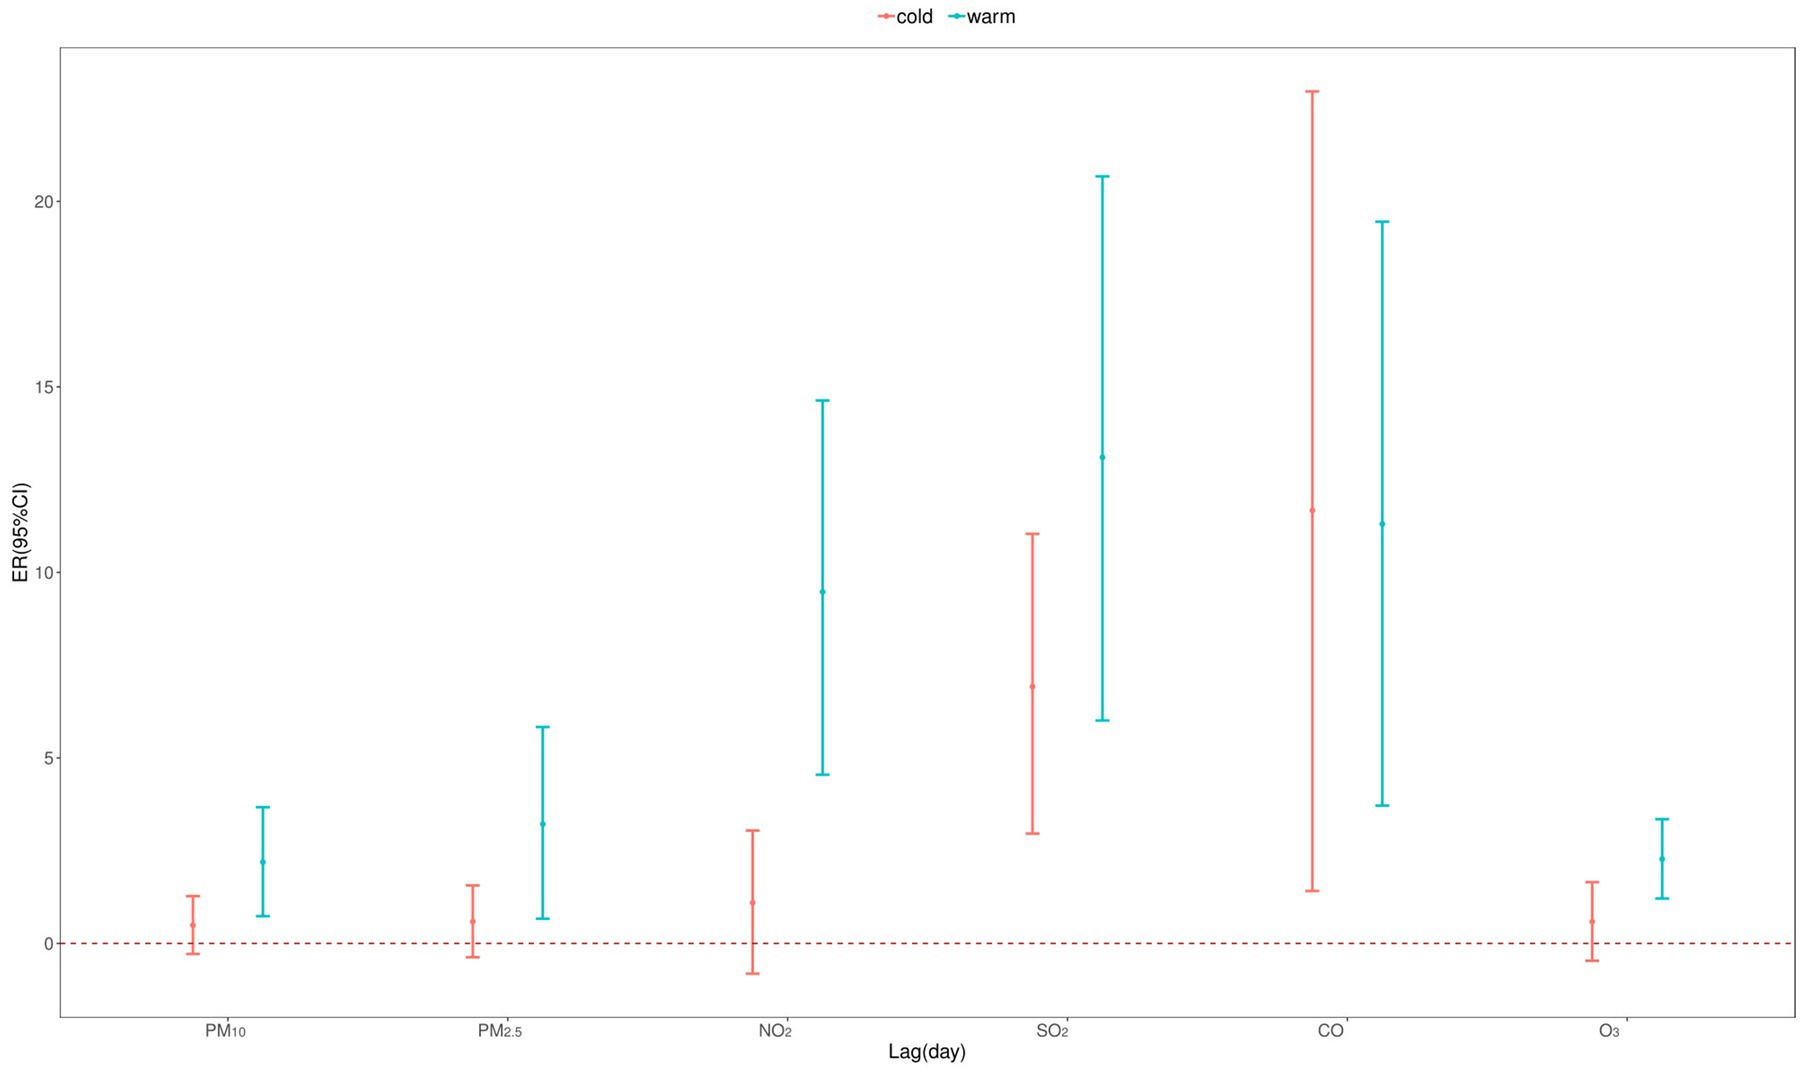
Figure 7. Excess relative risk (ER) and 95% confidence interval (CI) of CVD mortality with an increase of 10 μg/m3 in air pollutants (1 mg/m3 in CO) by season in single pollutant model.
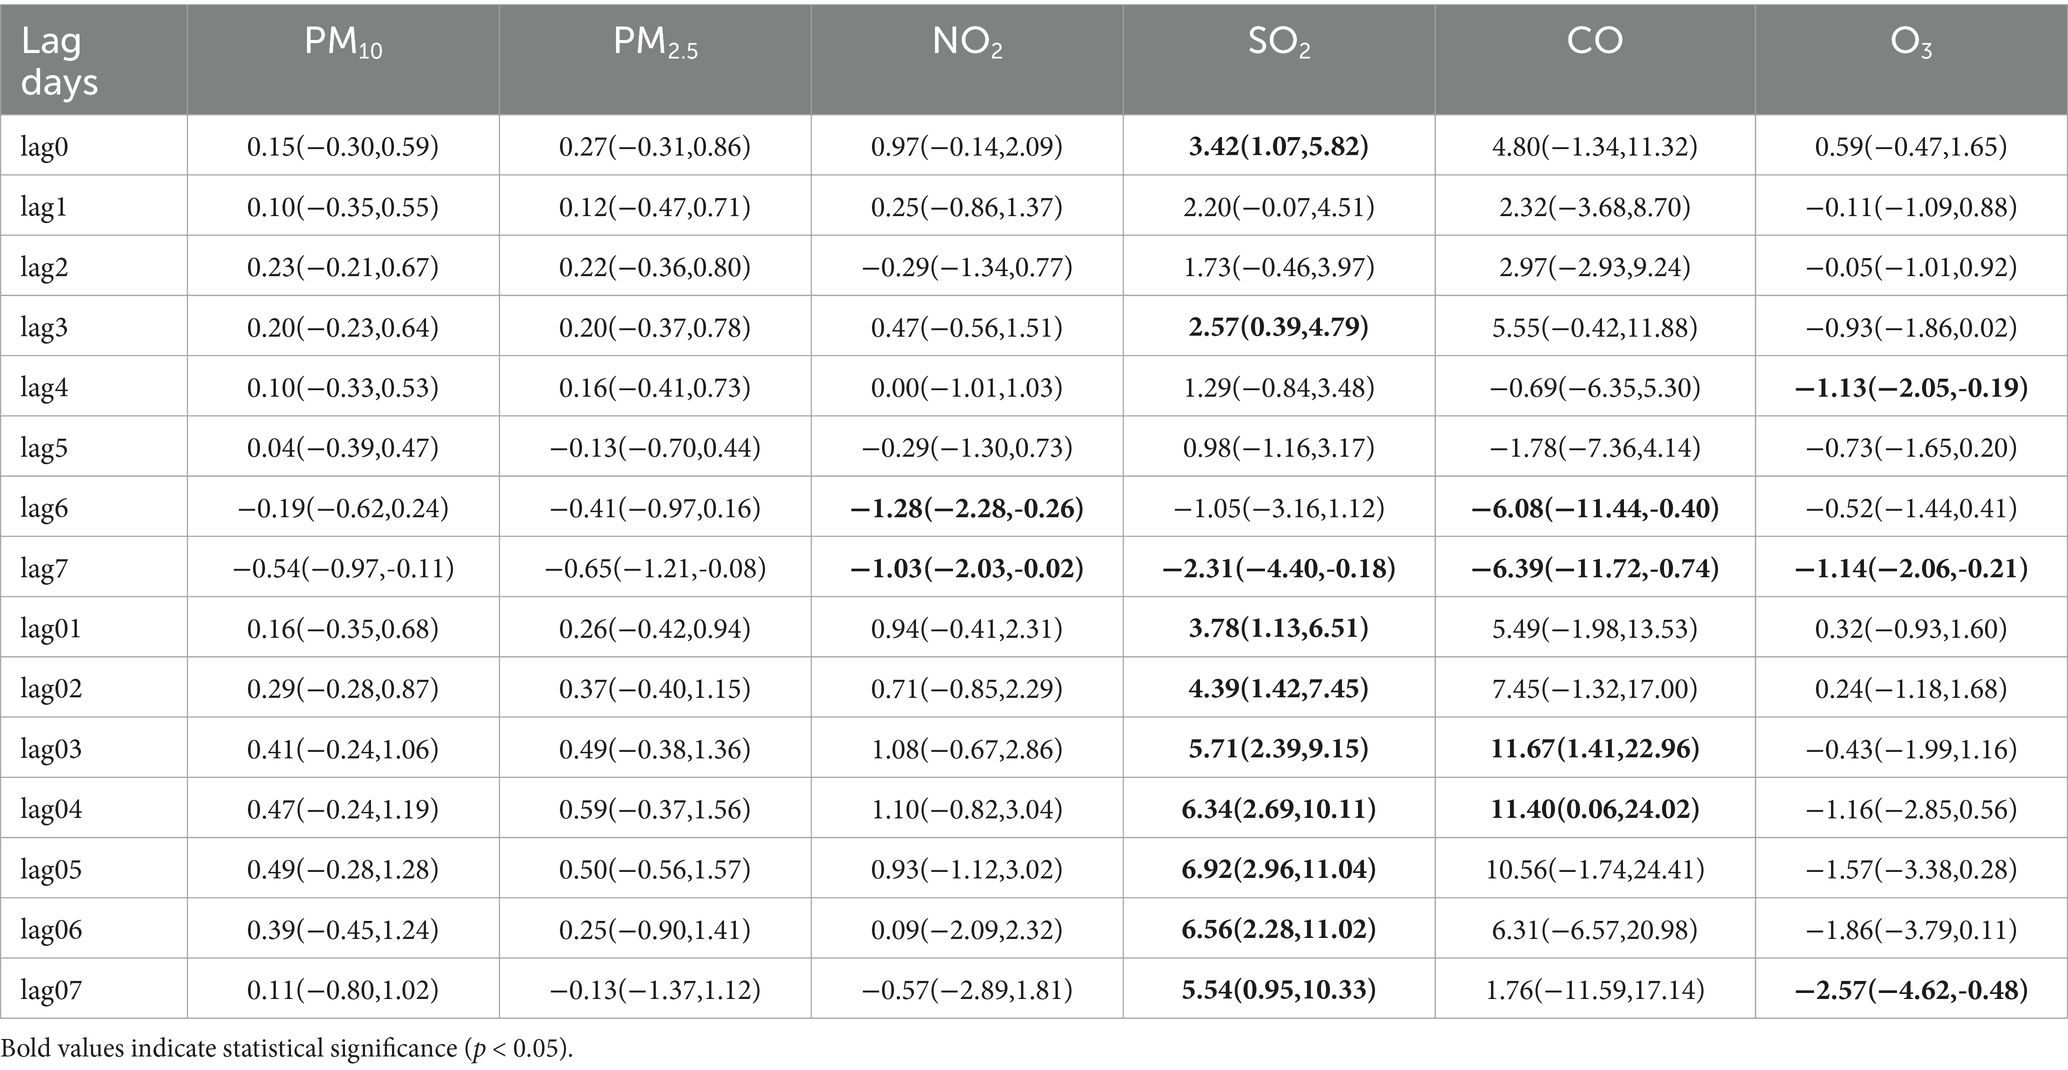
Table 3. ERs (95% CIs) of CVD mortality associated with a 10 μg/m3 increment in air pollutant concentration (1 mg/m3 in CO) in cold season.
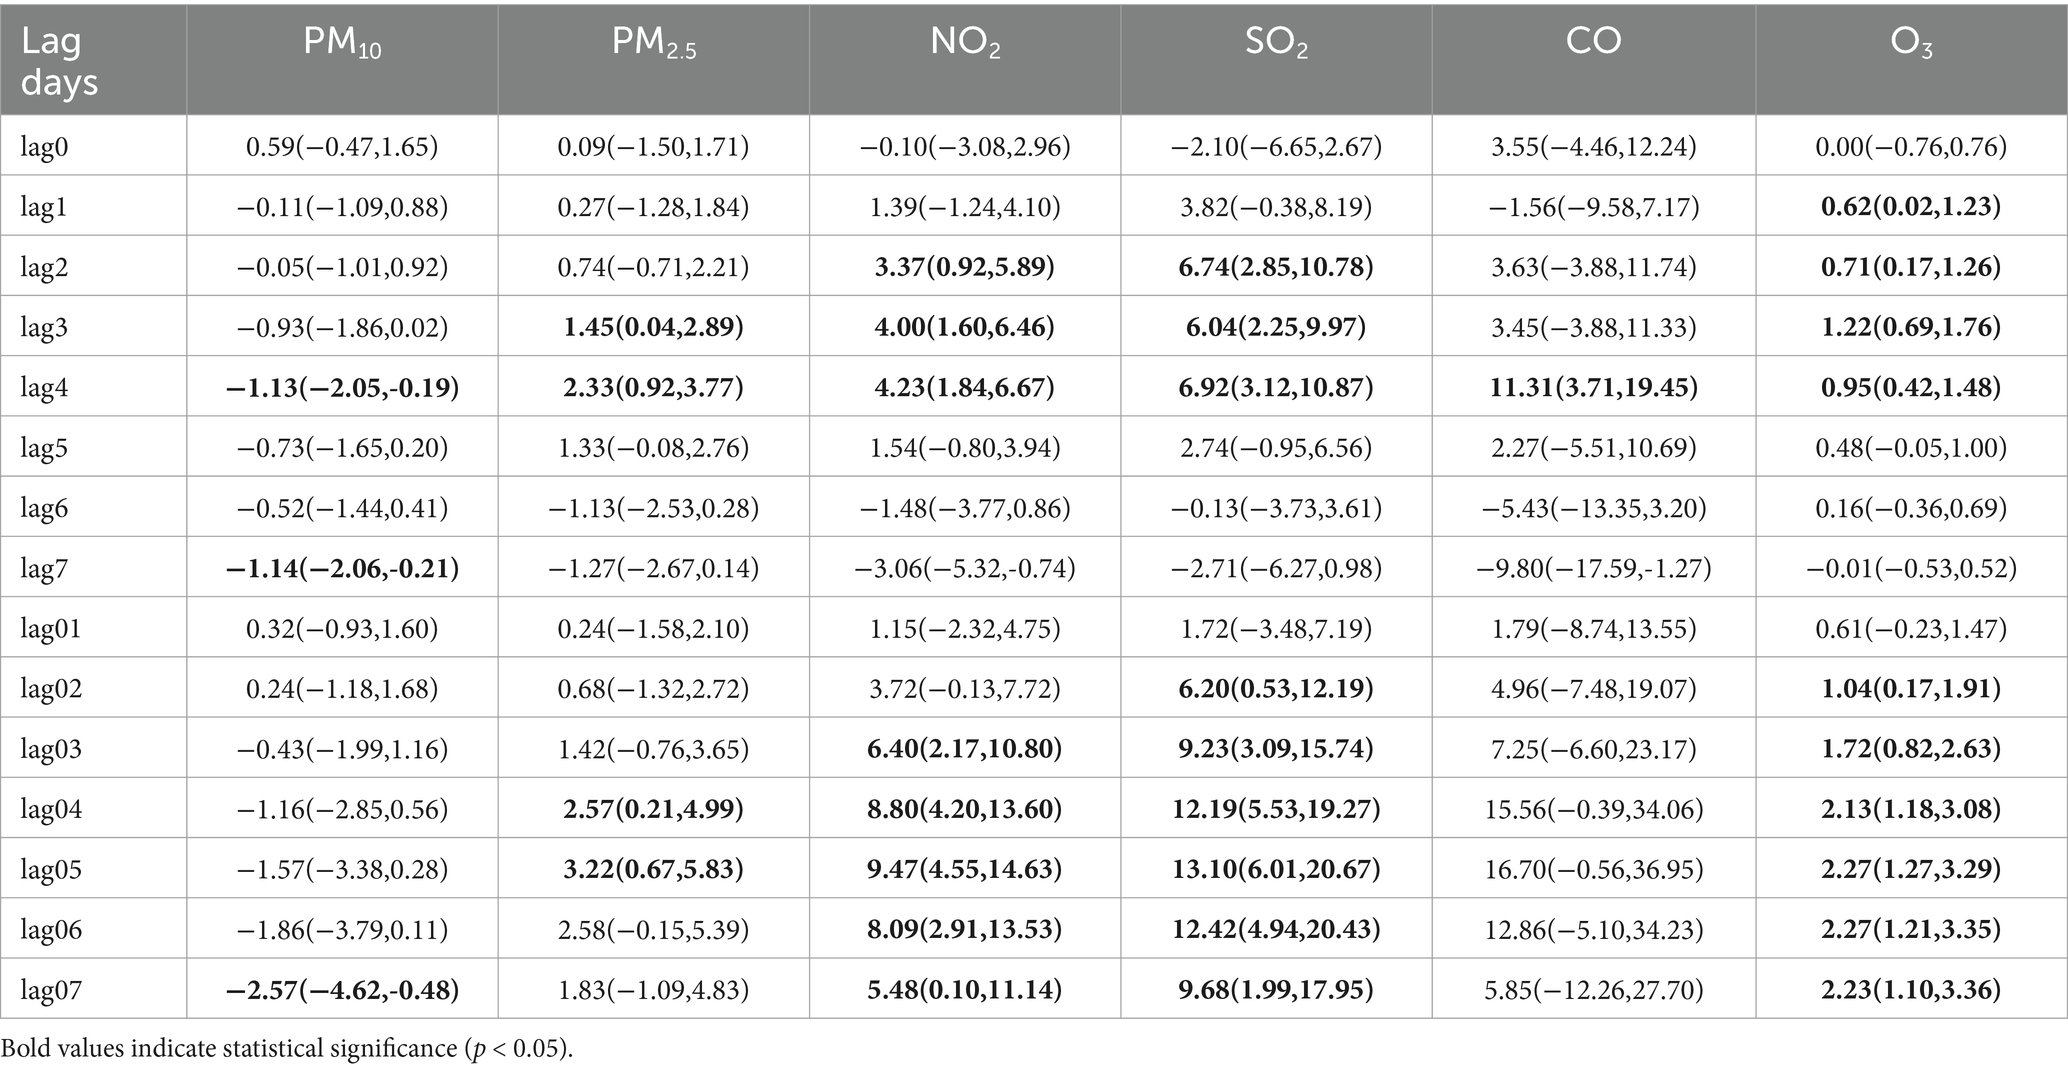
Table 4. ERs (95% CIs) of CVD mortality associated with a 10 μg/m3 increment in air pollutant concentration (1 mg/m3 in CO) in warm season.
3.4 Sensitivity analysis results
After further adjusting the calendar time ( per year) (as shown in the Figure 8), the estimated impact of air pollutants (excluding NO2) on CVD mortality slightly changed, but the effect remained significant.
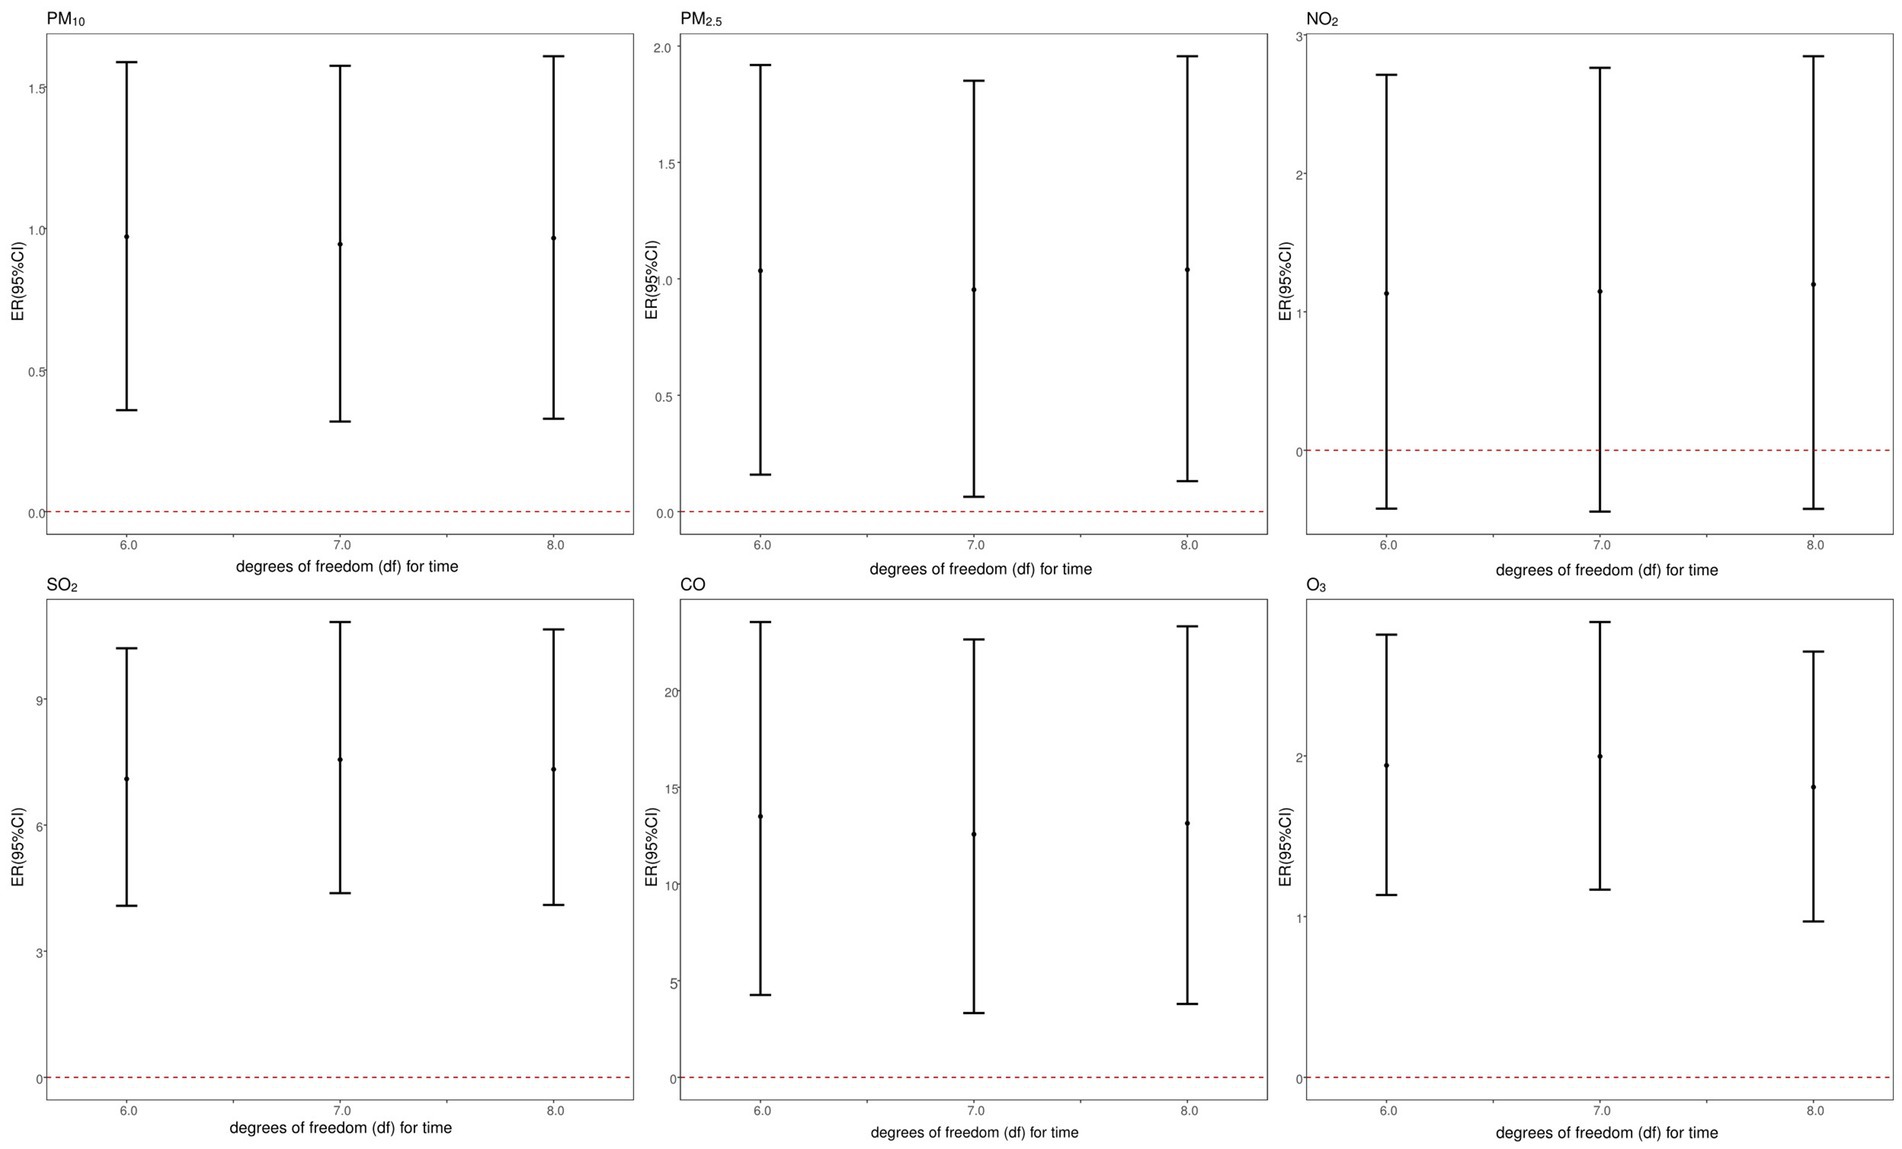
Figure 8. Sensitivity analysis of association between CVD mortality and air pollutants: controlling for different degrees of freedom (df) for time.
The results of the multi-pollutant model are shown in Table 5. The results indicated that the estimated effect of pollutants on CVD mortality changed when additional pollutants were incorporated into the model. After accounting for potential confounding effects from co-pollutants, the effect of SO2 and O3 remained significant, with a slight enhancement in the estimated effect of SO2 and a minor reduction in the estimated effect of O3.
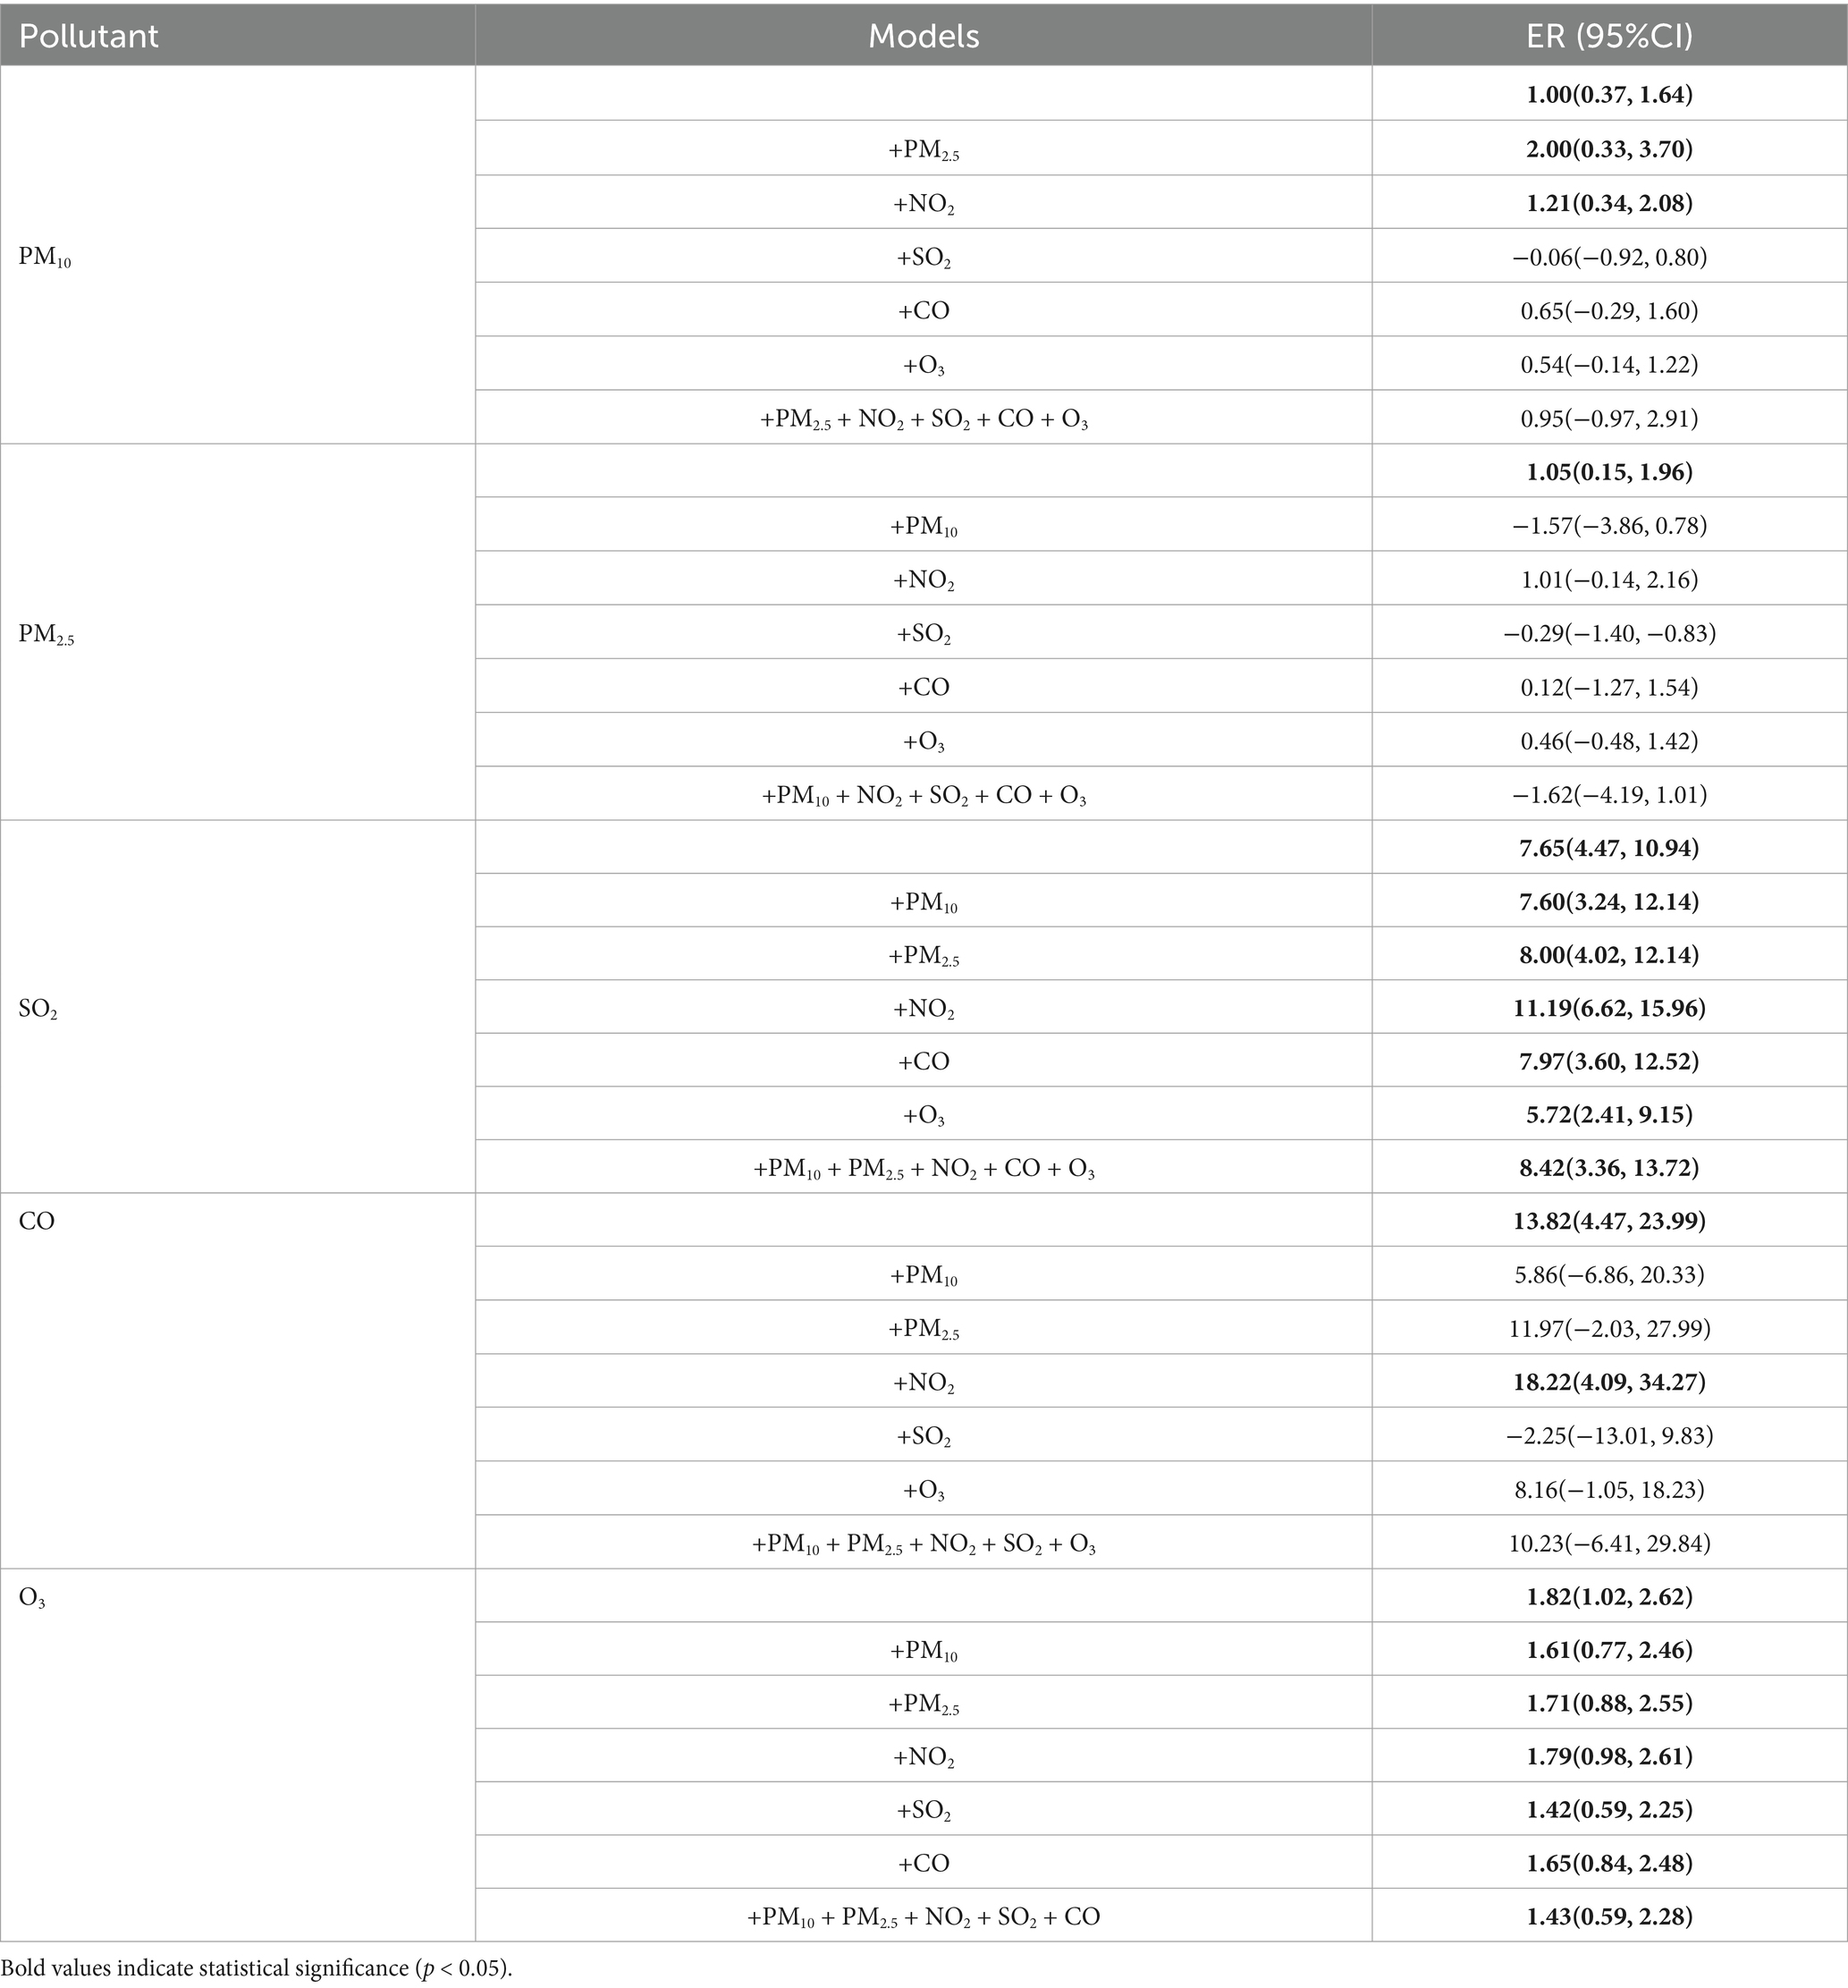
Table 5. ERs (95%CI) for the air pollutants per 10 mg/m3 increase in the concentration for CVD mortality (multi-pollutant model).
4 Discussion
Overall, from January 1, 2013 to December 31, 2022, there were a total of 36,972 CVD deaths in Rudong. We found that air pollutants could increase the risk of CVD mortality, and gaseous pollutants had a greater impact on CVD mortality than particulate matter. For per 10 μg/m3 increase of PM10 (lag 05), PM2.5 (lag 05), SO2 (lag 05), CO (lag 04), and O3 (lag 05) (1 mg/m3 increase of CO), the risk of CVD mortality increased by 1.00, 1.05, 7.65, 13.82, and 1.82%, respectively. The associations between air pollutants and CVD mortality varied by age, gender, and season.
Many studies have investigated the relationship between air pollutants and CVD mortality, yielding mixed results. For instance, a study conducted in Hefei, China, revealed that for every 10 μg/m3 increase in SO2 and NO2 concentrations, the risk of CVD mortality increased by 2.53% (95% CI: 0.86%, 4.21%) and 1.59% (95% CI: 0.15%, 3.04%), respectively (22). A large-scale time-series analysis based on cause-of-death data from 272 cities in China demonstrated that a 10 μg/m3 increase in PM2.5, SO2, NO2, and O3 concentrations corresponded to increases in cardiovascular mortality risk of 0.25, 0.70, 0.90, and 0.27%, respectively (11–14). These findings collectively indicate a significant correlation between air pollutants and CVD mortality. Furthermore, a global time-series study covering 652 cities showed that for every 10 μg/m3 increase in PM10 and PM2.5 concentrations, CVD mortality rose by 0.36% (95% CI: 0.30%, 0.43%) and 0.55% (95% CI: 0.45%, 0.66%), respectively (23). In comparison, our study estimates a relatively larger effect size. Such discrepancies may be attributed to regional variations in pollutant levels, urban development, chemical composition, and demographic characteristics.
Exposure to ambient air pollutants demonstrated a time-lagged association with CVD mortality. In our study, the single-day lag model showed that PM10, SO2, and O3 had the highest risk at lag 3, while the cumulative lag model indicated peak risks for PM2.5, PM10, and SO2 at lag 05. Dabass et al. conducted a study on air pollution in America, from 1999 to 2011, and found that exposure to PM2.5 had the greatest impact on ischemic heart disease and peripheral vascular disease mortality at lag5 (24). A study in Changzhou, China, found that a 0-5 days lag in PM10, SO2, and NO2 concentrations, per interquartile increase, raised ischemic stroke mortality risks by 0.268, 0.34, and 0.263%, respectively (25). A study in Shenzhen showed that both a single-day lag of 4 days and an average lag of 0–4 days presented the highest risks for particulate matter and CVD mortality (26). The differences across various studies may be due to many factors: (1) Variations in the level of air pollutants, composition, and sources may contribute to inconsistent findings. (2) Differences in study designs and analytical approaches could influence results. (3) Variations in population structure, lifestyle, and underlying health conditions might lead to different outcomes.
After incorporating additional pollutants, the effects of air pollutants on CVD mortality were altered. The combination of SO2 with other pollutants was associated with an increased risk of CVD mortality, indicating that interactions among pollutants may amplify their adverse effects. In contrast, after adjusting for co-pollutants, the effect of O3 on CVD mortality was attenuated, potentially due to the opposing trends between O3 and other pollutants. This suggests that pollutant interactions might mitigate the impact on CVD mortality in certain cases.
Our study also identified gender-specific risks. The impact of air pollutants on CVD mortality was more pronounced in female, which was consistent with some previous studies. A time-series study conducted in 16 cities in China found that females have a higher risk of CVD mortality (23), which is consistent with a study in Canada (27). This suggests that females may be more sensitive to air pollution, potentially due to higher prevalence of CVD risk factors, such as hypertension, atrial fibrillation, and diabetes. Additionally, anatomical differences, such as shorter airways, may make females more sensitive to pollutants (28, 29). However, gender differences in air pollution-related CVD mortality remain inconsistent. For example, a study in Rome found PM2.5-related CVD mortality risks in males (30), while a study in Shenzhen, China, reported greater risks in males for SO2, NO2, and PM10 (26). A U.S. cohort study showed that each 10 μg/m3 increase in PM2.5 exposure increased CVD mortality by 10%, with no gender differences (31). These discrepancies may result from variations in population gender ratios, lifestyle habits, and individual characteristics in different regions.
Age stratification analysis revealed that particulate matter had a more substantial impact on CVD mortality in those aged 20–64 years, while gaseous pollutants (SO2, O3) were associated with a significantly higher risk of mortality in those over 65 years of age. Generally, the older adult are considered more vulnerable to air pollution due to weakened physiological resilience and higher prevalence of chronic diseases. A study in Shenzhen found that every increase of one IQR in SO2, NO2, and PM10, the CVD mortality risk in the older adult (65 ~ years) increased by 4.66, 7.56, and 1.70% (26). Similarly, a study in Chile showed that, compared to younger individuals (<65 years), the CVD mortality risk associated with PM10 was more than twice as high in the older adult (32). However, an Iranian study found that individuals <65 years had a higher CVD mortality risk following exposure to air pollution (33). In China, studies conducted in eastern and northeastern regions demonstrated that air pollution disproportionately affected those aged 65 years and older (34, 35). Conversely, a U.S. study reported no significant age-related differences in the effect of PM2.5 exposure on CVD mortality risk (31). The differences in these study results might be attributed to variations in air pollutant concentrations, composition, and sources across different regions, and the specific reasons require further investigation.
We conducted a stratified analysis of the seasonal effects on CVD mortality. The results showed that the association between air pollutants and CVD mortality was stronger in warm season. This is consistent with several previous research findings. A study on public health and air pollution in Asia showed that air pollution posed a greater health risk, particularly for cardiorespiratory mortality, during warm seasons (36). Another study in Nanjing found that O3 exposure during the warm season had a higher impact on CVD mortality (ER: 0.99%, 95% CI: 0.58%, 1.39%)compared to the cold season (ER: 0.96%, 95% CI: 0.37%, 1.56%). Similarly, a Canadian study found that there was no significant association between O3 and CVD mortality during the cold season, but during the warm season, a 10 ppb increase in O3 was associated with a 0.7% (95% CI: 0.2%, 1.1%) increase in circulatory system mortality (27). However, our study found that, due to the influence of coal burning and limited wind dispersion, the concentrations of all air pollutants, except O3, were higher in the cold season and lower in the warm season. This pattern seemed to contradict the results observed in the seasonal stratification analysis. We hypothesize that the differing impacts of air pollutants on CVD mortality across seasons may be attributed to the following factors: (1) Higher humidity and temperatures in warm seasons may influence pollutant dispersion, thereby increasing their impact on CVD mortality. (2) Residents’ activities vary across different seasons. In the region we selected for our study, agriculture and fisheries are well-developed, people tend to work outdoors more during the warm season, increasing their exposure to air pollutants. In contrast, during the cold season, people spend more time indoors, reducing their exposure to outdoor air pollution. This seasonal variation in exposure may be related to the seasonal differences in the impact of air pollution on CVD mortality risk. Understanding these factors can help develop more targeted interventions to reduce the health impacts of air pollution.
A GBD report indicated that between 1990 and 2019, air pollution was one of the leading contributors to the global disease burden (37). According to the report, air pollution was responsible for 12.2 and 11.3% of all deaths among males and females, respectively. It revealed that air quality standards established by the World Health Organization (WHO), Europe, and the United States were stricter compared to those in China. Reducing air pollutant concentrations to levels recommended by the WHO or lower could potentially prevent more deaths. Consequently, tightening China’s air quality standards may yield greater health benefits.
We employed GAM to analyse the relationship between air pollutants and CVD mortality. In addition, our study selected an eastern coastal area of China, which has unique climatic conditions and population characteristics, so this study is of great significance for improving the burden of CVD in coastal areas. This research is an ecological study, examining the relationship between environmental factors and CVD mortality at the population level. However, it lacks individual data. Additionally, the data in this study has certain regional characteristics. Extrapolation of the research results should be cautious. Future research should adopt other methodologies to further clarify the impact of air pollution on CVD mortality.
5 Conclusion
Our study demonstrated that increased levels of air pollutants are associated with a higher risk of death from CVD. The health effects of air pollutants on the cardiovascular system exhibited seasonal variations, with a greater mortality risk during warm seasons compared to cold seasons. Furthermore, the risk of CVD-related death varied across different age and gender groups upon exposure to air pollution. Relevant authorities should enhance their focus on environmental factors, establish early warning systems, and promote public awareness of the health impacts of air pollution. Stricter air quality standards in China could potentially lead to significant improvements in cardiovascular health. These measures hold substantial public health implications for reducing CVD mortality risk.
Data availability statement
The data analyzed in this study is subject to the following licenses/restrictions: the raw data supporting the conclusions of this article will be made available by the authors, without undue reservation. Requests to access these datasets should be directed to Y2FvZXZlbjIwMjFAMTYzLmNvbQ==.
Ethics statement
Ethical approval was not required for the study involving humans in accordance with the local legislation and institutional requirements. Written informed consent to participate in this study was not required from the participants or the participants’ legal guardians/next of kin in accordance with the national legislation and the institutional requirements.
Author contributions
YC: Writing – original draft, Writing – review & editing, Conceptualization, Data curation, Software. XZ: Supervision, Writing – review & editing. ZT: Supervision, Writing – review & editing.
Funding
The author(s) declare that financial support was received for the research and/or publication of this article. This study was supported by the National Natural Science Foundation of China [82373688 and 81773541], and funded by the Priority Academic Program Development of Jiangsu Higher Education Institutions at Soochow University, the State Key Laboratory of Radiation Medicine and Protection [GZK1201919], Jiangsu Key Laboratory of Preventive and Translational Medicine for Geriatric Diseases (KJS2222), and Suzhou Key Laboratory of Neuro-oncology and Nano-bionics (SZZD003). The funding body did not play any role in the design or conduct of this research.
Conflict of interest
The authors declare that the research was conducted in the absence of any commercial or financial relationships that could be construed as a potential conflict of interest.
Generative AI statement
The authors declare that no Gen AI was used in the creation of this manuscript.
Publisher’s note
All claims expressed in this article are solely those of the authors and do not necessarily represent those of their affiliated organizations, or those of the publisher, the editors and the reviewers. Any product that may be evaluated in this article, or claim that may be made by its manufacturer, is not guaranteed or endorsed by the publisher.
References
1. Sierra-Vargas, MP, and Teran, LM. Air pollution: impact and prevention. Respirology. (2012) 17:1031–8. doi: 10.1111/j.1440-1843.2012.02213.x
2. Gu, H, Cao, Y, Elahi, E, and Jha, SK. Human health damages related to air pollution in China. Environ Sci Pollut Res Int. (2019) 26:13115–25. doi: 10.1007/s11356-019-04708-y
3. Anderson, HR. Implications for the science of air pollution and health. Lancet Respir Med. (2017) 5:916–8. doi: 10.1016/s2213-2600(17)30396-x
4. Lelieveld, J, Klingmüller, K, Pozzer, A, Pöschl, U, Fnais, M, Daiber, A, et al. Cardiovascular disease burden from ambient air pollution in Europe reassessed using novel Hazard ratio functions. Eur Heart J. (2019) 40:1590–6. doi: 10.1093/eurheartj/ehz135
5. Roth, GA, Mensah, GA, Johnson, CO, Addolorato, G, Ammirati, E, Baddour, LM, et al. Global burden of cardiovascular diseases and risk factors, 1990-2019: update from the Gbd 2019 study. J Am Coll Cardiol. (2020) 76:2982–3021. doi: 10.1016/j.jacc.2020.11.010
6. In China, T, and Hu, SS. Report on cardiovascular health and diseases in China 2021: an updated summary. J Geriatr Cardiol. (2023) 20:399–430. doi: 10.26599/1671-5411.2023.06.001
7. Gold, DR, and Samet, JM. Air pollution, climate, and heart disease. Circulation. (2013) 128:e411–4. doi: 10.1161/circulationaha.113.003988
8. Tang, H, Huang, J, Lin, H, Zhang, X, Yang, Q, Luo, N, et al. The global burden and biomarkers of cardiovascular disease attributable to ambient particulate matter pollution. J Transl Med. (2025) 23:359. doi: 10.1186/s12967-025-06375-9
9. Hu, X, Knibbs, LD, Zhou, Y, Ou, Y, Dong, GH, and Dong, H. The role of lifestyle in the association between long-term ambient air pollution exposure and cardiovascular disease: a National Cohort Study in China. BMC Med. (2024) 22:93. doi: 10.1186/s12916-024-03316-z
10. Yang, X, Liang, F, Li, J, Chen, J, Liu, F, Huang, K, et al. Associations of long-term exposure to ambient pm(2.5) with mortality in Chinese adults: a pooled analysis of cohorts in the China-par project. Environ Int. (2020) 138:105589. doi: 10.1016/j.envint.2020.105589
11. Chen, R, Yin, P, Meng, X, Wang, L, Liu, C, Niu, Y, et al. Associations between ambient nitrogen dioxide and daily cause-specific mortality: evidence from 272 Chinese cities. Epidemiology. (2018) 29:482–9. doi: 10.1097/ede.0000000000000829
12. Chen, R, Yin, P, Wang, L, Liu, C, Niu, Y, Wang, W, et al. Association between ambient temperature and mortality risk and burden: time series study in 272 Main Chinese cities. BMJ. (2018) 363:k4306. doi: 10.1136/bmj.k4306
13. Yin, P, Chen, R, Wang, L, Meng, X, Liu, C, Niu, Y, et al. Ambient ozone pollution and daily mortality: a Nationwide study in 272 Chinese cities. Environ Health Perspect. (2017) 125:117006. doi: 10.1289/ehp1849
14. Liu, C, Yin, P, Chen, R, Meng, X, Wang, L, Niu, Y, et al. Ambient carbon monoxide and cardiovascular mortality: a nationwide time-series analysis in 272 cities in China. Lancet Planet Health. (2018) 2:e12–8. doi: 10.1016/s2542-5196(17)30181-x
15. Crouse, DL, Peters, PA, Hystad, P, Brook, JR, van Donkelaar, A, Martin, RV, et al. Ambient Pm2.5, O₃, and no₂ exposures and associations with mortality over 16 years of follow-up in the Canadian census health and environment cohort (Canchec). Environ Health Perspect. (2015) 123:1180–6. doi: 10.1289/ehp.1409276
16. Wei, J, and Li, Z (2023). ChinaHighPM10: High-resolution and High-quality Ground-level PM10 Dataset for China (2000–2023). National Tibetan Plateau / Third Pole Environment Data Center. doi: 10.5281/zenodo.3752465
17. Wei, J, and Li, Z (2023). ChinaHighPM2.5: High-resolution and High-quality Ground-level PM2.5 Dataset for China (2000–2023). National Tibetan Plateau / Third Pole Environment Data Center. doi: 10.5281/zenodo.3539349
18. Wei, J, and Li, Z (2023). ChinaHighNO2: High-resolution and High-quality Ground-level NO2 Dataset for China (2008–2023). National Tibetan Plateau / Third Pole Environment Data Center. doi: 10.5281/zenodo.4571660
19. Wei, J, and Li, Z (2023). ChinaHighSO2: High-resolution and High-quality Ground-level SO2 Dataset for China (2013–2023). National Tibetan Plateau / Third Pole Environment Data Center. doi: 10.5281/zenodo.4641538
20. Wei, J, and Li, Z (2023). ChinaHighCO: High-resolution and High-quality Ground-level CO dataset for China (2013–2023). National Tibetan Plateau / Third Pole Environment Data Center. doi: 10.5281/zenodo.4641530
21. Wei, J, and Li, Z (2023). ChinaHighO3: High-resolution and High-quality Ground-level MDA8 O3 Dataset for China (2000–2023). National Tibetan Plateau / Third Pole Environment Data Center. doi: 10.5281/zenodo.10477125
22. Wei, J, Li, Z, Xue, W, Sun, L, Fan, T, Liu, L, et al. (2021). The ChinaHighPM10 dataset: generation, validation, and spatiotemporal variations from 2015 to 2019 across China. Environ. Int 146:106290. doi: 10.1016/j.envint.2020.106290
23. Wei, J, Li, Z, Lyapustin, A, Sun, L, Peng, Y, Xue, W, et al. (2021). Reconstructing 1-km-resolution high-quality PM2.5 data records from 2000 to 2018 in China: spatiotemporal variations and policy implications. Remote Sens. Environ 252:112136. doi: 10.1016/j.rse.2020.112136
24. Wei, J, Li, Z, Cribb, M, Huang, W, Xue, W, Sun, L, et al. (2020). Improved 1 km resolution PM2.5 estimates across China using enhanced space-time extremely randomized trees. Atmos. Chem. Phys. 20:3273–89. doi: 10.5194/acp-20-3273-2020
25. Wei, J, Li, Z, Wang, J, Li, C, Gupta, P, and Cribb, M (2023). Ground-level gaseous pollutants (NO2, SO2, and CO) in China: daily seamless mapping and spatiotemporal variations. Atmos. Chem. Phys. 23:1511–32. doi: 10.5194/acp-23-1511-2023
26. Wei, J, Li, Z, Li, K, Dickerson, R, Pinker, R, Wang, J, et al. (2022). Full-coverage mapping and spatiotemporal variations of ground-level ozone (O3) pollution from 2013 to 2020 across China. Remote Sens. Environ 270:112775. doi: 10.1016/j.rse.2021.112775
27. Shin, HH, Parajuli, RP, Maquiling, A, and Smith-Doiron, M. Temporal trends in associations between ozone and circulatory mortality in age and sex in Canada during 1984-2012. Sci Total Environ. (2020) 724:137944. doi: 10.1016/j.scitotenv.2020.137944
28. Ugalde-Resano, R, Riojas-Rodríguez, H, Texcalac-Sangrador, JL, Cruz, JC, and Hurtado-Díaz, M. Short term exposure to ambient air pollutants and cardiovascular emergency department visits in Mexico City. Environ Res. (2022) 207:112600. doi: 10.1016/j.envres.2021.112600
29. Redline, S, and Gold, D. Challenges in interpreting gender differences in asthma. Am J Respir Crit Care Med. (1994) 150:1219–21. doi: 10.1164/ajrccm.150.5.7952543
30. Cesaroni, G, Badaloni, C, Gariazzo, C, Stafoggia, M, Sozzi, R, Davoli, M, et al. Long-term exposure to Urban air pollution and mortality in a cohort of more than a million adults in Rome. Environ Health Perspect. (2013) 121:324–31. doi: 10.1289/ehp.1205862
31. Thurston, GD, Ahn, J, Cromar, KR, Shao, Y, Reynolds, HR, Jerrett, M, et al. Ambient particulate matter air pollution exposure and mortality in the Nih-Aarp diet and health cohort. Environ Health Perspect. (2016) 124:484–90. doi: 10.1289/ehp.1509676
32. Cakmak, S, Dales, RE, and Vidal, CB. Air pollution and mortality in Chile: susceptibility among the elderly. Environ Health Perspect. (2007) 115:524–7. doi: 10.1289/ehp.9567
33. Khajavi, A, Khalili, D, Azizi, F, and Hadaegh, F. Impact of temperature and air pollution on cardiovascular disease and death in Iran: a 15-year follow-up of Tehran lipid and glucose study. Sci Total Environ. (2019) 661:243–50. doi: 10.1016/j.scitotenv.2019.01.182
34. Liu, M, Xue, X, Zhou, B, Zhang, Y, Sun, B, Chen, J, et al. Population susceptibility differences and effects of air pollution on cardiovascular mortality: epidemiological evidence from a time-series study. Environ Sci Pollut Res Int. (2019) 26:15943–52. doi: 10.1007/s11356-019-04960-2
35. Xu, J, Geng, W, Geng, X, Cui, L, Ding, T, Xiao, C, et al. Study on the association between ambient air pollution and daily cardiovascular death in Hefei, China. Environ Sci Pollut Res Int. (2020) 27:547–61. doi: 10.1007/s11356-019-06867-4
36. Wong, CM, Vichit-Vadakan, N, Kan, H, and Qian, Z. Public health and air pollution in Asia (papa): a multicity study of short-term effects of air pollution on mortality. Environ Health Perspect. (2008) 116:1195–202. doi: 10.1289/ehp.11257
Keywords: cardiovascular disease, air pollutants, excess deaths, time-series study, generalized additive model, coastal area
Citation: Cao Y, Zhou X and Tang Z (2025) Association between exposure to air pollutants and cardiovascular disease mortality in coastal area of eastern China. Front. Public Health. 13:1543602. doi: 10.3389/fpubh.2025.1543602
Edited by:
Tianfeng He, Ningbo Municipal Center for Disease Control and Prevention, ChinaReviewed by:
Xuesong Yang, China Academy of Safety Sciences and Technology, ChinaNurzawani Md Sofwan, Universiti Teknologi MARA Sarawak Branch, Malaysia
Copyright © 2025 Cao, Zhou and Tang. This is an open-access article distributed under the terms of the Creative Commons Attribution License (CC BY). The use, distribution or reproduction in other forums is permitted, provided the original author(s) and the copyright owner(s) are credited and that the original publication in this journal is cited, in accordance with accepted academic practice. No use, distribution or reproduction is permitted which does not comply with these terms.
*Correspondence: Zaixiang Tang, dGFuZ3p4QHN1ZGEuZWR1LmNu; Xiaoyun Zhou, emhvdXhpYW95dW42QDE2My5jb20=