 Miquel Porta1,2,3,4,5,6*‡
 José Pumarega1,2,3
 Ruth Aguilar7,8
 David Prieto-Merino9
 Laura Campi2,3Cristina Rius3,6,10Judit Villar-García2
 Marta Vidal7,8,11
 Alfons Jimenez7,8,11Antonio Peña9Miguel-Ángel Muñoz6,12Leonardo Trasande4,13,14Francisco Bolúmar9,15
 Gemma Moncunill7,8,11†Magda Gasull2,3,6
 Carlota Dobaño7,8,11†
- 1School of Medicine, Universitat Autònoma de Barcelona, Barcelona, Spain
- 2Hospital del Mar Research Institute (IMIM), Barcelona, Spain
- 3CIBER de Epidemiología y Salud Pública (CIBERESP), Barcelona, Spain
- 4Division of Environmental Pediatrics, School of Medicine, New York University, New York, NY, United States
- 5Department of Epidemiology, Gillings School of Global Public Health, University of North Carolina at Chapel Hill, Chapel Hill, NC, United States
- 6Universitat Pompeu Fabra, Barcelona, Spain
- 7ISGlobal, Barcelona, Spain
- 8Facultat de Medicina i Ciències de la Salut, Universitat de Barcelona (UB), Barcelona, Spain
- 9University of Alcalá de Henares, Madrid, Spain
- 10Agència de Salut Pública de Barcelona, Barcelona, Spain
- 11CIBER de Enfermedades Infecciosas (CIBERINFEC), Barcelona, Spain
- 12Institut Universitari per a la Recerca a l’Atenció Primària de Salut Jordi Gol’, Catalan Institute of Health, Barcelona, Spain
- 13Department of Population Health, New York University, New York, NY, United States
- 14New York University Wagner School of Public Service, New York, NY, United States
- 15City University of New York, New York, NY, United States
Background: From a public health perspective it is remarkable that there are yet no longitudinal studies in the general population investigating the influence of the basal immune state, measured before the pandemic, on the risk of SARS-CoV-2 infection and COVID-19.
Objective: To investigate the specific and combined effects of personal levels of cytokines and immunoglobulins—measured in individuals’ blood 4 years before the pandemic—on the risk of SARS-CoV-2 infection and COVID-19 in a general population.
Methods: We conducted a prospective cohort study in 240 individuals from the general population of Barcelona. Thirty cytokines and 31 immunoglobulins were quantified in prepandemic serum samples (collected in 2016–17) by high-throughput multiplex quantitative suspension array technology.
Results: Higher concentrations in 2016–17 of IL-8 and TNF-α significantly decreased the risk of SARS-CoV-2 seropositivity in 2020–21, whereas higher concentrations of MIP-1α were a risk factor for seropositivity. Most cytokines in mixtures with IL-8, MIP-1α, TNF-α or G-CSF were associated with SARS-CoV-2 seropositivity (all OR ≥2.0 or OR≤0.4 and p < 0.05). The five individual isotype-antigen pairs more clearly associated with seropositivity were: protectively, IgG to CMV pp150, IgG to CMV pp65, and IgG to N OC43; and, increasing risk of seropositivity, IgM to CMV pp65 and IgM to EBV EA-D. The four cytokines most consistently associated with the risk of COVID-19 were also G-CSF, IL-8, TNF-α, and MIP-1α. The four isotype-antigen pairs more strongly associated with risk of COVID-19 (all protective) were IgA to CMV pp65 and N 229E, and IgG to EBV EAD and VCAp18.
Conclusion: The unique longitudinal design of this study, with measurements before and during the pandemic in a general population, provides novel knowledge on the protective and detrimental effects of specific individual cytokines and immunoglobulins, and their mixtures, on the risk of SARS-CoV-2 seropositivity and COVID-19. If confirmed, findings would be significantly relevant for medicine and public health.
1 Introduction
The basal immune state represents the baseline level of immune activity and preparedness against an infeccion or other immune stimuli, and encompasses the innate and acquired immune systems. The innate immune system acts as a general first line of defense against pathogens, while the acquired immune sytem develops specific response to pathogens, both playing a pivotal role in determining the body’s response to infections. Interrelated with each person’s characteristics, health status, past exposures, lifestyle, and living conditions, the basal immune state is a key factor to help explain a phenomenon that was evident during the COVID-19 pandemic, and which remains partly unexplained: the wide heterogeneity in immunological and clinical responses to SARS-CoV-2 infection (1–8). Today, for instance, the capacity of pre-existing immunity to human common coronaviruses (HCoV) to crossprotect against de novo COVID-19 is still largely unknown.
Investigating the impact of the basal immune state on the susceptibility to SARS-CoV-2 is crucial to advance our understanding of COVID-19 dynamics and to improve outcomes. In spite of these evidences, there are yet no longitudinal studies investigating the influence of the basal immune state measured before the pandemic on the risk of SARS-CoV-2 infection (defined by a positive rRT-PCR or seropositivity to one or several viral antigens) and development of COVID-19 (symtomatology due to the infection): thus far, virtually all studies on levels of cytokines and immunoglobulins, and SARS-CoV-2 infection and COVID-19 have been conducted with biological samples collected during the pandemic, in individuals—likely exposed to SARS-CoV-2, infected, or ill, often severely—who sought medical attention in health facilities. Hence, such studies could only assess the role of cytokines and immunoglobulins as markers of disease severity and prognosis, not as co-etiologic factors (6, 9, 10). To ensure a proper time sequence, assessing the possible influence of basal cytokine and immunoglobulin levels on the risk of SARS-CoV-2 infection and COVID-19 requires that such biomarkers were measured before the pandemic outbreak.
Therefore, the present study aimed to investigate the specific and combined effects of personal levels of cytokines and immunoglobulins—measured in individuals’ blood 4 years before the pandemic—on the risk of SARS-CoV-2 infection and COVID-19 in the general population of Barcelona.
2 Methods
2.1 Study population
The present prospective cohort study was based on the Barcelona Health Survey (BHS) of 2016, whose methods have been described in detail (6, 7, 11, 12). The BHS generated a sample representative of the general, adult, non-institutionalized population of the city of Barcelona (Spain). Through face-to-face interviews, the survey collected information about sociodemographic factors, chronic disorders, life styles, uses of healthcare services and preventive practices. At the end of the 2016 BHS interview, participants were offered to take part in a health examination, and 240 individuals accepted. Subsequently, between July 2016 and May 2017, a nurse interviewed again face-to-face such individuals, measured body parameters, and collected blood and urine samples (6, 11). Participants had been asked to fast for at least 8 h before blood extraction. Blood was collected in a vacuum system tube and centrifuged for 15 min x 3000 rpm at 4°C to obtain serum, which was divided in 1–3 mL aliquots and stored at −80°C (6, 11). The prepandemic levels of the cytokines and immunoglobulins assessed in the present report were analyzed in such serum samples (see sections 2.3., 2.4., and 2.5. below).
After scientific, financial and logistic preparations, the 240 participants began to be invited to a follow-up visit in October 2020, in a severe phase of the pandemic, and 174 (72.5%) attended between November 2020 and June 2021 (6). Thus, for the present analyses our study spans from 2016 to 17, when the baseline interviews and collection of biological samples first took place, to 2020–21, when the follow-up visit and collection of biological samples took place again. During the follow-up visit a nurse measured their weight, height. She also collected a nasopharyngeal swap, and new blood and urine samples, which constitute a crucial scientific resource of the present cohort study to analyze immunological components of the SARS-CoV-2 infection. The median time between the extraction of biological samples in 2016–17 and 2020–21 was 4.1 years. Compared to the 66 subjects who did not attend the follow-up visit, the 174 participants were more commonly women, younger, born in Catalonia, with a lower body mass index (BMI), more affluent, and with better self-perceived health (6). The main analyses reported in the present paper are based on 154 individuals (72 men, 82 women) who had not received any COVID-19 vaccine at the time of the follow-up visit (i.e, excluding 20 participants who had received a COVID-19 vaccine). Characteristics of participants have been published in Table 1 of Ref. (6).
The Ethics Committee of the Parc de Salut Mar reviewed and approved the study protocols, and all participants signed an informed consent before sample collection and completing questionnaires (11). All methods were performed in accordance with the relevant guidelines and regulations.
2.2 Socioeconomic and living conditions
Shortly before the follow-up visit in 2020–2021, the participants completed an online survey concerning signs and symptoms of COVID-19, diagnostic tests performed and their results, use of healthcare services, and vaccination, all during the previous months of the pandemic. This information was ascertained as well with the data base of the System of Diseases of Mandatory Reporting of the Agency of Public Health of Barcelona, and of the Public Data Analysis for Health Research and Innovation Program of Catalonia (PADRIS) of the Catalan Agency for Health Quality and Evaluation (AQUAS). The PADRIS databases contain detailed records on demographics, diagnoses of all medical conditions and comorbidities, laboratory results, medications dispensed by pharmacies, visits to Primary Care physician, procedures, and medical admissions from public hospitals for the whole population of Catalonia. This data was used to complement information collected during the study (8). During follow-up the study also collected information on participants’ lifestyle and living conditions during the pandemic. During the visit, the nurse clarified answers to the online survey and asked further questions on vaccination, weight changes, and pregnancies. A household outdoor index was computed taking into account the number of individuals living in the same household, the availability and use of an outdoor space. Other factors included in the online survey were: work conditions, use of public and private transport, and individual measures taken to avoid infection (6, 7).
2.3 Quantification of cytokines, chemokines and growth factors
The Cytokine Human Magnetic 30-Plex Panel from Invitrogen™ was used to measure concentrations (pg/mL) of the following 30 cytokines, chemokines and growth factors in serum samples collected in 2016–17 (thus, prepandemic) (8, 13, 14): epidermal growth factor (EGF), fibroblast growth factor (FGF), granulocyte colony-stimulating factor (G-CSF), granulocyte-macrophage colony-stimulating factor (GM-CSF), hepatocyte growth factor (HGF), vascular endothelial growth factor (VEGF), tumor necrosis factor (TNF), interferon (IFN)-α, IFN-γ, interleukin (IL)-1RA, IL-1β, IL-2, IL-2R, IL-4, IL-5, IL-6, IL-7, IL-8, IL-10, IL-12(p40/p70), IL-13, IL-15, IL-17, IFN-γ induced protein (IP-10), monocyte chemoattractant protein (MCP-1), monokine induced by IFN-γ (MIG), macrophage inflammatory protein (MIP)-1α, MIP-1β, regulated on activation normal T cell expressed and secreted (RANTES) and eotaxin. Each assay plate included 16 serial dilutions (2-fold) of a standard curve, and two blank controls. Samples were acquired on a Luminex 100/200 instrument and analyzed in xPONENT software 3.1. The concentration of each analyte was obtained by interpolating the median fluorescent intensity (MFI) to a 5-parameter logistic regression curve and reported as pg./mL using the drLumi R package. Limits of quantification (LOQ) were estimated based on cutoff values of the 30% coefficient of variation (CV) of the standard curve for each analyte (13). When the value of an analyte was below the lower LOQ (lLOQ), the mid-value of this limit for the corresponding laboratory plate was assigned; and when a value was above the corresponding upper LOQ (uLOQ), the assigned value was twice this uLOQ. Limits of quantification, percentages of quantification, and concentrations obtained for each cytokine have been published in Supplementary Table 1 and Table 1 of Ref. (8).
2.4 Serology of viral exposures
The levels of IgM, IgA and IgG against the Nucleocapsid (N) protein of the 4 human common cold coronavirus (HCoV-229E, OC43, NL63, HKU1), two Epstein–Barr virus (EBV) antigens (EA-D, VCA p18), and two Cytomegalovirus (CMV) antigens (pp65, pp150), were assessed by high-throughput multiplex quantitative suspension array technology (qSAT) in a FlexMap3D instrument as previously described, and data QA/QC and preprocessing were performed with R (8, 15). Briefly, antigen-coupled beads were added to a 384-well μClear® flat bottom plate in multiplex. A hyper-immune plasma pool at 3-fold 10 serial dilutions starting from 1:250 was used as positive control in each assay plate for QA/QC and calibration purposes. Final dilution of test samples was 1:500. To quantify IgA and IgM, samples and controls were pre-treated with anti-human IgG (Gullsorb) at 1:10 dilution, to avoid IgG interferences. MFI was reported for each isotype-antigen pair. Levels of each immunoglobulin have been published in Table 4 of Ref. (8).
2.5 Quantification of total immunoglobulins
The quantification of total immunoglobulins (IgE, IgA, IgM, IgG1, IgG2, IgG3, and IgG4) was performed with the Antibody Isotyping 7-Plex Human ProcartaPlex™ panel (Thermo Fisher Scientific, Vienna, Austria) following the manufacturer’s instructions. Samples were tested at a dilution of 1/200000 and a second dilution of 1/500000, acquired on a Luminex 100/200 instrument and analyzed in xPONENT software 3.1. The concentration of each isotype was obtained by interpolating the MFI to a 5-parameter logistic regression curve and reported as μg/mL (8). The analyses of the present report use the levels of total immunoglobulins obtained with the dilution of 1/200000. The IgG1 and the IgG3 were not quantified in 1.7 and 20.8% of serum samples, respectively, and imputations of the missing values were based on the levels obtained by the second dilution. We computed the arithmetic sum of levels of the four total IgG subclasses (IgG1, IgG2, IgG3, and IgG4) (8).
Intraindividual changes in cytokines and immunoglobulins between 2016–17 and 2020–21 were moderate, and similar between participants who in 2020–21 were SARS-CoV-2 seropositive and seronegative, and between participants who did and did not develop COVID-19 (8). The similarity suggests that it is valid to use the prepandemic levels of cytokines and immunoglobulins to assess the risk relationship (protective or harmful) of these basal immune markers with the development of SARS-CoV-2 seropositivity and COVID-19, which is the main object of the present paper.
2.6 Determination of SARS-CoV-2 infection and COVID-19
2.6.1 SARS-CoV-2 infection
SARS-CoV-2 infection was determined at the Center for Genomic Regulation (CRG) in all 174 members of the cohort who attended the follow-up visit in 2020–2021 by real time reverse-transcriptase polymerase chain reaction (rRT-PCR) in nasopharyngeal swabs. Briefly, samples were collected in 600 μL of lysis solution (DNA/RNA Shield, Zymo) to inactivate the virus, break membranes and stabilize the RNA. Samples were processed in a TECAN Dreamprep robot to isolate the RNA using the Quick-DNA/RNA Viral MagBead kit (Zymo; #R2140), and the purified RNA was analyzed by rRT-PCR in a ABI 7900 HT (384 wells) following the CDC standard procedure. Positive and negative controls were included in each assay plate. Among the 174 participants, there were 4 rRT-PCR-positives (6).
To detect previous SARS-CoV-2 infections, antibody serological status of each participant was assessed in serum samples analyzed at the ISGlobal Immunology Laboratory in Barcelona. The MFI levels of IgG, IgM and IgA against 5 SARS-CoV-2 antigens were assessed by high-throughput multiplex qSAT (5, 6, 16), as described in section 2.4 for the other viral exposures. The five antigens from SARS-CoV-2 were the Spike (S) protein and the Receptor Binding Domain (RBD; both fused with C-terminal 6xHis and StrepTag purification sequences and purified from supernatant of lentiviraltransduced CHO–S cells cultured under a fed-batch system), the S1 (aa1–681, expressed in Expi293 and His tag-purified), the S2 subunit (purchased from SinoBiologicals), the Nucleocapsid full length protein (NFL), and its C-terminal (NCt; expressed in E. coli and His tagpurified) (6, 7, 16).
Of the 154 participants mentioned above, 41 were SARS-CoV-2 seropositive (26.6%) at the time of the follow-up visit in 2020–21 (including all 4 positives by the follow-up rRT-PCR), 9 indeterminate (5.8%), and 104 seronegative (67.5%). There were no major differences in the main characteristics of seropositive and seronegative participants [Supplementary Table 5 of Ref. (6)].
2.6.2 COVID-19
Cases of COVID-19 have been described in detail (6, 7). In total there were 20 cases of COVID-19 at the time of the follow-up visit in 2020–21. All were seropositive for SARS-CoV-2 in our immunological assay, all reported COVID-19 related symptoms, and 2 of them had been hospitalized. Specifically, 10 cases provided information of a positive diagnostic test for SARS-CoV-2 infection (including all 4 positives at the follow-up rRT-PCR), and 2 or more COVID-19 related signs or symptoms; 2 were diagnosed of COVID-19 by a physician; and 8 had COVID-19 related signs or symptoms (6, 7, 17). There were no major differences in the main characteristics of participants with and without COVID-19 [Table 1 of Ref. (6)].
2.7 Statistical analyses
Univariate and multivariate analyses were performed as customary (8, 18). Levels of cytokines and immunoglobulins were initially categorized as tertiles. Cut-off points for tertiles were based on the distribution of the levels in the 240 participants [see Tables 1, 4 in Ref. (4)]. Some cytokines and immunoglobulins were also dichotomized if no linear dose–response was apparent in tertile analyses, or if cell size was small, and in the absence of substantive knowledge on a normal or natural cutpoint (6, 7). Cytokine and immunoglobulin levels were also analyzed as continuous variables base 10 log-transformed (8).
The main effects of each biomarker of interest (cytokines and immunoglobulins) were independently explored in base models including the inflammatory and immunological single-biomarker in each separate model, and potential confounders (data on the latter drawn from our online follow-up survey, personal interviews, and follow-up visit, see 2.1. and 2.2. above) (6, 7, 18). To assess the effects of mixtures of cytokines and immunoglobulins, mutually adjusted for, we built multi-biomarker regression models and selected groups of 2 to 6 biomarkers that had been significant in their single-biomarker models; we selected mixtures in which all or most elements showed associations with the outcome. The clinical and epidemiological literature on cytokines and immunoglobulins, and SARS-CoV-2 infection and COVID-19 was also considered when building these multi-biomarker models (8). For instance, because a recent report found that high serum levels of IL-6, IL-8 and TNF-α concentrations at the time of hospitalization were strong and independent predictors of survival in hospitalized patients with COVID-19 (9), we also built multi-biomarker models with the combinations of these three cytokines to analyze their combined effect on the risk of the SARS-CoV-2 infection and COVID-19.
To assess the magnitude of the associations, odds ratios (OR) between levels of the biomarkers of inflammation and of immunological status, and the two outcomes (SARS-CoV-2 seropositivity and COVID-19), with their corresponding 95% confidence intervals (CI) were computed through unconditional logistic regression (18). For the SARS-CoV-2 analyses, the 9 participants with indeterminated SARS-CoV-2 seropositivity were excluded. ORs were adjusted for age, sex, tobacco smoking, BMI, education, the household outdoor index or other socioeconomic variables if such potentially confounding variables fulfilled pre-established criteria: p ≤ 0.5 to enter the model and p ≤ 0.25 to remain in it in a stepwise procedure. To assess significance, we considered the magnitude of the association (e.g., OR ≥2.0 or OR≤0.4), the precision of the effect estimate, and the statistical significance (e.g., p < 0.05 or p < 0.15) (6, 7, 18, 19). While in tables we provide a wide spectrum of positive and negative results (i.e., suggesting potential associations as well as lack of association, as in Table 1), in Figures 1, 2 we represent a summary of findings (increasing or decreasing risks, blanks showing no associations), and in the main text of the Results section we focus only on the most significant associations based on the criteria just mentioned.
Table 1. Effect of individual cytokine levels measured in 2016–17 on the risk of SARS-CoV-2 seropositivity in 2020–21 (N = 145)*.
Figure 1. Graphical summary of results and relationships between cytokines measured in 2016–17 and the risk of SARS-CoV-2 seropositivity and COVID-19 disease in 2020–21. A protective effect (OR<1) is shown by greens. An increased risk (OR>1) is shown by reds. The size of the circle is determined by the magnitude of the OR. The intensity of the color of the circle is determined by the magnitude of the p-value. A: Logistic regression with each cytokine dichotomous (based on analyses whose results are summarized in Tables 1, 6). B: Logistic regression with each cytokine continuous (based on analyses whose results are summarized in Tables 1, 6). C: Logistic regression, mixture of cytokines (circles are based on all multivariate models, a selection of which is shown in Tables 2, 7). D: Logistic regression, mixture of cytokines and immunoglobulins (circles are based on all multivariate models, a selection of which is shown in Tables 5, 10). E: Linear regression with each cytokine continuous. F: Linear regression for censored data. G: Quasi-binomial generalized linear regression. See Methods (2.7. Statistical analyses).
Figure 2. Graphical summary of results and relationships between immunoglobulins measured in 2016–17 and the risk of SARS-CoV-2 seropositivity and COVID-19 disease in 2020–21. A protective effect (OR<1) is shown by greens. An increased risk (OR>1) is shown by reds. The size of the circle is determined by the magnitude of the OR. The intensity of the color of the circle is determined by the magnitude of the p-value. A: Logistic regression with each immunoglobulin dichotomous (based on analyses whose results are summarized in Tables 3, 8). B: Logistic regression with each immunoglobulin continuous (based on analyses whose results are summarized in Tables 3, 8). C: Logistic regression, mixture of immunoglobulins (circles are based on all multivariate models, a selection of which is shown in Tables 4, 9). D: Logistic regression, mixture of immunoglobulins and cytokines (circles are based on all multivariate models, a selection of which is shown in Tables 5, 10). E: Linear regression with each immunoglobulin continuous. See Methods (2.7. Statistical analyses).
In addition, to complement the previous strategies of analysis, we estimated three other types of regression models: (1) a linear regression with each cytokine (in the log 10 scale) as the continuous response and the seropositivity (or COVID-19) as the main explanatory variable, including in the models the corresponding adjustment covariables; (2) to account for quantification limits, we repeated the previous linear regression analysis with regression methods for censored data using the NADA2 library in R (20); and (3) we normalized the cytokine values as a proportion between 0 and 1 of the limits of quantification (value-lLOQ) / (uLOQ–lLOQ), and compared these proportions between the two groups of SARS-CoV-2 infection (seropositive and seronegative), and of COVID-19 (with and without the disease), respectively, with a quasi-binomial generalized linear regression, including as well the corresponding adjustment covariables (21). The main results of these three complementary regression models are shown in columns E to G of Figure 1 and column E of Figure 2.
All tests were two-tailed. Statistical analyses were conducted using R, version 4.3.3 (Boston, MA, 2024), and SPSS version 22.0.0.0 (IBM SPSS Statistics, Armonk, NY, 2013).
3 Results
3.1 Effects of baseline immune markers on SARS-CoV-2 seropositivity
Higher concentrations in 2016–17 of IL-8 and TNF-α showed some significant associations with a decreased risk of SARS-CoV-2 seropositivity in 2020–21, whereas higher concentrations of MIP-1α were a risk factor for seropositivity (Table 1). Thus, for instance, participants with IL-8 levels in the upper tertile were 70% less likely to be seropositive (OR = 0.30, 95% CI: 0.12–0.76); and participants with MIP-1α in the upper tertile were 2.5-times more likely to be seropositive (OR = 2.52, 95% CI: 1.15–5.50). Besides these three cytokines, there was little or no evidence of an association between seropositivity and any of the other 27 cytokines individually (Figure 1, columns 1. A and 1. B).
Most cytokines in mixtures with IL-8, TNF-α, MIP-1α or G-CSF were associated with SARS-CoV-2 seropositivity (Table 2, models 1a, 1b, 2a, 3a, 3b; Figure 1, column 1. C). In most of these multi-biomarker models, IL-8, TNF-α, and G-CSF had an OR≤0.4, while MIP-1α had an OR≥2.0 (all p < 0.05).
Table 2. Influence of mixtures of cytokines on the risk of SARS-CoV-2 seropositivity (N = 145)*.
Generally, complementary models (Figure 1, columns 1. E to 1. G; Supplementary Table 1.1) were coherent with logistic regression models for IL-8, TNF-α, G-CSF, MIP-1α, and IL-17 (Figure 1, columns 1. A to 1. D).
The five individual isotype-antigen pairs more clearly associated with SARS-CoV-2 seropositivity were: protectively, IgG to CMV pp150, IgG to CMV pp65, and IgG to N OC43; and increasing risk of seropositivity, IgM to CMV pp65 and IgM to EBV EA-D (Table 3; Supplementary Table 2; Figure 2, columns 1. A and 1. B). Mixtures of all these five isotype-antigen pairs were also associated with seropositivity (Table 4; Figure 2, columns 1. C and 1. D). Thus, participants whose IgG N OC43 levels in 2016–17 were in the upper tertile were 70% less likely to be SARS-CoV-2 seropositive in 2020–21 (OR = 0.30; Table 4, models 1a and 1b; Figure 2, column 1. C); participants with IgG CMV pp65 levels in the upper tertiles were between 65 and 61% less likely to be seropositive (ORs between 0.35 and 0.39; Table 4, models 5a and 5b); and participants with IgM CMV pp65 in the upper tertiles were near 3-times more likely to be seropositive (Table 4, models 4a and 4b).
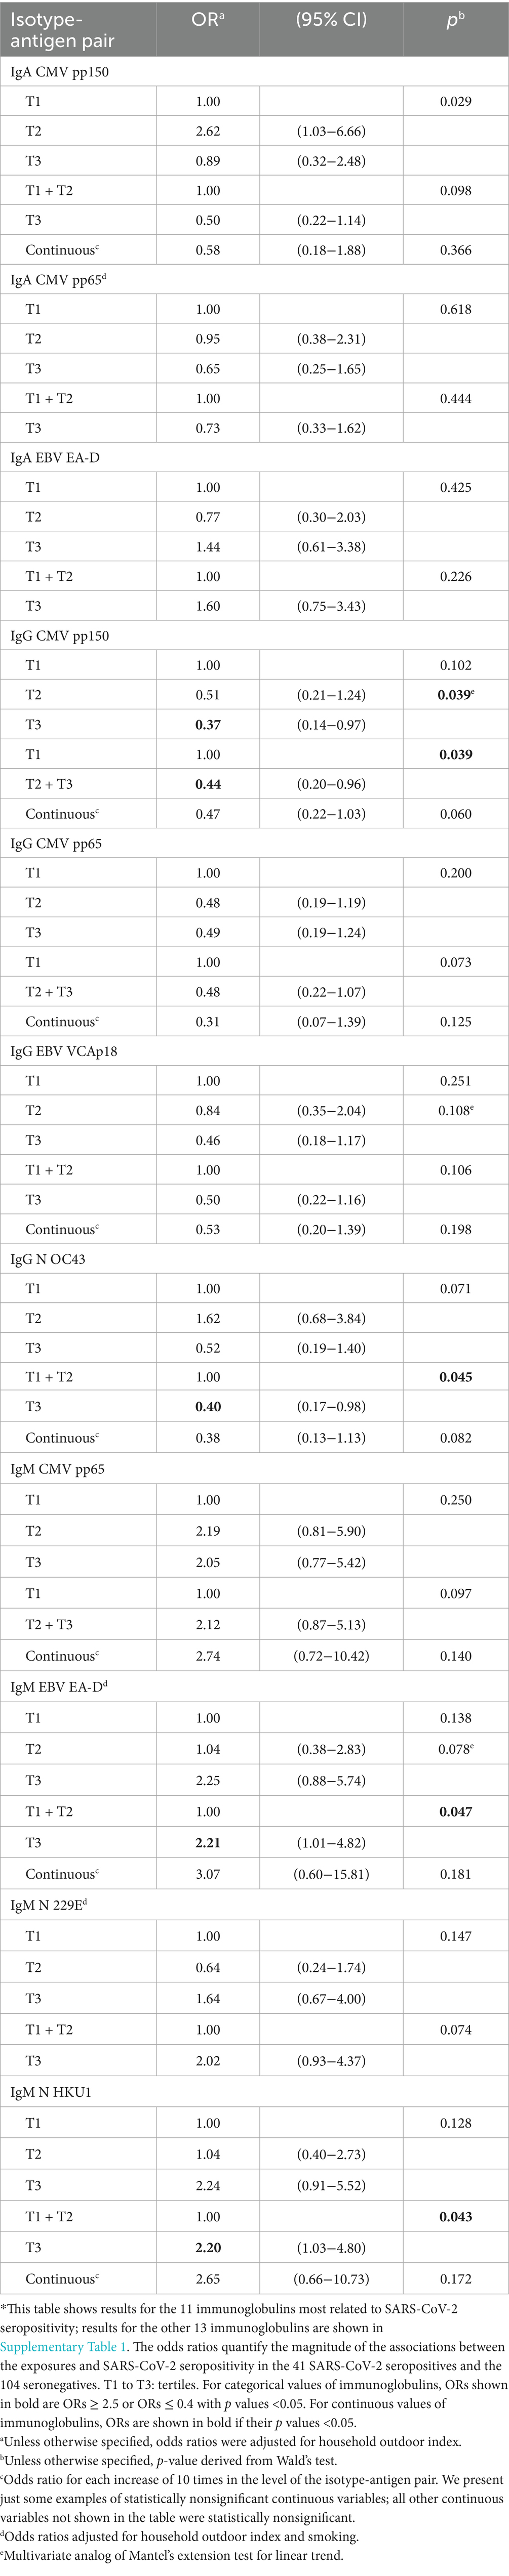
Table 3. Effect of selected individual isotype-antigen pairs for cytomegalovirus, Epstein–Barr virus, and common cold infections measured in 2016–17 on the risk of SARS-CoV-2 seropositivity in 2020–21 (N = 145)*.
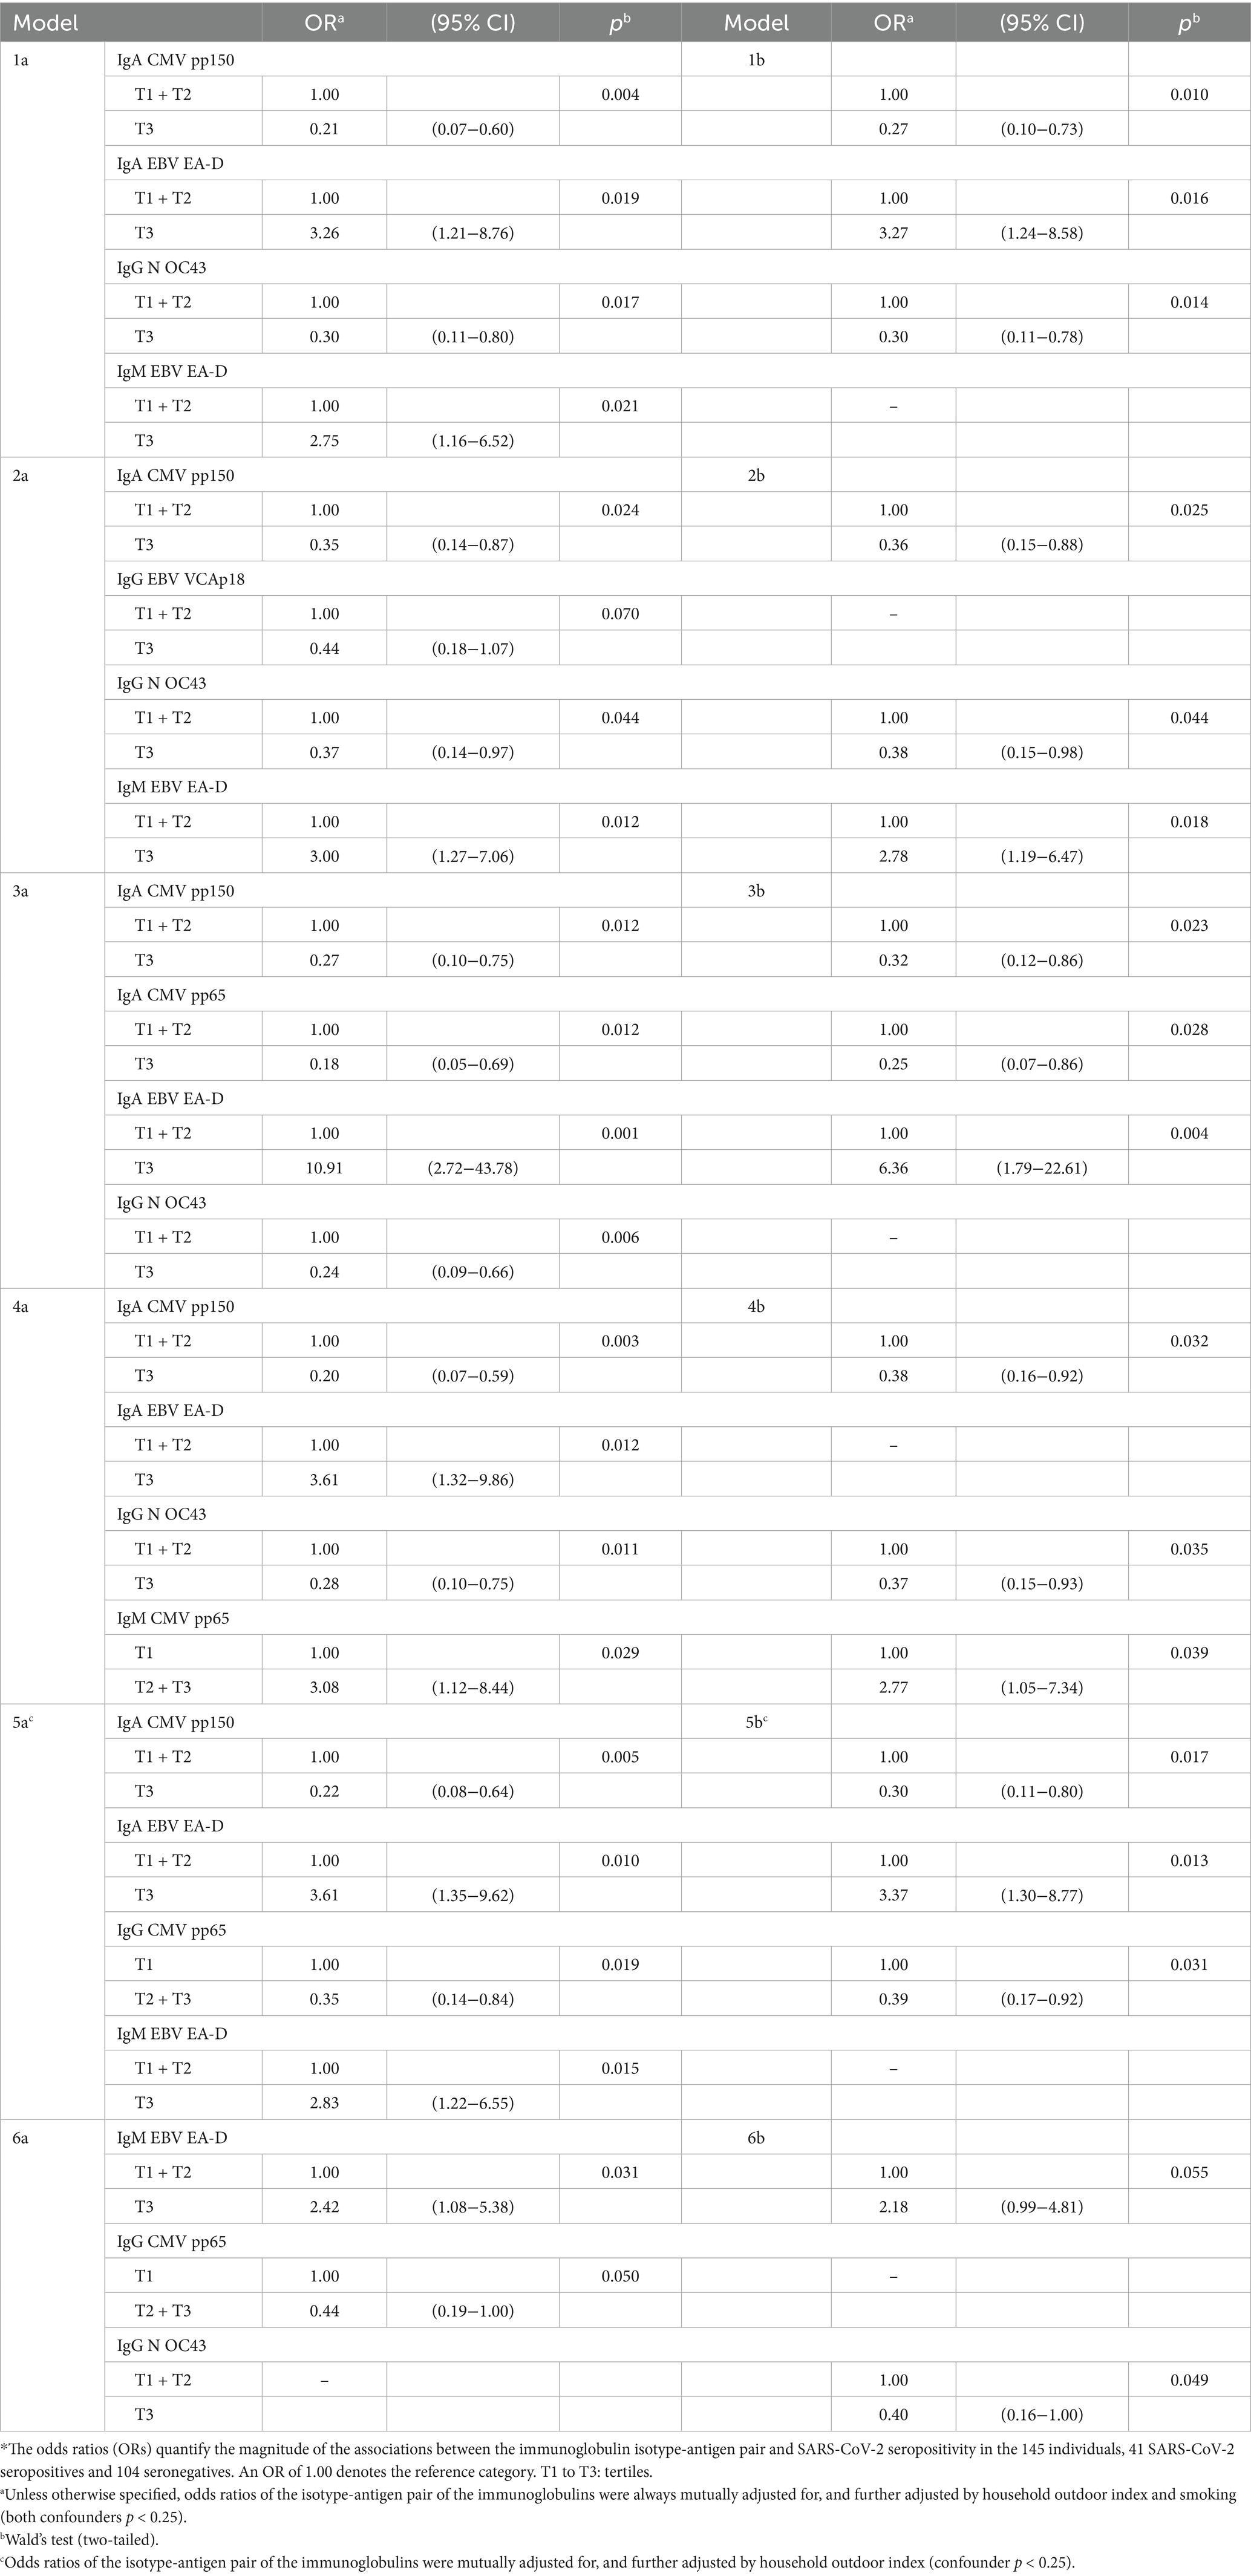
Table 4. Influence of mixtures of isotype-antigen pairs for cytomegalovirus, Epstein–Barr virus, and common cold infections on the risk of SARS-CoV-2 seropositivity (N = 145)*.
Table 4 shows five examples of models of 4 isotype-antigen pairs, each pair being significantly associated to an increased or a decreased risk of seropositivity (models 1a, 2a, 3a, 4a and 5a). None of these five models included more than two of the five individual isotype-antigen pairs individually associated to seropositivity (IgG CMV pp150, IgG CMV pp65, IgG N OC43, IgM CMV pp65, and IgM EBV EA-D). When multi-biomarker models considered only these five individual pairs, only models 6a and 6b included more than one of these five individual pairs. Specifically, the two models show that IgM to EBV EA-D increased the risk of seropositivity, whereas model 6a shows, additionally, a protective effect of IgG to CMV pp65 and model 6b shows also a protective effect of IgG to N OC43. Table 4 also shows examples of models of 3 isotype-antigen pairs, each pair being significantly associated to seropositivity (models 1b, 2b, 3b, 4b, and 5b).
None of the total (non-antigen specific) immunoglobulins, individually or in combination with other total immunoglobulins, was associated with SARS-CoV-2 seropositivity (Supplementary Table 3).
Numerous mixtures of two cytokines with two or three immunoglobulins were associated with SARS-CoV-2 seropositivity (Table 5; Figure 2, column 1. D). Examples of immunoglobulins include the five mentioned above (IgG to CMV pp150, CMV pp65, N OC43, IgM to CMV pp65 and EBV EA-D), as well as IgA to CMV pp150 and EBV EA-D, and IgG to EBV VCAp18 (Figure 2, column 1. D). Their ORs had values similar to when they were analyzed individually and when they were analyzed in mixtures of only cytokines or only immunoglobulins; i.e., again, their effects appeared to be independent of each other.
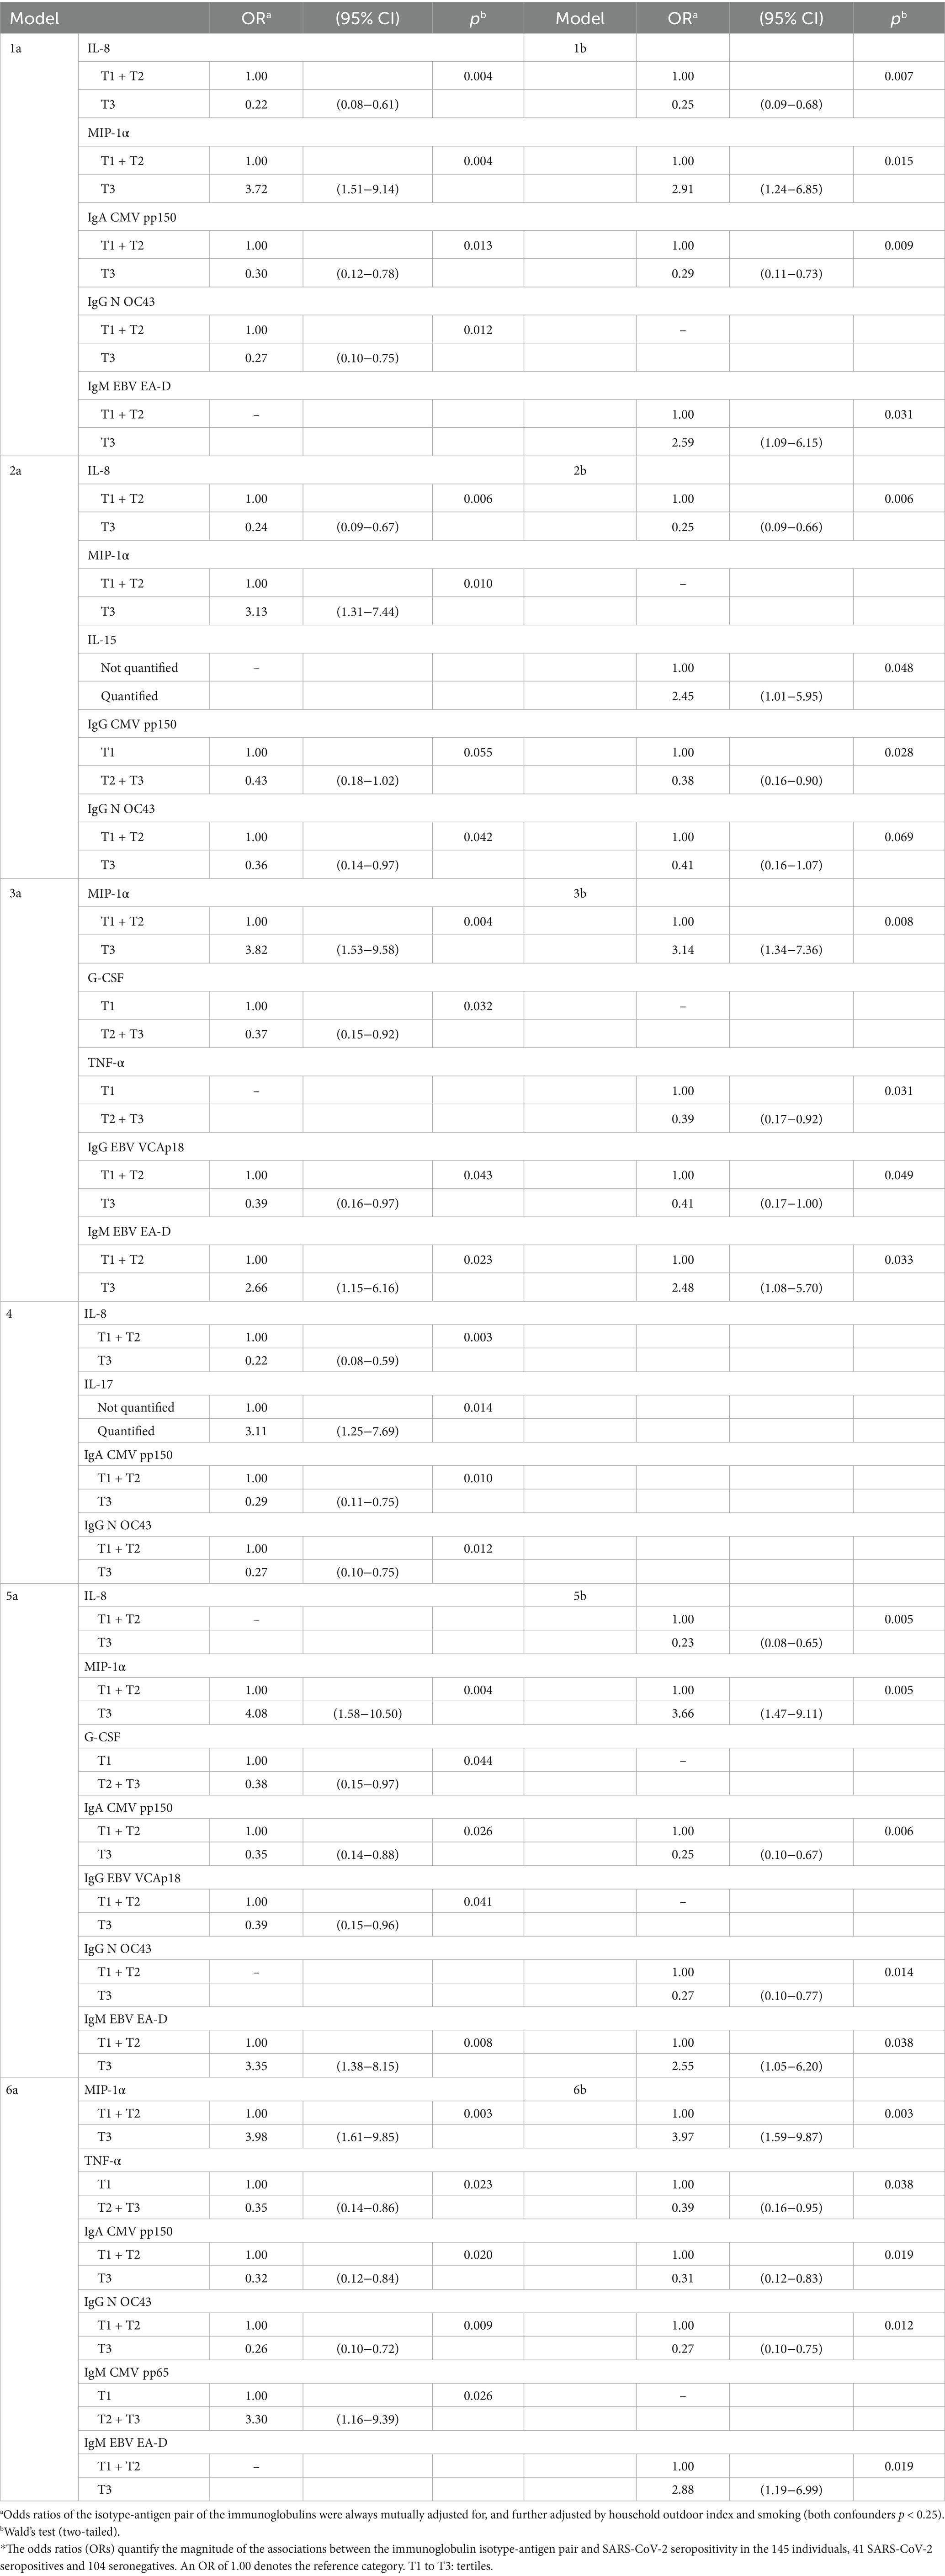
Table 5. Influence of mixtures of cytokines and immunoglobulins on the risk of SARS-CoV-2 seropositivity (N = 145)*.
By contrast with what we saw with cytokines above, and as we shall see in more detail in section 3.2, none of five immunoglobulins mentioned above more associated with SARS-CoV-2 seropositivity was also clearly associated with COVID-19, and none of the immunoglobulins more associated with COVID-19 was associated with SARS-CoV-2 seropositivity (Figure 2, columns 1 and 2). While some immunoglobulins increased the risk of seropositivity, no immunoglobulin increased the risk of COVID-19.
Some cytokines were associated with seropositivity in women and not at all in men; notably, EGF (OR in women = 3.4), GM-CSF (OR = 4.9), MCP-1 (OR = 5.5), IL-2 (OR = 4.1) and IFN-α (OR = 4.4), (all p between 0.01 and 0.04). Others were associated with seropositivity in men and not in women; e.g., MIP-1α (OR in men = 4.6), and TNF-α (OR = 0.3; both p < 0.02). Finally, IL-6 was associated with an increased risk of seropositivity in women (OR = 3.5), and with a decreased risk in men (OR = 0.2; both p < 0.04).
IgM to N 229E was associated with seropositivity in women and not in men (OR in women = 3.9, p < 0.03). Two immunoglobulins were associated with seropositivity in men and not in women: IgG to CMV pp150 (OR in men = 0.3), and IgG to CMV pp65 (OR = 0.3; both p < 0.05).
3.2 Effects of baseline immune markers on risk of COVID-19
Higher concentrations in 2016–17 of IL-8, TNF-α, G-CSF, IL-4, and IL-2R decreased the risk of COVID-19 in 2020–21. IL-8 showed the most marked effect (OR = 0.07, 95% CI: 0.01–0.55), while the other markers had an OR<0.4 (Table 6; Figure 1, columns 2. A and 2. B).

Table 6. Effect of individual cytokine levels measured in 2016–17 on the risk of COVID-19 in 2020–21 (N = 154)*.
Most cytokines in mixtures with IL-8, TNF-α, MIP-1α, and G-CSF were associated with COVID-19 (Table 7). Again, in most models MIP-1α had an OR>2.0, and IL-8, TNF-α, and G-CSF had an OR<0.4 (all p < 0.05). IL-2R, IL-4, and IL-5 also lowered the risk of the disease. There was no association of IL-6 with COVID-19, nor with SARS-CoV-2 seropositivity, even when IL-6 was considered jointly with IL-8 and TNF-α.
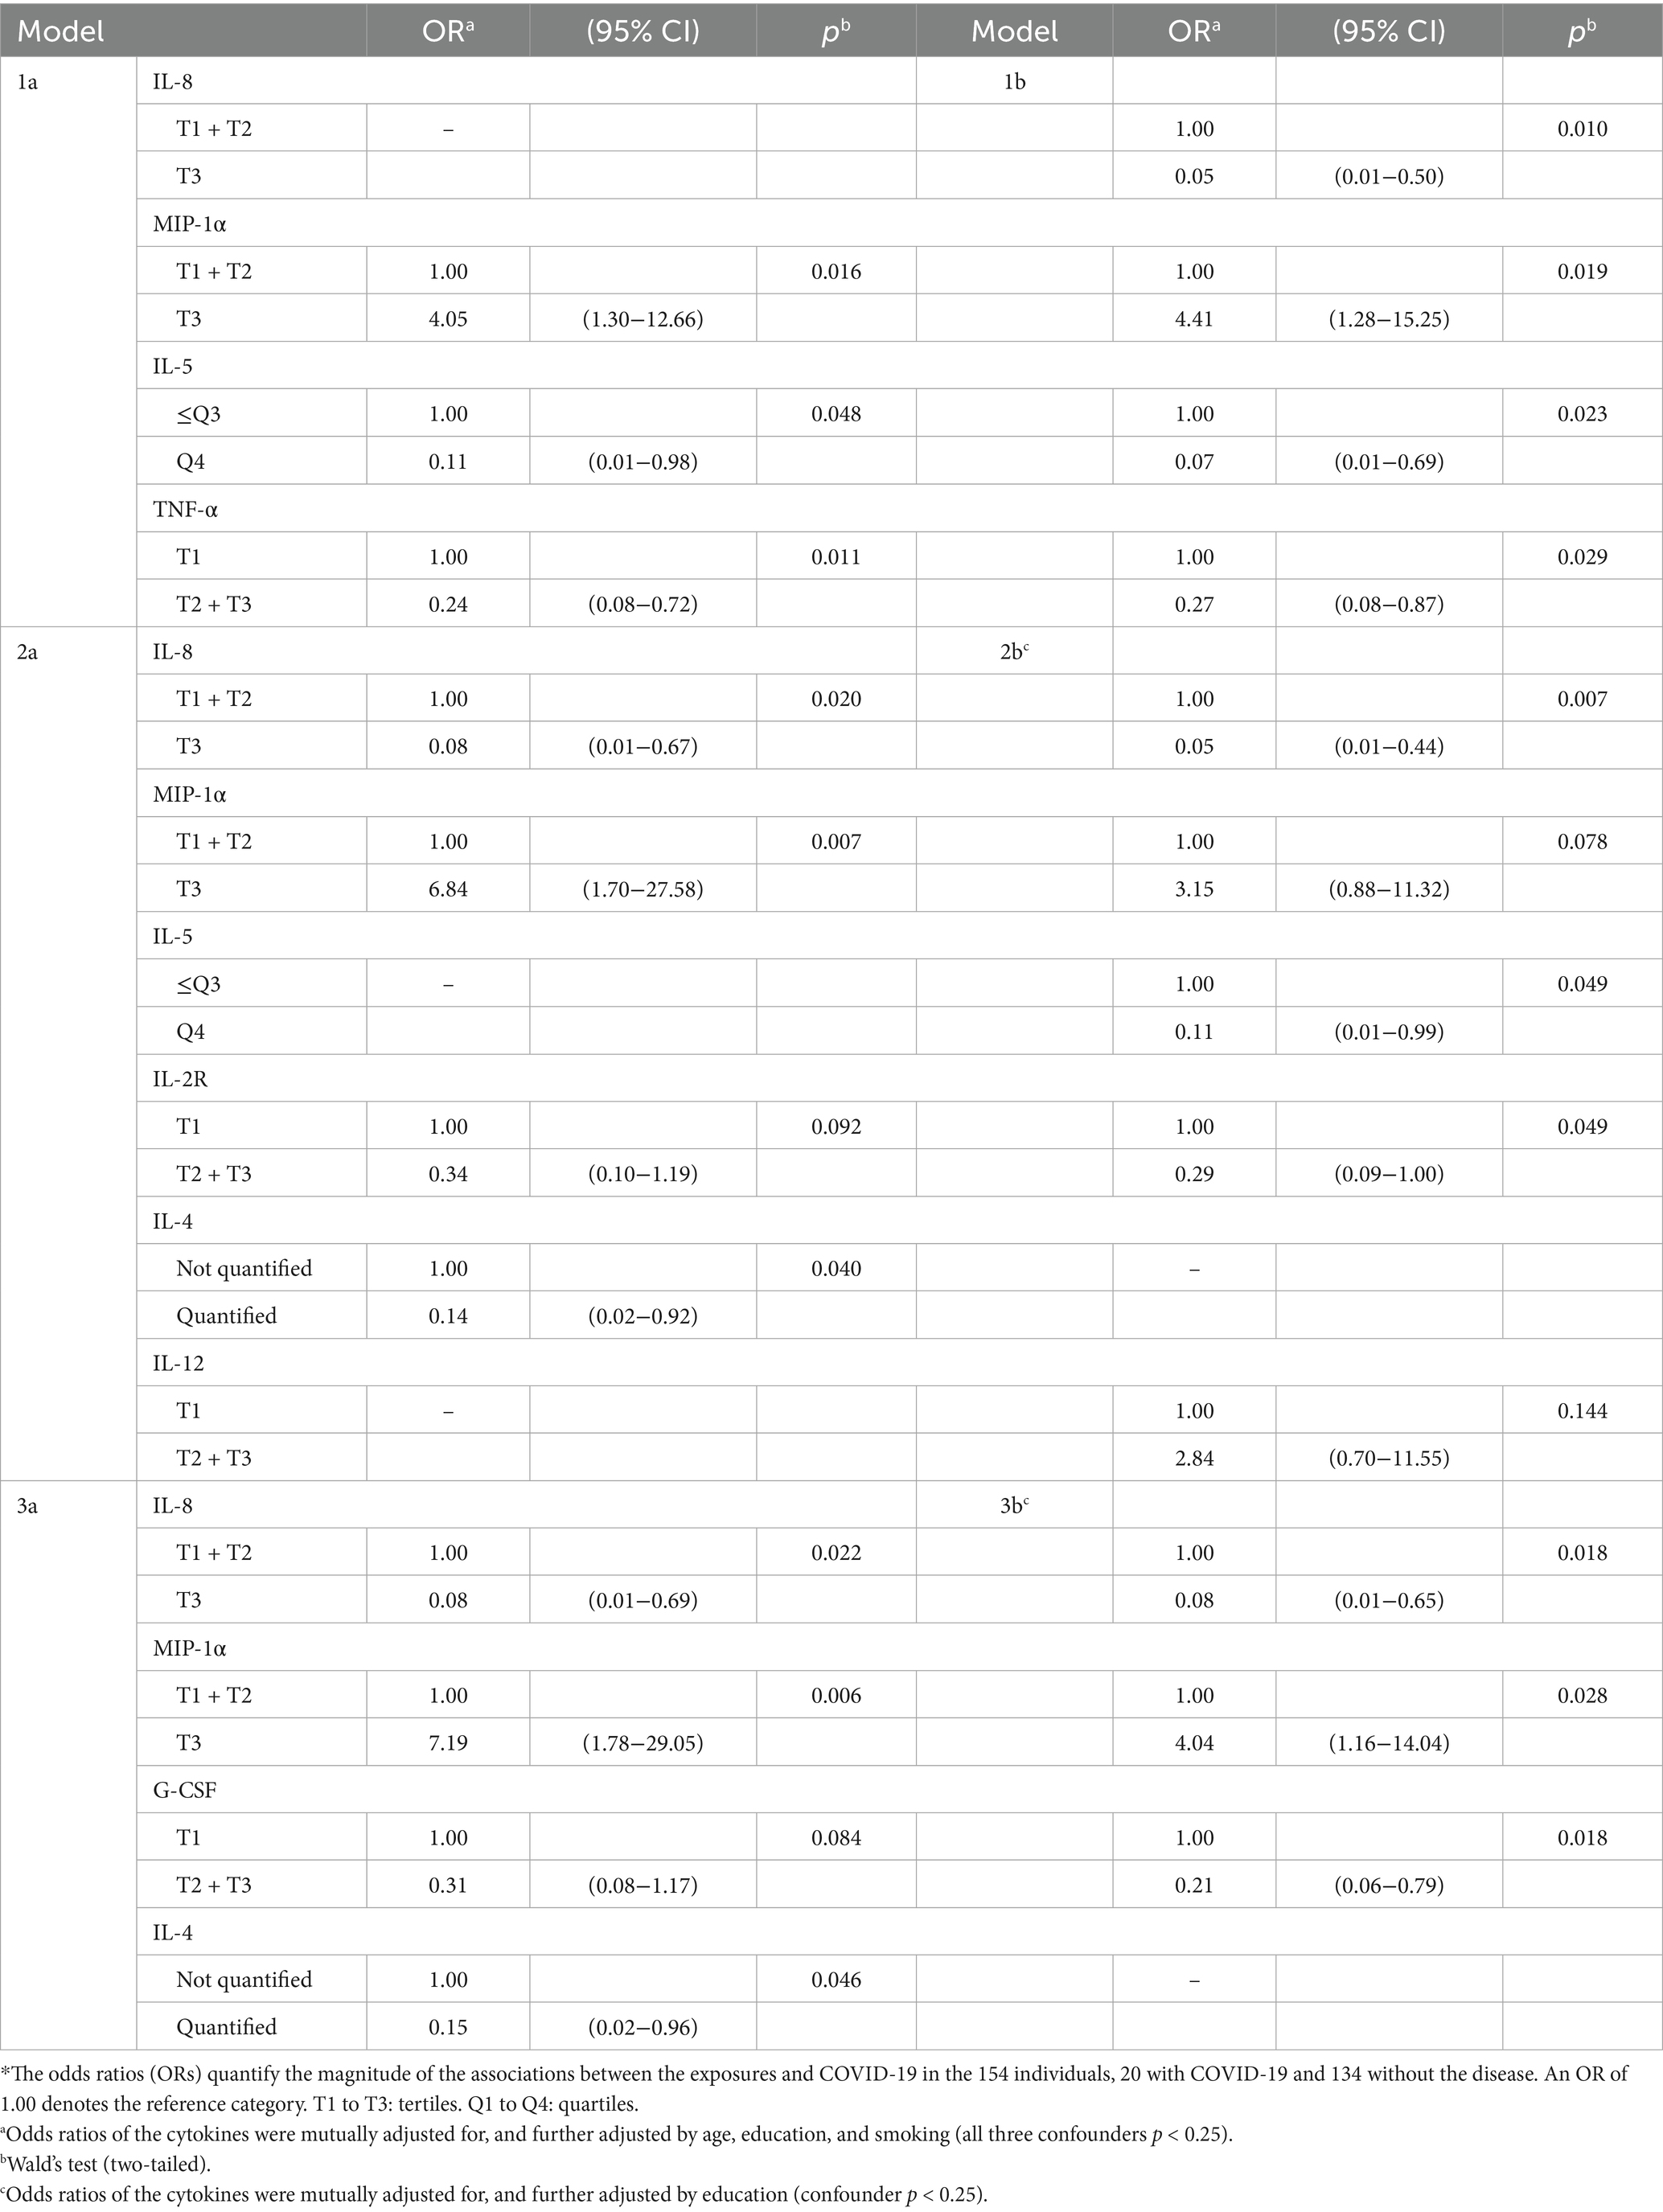
Table 7. Influence of mixtures of cytokines on the risk of COVID-19 (N = 154)*.
The four cytokines most consistently associated with the risk of COVID-19 (G-CSF, IL-8, TNF-α, and MIP-1α) were also associated with the risk of seropositivity and associations were in the same direction (Figure 1, column 2. C).
Generally, complementary models (Figure 1, columns 2. E to 2. G; Supplementary Table 1.2) were coherent with logistic regression models for IL-8, TNF-α, G-CSF, and IL-2R (Figure 1, columns 2. A to 2. D).
The four isotype-antigen pairs more strongly associated with risk of COVID-19 (all protective) were IgA to CMV pp65 and N 229E, IgG to EBV EA-D, and IgG to EBV VCAp18 (Table 8; Supplementary Table 4; Figure 2, columns 2. A and 2. B).
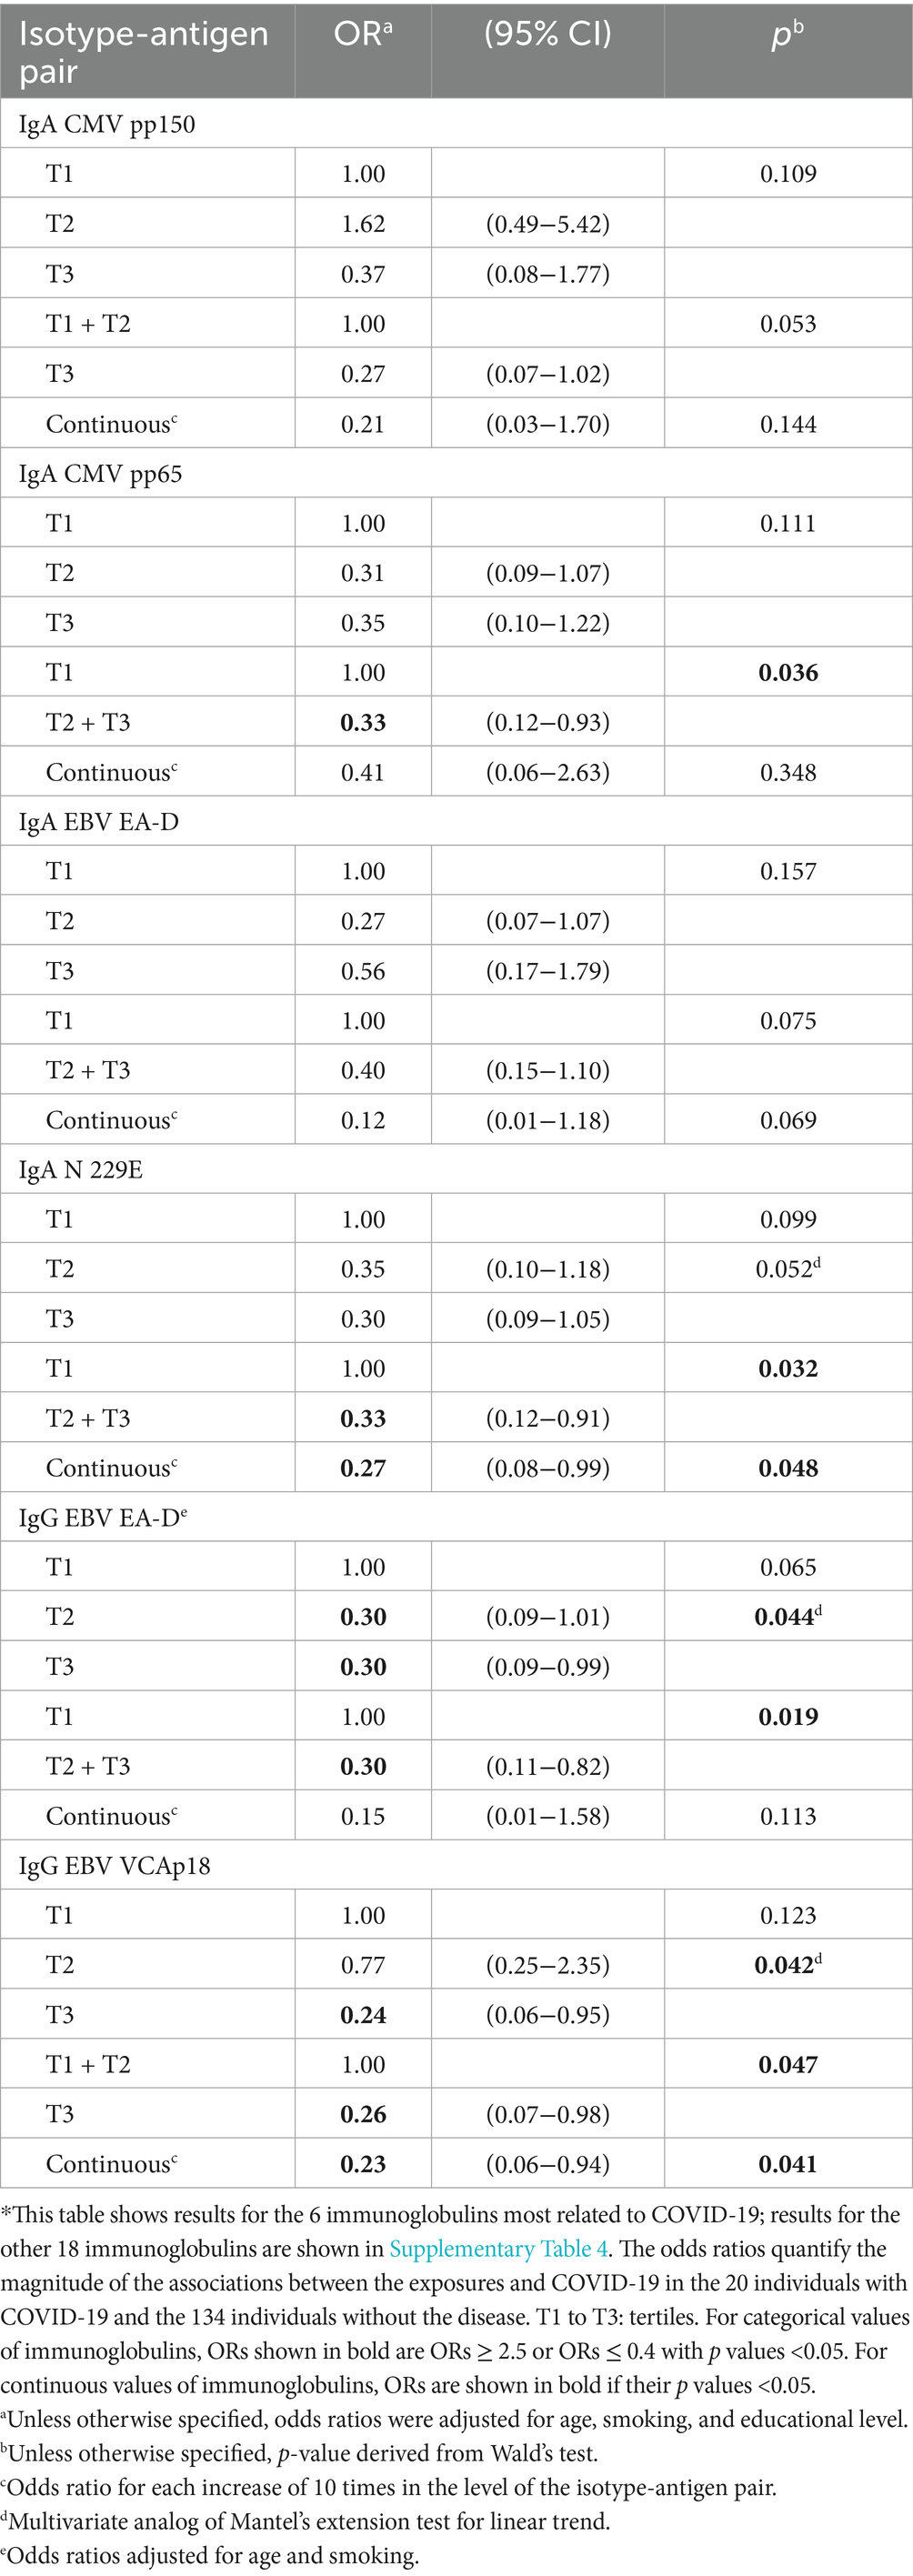
Table 8. Effect of selected individual isotype-antigen pairs for cytomegalovirus, Epstein–Barr virus, and common cold infections measured in 2016–17 on the risk of COVID-19 in 2020–21 (N = 154)*.
These four isotype-antigen pairs, as well as IgA to EBV EA-D and N OC43, and IgG to CMV pp150 were part of mixtures associated with COVID-19 (all protective), with most ORs between 0.2 and 0.4 (all p ≤ 0.03; Table 9; Figure 2, column 2. C).
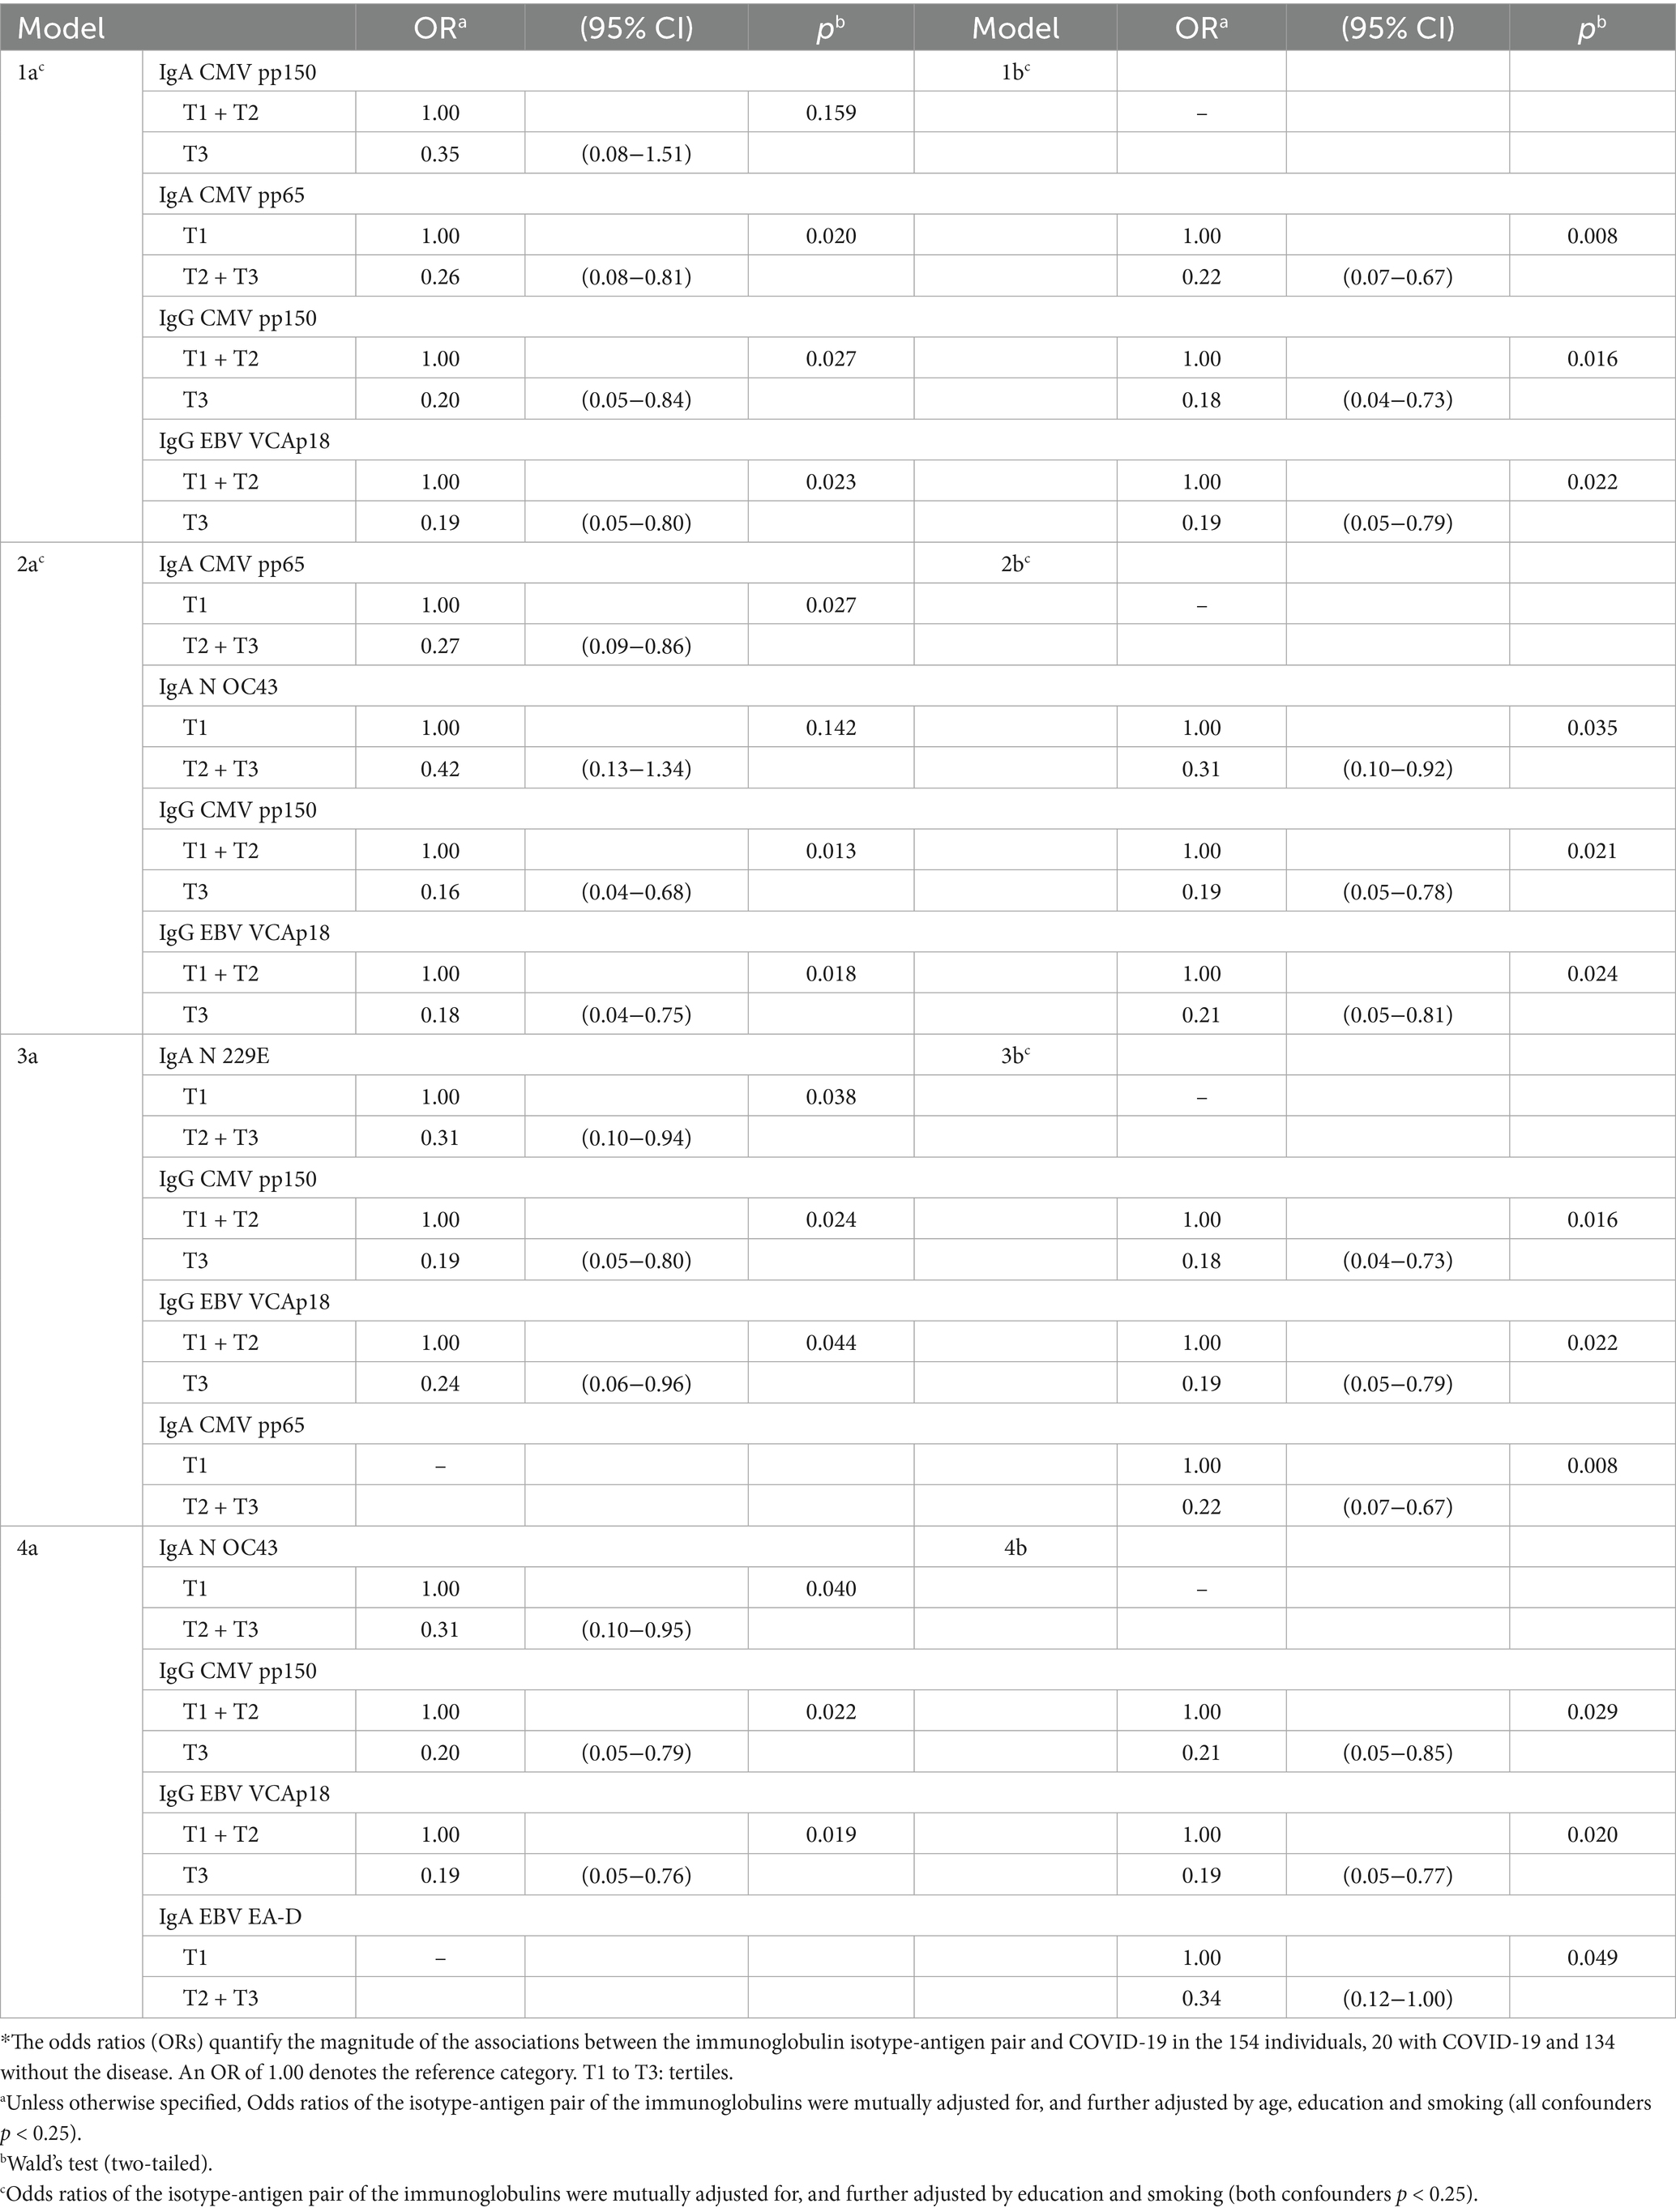
Table 9. Influence of mixtures of isotype-antigen pairs for cytomegalovirus, Epstein–Barr virus, and common cold infections on the risk of COVID-19 (N = 154)*.
Among total immunoglobulins, only IgG1, IgG3, and IgA were marginally associated with COVID-19, with ORs ≤ 0.4 (Supplementary Table 5). Because of low statistical power, there were no mixtures of two or more total immunoglobulins significantly associated with COVID-19, in spìte of ORs near 0.4 (Supplementary Table 6).
Remarkably, mixtures of cytokines and immunoglobulins associated with COVID-19 included between two to four cytokines and one to two immunoglobulins. Examples include: IL-8, MIP-1α, TNF-α, and IL-2R with IgA to CMV pp150 and N 229E, and IgG to EBV EA-D (Table 10; Figures 1, 2, sections 2. D). Cytokines and immunoglobulins associated with COVID-19 were always associated in the same direction (lowering or increasing risk) whether they were individually analyzed, analyzed in exclusive mixtures of cytokines or immunoglobulins, or as mixtures of cytokines and immunoglobulins. Furthermore, some cytokines as MIP-1α had ORs increased up to 3 times when they were included in mixtures compared to when they were considered as single biomarkers (see, for instance, Tables 6, 7, 10).
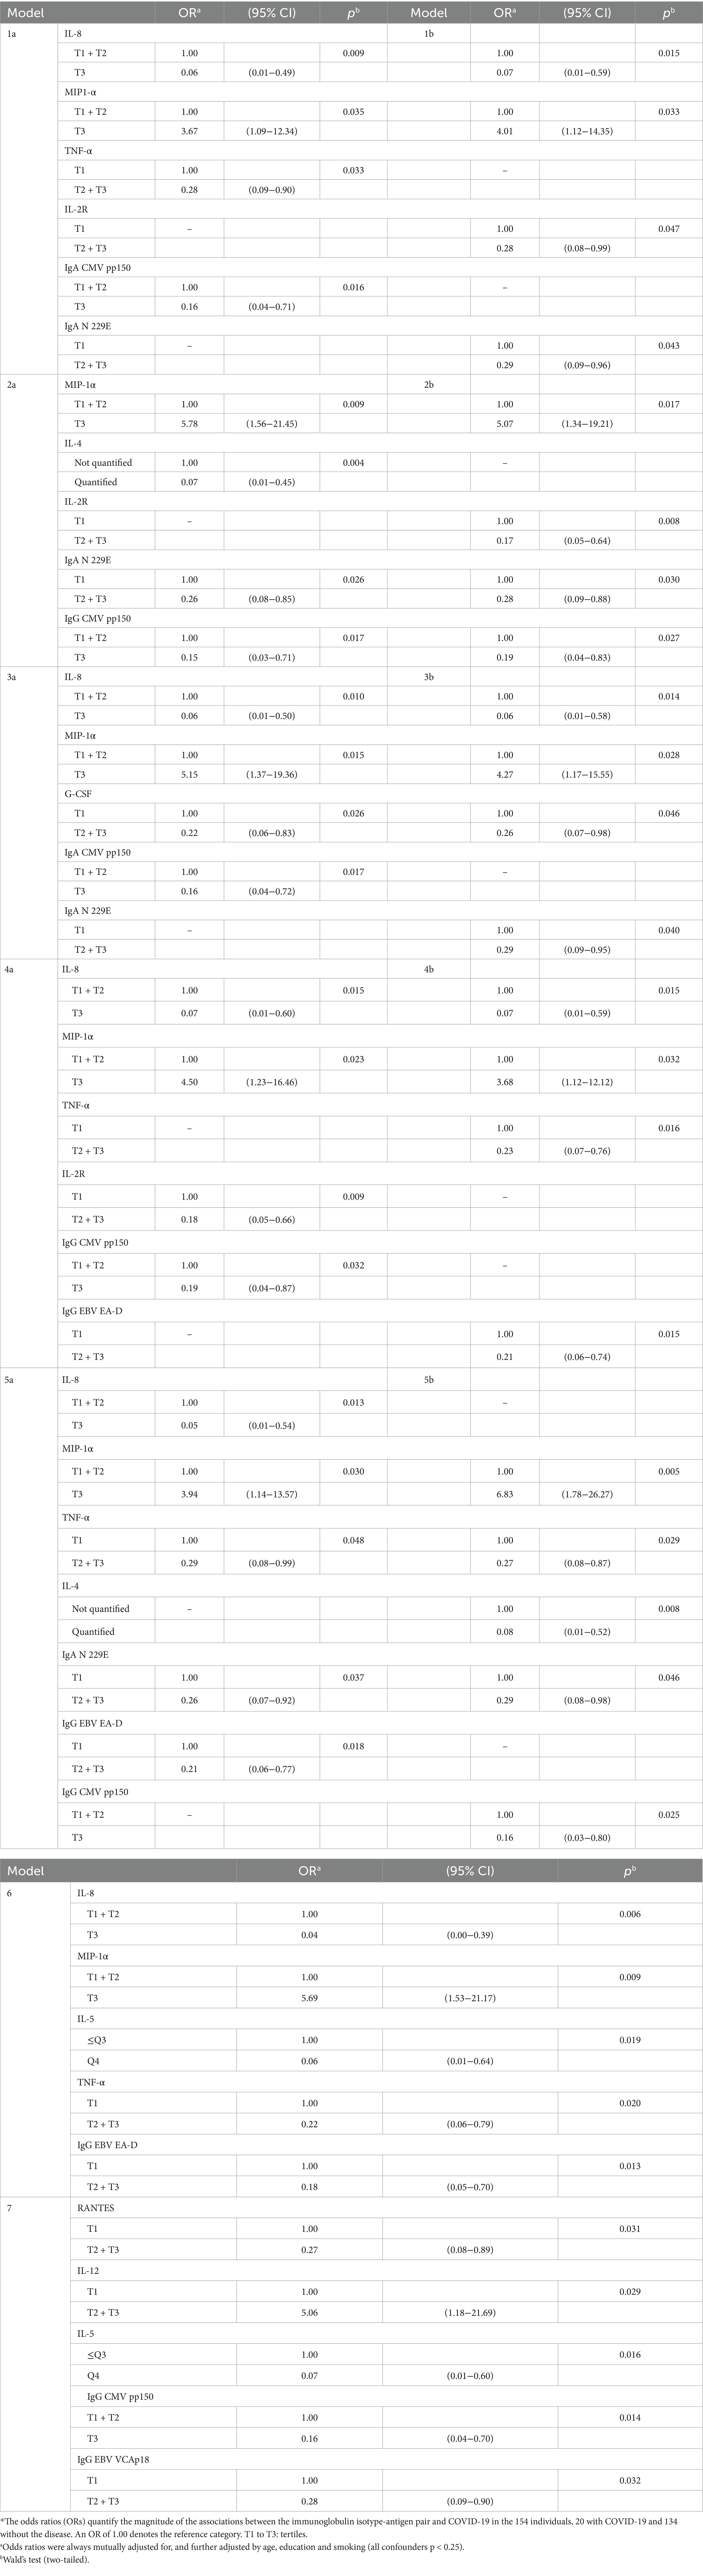
Table 10. Influence of mixtures of cytokines and immunoglobulins on the risk of COVID-19 (N = 154)*.
Two cytokines were associated with COVID-19 in women and not in men: G-CSF (OR in women = 0.1), and IL-2R (OR = 0.2; both p < 0.05). And two were associated with COVID-19 in men and not in women: MIP-1α (OR in men = 7.0), and TNF-α (OR = 0.2; both p ≤ 0.02); this was similarly observed above for seropositivity (section 3.1).
Two immunoglobulins were associated with COVID-19 in women and not in men; IgA to CMV pp65 (OR = 0.2) and IgM to N OC43 (OR = 0.1; both p < 0.04). IgA to N 229E was associated with COVID-19 among men and not in women (OR in men = 0.1, p < 0.01).
The associations of cytokines and immunoglobulins with seropositivity and COVID-19 were not consistently stronger in older than in younger age groups.
When we considered comorbidities previously found slightly associated with some immunoglobulins (8), we found that they did not change the results just shown above. For instance, when dyslipidemia was included in models assessing the associations between levels of the biomarkers of inflammation and of immunological status, and the two outcomes (SARS-CoV-2 seropositivity and COVID-19), the estimates did not change.
4 Discussion
4.1 Assessment of main findings
Well into the pandemic, in late 2021—and still today, to a large extent—the capacity of pre-existing immunity to HCoV to crossprotect against de novo COVID-19 was largely unknown. So was also the possible influence of the basal immune state, analyzed here through cytokines and immunoglobulins, on the risk of SARS-CoV-2 infection and COVID-19. The unique longitudinal design of the present study, with measurements before and during the pandemic, provides novel knowledge on the protective and deleterious effects of specific individual cytokines and immunoglobulins, and their mixtures.
We previously reported intraindividual stability between prepandemic (2016–17) and pandemic (2020–21) levels of cytokines and immunoglobulins, including antibodies against HCoV. Furthermore, the stability was similar in study participants who in 2020–21 were SARS-CoV-2 seropositive and seronegative, and between participants who did and did not develop COVID-19 (8). The intraindividual stability suggests that SARS-CoV-2 infection may not boost anti-HCoV N responses, although cross-reactivity has been suggested in other studies (22–24). These results are in line with findings suggesting no cross-reactive neutralizing activity against SARS-CoV-2 in 37 prepandemic sera samples from Edinburgh hospital patients with prior seasonal coronavirus infection (25, 26). In the sera of 76 healthy French donors, no anti-RBD reactivity was detected, although six samples were found to be reactive against one or several of the other SARS-CoV-2 antigens: except for these six samples, pre-existing immunity to HCoV was not responsible for recall-type IgG responses to SARS-CoV-2, and it did not lead to cross-protection against COVID-19 (27). A general upward trend in anti-HCoV N antibody levels was observed in 33 health care workers from a hospital in Barcelona when comparing levels prior to and after SARS-CoV-2 infection. For instance, IgG to 229E significantly increased after SARS-CoV-2 seroconversion. However, not all seroconverters had an increase in levels, supporting a back-boost of N HCoV beyond cross-reactivity (15). In the present study, IgA to OC43 and 229E and IgG to OC43 were associated to a lower risk of COVID-19; the latter was also associated with lower risk of SARS-CoV-2 infection (seropositivity). IgA and IgG to CMV and EBV were associated with lower risk of COVID-19. IgA to CMV and IgG to CMV and EBV were also associated with a lower risk of infection. Previous studies have observed cross-reactive antibody responses against SARS-CoV-2 spike protein in prepandemic samples (28, 29) and some could be protective. In fact, crossreactivity of endemic common cold human coronaviruses and CMV with SARS-CoV-2 has been associated to lower risk of COVID-19 (30–32).
In agreement with our observation of the association of IgG to N OC43 with lower risk of SARS-CoV-2 seropositivity, a recent study with transgenic mice shows that human coronavirus OC43-elicited CD4+ T cells may protect against SARS-CoV-2 (33). Also in agreement with our observation of the association of IgG to CMV with lower risk of SARS-CoV-2 seropositivity and lower risk of COVID-19, previous studies show that CMV seropositivity and T cell responses associate with SARS-CoV-2 cellular and serological responses (34, 35) suggesting crossreactivity that contributes to the pre-existing immunity against SARS-CoV-2 (29). The association of some antibodies with a reduced risk of disease and others with a reduced risk of infection, suggests different levels of cross-reactivity, some controlling viral load after the infection and some blocking viral entry into host cells.
In our study we report an association of high levels of IgM to EBV EA-D and CMV pp65 in prepandemic samples (which are suggestive of viral reactivation) with a higher risk of SARS-CoV-2 infection. EBV and CMV can reactivate in immunocompromised individuals, as well as in the setting of physiologic stressors. Thus, reactivation of these viruses in prepandemic samples is indicative of higher vulnerability in these subjects in front of new infections. This would explain the association observed in the present study between IgM to EBV EA-D and CMV pp65 in prepandemia samples and SARS-coV-2 seropositivity.
The finding that higher IgG1 and IgG3 basal levels may lower risk of COVID-19 is consistent with their higher effector capacity against pathogens compared to IgG2 and IgG4 (36). The association of higher IgA basal serum levels (which correlate with mucosal levels) with a lower risk of COVID-19 is consistent with its important role protecting from infections that target mucosal tissues. A previous study has also shown that total serum IgA levels are negatively associated with the severity of COVID-19 (37).
Some cytokines had consistent and clear associations with SARS-CoV-2 infection and COVID-19, among them TNF-α and IL-8, protective in both instances. TNF-α is produced by macrophages and monocytes and is one of the early effectors that alert the host’s immunity about dangers. When SARS-CoV-2 reaches the bronchial epithelia, TNF-α is induced, promoting the infiltration of macrophages, dendritic cells, natural killer cells, and neutrophils to the bronchi to control and clear SARS-CoV-2 replication (38). IL-8, also induced in the bronchial epithelia by SARS-CoV-2 (39), is a potent chemotactic factor that attracts neutrophils, basophils, and T-cells during the inflammatory process. High basal blood levels of these two cytokines may induce a more efficient local innate immune response in the respiratory system that blocks SARS-CoV-2 replication, preventing the virus to reach the lymph nodes so there is no seropositivization or disease.
We observed that high MIP-1α basal levels increased the risk of SARS-CoV-2 infection and COVID-19. MIP-1α is a chemokine involved mainly in cell adhesion and migration. Severe COVID-19 has been associated with significantly higher MIP-1α (40). This chemokine is implicated in the autocrine regulation of migration of dendritic cells to draining lymph nodes (41–43). The association of high levels of MIP-α with a higher risk of seropositivity and COVID-19 could be related to a higher migration of virus-infected dendritic cells facilitating virus spread, skew of T-cell responses through altered cytokine production, and induction of apoptosis in T cells leading to immunosuppression (44).
Higher prepandemic concentrations of IL-2R, IL-4 and IL-5 protected against COVID-19, but not against SARS-CoV-2 infection. These findings suggest a role for these cytokines in the regulation of the inflammatory response under infection. Besides the reported role of IL-5 in helping antibody production by B cells in mice, there are also evidences of this role in humans; for example, Huston et al. (45) showed that human B cells express IL-5 receptor mRNA and respond to IL-5 with enhanced IgM production after mitogenic stimulation. IL-4 and IL-5 are involved in promoting a Th2 immune response, which helps in antibody production by B cells. IL-4 acts as a potent B cell growth factor—enhancing proliferation, survival, and class-switch recombination toward IgG1 and IgE—while IL-5 reinforces Th2-mediated antibody responses and is co-secreted by an IL-5+ subset of Th2 cells (46). Thus, in the context of COVID-19, IL-4 and IL-5 may contribute to enhancing humoral immunity, promoting the generation of antibodies that target the SARS-CoV-2 virus. IL-5 also influences eosinophils that can play a protective role by helping clear viral infection. Balanced IL-4 and IL-5 responses could aid prevent exaggerated inflammation, thus reducing the risk of COVID-19.
4.2 Study limitations and strengths
The availability of two biological measurements for each individual participant, one before and one after the pandemic onset, is a major strength of the study. Therefore, the time sequence is clear: cytokines and immunoglobulins were measured in blood samples collected 4 years before the two outcomes (SARS-CoV-2 seropositivity and COVID-19). While this feature is unique in the literature on the pandemic, it is essential to assess causes, mediators, and effects. Our study design avoids biases common with prevalent cases of undefined origin and cross-sectional studies. The population-based design is also a strength: it is less prone to bias than studies that recruit patients attending an Emergency Department or a primary care center, or admitted to hospital. Nevertheless, confirmation of our findings in larger populations with different characteristics than ours and exposed to different SARS-CoV-2 types is required.
We previously showed that intraindividual changes in cytokines and immunoglobulins between 2016–17 and 2020–21 were moderate (8). As mentioned above, we showed that the stability was similar between participants who in 2020–21 were SARS-CoV-2 seropositive and seronegative, and between participants who did and did not develop COVID-19 (8). The similarity has methodological relevance for the present paper: it indicates that it is valid to use prepandemic levels of cytokines and immunoglobulins to assess their risk relationship (protective or harmful) with the development of SARS-CoV-2 seropositivity and COVID-19.
It is difficult to attribute a viral infection, which depends on various risk factors such as exposure, behavior, and comorbidities, to an inflammatory profile measured 4 years before the viral exposure. The association could be influenced by unassessed variables and other conditions that might interfere with the immune response. The multifactorial nature of SARS-CoV-2 infection, with factors such as viral load, comorbidities, and environmental factors, needs to be considered. Our results show an association between specific cytokines measured before the pandemic and the risk of seropositivity (infection) and COVID-19 (disease). This suggests that the immunological status before exposure affects susceptibility to infection and disease. The relationship between cytokines and risk of infection may not be direct, cytokines could be a surrogate marker of the immune status. The observed effect of the cytokines (immune status) would be independent of the behavior and exposure to the virus. While the immune status and cytokine profile seem to be stable over time [as observed in our study (8) and others], they may be influenced by environmental factors and comorbidities, which may also directly increase susceptibility of infection independently of the cytokine profile.
In our study participants levels of cytokines and immunoglobulins in late 2019 (i.e., the time closest to the pandemic outbreak) were putatively well correlated with their levels in 2016–2017 (8). Nevertheless, new studies could improve on such periods (encompassing the last months of 2019, expanding the study during the pandemic and even after its conclusion) with currently stored but yet unused data. This aim seems feasible, for instance, with existing population-based cohort studies that include biobanks. We remain hopeful that such biological samples and clinico-epidemiological data will undergo the much needed analyses (6, 7).
We could assess selection biases [as previously defined (47)] and, if they existed, seem unlikely to explain the associations observed. If something, the associations might be underestimated, because the 66 subjects who did not attend the follow-up visit were likely more susceptible to the outcomes than the 174 participants (6). As common in clinical and population research in the real world, our criteria to define COVID-19 disease (section 2.6.2.) do not have 100% sensitivity and specificity. Yet, we think the analysis of the two outcomes provides valid and relevant estimates of the associations with the levels of cytokines and immunoglobulins.
The selection of the immunological parameters analyzed was guided by their biological relevance, our prior experience, and their alignment with the study objectives. We selected a panel of 30 cytokines, chemokines and growth factors that represented the mediators produced by the main immune cell families, including Th1, Th2, Th17, and both pro-inflammatory, anti-inflammatory/regulatory functions. This breadth of pathways is well suited to evaluate baseline immune status comprehensively. Moreover, this particular 30-plex assay has been evaluated for its performance in relation to other leading commercial kits by the ISGlobal group, subsequently optimized, and widely used in multiple studies previous to this one, for assessing infection, vaccination and baseline cytokine levels in many types of cohorts and patients.
In addition to the cytokines, the Antibody Isotyping 7-Plex Human ProcartaPlex™ panel was chosen because it enables a detailed assessment of the overall humoral immunity, and it has also been employed in previous studies to investigate baseline and disease-related immunoglobulin profiles.
The inclusion of human cold coronavirus antigens in the serology Luminex panel was based on the reported cross-reactivity with the nucleocapside from SARS-CoV-2 to assess association of previous exposure with risk of SARS-CoV-2 infection. The inclusion of antigens from herpes virus in the Luminex panel was based on their reported immunomodulatory effects.
Therefore, all the measurements included had an underlying scientific reason. With state-of-the-art techniques (13–16), we analyzed 30 cytokines, 24 isotype-antigen pairs, and 7 total immunoglobulins, a relatively large amount in itself, common in the clinical literature, yet not usually easy to measure in a real human cohort from the general population; this was even more difficult in the pandemic times of 2020–21. We could thus perform a considerable number of comparisons. Since ours is the first study assessing the influence of cytokines and immunoglobulins on the risks of the two outcomes in a general, non-institutionalized population, it is only reasonable that we assessed comprehensively such associations. Certainly, these features of the study may generate false positives (and replication or refutation of our findings in larger studies is required); but they have also strengths, since the number of candidates (i.e., potentially relevant cytokines and immunoglobulins) is high. The models could barely be based on clinical and epidemiological evidence on cytokines, immunoglobulins and SARS-CoV-2 and COVID-19 in a non-institutionalized population, because little evidence of this sort is available.
Also, we detected more associations than expected by chance, and many went in the direction of decreasing risks, whereas more positive associations (increased risks) would be expected by chance. There is no consensus on techniques to adjust for the number of comparisons in clinical and epidemiological studies, and such techniques may have low efficiency or poor accuracy (18). Thus, the statistical tests and confidence intervals were not adjusted for multiple testing, and should not be used to infer definitive effects. We consider the priority given to detect potential associations as warranted as long as the results inspire larger population-based, prospective studies and laboratory research. Indeed, as sketched in 4.1., the results should encourage translational research from the observations we made in a real human population to the clinic and the laboratory; that is, they can inspire further clinical and laboratory research on mechanisms through which cytokines and immunoglobulins may influence immune processes and contribute to SARS-CoV-2 seropositivity and COVID-19. Perhaps, as mediators of some of the environmental contaminants that we tentatively identified (6).
Since the study population was modest, the statistical power and precision were often low. Yet, numerous effect estimates were statistically significant, mostly when the OR was ≥2 or OR≤0.4. Because of statistical power, there were no mixtures of two or more total immunoglobulins significantly associated with COVID-19; such mixtures would likely be statistically significant in larger studies. Also due to low numbers—only two of 20 COVID-19 cases had been hospitalized and the rest were of moderate severity—, we could not assess the association of cytokines and immunoglobulins with the severity of the infection and the severity of disease, on vaccine response, and on persistent COVID-19. Our ongoing follow-up and subject accrual may overcome these weaknesses.
While in Tables 1, 3, 6, 8, we provide a number of results of tertile analysis of cytokines and immunoglobulins, we often also dichotomized such exposures, given the common absence of a linear dose–response or lack of evidence on influential levels. Sometimes, the lack of linear dose-responses in tertile analyses coexisted with substantial odds ratios in some tertiles, thus indicating again that the conduct of independent analyses in larger populations is necessary.
While some interactions between pairs of cytokines and immunoglobulins could be biologically plausible and relevant, we were again cautioned by the small size of our current study population, and do not present results. Neither do we for other interactions with personal and social characteristics (except sex), which also deserve to be tested in larger human studies. Cytokine profiles in males and females exhibit notable differences due to hormonal influences, which may underlie the sex-specific cytokines (IL-6, MIP-1α, G-CSF) associated with SARS-CoV-2 infection or COVID-19 (48, 49). Our analyses considered the whole population of 154 persons who were at risk for infection, rather than only the seropositives at risk for COVID-19, for clear methodological reasons, previously explained (6).
5 Conclusion
The unique longitudinal design of this study, with measurements before and during the pandemic in a general population, provides novel knowledge on the protective and detrimental effects of specific individual cytokines and immunoglobulins, and their mixtures, on the risk of SARS-CoV-2 seropositivity and COVID-19. The results deserve to be refuted or replicated in existing population-based cohort studies with biobanks. If confirmed, findings would be significantly relevant for medicine and public health.
Data availability statement
The raw data supporting the conclusions of this article may be made available by the authors upon reasonable request, without undue reservation.
Ethics statement
The studies involving humans were approved by the Ethics Committee of the Parc de Salut Mar. The studies were conducted in accordance with the local legislation and institutional requirements. The participants provided their written informed consent to participate in this study.
Author contributions
MP: Conceptualization, Data curation, Formal analysis, Funding acquisition, Investigation, Methodology, Project administration, Resources, Supervision, Validation, Visualization, Writing – original draft, Writing – review & editing. JP: Conceptualization, Data curation, Formal analysis, Funding acquisition, Investigation, Methodology, Project administration, Resources, Software, Supervision, Validation, Writing – original draft, Writing – review & editing. RA: Data curation, Formal analysis, Investigation, Methodology, Writing – review & editing. DP-M: Data curation, Formal analysis, Investigation, Methodology, Software, Writing – review & editing. LC: Data curation, Formal analysis, Funding acquisition, Investigation, Resources, Software, Writing – review & editing. CR: Formal analysis, Investigation, Resources, Supervision, Writing – review & editing. JV-G: Investigation, Project administration, Resources, Writing – review & editing. MV: Formal analysis, Investigation, Writing – review & editing. AJ: Formal analysis, Investigation, Writing – review & editing. AP: Formal analysis, Investigation, Writing – review & editing. LT: Investigation, Resources, Validation, Writing – review & editing. FB: Formal analysis, Investigation, Supervision, Writing – review & editing. GM: Conceptualization, Data curation, Formal analysis, Investigation, Methodology, Supervision, Writing – review & editing. MG: Conceptualization, Data curation, Formal analysis, Funding acquisition, Investigation, Methodology, Project administration, Resources, Supervision, Validation, Visualization, Writing – original draft. CD: Conceptualization, Data curation, Formal analysis, Investigation, Methodology, Project administration, Software, Writing – review & editing. M-ÁM: Formal analysis, Investigation, Methodology, Writing – review & editing.
Funding
The author(s) declare that financial support was received for the research and/or publication of this article. The work was supported in part by research grants from Instituto de Salud Carlos III, Government of Spain, co-funded by FEDER and European Union (FIS PI17/00088, FIS PI21/00052, FIS PI24/00277, and CIBER de Epidemiología y Salud Pública -CIBERESP); CRUE-Santander Fondo Supera COVID-19 (15072020); the Hospital del Mar Medical Research Institute (IMIM), Barcelona; and the Government of Catalonia (2017 SGR 439; 2021 SGR 43). GM is supported by RYC2020-029886-I/AEI/10.13039/501100011033, co-funded by European Social Fund (ESF). ISGlobal acknowledges support from the grant CEX2023-0001290-S funded by MCIN/AEI/ 10.13039/501100011033, and support from the Generalitat de Catalunya through the CERCA Program. The funders had no role in study design, data collection and analysis, decision to publish, or preparation of the manuscript.
Acknowledgments
The authors gratefully acknowledge technical and scientific assistance provided by the Center for Genomic Regulation (CRG) Genomics Unit. They also thank Carlo Carolis and Natalia Rodrigo-Melero from CRG for the production of S1 antigen, Luis Izquierdo from ISGlobal for the production of N antigens, and Pere Santamaria, Pau Serra and Daniel Parras from IDIBAPS for the production of S and RBD antigens. The authors also thank Elisenda Martínez, Alex Lorenzo, and Ramon Roman from PADRIS (Programa Públic d’Analítica de Dades per la Recerca i la Innovació en Salut). Warm thanks are also due to Pablo Santiago-Díaz, Joan Lop, Marta Pérez, Iris Matilla, Israel Blasco, Alicia Redón, Ana M. Aldea, Núria Somoza, Eulàlia Puigmartí, Carmen Serrano, Pratima Tamang, Xavier Llebaria, Carmen Cabezas, and Anna García-Altés. This work was carried out as part of the PhD program in Biomedical Research Methodology and Public Health at the Universitat Autònoma de Barcelona.
Conflict of interest
The authors declare that the research was conducted in the absence of any commercial or financial relationships that could be construed as a potential conflict of interest.
Generative AI statement
The author(s) declare that no Gen AI was used in the creation of this manuscript.
Publisher’s note
All claims expressed in this article are solely those of the authors and do not necessarily represent those of their affiliated organizations, or those of the publisher, the editors and the reviewers. Any product that may be evaluated in this article, or claim that may be made by its manufacturer, is not guaranteed or endorsed by the publisher.
Supplementary material
The Supplementary material for this article can be found online at: https://www.frontiersin.org/articles/10.3389/fpubh.2025.1548456/full#supplementary-material
Abbreviations
BHS, Barcelona Health Survey; BMI, body mass index; CI, confidence interval; CMV, cytomegalovirus; COVID-19, coronavirus disease 2019; EBV, Epstein-Barr virus; EGF, epidermal growth factor; FGF, fibroblast growth factor; G-CSF, granulocyte colony-stimulating factor; GM-CSF, granulocyte-macrophage colony-stimulating factor; HCoV, human common coronaviruses; HGF, hepatocyte growth factor; IFN, interferon; IL, interleukin; IP-10, interferon-γ induced protein; LOQ, limit of quantification; lLOQ, lower limit of quantification; MCP-1, monocyte chemoattractant protein; MFI, median fluorescent intensity; MIG, monokine induced by interferon-γ; MIP, macrophage inflammatory protein; OR, odds ratio; RANTES, regulated on activation normal T cell expressed and secreted; SARS-CoV-2, severe acute respiratory syndrome coronavirus 2; TNF, tumor necrosis factor; uLOQ, upper limit of quantification; VEGF, vascular endothelial growth factor.
References
1. Menges, D, Zens, KD, Ballouz, T, Caduff, N, Llanas-Cornejo, D, Aschmann, HE, et al. Heterogenous humoral and cellular immune responses with distinct trajectories post-SARS-CoV-2 infection in a population-based cohort. Nat Commun. (2022) 13:4855. doi: 10.1038/s41467-022-32573-w
2. Le Bert, N, Chia, WN, Wan, WY, AKJ, T, Chong, SZ, Tan, N, et al. Widely heterogeneous humoral and cellular immunity after mild SARS-CoV-2 infection in a homogeneous population of healthy young men. Emerg Microbes Infect. (2021) 10:2141–50. doi: 10.1080/22221751.2021.1999777
3. Mazzoni, A, Maggi, L, Capone, M, Vanni, A, Spinicci, M, Salvati, L, et al. Heterogeneous magnitude of immunological memory to SARS-CoV-2 in recovered individuals. Clin Transl Immunol. (2021) 10:e1281. doi: 10.1002/cti2.1281
4. Souquette, A, and Thomas, PG. Variation in the basal immune state and implications for disease. eLife. (2024) 13:e90091. doi: 10.7554/eLife.90091
5. Karachaliou, M, Moncunill, G, Espinosa, A, Castaño-Vinyals, G, Jiménez, A, Vidal, M, et al. Infection induced SARS-CoV-2 seroprevalence and heterogeneity of antibody responses in a general population cohort study in Catalonia Spain. Sci Rep. (2021) 11:21571. doi: 10.1038/s41598-021-00807-4
6. Porta, M, Pumarega, J, Gasull, M, Aguilar, R, Henríquez-Hernández, LA, Basagaña, X, et al. Individual blood concentrations of persistent organic pollutants and chemical elements, and COVID-19: a prospective cohort study in Barcelona. Environ Res. (2023) 223:115419. doi: 10.1016/j.envres.2023.115419
7. Pumarega, J, Gasull, M, Koponen, J, Campi, L, Rantakokko, P, Henríquez-Hernández, LA, et al. Prepandemic personal concentrations of per- and polyfluoroalkyl substances (PFAS) and other pollutants: specific and combined effects on the incidence of COVID-19 disease and SARS-CoV-2 infection. Environ Res. (2023) 237:116965. doi: 10.1016/j.envres.2023.116965
8. Gasull, M, Pumarega, J, Aguilar, R, Campi, L, Prieto-Merino, D, Villar-García, J, et al. Stability of cytokine and immunoglobulin concentrations in the general population: prepandemic basal concentrations and intraindividual changes until the COVID-19 pandemic. Front Public Health. (2025) 13: 1548379. doi: 10.3389/fpubh.2025.1548379
9. Del Valle, DM, Kim-Schulze, S, Huang, HH, Beckmann, ND, Nirenberg, S, Wang, B, et al. An inflammatory cytokine signature predicts COVID-19 severity and survival. Nat Med. (2020) 26:1636–43. doi: 10.1038/s41591-020-1051-9
10. Cervia, C, Zurbuchen, Y, Taeschler, P, Ballouz, T, Menges, D, Hasler, S, et al. Immunoglobulin signature predicts risk of post-acute COVID-19 syndrome. Nat Commun. (2022) 13:446. doi: 10.1038/s41467-021-27797-1
11. Porta, M, Pumarega, J, Henríquez-Hernández, LA, Gasull, M, Bartoll, X, Arrebola, JP, et al. Reductions in blood concentrations of persistent organic pollutants in the general population of Barcelona from 2006 to 2016. Sci Total Environ. (2021) 777:146013. doi: 10.1016/j.scitotenv.2021.146013
12. Gasull, M, Camargo, J, Pumarega, J, Henríquez-Hernández, LA, Campi, L, Zumbado, M, et al. Blood concentrations of metals, essential trace elements, rare earth elements and other chemicals in the general adult population of Barcelona: distribution and associated sociodemographic factors. Sci Total Environ. (2024) 909:168502. doi: 10.1016/j.scitotenv.2023.168502
13. Pons, MJ, Gomes, C, Aguilar, R, Barrios, D, Aguilar-Luis, MA, Ruiz, J, et al. Immunosuppressive and angiogenic cytokine profile associated with Bartonella bacilliformis infection in post-outbreak and endemic areas of carrion’s disease in Peru. PLoS Negl Trop Dis. (2017) 11:e0005684. doi: 10.1371/journal.pntd.0005684
14. Rubio, R, Aguilar, R, Bustamante, M, Muñoz, E, Vázquez-Santiago, M, Santano, R, et al. Maternal and neonatal immune response to SARS-CoV-2, IgG transplacental transfer and cytokine profile. Front Immunol. (2022) 13:999136. doi: 10.3389/fimmu.2022.999136
15. Ortega, N, Ribes, M, Vidal, M, Rubio, R, Aguilar, R, Williams, S, et al. Seven-month kinetics of SARS-CoV-2 antibodies and role of pre-existing antibodies to human coronaviruses. Nat Commun. (2021) 12:4740. doi: 10.1038/s41467-021-24979-9
16. Dobaño, C, Vidal, M, and Santano, R. Highly sensitive and specific multiplex antibody assays to quantify immunoglobulins M, a, and G against SARS-CoV-2 antigens. J Clin Microbiol. (2020) 59:e01731. doi: 10.1128/JCM.01731-20
17. World Health Organization (WHO). Public health surveillance for COVID-19 interim guidance. (2022). WHO/2019-nCoV/SurveillanceGuidance/2022.1. Available online at: https://www.who.int/publications/i/item/WHO-2019-nCoV-SurveillanceGuidance-2022.1 (Accessed June 2, 2025).
18. Lash, TL, VanderWeele, TJ, Haneuse, S, and Rothman, KJ, eds. Modern epidemiology. 4th. ed., Philadelphia: Wolters-Kluwer, (2021): 390–392.
19. Porta, M., Greenland, S., and Hernán, M. eds. A dictionary of epidemiology. 6th. edition. New York: Oxford University Press and International Epidemiological Association, (2014): 261–262.
20. Julian, P, and Helsel, D (2021). NADA2: data analysis for censored environmental data. R package version 1.0.2.
21. Dunn, PK, and Smyth, GK. Generalized linear models with examples in R. New York: Springer (2018).
22. Dobaño, C, Santano, R, and Jiménez, A. Immunogenicity and crossreactivity of antibodies to the nucleocapsid protein of SARS-CoV-2: utility and limitations in seroprevalence and immunity studies. Transl Res. (2021) 232:60–74. doi: 10.1016/j.trsl.2021.02.006
23. Abela, IA, Schwarzmüller, M, Ulyte, A, Radtke, T, Haile, SR, Ammann, P, et al. Cross-protective HCoV immunity reduces symptom development during SARS-CoV-2 infection. MBio. (2024) 15:e0272223. doi: 10.1128/mbio.02722-23
24. Murray, SM, Ansari, AM, Frater, J, Klenerman, P, Dunachie, S, Barnes, E, et al. The impact of pre-existing cross-reactive immunity on SARS-CoV-2 infection and vaccine responses. Nat Rev Immunol. (2023) 23:304–16. doi: 10.1038/s41577-022-00809-x
25. Poston, D, Weisblum, Y, Wise, H, Templeton, K, Jenks, S, Hatziioannou, T, et al. Absence of severe acute respiratory syndrome coronavirus 2 neutralizing activity in Prepandemic sera from individuals with recent seasonal coronavirus infection. Clin Infect Dis. (2021) 73:e1208–11. doi: 10.1093/cid/ciaa1803
26. Lee, M. Lack of severe acute respiratory syndrome coronavirus 2 neutralization by antibodies to seasonal coronaviruses: making sense of the coronavirus disease 2019 pandemic. Clin Infect Dis. (2021) 73:e1212–3. doi: 10.1093/cid/ciab011
27. Miyara, M, Saichi, M, Sterlin, D, Anna, F, Marot, S, Mathian, A, et al. Pre-COVID-19 immunity to common cold human coronaviruses induces a recall-type IgG response to SARS-CoV-2 antigens without cross-neutralisation. Front Immunol. (2022) 13:790334. doi: 10.3389/fimmu.2022.790334
28. Jaago, M, Rähni, A, Pupina, N, Pihlak, A, Sadam, H, Tuvikene, J, et al. Differential patterns of cross-reactive antibody response against SARS-CoV-2 spike protein detected for chronically ill and healthy COVID-19 naïve individuals. Sci Rep. (2022) 12:16817. doi: 10.1038/s41598-022-20849-6
29. Pothast, CR, Dijkland, RC, Thaler, M, Hagedoorn, RS, Kester, MGD, Wouters, AK, et al. SARS-CoV-2-specific CD4+ and CD8+ T cell responses can originate from cross-reactive CMV-specific T cells. eLife. (2022) 11:e82050. doi: 10.7554/eLife.82050
30. Lipsitch, M, Grad, YH, Sette, A, and Crotty, S. Cross-reactive memory T cells and herd immunity to SARS-CoV-2. Nat Rev Immunol. (2020) 20:709–13. doi: 10.1038/s41577-020-00460-4
31. Aran, D, Beachler, DC, Lanes, S, and Overhage, JM. Prior presumed coronavirus infection reduces COVID-19 risk: a cohort study. J Inf Secur. (2020) 81:923–30. doi: 10.1016/j.jinf.2020.10.023
32. Sagar, M, Reifler, K, Rossi, M, Miller, NS, Sinha, P, White, LF, et al. Recent endemic coronavirus infection is associated with less-severe COVID-19. J Clin Invest. (2021) 131:e143380. doi: 10.1172/JCI143380
33. Dos Santos Alves, RP, Timis, J, and Miller, R. Human coronavirus OC43-elicited CD4+ T cells protect against SARS-CoV-2 in HLA transgenic mice. Nat Commun. (2024) 15:787. doi: 10.1038/s41467-024-45043-2
34. Frozza, FTB, Fazolo, T, de Souza, PO, Lima, K, da Fontoura, JC, Borba, TS, et al. A high CMV-specific T cell response associates with SARS-CoV-2-specific IL-17 T cell production. Med Microbiol Immunol. (2023) 212:75–91. doi: 10.1007/s00430-022-00758-1
35. Jo, N, Zhang, R, Ueno, H, Yamamoto, T, Weiskopf, D, Nagao, M, et al. Aging and CMV infection affect pre-existing SARS-CoV-2-reactive CD8+ T cells in unexposed individuals. Front Aging. (2021) 2:719342. doi: 10.3389/fragi.2021.719342
36. Damelang, T, Brinkhaus, M, van Osch, TLJ, Schuurman, J, Labrijn, AF, Rispens, T, et al. Impact of structural modifications of IgG antibodies on effector functions. Front Immunol. (2024) 14:1304365. doi: 10.3389/fimmu.2023.1304365
37. Barzegar-Amini, M, Mahmoudi, M, Dadgarmoghaddam, M, Farzad, F, Najafabadi, AQ, and Jabbari-Azad, F. Comparison of serum total IgA levels in severe and mild COVID-19 patients and control group. J Clin Immunol. (2022) 42:10–8. doi: 10.1007/s10875-021-01149-6
38. Mohd Zawawi, Z, Kalyanasundram, J, Mohd Zain, R, Thayan, R, Basri, DF, and Yap, WB. Prospective roles of tumor necrosis factor-alpha (TNF-α) in COVID-19: prognosis, therapeutic and management. Int J Mol Sci. (2023) 24:6142. doi: 10.3390/ijms24076142
39. Gasparello, J, d’Aversa, E, Breveglieri, G, Borgatti, M, Finotti, A, and Gambari, R. In vitro induction of interleukin-8 by SARS-CoV-2 spike protein is inhibited in bronchial epithelial IB3-1 cells by a miR-93-5p agomiR. Int Immunopharmacol. (2021) 101:108201. doi: 10.1016/j.intimp.2021.108201
40. Hamza, AM, Ali, WDK, Hassanein, N, Albassam, WB, Barry, M, AlFaifi, AMM, et al. Relation between macrophage inflammatory protein-1 and intercellular adhesion molecule-1 and computed tomography findings in critically-ill saudi covid-19 patients. J Infect Public Health. (2022) 15:1497–502. doi: 10.1016/j.jiph.2022.10.023
41. Dieu-Nosjean, MC, Vicari, A, Lebecque, S, and Caux, C. Regulation of dendritic cell trafficking: a process that involves the participation of selective chemokines. J Leukoc Biol. (1999) 66:252–62. doi: 10.1002/jlb.66.2.252
42. Sozzani, S, Allavena, P, Vecchi, A, and Mantovani, A. Chemokines and dendritic cell traffic. J Clin Immunol. (2000) 20:151–60. doi: 10.1023/A:1006659211340
43. Sallusto, F, and Lanzavecchia, A. Understanding dendritic cell and T-lymphocyte traffic through the analysis of chemokine receptor expression. Immunol Rev. (2000) 177:134–40. doi: 10.1034/j.1600-065X.2000.17717.x
44. Larsson, M, Beignon, AS, and Bhardwaj, N. DC-virus interplay: a double edged sword. Semin Immunol. (2004) 16:147–61. doi: 10.1016/j.smim.2004.02.002
45. Huston, MM, Moore, JP, Mettes, HJ, Tavana, G, and Huston, DP. Human B cells express IL-5 receptor messenger ribonucleic acid and respond to IL-5 with enhanced IgM production after mitogenic stimulation with Moraxella catarrhalis. J Immunol. (1996) 156:1392–401. doi: 10.4049/jimmunol.156.4.1392
46. Upadhyaya, B, Yin, Y, Hill, BJ, Douek, DC, and Prussin, C. Hierarchical IL-5 expression defines a subpopulation of highly differentiated human Th2 cells. J Immunol. (2011) 187:3111–20. doi: 10.4049/jimmunol.1101283
47. Porta, M, Gasull, M, Puigdomènech, E, Rodríguez-Sanz, M, Pumarega, J, Rebato, C, et al. Sociodemographic factors influencing participation in the Barcelona health survey study on serum concentrations of persistent organic pollutants. Chemosphere. (2009) 76:216–25. doi: 10.1016/j.chemosphere.2009.03.030
48. Klein, SL, and Flanagan, KL. Sex differences in immune responses. Nat Rev Immunol. (2016) 16:626–38. doi: 10.1038/nri.2016.90
Keywords: cytokines, immunoglobulins, etiology, risk factors, SARS-CoV-2, COVID-19, mixtures
Citation: Porta M, Pumarega J, Aguilar R, Prieto-Merino D, Campi L, Rius C, Villar-García J, Vidal M, Jimenez A, Peña A, Muñoz M-Á, Trasande L, Bolúmar F, Moncunill G, Gasull M and Dobaño C (2025) Prepandemic levels of cytokines and immunoglobulins and risk of SARS-CoV-2 infection and COVID-19 in the general population of Barcelona. Front. Public Health. 13:1548456. doi: 10.3389/fpubh.2025.1548456
Edited by:
Chiara de Waure, University of Perugia, ItalyReviewed by:
Marc Jean Struelens, Université libre de Bruxelles, BelgiumBlanka Wolszczak Biedrzycka, University of Warmia and Mazury in Olsztyn, Poland
Copyright © 2025 Porta, Pumarega, Aguilar, Prieto-Merino, Campi, Rius, Villar-García, Vidal, Jimenez, Peña, Muñoz, Trasande, Bolúmar, Moncunill, Gasull and Dobaño. This is an open-access article distributed under the terms of the Creative Commons Attribution License (CC BY). The use, distribution or reproduction in other forums is permitted, provided the original author(s) and the copyright owner(s) are credited and that the original publication in this journal is cited, in accordance with accepted academic practice. No use, distribution or reproduction is permitted which does not comply with these terms.
*Correspondence: Miquel Porta, bXBvcnRhQGltaW0uZXM=
†These authors have contributed equally to this work
‡ORCID: Miquel Porta, http://orcid.org/0000-0003-1684-7428