 Na Zhao
 Yameng Fan
- 1Office for Nosocomial Infection Control, Xi'an Central Hospital, Xi'an, China
- 2School of Public Health, Xi'an Medical University, Xi'an, China
Background: The association between cardiovascular disease health (CVH) and frailty has not been conclusive. The American Heart Association (AHA) has proposed the Life's Essential 8 (LE8) score as an indicator of CVH. We sought to examine the association between LE8 and frailty among older people from the US general population.
Methods: We analyzed data from the 2015–2018 National Health and Nutrition Examination Survey and included older people aged ≥60 years. The LE8 score includes 8 metrics (4 health behaviors and 4 health factors). Frailty status was assessed using the FRAIL scale based on 5 criteria. Multivariate logistic regression analyses were used to assess associations.
Results: A total of 2,511 older people (aged 60 years, with a weighted number of 49,532,259) were included. Among them, 1,294 (weighted percentage: 46.0%) were male and 1,217 (weighted percentage: 54.0%) were female. Older people with a higher LE8 score had a lower risk of frailty, the odds ratio (OR) for each standard deviation (SD) increase in the LE8 score was 0.59 (95% CI, 0.48–0.71, P< 0.001). Similar results were observed in the associations of the health behaviors [OR 0.62 (95% CI, 0.50–0.78), P < 0.001] and health factors [OR 0.76 (95% CI, 0.60–0.96), P = 0.024] with frailty. After excluding older people with poor health status, the results remained significant, the OR for per SD score increase was 0.57 (95% CI, 0.46–0.69, P < 0.001).
Conclusion: A higher LE8 score was associated with lower risk of frailty among older people in the US. Adherence to optimal CVH scores may be beneficial in helping prevent frailty.
Introduction
Globally, the aging population is increasing much faster than in the past, and this demographic transition will have a serious impact on all aspects of society. According to the World Health Organization, the proportion of the world's population over 60 years will nearly double from 12% to 22% between 2015 and 2050 (1). Frailty, a complex age-related clinical condition, is characterized by a decline in physiological function and reserves across multiple systems, including fatigue, resistance, ambulation, illness, and weight loss, especially in the context of aging (2–4). The prevalence of frailty among individuals aged 65 years and older has increased by 5.1% in the past decade, underscoring the importance of early intervention (5, 6). Due to aging and frailty, countries worldwide will face increased pressure on health care systems and a huge economic burden (7). Given the poor health outcomes related to frailty, it is imperative to identify modifiable risk factors to delay or prevent the development of frailty.
Despite the decline in mortality rates from cardiovascular disease (CVD) over the years, CVD remains a major chronic disease worldwide and a leading cause of death (8). While CVD prevalence in the general population was 9.04%, it is significantly higher among older adults, where it reaches 16.85% (9), and even higher in those with cancer, diabetes, hypertension, and other diseases (10–13). Based on such findings, the American Heart Association (AHA) updated the Life's Essential 8 (LE8) score as a measure of cardiovascular health (CVH) to reduce the prevalence of CVD and further improve the health of the general population. The components of LE8 include healthy diet, physical activity, nicotine exposure, sleep, body mass index, blood lipids, blood glucose, and blood pressure, which are closely related to aging (8). For example, the promotion of physical activity in older adults goes beyond its well-documented benefits on physical, psychological, and cognitive health (14); Strength training emerges as a key strategy for healthy aging, as it not only prevents frailty and falls but also improves the quality of life in older adults (15).
It has been reported that if all US adults maintained a high CVH, 2.0 million CVD events would be prevented each year (16). Recent studies have shown that having better CVH is associated with more favorable long-term health outcomes for older people, especially in terms of cognitive function and quality of life (17–19). Thus, improving CHV may be an appropriate prevention and management strategy to reduce the prevalence of frailty.
Given the evidence that better cardiovascular health is associated with improved outcomes in older adults, this study aimed to analyze the association between the LE8 score and frailty in a large, nationally representative, and ethnically diverse sample of older adults in the US, using data from the NHANES 2015–2018.
Methods
Study participants
Data were extracted from the National Health and Nutrition Examination Survey (NHANES), which conducts continuous 2-year cycle cross-sectional surveys. These surveys are administered by the National Center for Health Statistics (NCHS) under the Centers for Disease Control and Prevention (CDC) (20). All procedures performed in the study were in accordance with recommendations of the CDC and the NCHS. Informed consent was obtained from all individual participants. The present analysis combined data from the last two NHANES cycles (NHANES 2015–2016 and 2017–2018). We included a total of 4,051 individuals aged ≥60 years. Due to missing data being unable to provide reliable results, it is necessary to delete them. Exclusion criteria were as follows: 854 participants had missing data for any component of the LE8 metrics, 441 had missing data for frailty components, and 245 had missing covariate data. After exclusions, 2,511 individuals were included in the final analysis (Figure 1).
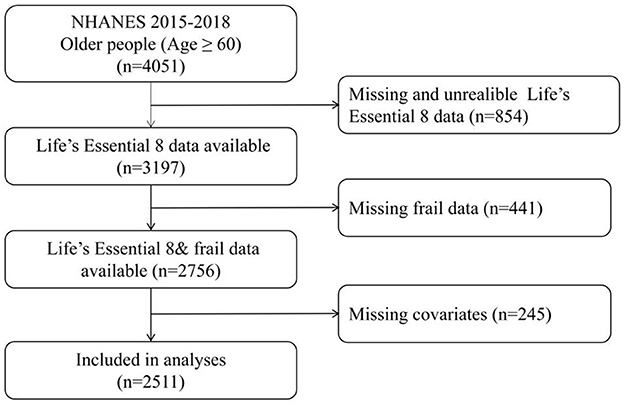
Figure 1. Flow diagram of the study sample selection.
Development of LE8
The LE8 score is a standardized tool defined by the AHA to measure and monitor CVH in individuals and populations. The LE8 includes eight metrics and has been grouped into 2 domains of health behaviors (healthy diet, physical activity, nicotine exposure, sleep) and health factors (body mass index, blood lipids, blood glucose, blood pressure). The PA score, the nicotine exposure score and the sleep score were obtained according to a self-reported questionnaire. The BMI score, blood lipids score, blood glucose score, and BP score were obtained according to examination data and laboratory data. The specific scoring standards for each metric are shown in Supplementary Table 1. In brief, each of the 8 CHV metrics was scored with a range of 0–100 points. The LE8 score was calculated as the unweighted average of all 8-component metrics. Furthermore, the LE8 score was grouped into 3 categories, high CVH (80–100 points), moderate CVH (50–79 points), low CVH (0–49 points) by the AHA (8). The health behaviors and the health factors were also grouped into three categories of high, moderate, and low. Specifically, diet information was evaluated by the Healthy Eating Index 2015 (HEI-2015) in this study, which is a quality index developed in partnership by USDA and NCI, researchers. In summary, higher HEI-2015 scores reflect better diet quality (21, 22). The components and scoring standards of HEI-2015 are shown in Supplementary Table 2.
Assessment of physical frailty status
Frailty status was assessed using the FRAIL scale, which consists of five simple questions, each requiring a yes or no answer, with a score of one given to each “yes” response. Participants meeting three or more items were considered as frail; those who met one or two items were pre-frail; and those who met none of the items were robust. The FRAIL scale is entirely based on self-report with the following criteria (23–25):
1. Fatigue: defined as “yes” of these responses “more than half of the days” or “nearly every day” to the question “How often have you been feeling tired or having little energy?” yes = 1, no = 0
2. Resistance: defined as “yes” of these responses “some difficulty”, “much difficulty”, “unable to do” or “do not do this activity” to the question “How much difficult do you have walking up ten stairs by yourself ?” yes = 1, no = 0
3. Ambulation: defined as “yes” of these responses “some difficulty”, “much difficulty”, “unable to do” or “do not do this activity” to the question “How much difficult do you have walking for a quarter of a mile alone and without using special equipment ?” yes = 1, no = 0
4. Illness: defined as “yes” of participants with 5 or more of a total of 11 diseases (hypertension, diabetes, cancer, chronic lung disease, heart attack, congestive heart failure, angina, asthma, arthritis, stroke, and kidney disease). yes = 1, no = 0
5. Weight loss: defined as “yes” of weight loss by a decrease of ≥5% within the last 12 months, the percentage of weight change is calculated as: [(weight 1 year ago – current weight)/weight 1 year ago] × 100. yes = 1, no = 0
Covariates
Covariates (age, gender, race, marital status, education, income) were included in this study. Age was stratified into 2 strata: 60–69 years, 70 years or older. gender was classified as male or female. Race was classified as Mexican American, other Hispanic, Non-Hispanic White, non-Hispanic Black, and Other. The educational level was classified as lower than high school, high school, and higher than high school. Marital status was categorized as single or separated (widowed, divorced, separated, never married), and coupled (married, living with partner). Income was expressed using the monthly poverty level index and was classified into 3 groups (≤ 1.30, 1.31–1.85, >1.85), with a higher index indicating better income (26). All demographic characteristics were collected through questionnaire interviews. The general health condition of the participants was collected using self-report questionnaires and was classified as excellent, very good, good, fair, and poor.
Statistical analysis
The NHANES uses a complex and multistage probability sampling design; thus all analyses accounted for sample weights in this study. Categorical variables were described as frequencies and weighted percentages, and continuous variables were described as weighted means and standard error (SE). The baseline characteristics were described according to the frail and non-frail group. The baseline characteristics were compared using the Chi-square test for categorical variables and the unadjusted linear regressions for continuous variables.
The odds of being frail compared to non-frail (the combined pre-frail or robust groups) were explored using weighted binary logistic regression, after adjusting for possible confounders. Model 1 was unadjusted; Model 2 was adjusted for age, gender, and race; Model 3 was further adjusted for marital status, education, and the poverty level index. Potential linear or nonlinear relationships were examined with restricted cubic splines via the SAS macro “%RCS_Reg” (27). Then, the multinomial logistic regression model was used to estimate the odds of three frailty categories (pre-frail vs. robust; frail vs. robust). Subgroup analyses were conducted to test according to age strata, gender, race, marital status, education, and income. Finally, Sensitivity analyses were conducted by removing people with cancer or stroke to evaluate the robustness of our results. Data management and restricted cubic splines were performed using SAS v.9.4 (SAS Institute, Cary, North Carolina, USA) and all statistical analyses were performed using Stata v.17.0 (IBM, Armonk, NY, USA). The two-tailed P < 0.05 was considered statistically significant.
Results
Characteristics of the study population
The characteristics of the study population were described dividing patients into the frail and non-frail group in Table 1. A total of 2,511 (weighted number, 49,532,259) older participants aged ≥60 years were included, with 1,376 [weighted percentage (WP), 57.9%] participants aged 60–69 years and 1,135 (WP, 42.1%) aged ≥70 years; 1,294 (WP, 46.0%) were men and 1,217 (WP, 54.0%) were women. There were significant differences in terms of age, gender, education, or family monthly poverty level in the frail and non-frail groups, while no significant differences were observed in race and marital status between the two groups. In summary, older, female, low-education, and low-income participants are more likely to be frail.
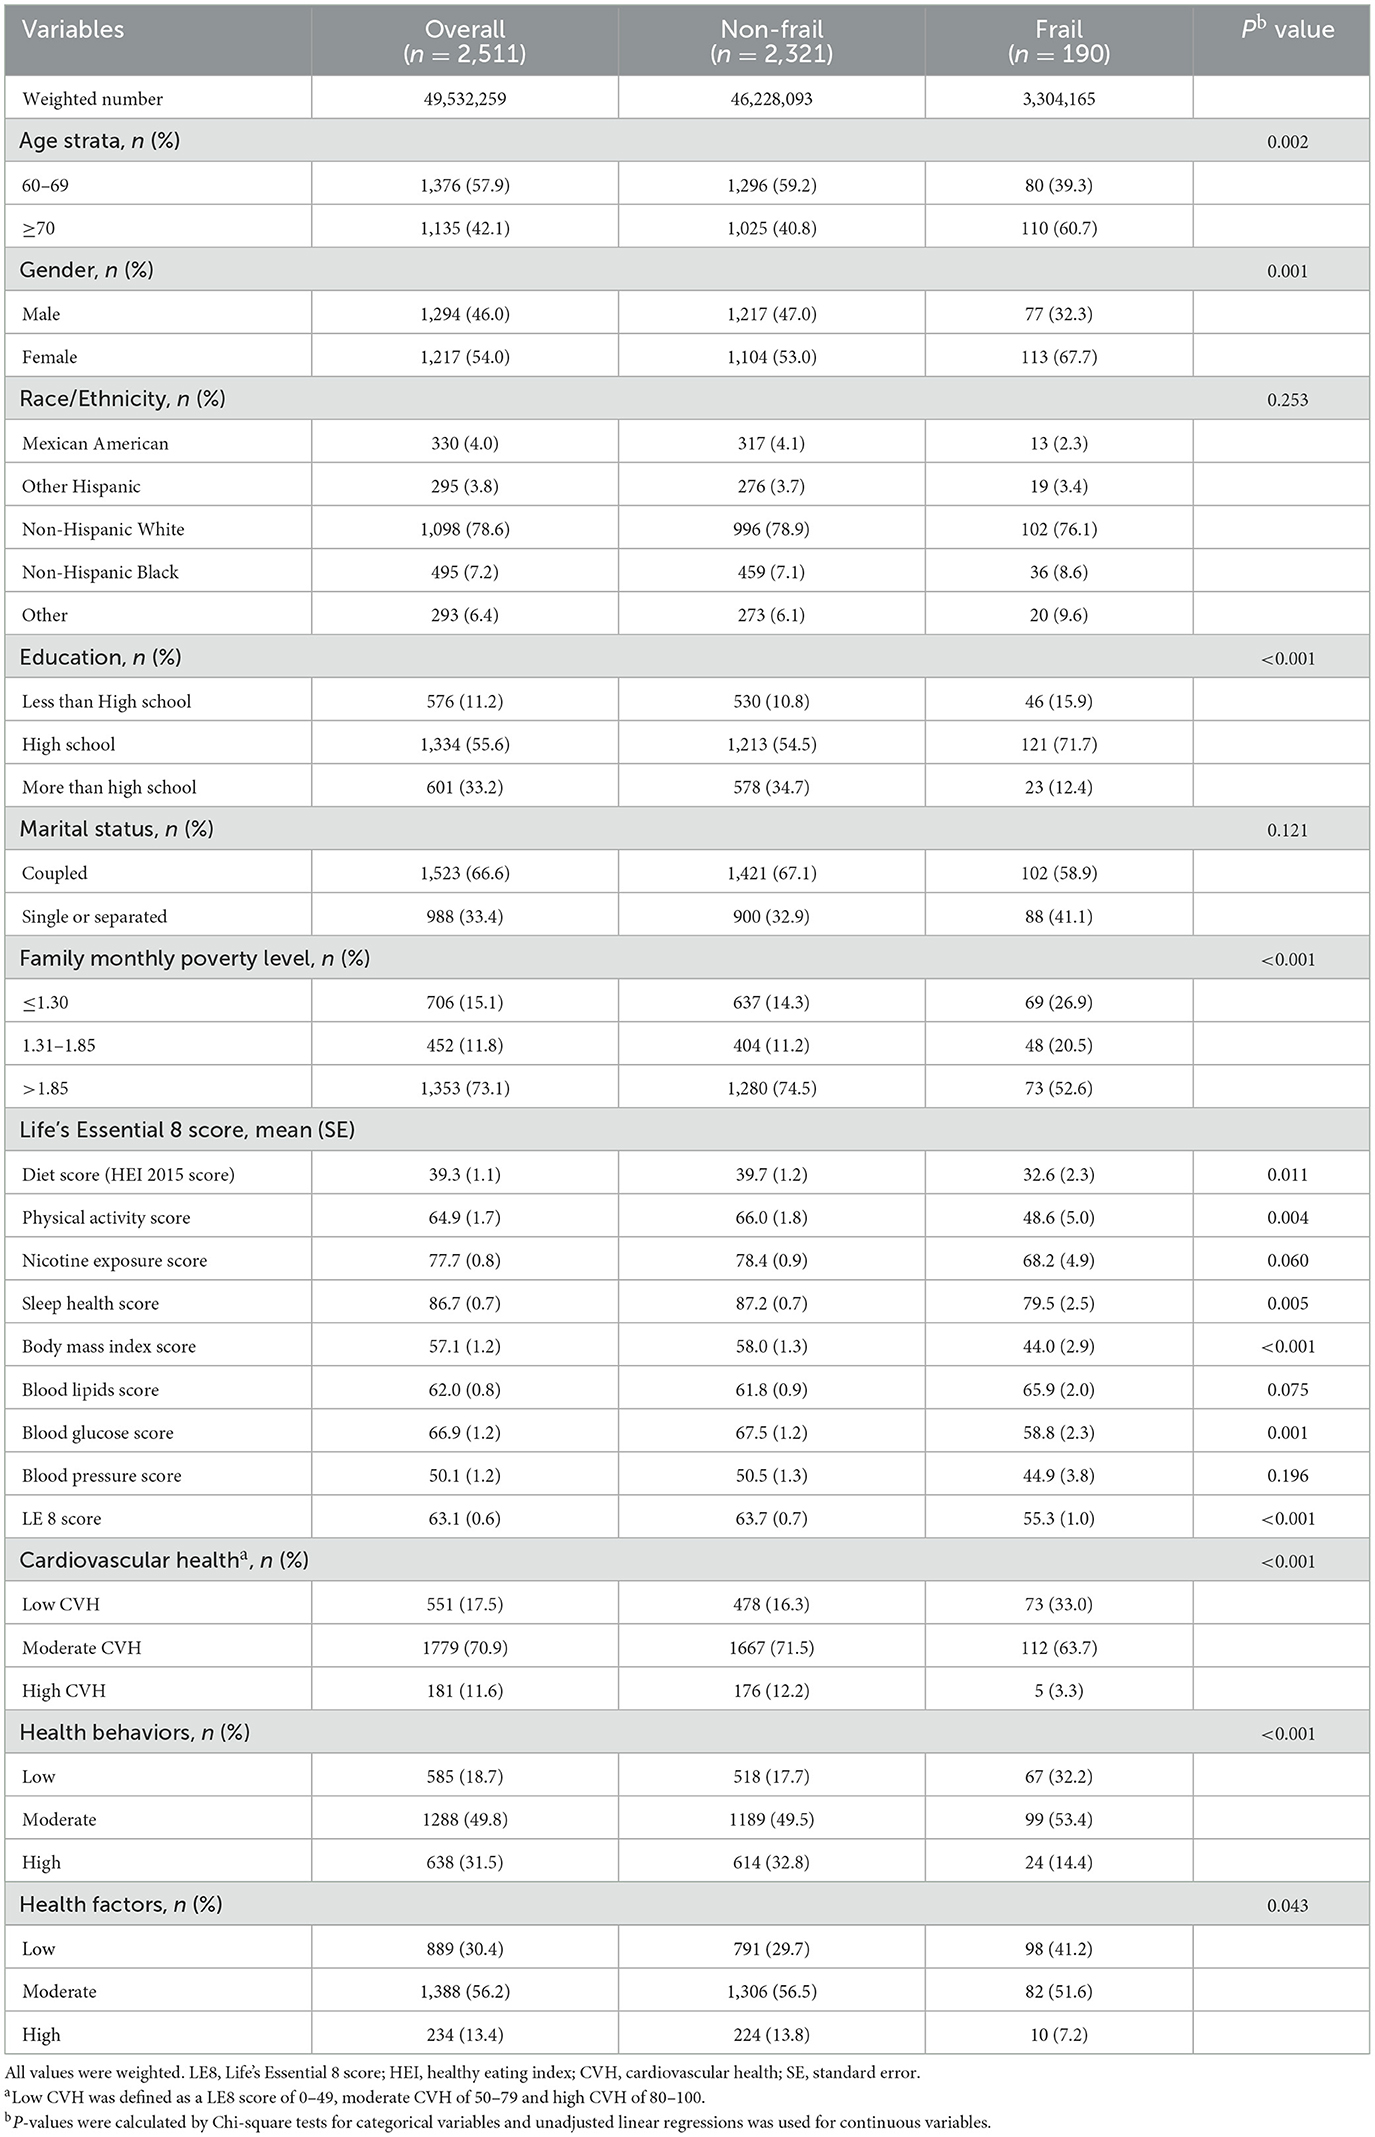
Table 1. Characteristics of the participants and CVH metrics by frail status, NHANES 2015–2018.
The weighted mean of the LE8 score of the study participants was 63.1 (95% CI, 61.8–64.4). The LE8 score was significantly higher in the non-frail group than in the frail group (P < 0.001). Compared to the frail group, non-frail participants had a higher diet score, PA score, nicotine exposure score, sleep health score, body mass index score, and blood glucose score. However, there was no significant difference in nicotine exposure score, blood lipid score, and blood pressure score between the two groups. Participants with low, moderate, and high CVH were 551 (WP, 17.5%), 1,779 (WP, 70.9%), and 181 (WP, 11.6%), separately. LE8 has been grouped into health behaviors and health factors by AHA. Either health behaviors (P < 0.001) or health factors (P = 0.043) showed significant differences in the frail and non-frail groups.
LE8 score and frailty
Table 2 presents the results of the weighted multiple logistic regression analysis. In the unadjusted analysis Model 1, compared with the low CVH group, the odds ratios (OR) for frailty were 0.44 (95% CI, 0.28–0.69; P = 0.001) in the moderate CVH group and 0.14 (95% CI, 0.04–0.50; P = 0.004) in the high CVH group. In further adjusted Model 2, the high CVH group was also associated with lower odds of frailty (OR: 0.13; 95% CI, 0.04–0.47; P = 0.003), compared to the low CVH group. After additionally adjusting for education, marital status, and family monthly poverty level in Model 3, the association of the LE8 score with frailty (OR: 0.21; 95% CI, 0.07–0.67; P = 0.010) attenuated but remained significant. In all three models, a significantly lower odds of frailty was observed in participants with a higher LE8 score. The ORs of frailty in Models 1, 2, and 3 were 0.56 (95% CI, 0.46–0.68; P < 0.001), 0.52 (95% CI, 0.43–0.64; P < 0.001), and 0.59 (95% CI, 0.48–0.71; P < 0.001) for each SD increase of the LE8 score, respectively.
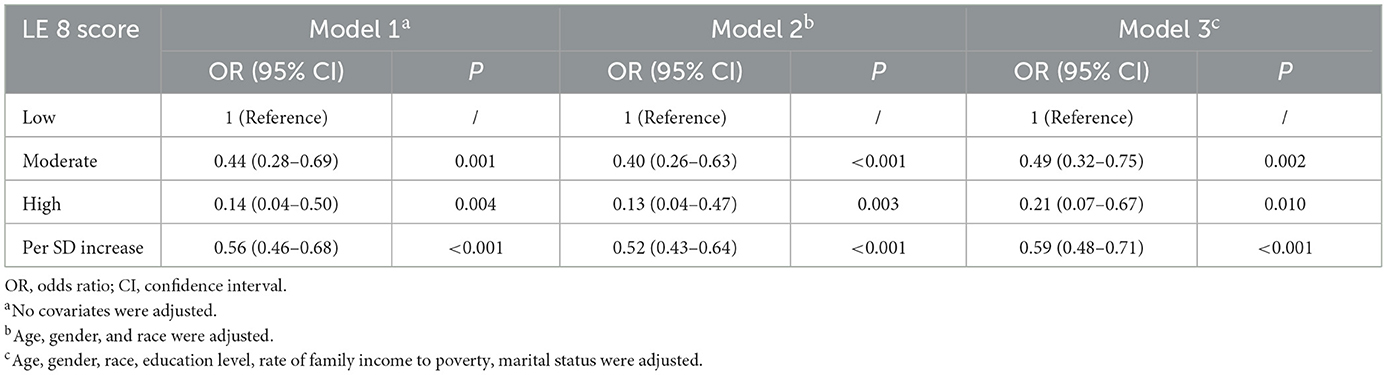
Table 2. Odds ratios and 95% confidence intervals of Life's Essential 8 scores for two frailty status (frail vs. non-frail, n = 2,511).
A dose-response relationship between the LE8 score and frailty status (frail vs. non-frail) was observed. As shown in Figure 2, the LE8 score was negatively associated with frailty in a linear manner (Poverallassociation <0.0001; Pnonlinearassociation = 0.5422).

Figure 2. Dose-response relationship between the LE8 score and frailty status. Models were adjusted for age, gender, race, education level, rate of family income to poverty, and marital status.
The odds of being pre-frail or frail compared to robust were further explored using multinomial logistic regression. After full adjustment, participants in the high CVH group were less likely to be pre-frail (P < 0.001) or frail (P < 0.001) compared with participants in the low CVH group (Table 3).
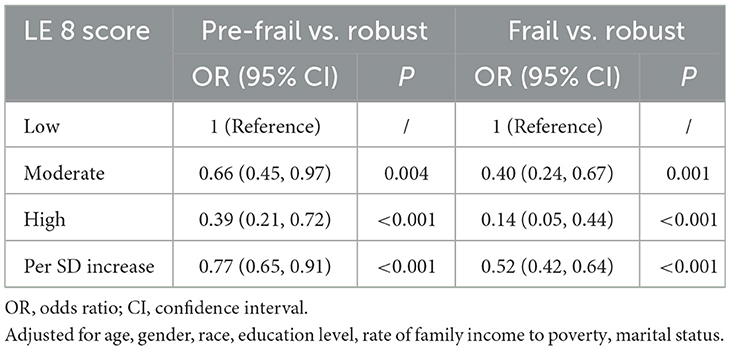
Table 3. Odds ratios and 95% confidence intervals of Life's Essential 8 scores for three frailty status (pre-frail vs. robust/frail vs. robust, n = 2511).
Health behaviors/health factors and frailty
We also analyzed the associations of the health behavior/health factors scores with frailty by logistic regression analysis in Table 4. In the fully adjusted Model 3, compared with low health behaviors group, the ORs for frailty were 0.64 (95% CI, 0.40–1.03; P = 0.063) in the moderate behaviors group and 0.32 (95% CI, 0.15–0.68; P = 0.004) in the high health behaviors group, respectively. When per SD increase in the health behaviors score, the OR for frailty was 0.58 (95% CI, 0.47–0.72; P < 0.001) in Model 1, 0.55 (95% CI, 0.44–0.69; P < 0.001) in Model 2, and 0.62 (95% CI, 0.50–0.78; P < 0.001) in Model 3. For all models, a high healthy behaviors score was significantly associated with lower odds of frailty.
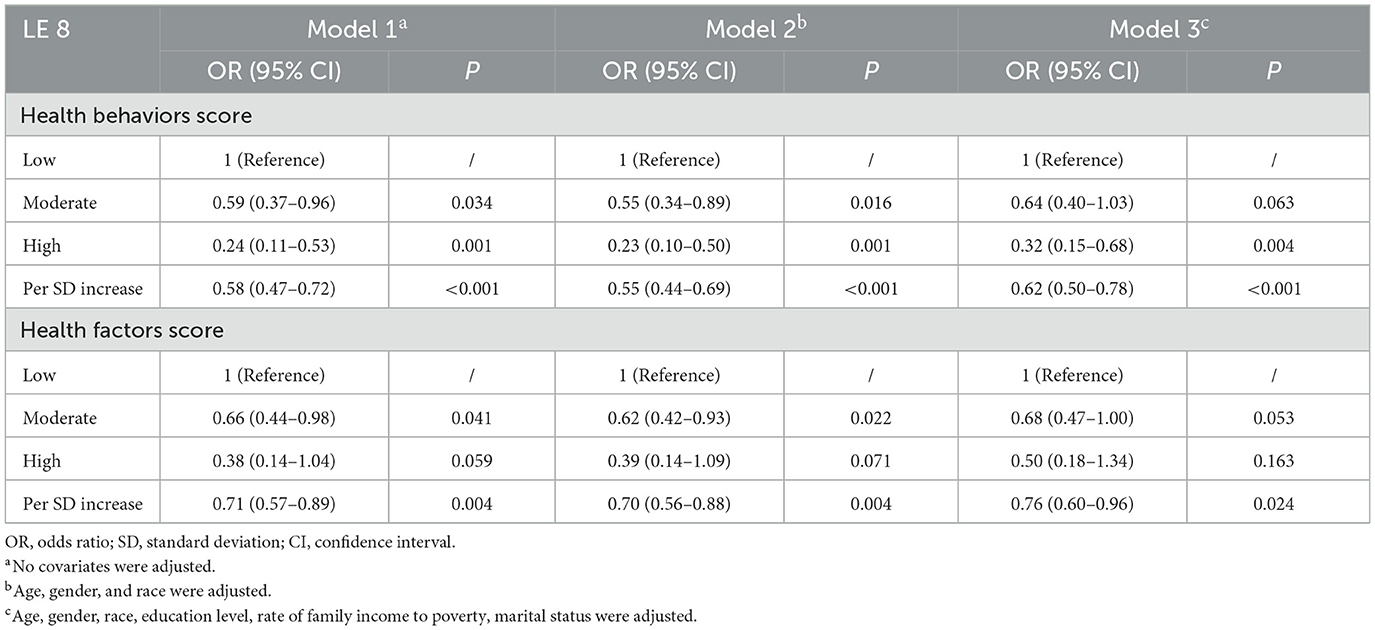
Table 4. Odds ratios and 95% confidence intervals of Life's Essential 8 scores for frailty status (n = 2,511).
Compared with the low health factors group, the ORs for frailty were 0.68 (95% CI, 0.47–1.00; P = 0.053) in the moderate group and 0.50 (95% CI, 0.18–1.34; P = 0.163) in the high group after full adjustment. For the per SD increase in health factors score, the ORs for frailty were 0.71(95% CI, 0.57–0.89; P = 0.004) in Model 1, 0.70 (95% CI, 0.56–0.88; P = 0.004) in Model 2, and 0.76 (95% CI, 0.60–0.96; P = 0.024) in Model 3.
A dose-response relationship between the LE8 behaviors score/LE8 factors score and frailty status (frail vs. non-frail) was observed. As shown in Figure 3, the LE8 behaviors score was negatively associated with frailty in a linear manner (Poverallassociation <0.0001; Pnonlinearassociation = 0.3265). Similarly, the LE8 factors score was negatively associated with frailty in a linear manner (Poverallassociation <0.0001; Pnonlinearassociation = 0.4179), as presented in Figure 4.
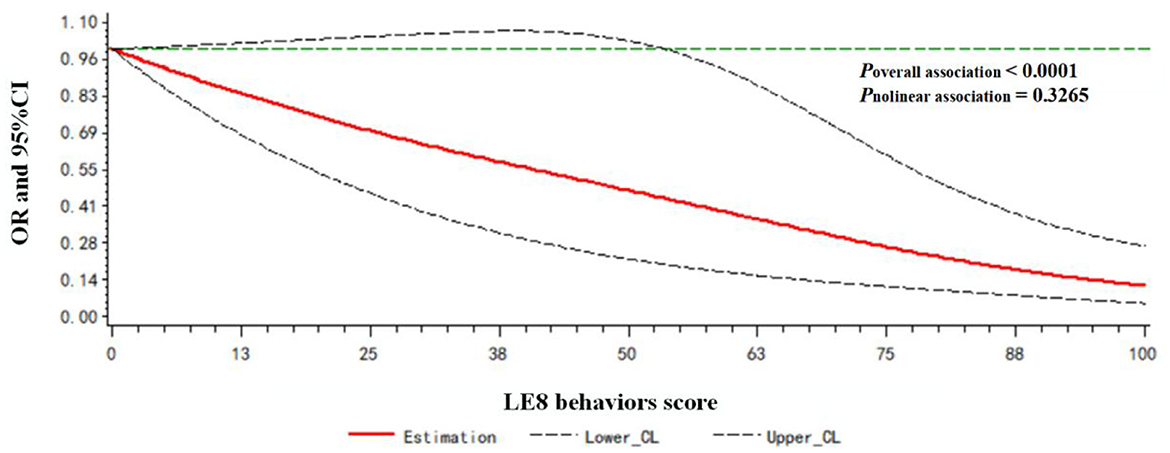
Figure 3. Dose-response relationship between the LE8 behaviors score and frailty status. Models were adjusted for age, gender, race, education level, rate of family income to poverty, and marital status.
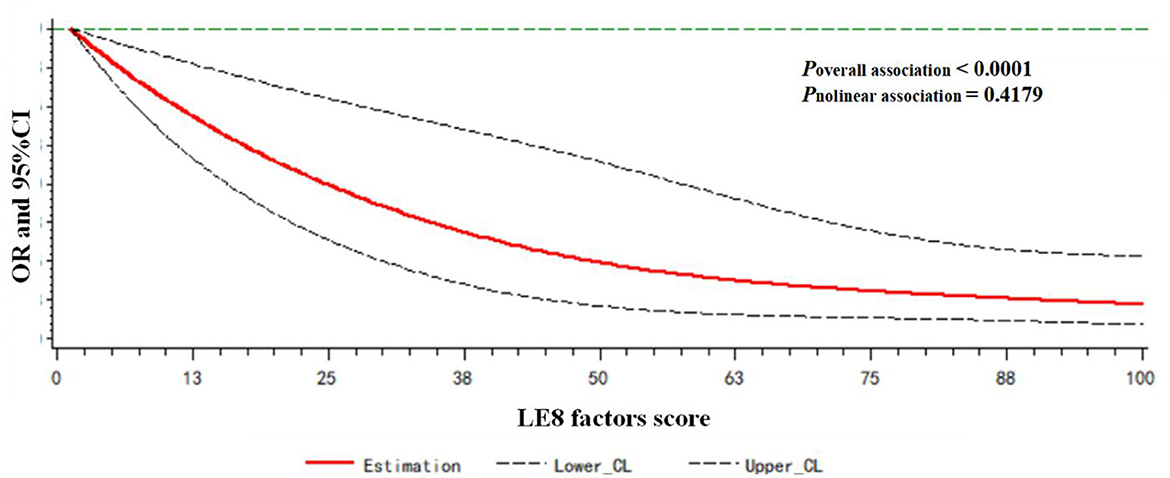
Figure 4. Dose-response relationship between the LE8 factors score and frailty status. Models were adjusted for age, gender, race, education level, rate of family income to poverty, and marital status.
Subgroup analysis
In the subgroup analysis, no significant interaction effects were found between the LE8 score and all covariates, including age, gender, nationality, education, marital status, and family monthly poverty level, with frailty in the fully adjusted model (Pinteraction > 0.05; Figure 5).
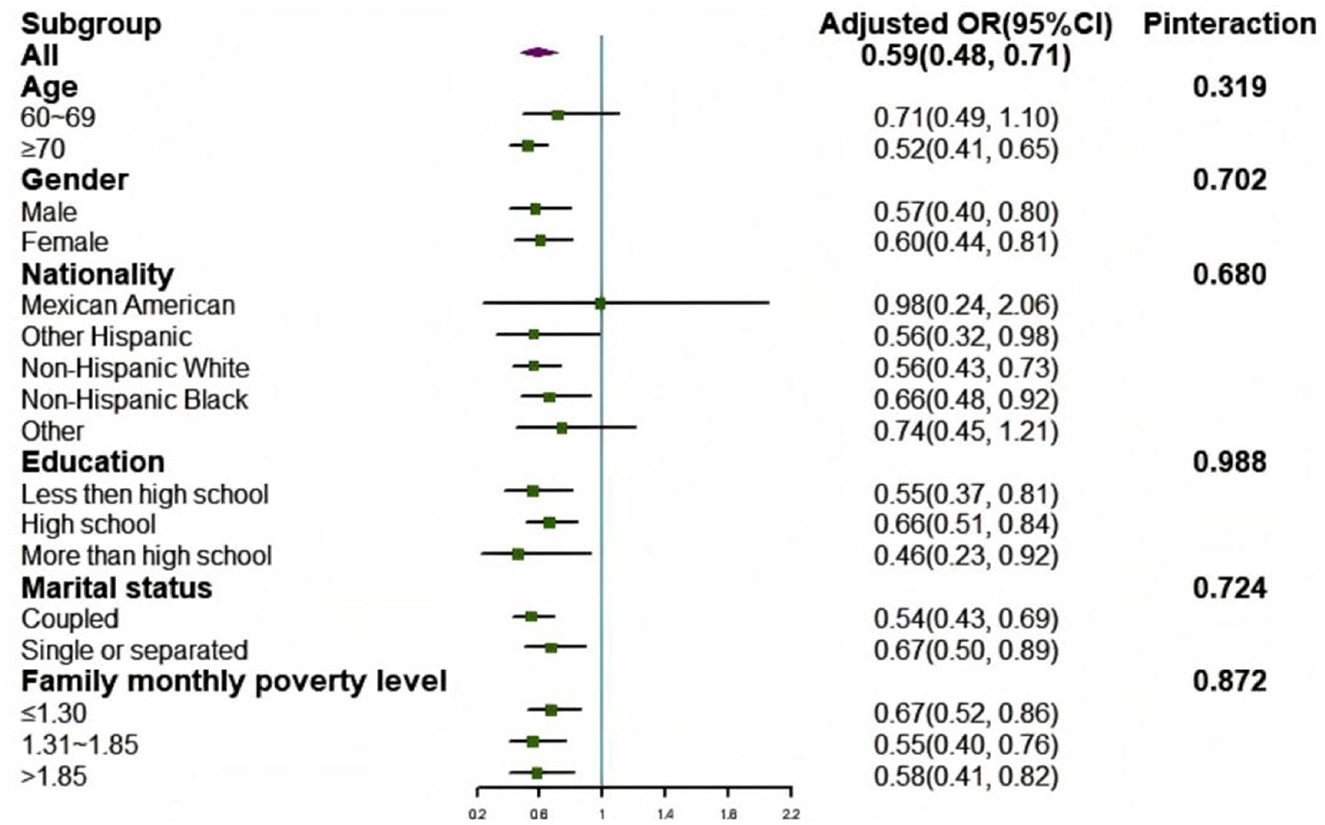
Figure 5. Subgroup analysis of the association between LE8 scores and frailty status. Each category was adjusted for age, gender, race, education level, rate of family income to poverty, and marital status. OR, odds radio; CI, confidence interval.
Sensitivity analyses
The association between the LE8 score and frailty did not appreciably change in the sensitivity analyses after excluding participants who suffered from cancer (n = 1,987; Supplementary Table 3) or stroke (n = 2,349; Supplementary Table 4).
Discussion
In this cross-sectional study, our findings indicated that higher levels of CHV assessed by the LE8 score were significantly associated with a lower risk of frailty in older people in the US. After excluding participants with cancer or stroke, the results still remained significant.
In our study, we observed that the prevalence of frailty was 7.57% in older residents of the US, which was lower than that observed for older participants living in the community setting (10.7%) reported by a systematic review (28). One possible explanation is that the prevalence of frailty varies enormously, especially in different countries and different ethnic populations. Secondly, due to the lack of standardized assessments, there are great differences in the prevalence of frailty. In this study, we used the FRAIL scale to assess the frailty status rather than other alternative frailty assessments, such as Frailty Phenotype or Frailty Index. As these assessments share overlapping metrics with LE8, which could potentially introduce spurious associations between LE8 and frailty. Furthermore, our study indicated that women, single, and people with lower education and income had higher prevalence for frailty, which was in agreement with previous studies (7, 29, 30).
The definition of CVH was based on 4 health behaviors and 4 health factors. A better CVH was associated with better CVD-free survival, longer total longevity, and a higher quality of life (8). Previous studies on associations between CVH metrics and frailty have shown inconsistent results. As a modifiable factor, most studies have indicated that diet plays an important role in older individuals. A better diet is required to provide adequate energy and nutrition to help prevent or delay frailty. Gimeno et al. (31) showed that an optimal diet can prevent frailt. Fan et al. (26) observed that a higher HEI-2015 was inversely associated with lower odds of physical frailty among older individuals. However, no association was observed between a high Mediterranean Diet Score (MDS) and incident frailty in a prospective cohort study from Hong Kong (32). Most studies on the associations between physical activity and frailty have reached an identical conclusion. Physical activity is considered one of the main strategies to counteract physical impairment related to frailty (33). A randomized controlled trial found that a multicomponent exercise program improves physical performance and delays frailty in older people (34). Regarding BMI, most studies consider obesity or emaciation as risk factors for frailty (35–37). Furthermore, both obesity and large waist circumference were associated with systemic inflammation and insulin resistance, which was also shown to be associated with frailty (38). The sleep health index, as a new CVH metric added by the AHA, is also an influencing factor for the appearance of frailty. However, the potential mechanisms affecting how sleep quality acts on frailty status are unknown. According to previous studies, sleep quality was well established to have an impact on the development of frailty (39–41). A meta-analysis including 41,233 individuals revealed that longer and shorter durations of sleep increases the risk of frailty (42). In addition, previous studies on the relationship between blood pressure and blood sugar with frailty had inconsistent results. Wang et al. found there was no association between frailty and biometric factors, such as blood pressure, blood lipids, and blood glucose, in a prospective study by the UK Biobank (43). However, in a cross-sectional study in Brazil, frail adults had higher BP, lower HDL and more abdominal fat than non-frail adults (44).
The reasons for these inconsistencies remain the subject of further research. A potential explanation for this discrepancy lies in differences in population and assessment methods. Furthermore, these inconsistencies might also reflect the complex process of frailty. Frailty is likely the result of a multiple of CVH metrics working together rather than a single CVH metric. Therefore, we should use an aggregative indicator such as LE8 rather than a single metric to assess the association between CVH and frailty.
Several previous studies have evaluated the association between Simple 7 (LS7) and frailty. A study by Irving Medical Center of Columbia University found that a higher LS7 score was associated with a lower prevalence of frailty in later life (45). In Spain, a prospective cohort study revealed that an ideal LS7 was associated with a reduced risk of frailty in older people (46). A study by the UK Biobank observed that a higher LS7 score in midlife was associated with a lower risk of physical frailty in later life (43). However, LS7 may not reflect the full scope of health behaviors and practices in the current context. After the updated and improved approach is applied to measuring, monitoring, and modifying CVH, LE8 can better represent the full range of CVH compared to LS7. Our study evaluated the relationship between LE8 and frailty and observed that higher LE8 was significantly associated with a lower risk of frailty in older people from the USA. Compared with health factors, health behavior is easier to change and achieves obvious results to prevent frailty. According to existing research, frailty is difficult to reverse and does not have a specific treatment. Therefore, strategies to prevent and slow the progression of frailty are essential. Our findings indicated that a more rigorous standard of cardiovascular health, especially healthy behaviors, might be preferable to reduce frailty. In addition, no significant interaction effects were found in this study, which revealed that the development of CHV to improve the LE8 score was effective to reduce the incidence of frailty in all populations.
Notably, no significant interaction effects were observed in our study, indicating that the relationship between the LE8 score and frailty was consistent across age, gender, nationality, education, marital status, and family monthly poverty level. Similarly, among cancer survivors, there were no significant interaction effects stratified by factors including gender, race, education level, and marital status (47). This consistency highlights that the LE8 score is a robust indicator for assessing frailty risk. It remains reliable and unaffected by diverse demographic factors.
The present study has several strengths. To our knowledge, this is the first study to explore the association between LE8 and frailty in the general population of older individuals in the US. Second, most previous studies have been restricted to single factors, not an aggregative indicator. As a comprehensive index, LE8 can explore the relationship with frailty more comprehensively. Finally, we used data from NHANES, a large nationally representative data, which ensures the generalizability of our findings. However, several limitations should also be noted in the present study. First, as a cross-sectional study design, we were unable to establish a causal relationship between frailty and the LE8 score. Due to a potential bidirectional relationships between LE8 and frailty, we should not exclude the effect of frailty on LE8. This emphasized the need for longitudinal research in the future. Second, although the FRAIL scale is widely used, it is entirely based on self-reported data, which may introduce bias and cannot reflect the actual frailty status. Lastly, despite our meticulous efforts to control for a broad range of potential confounders, it is crucial to acknowledge that unmeasured variables may still influence our results.
Conclusions
In this nationally representative sample of older people from the US, we observed an inverse association between LE8 and frailty. This research emphasizes the vital role of CVH in reducing frailty among older people, indicating adherence to optimal CVH levels may translate into the prevention of frailty and the reduction of public health burdens. Given the rational findings and several limitations in the present study, the results should be further validated in the large prospective cohort study.
Data availability statement
Publicly available datasets were analyzed in this study. This data can be found here: https://wwwn.cdc.gov/nchs/nhanes.
Ethics statement
The studies involving humans were approved by National Center for Health Statistics Research Ethics Review Board. The studies were conducted in accordance with the local legislation and institutional requirements. The participants provided their written informed consent to participate in this study.
Author contributions
NZ: Conceptualization, Formal analysis, Writing – original draft. YF: Conceptualization, Formal analysis, Writing – review & editing.
Funding
The author(s) declare that financial support was received for the research and/or publication of this article. This study was funded by Scientific Research Foundation of Xi'an Medical College (Program No. 2023BS26), Scientific Research Program Funded by Education Department of Shaanxi Provincial Government (Program No. 24JK0644), and Natural Science Basic Research Program of Shaanxi (Program No. 2025JC-YBQN-1102).
Acknowledgments
We thank the public availability of NHANES data and thank all NHANES participants and staff for their valuable effort.
Conflict of interest
The authors declare that the research was conducted in the absence of any commercial or financial relationships that could be construed as a potential conflict of interest.
Generative AI statement
The author(s) declare that no Gen AI was used in the creation of this manuscript.
Publisher's note
All claims expressed in this article are solely those of the authors and do not necessarily represent those of their affiliated organizations, or those of the publisher, the editors and the reviewers. Any product that may be evaluated in this article, or claim that may be made by its manufacturer, is not guaranteed or endorsed by the publisher.
Supplementary material
The Supplementary Material for this article can be found online at: https://www.frontiersin.org/articles/10.3389/fpubh.2025.1554687/full#supplementary-material
References
1. Beard JR, Officer A, de Carvalho IA, Sadana R, Pot AM, Michel JP, et al. The world report on ageing and health: a policy framework for healthy ageing. Lancet. (2016) 387:2145–54. doi: 10.1016/S0140-6736(15)00516-4
2. Cohen CI, Benyaminov R, Rahman M, Ngu D, Reinhardt M. Frailty: a multidimensional biopsychosocial syndrome. Med Clin N Am. (2023) 107:183–97. doi: 10.1016/j.mcna.2022.04.006
3. Proietti M, Cesari M. Frailty: what is it? Adv Exp Med Biol. (2020) 1216:1–7. doi: 10.1007/978-3-030-33330-0_1
4. Hoogendijk EO, Afilalo J, Ensrud KE, Kowal P, Onder G, Fried LP. Frailty: implications for clinical practice and public health. Lancet. (2019) 394:1365–75. doi: 10.1016/S0140-6736(19)31786-6
5. Dent E, Martin FC, Bergman H, Woo J, Romero-Ortuno R, Walston JD. Management of frailty: opportunities, challenges, and future directions. Lancet. (2019) 394:1376–86. doi: 10.1016/S0140-6736(19)31785-4
6. Tang D, Sheehan KJ, Goubar A, Whitney J, Dl O'Connell M. The temporal trend in frailty prevalence from 2011 to 2020 and disparities by equity factors among middle-aged and older people in China: a population-based study. Arch Gerontol Geriatr. (2025) 133:105822. doi: 10.1016/j.archger.2025.105822
7. Cesari M, Calvani R, Marzetti E. Frailty in older persons. Clin Geriatr Med. (2017) 33:293–303. doi: 10.1016/j.cger.2017.02.002
8. Lloyd-Jones DM, Allen NB, Anderson C, Black T, Brewer LC, Foraker RE, et al. Life's Essential 8: updating and enhancing the American heart association's construct of cardiovascular health: a presidential advisory from the American Heart Association. Circulation. (2022) 146:e18–43. doi: 10.1161/CIR.0000000000001078
9. Platz K, Zelle H, Howie-Esquivel J. Prevalence of US adults with cardiovascular disease reporting barriers to clinician office visits: implications for accessible models for cardiac rehabilitation. J Cardiopulm Rehabil. (2022) 42:148–55. doi: 10.1097/HCR.0000000000000669
10. Lugun J, Ghosh D, Anand A, Chakraborty B, Ghosh S. Prevalence of CVD risk factors among some tribal and nontribal populations of Jharkhand - a comparative survey. Spat Spatio-Temporal. (2021) 37:100419. doi: 10.1016/j.sste.2021.100419
11. Mazalin PJ, Sonicki Z, Reiner Ž. Cardiovascular disease (CVD) risk factors in older adults - perception and reality. Arch Gerontol Geriat. (2015) 61:88–92. doi: 10.1016/j.archger.2015.04.001
12. D'Agostino RS, Vasan RS, Pencina MJ, Wolf PA, Cobain M, Massaro JM, et al. General cardiovascular risk profile for use in primary care: the Framingham Heart Study. Circulation. (2008) 117:743–53. doi: 10.1161/CIRCULATIONAHA.107.699579
13. Mbewu A, Mbanya JC. Cardiovascular disease. In: Disease and Mortality in Sub-Saharan Africa. 2nd, ed. Washington, DC: The International Bank for Reconstruction and Development/The World Bank (2006).
14. María Antonia Parra-Rizo, lgor Cigarroa, Sonia Olivera-Sánchez, Guillem-Saiz J, Agustí-López AI, González-Moreno J, et al. Sociodemographic profile of physically active older adults according to the type of physical activities practiced: gymnastic exercises, aquatic activities, yoga, pilates and dance. Retos. (2024) 56:280–8. doi: 10.47197/retos.v56.102223
15. Pablo RM, Christian TA, Rodrigo YY, Nelson MCAD, Pedro QP, Marion-Antonia PR. Strength training to prevent falls on the elderly: a systematic review. Revista Salud Uninorte. (2024) 40:216–38. doi: 10.14482/sun.40.01.650.452
16. Bundy JD, Zhu Z, Ning H, Zhong VW, Paluch AE, Wilkins JT, et al. Estimated impact of achieving optimal cardiovascular health among US adults on cardiovascular disease events. J Am Heart Assoc. (2021) 10:e19681. doi: 10.1161/JAHA.120.019681
17. Ma H, Wang X, Xue Q, Li X, Liang Z, Heianza Y, et al. Cardiovascular health and life expectancy among adults in the United States. Circulation. (2023) 147:1137–46. doi: 10.1161/CIRCULATIONAHA.122.062457
18. Liang K, Zhang X. Association between Life's Essential 8 and cognitive function: insights from NHANES 2011–2014. Front Aging Neurosci. (2024) 16:1386498. doi: 10.3389/fnagi.2024.1386498
19. Master L, Shen Y, Allan AC, et al. Associations between AHA's Life's Essential 8 and cognition in midlife and older adults. Alzheimers Dement. (2024) 20:8566–75. doi: 10.1002/alz.14294
20. Wang L, Yi J, Guo X, Ren X. Associations between Life's Essential 8 and non-alcoholic fatty liver disease among US adults. J Transl Med. (2022) 20:616. doi: 10.1186/s12967-022-03839-0
21. Krebs-Smith SM, Pannucci TE, Subar AF, Kirkpatrick SI, Lerman JL, Tooze JA, et al. Update of the healthy eating index: HEI-2015. J Acad Nutr Diet. (2018) 118:1591–602. doi: 10.1016/j.jand.2018.05.021
22. Reedy J, Lerman JL, Krebs-Smith SM, Kirkpatrick SI, Pannucci TE, Wilson MM, et al. Evaluation of the healthy eating index-2015. J Acad Nutr Diet. (2018) 118:1622–33. doi: 10.1016/j.jand.2018.05.019
23. Zheng Z, Xu W, Wang F, Qiu Y, Xue Q. Association between vitamin D3 levels and frailty in the elderly: a large sample cross-sectional study. Front Nutr. (2022) 9:980908. doi: 10.3389/fnut.2022.980908
24. Thompson MQ, Theou O, Tucker GR, Adams RJ, Visvanathan R. FRAIL scale: predictive validity and diagnostic test accuracy. Australas J Ageing. (2020) 39:e529–36. doi: 10.1111/ajag.12829
25. Aprahamian I, Cezar N, Izbicki R, Lin SM, Paulo D, Fattori A, et al. Screening for frailty with the FRAIL scale: a comparison with the phenotype criteria. J Am Med Dir Assoc. (2017) 18:592–6. doi: 10.1016/j.jamda.2017.01.009
26. Fan Y, Zhang Y, Li J, Liu Y, Zhou L, Yu Y. Association between healthy eating index-2015 and physical frailty among the United States elderly adults: the National Health and Nutrition Examination Survey (NHANES) 2011–2014. Aging Clin Exp Res. (2021) 33:3245–55. doi: 10.1007/s40520-021-01874-3
27. Desquilbet L, Mariotti F. Dose-response analyses using restricted cubic spline functions in public health research. Stat Med. (2010) 29:1037–57. doi: 10.1002/sim.3841
28. Collard RM, Boter H, Schoevers RA, Oude VR. Prevalence of frailty in community-dwelling older persons: a systematic review. J Am Geriatr Soc. (2012) 60:1487–92. doi: 10.1111/j.1532-5415.2012.04054.x
29. Bandeen-Roche K, Seplaki CL, Huang J, Buta B, Kalyani RR, Varadhan R, et al. Frailty in older adults: a nationally representative profile in the United States. J Gerontol A-Biol Sci Med Sci. (2015) 70:1427–34. doi: 10.1093/gerona/glv133
30. Santos-Eggimann B, Cuénoud P, Spagnoli J, Junod J. Prevalence of frailty in middle-aged and older community-dwelling Europeans living in 10 countries. J Gerontol A-Biol. (2009) 64:675–81. doi: 10.1093/gerona/glp012
31. Gimeno-Mallench L, Sanchez-Morate E, Parejo-Pedrajas S, Mas-Bargues C, Inglés M, Sanz-Ros J, et al. The relationship between diet and frailty in aging. Endocr Metab Immune. (2020) 20:1373–82. doi: 10.2174/1871530320666200513083212
32. Chan R, Leung J, Woo J. Dietary patterns and risk of frailty in Chinese community-dwelling older people in Hong Kong: a prospective cohort study. Nutrients. (2015) 7:7070–84. doi: 10.3390/nu7085326
33. Angulo J, El AM, Álvarez-Bustos A, Rodríguez-Mañas L. Physical activity and exercise: strategies to manage frailty. Redox Biol. (2020) 35:101513. doi: 10.1016/j.redox.2020.101513
34. Sadjapong U, Yodkeeree S, Sungkarat S, Siviroj P. Multicomponent exercise program reduces frailty and inflammatory biomarkers and improves physical performance in community-dwelling older adults: a randomized controlled trial. Int J Environ Res Public Health. (2020) 17:3760. doi: 10.3390/ijerph17113760
35. Jayanama K, Theou O, Godin J, Mayo A, Cahill L, Rockwood K. Relationship of body mass index with frailty and all-cause mortality among middle-aged and older adults. BMC Med. (2022) 20:404. doi: 10.1186/s12916-022-02596-7
36. Yuan L, Chang M, Wang J. Abdominal obesity, body mass index and the risk of frailty in community-dwelling older adults: a systematic review and meta-analysis. Age Ageing. (2021) 50:1118–28. doi: 10.1093/ageing/afab039
37. Payne ME, Porter SK, Orenduff M, Mulder HS, McDonald SR, Spira AP, et al. Quality of life and mental health in older adults with obesity and frailty: associations with a weight loss intervention. J Nutr Health Aging. (2018) 22:1259–65. doi: 10.1007/s12603-018-1127-0
38. Zaslavsky O, Walker RL, Crane PK, Gray SL, Larson EB. Glucose levels and risk of frailty. J Gerontol A-Biol Sci Med Sci. (2016) 71:1223–9. doi: 10.1093/gerona/glw024
39. Sun M, Wang L, Wang X, Tong L, Fang J, Wang Y, et al. Interaction between sleep quality and dietary inflammation on frailty: NHANES 2005–2008. Food Funct. (2023) 14:1003–10. doi: 10.1039/D2FO01832B
40. Zhu Y, Fan J, Lv J, Guo Y, Pei P, Yang L, et al. Maintaining healthy sleep patterns and frailty transitions: a prospective Chinese study. BMC Med. (2022) 20:354. doi: 10.1186/s12916-022-02557-0
41. Liu X, Wang C, Qiao X, Si H, Jin Y. Sleep quality, depression and frailty among Chinese community-dwelling older adults. Geriatr Nurs. (2021) 42:714–20. doi: 10.1016/j.gerinurse.2021.02.020
42. Pourmotabbed A, Boozari B, Babaei A, Asbaghi O, Campbell MS, Mohammadi H, et al. Sleep and frailty risk: a systematic review and meta-analysis. Sleep Breath. (2020) 24:1187–97. doi: 10.1007/s11325-020-02061-w
43. Wang Q, Zhou C, Dong C, Zhang J, Xie Z, Sun H, et al. Midlife life's simple 7, psychosocial health, and physical frailty, hospital frailty, and comprehensive frailty 10 years later. Nutrients. (2023) 15:2412. doi: 10.3390/nu15102412
44. Bastos-Barbosa RG, Ferriolli E, Coelho EB, Moriguti JC, Nobre F, Lima NK. Association of frailty syndrome in the elderly with higher blood pressure and other cardiovascular risk factors. Am J Hypertens. (2012) 25:1156–61. doi: 10.1038/ajh.2012.99
45. Palta P, Griswold M, Ranadive R, Bandeen-Roche K, Folsom AR, Petruski-Ivleva N, et al. Midlife cardiovascular health and robust versus frail late-life status: the atherosclerosis risk in communities study. J Gerontol A-Biol Sci Med Sci. (2022) 77:1222–9. doi: 10.1093/gerona/glab310
46. Graciani A, García-Esquinas E, López-García E, Banegas JR, Rodríguez-Artalejo F. Ideal cardiovascular health and risk of frailty in older adults. Circ Cardiovasc Qual Outcomes. (2016) 9:239–45. doi: 10.1161/CIRCOUTCOMES.115.002294
Keywords: Life's Essential 8, frailty, older people, CVH, NHANES
Citation: Zhao N and Fan Y (2025) Association between Life's Essential 8 and frailty among the United States older people. Front. Public Health 13:1554687. doi: 10.3389/fpubh.2025.1554687
Received: 02 January 2025; Accepted: 26 June 2025;
Published: 16 July 2025.
Edited by:
Senthil Kumaran Satyanarayanan, Hong Kong Institute of Innovation and Technology, Hong Kong SAR, ChinaReviewed by:
María Antonia Parra Rizo, Miguel Hernández University of Elche, SpainKei Shing Ng, The University of Hong Kong, Hong Kong SAR, China
Yang Li, Tongji University, China
Copyright © 2025 Zhao and Fan. This is an open-access article distributed under the terms of the Creative Commons Attribution License (CC BY). The use, distribution or reproduction in other forums is permitted, provided the original author(s) and the copyright owner(s) are credited and that the original publication in this journal is cited, in accordance with accepted academic practice. No use, distribution or reproduction is permitted which does not comply with these terms.
*Correspondence: Yameng Fan, eWFtZW5nZmFuQHhpeWkuZWR1LmNu