 Dejen Kahsay Asgedom
 Ausman Ahmed Mohammed2
- 1Department of Public Health, College of Medicine and Health Sciences, Samara University, Samara, Ethiopia
- 2Department of Nursing, College of Medicine and Health Sciences, Samara University, Samara, Ethiopia
Background: Inadequate feeding frequency during the early childhood period is responsible for more than two-thirds of global child deaths. Evidence on the rate of daily meal frequency among infants and young children at the national level is crucial for developing targeted interventions to improve feeding practices. Hence, this study aimed to identify factors associated with the rate of daily meal frequency (DMF) among children aged 6–23 months in Ethiopia.
Methods: We retrieved secondary data from the Kids record (KR) of the Ethiopian Mini Demographic and Health Survey (MDHS) dataset. A total of 1,264 children aged 6–23 months were included in the study. A Bayesian hierarchical Poisson model was employed. Model convergence was checked via Rhat, effective sample size, density plots, terrace plots, and autocorrelation plots, and all the results were confirmed. We used the widely applicable information criterion (WAIC) and leave-one-out cross-validation (LOO) for model comparison. The model parameters were estimated via special Markov chain Monte Carlo (MCMC) simulation techniques called Hamiltonian Monte Carlo (HMC) and its extension, the no-U-turn sampler (NUTS). An adjusted incidence rate ratio (AIRR) with a 95% credible interval (CrI) in the multivariable model was used to select variables that had a significant association with the rate of daily meal frequency. The data were analyzed via R software version 4.3.1.
Results: The mean and standard deviation of the DMF were 3.36 and 1.60, respectively. The rate of DMF was 1.17 times greater (AIRR = 1.17, 95% CrI: 0.997, 1.381) in children whose mothers had a secondary/higher educational level than in those whose mothers had no education. Kids currently being breastfed have a lower rate of DMF (AIRR = 0.88, 95% CI: 0.798, 0.979) by 10% than those who are not currently breastfeeding. Compared with children between the ages of 6–8 months, those between 9 and 11 months (AIRR = 1.55 95% CrI: 1.374, 1.754), 12–17 months (AIRR = 1.72, 95% CrI: 1.543, 1.911), and 18–23 months (AIRR = 95% CrI: 1.90, 1.692, 2.125) had 55, 72 and 90% higher rates of DMF, respectively. In the Afar region (IRR = 0.77, 95% CI: 0.615, 0.982), Somalia (AIRR = 0.83, 95% CrI: 0.682, 1.01), Benishangul (AIRR = 0.8, 95% CrI: 0.639, 0.994), Southern nation nationality and people’s region (SNNPR) (AIRR = 0.73, 95% CrI: 0.596, 0.894), and (AIRR = 0.73, 95% CrI: 0.572, 0.925) decrease the daily meal frequency by 33, 17, 20, 27 and 27%, respectively, compared with that of children from Tigray.
Conclusion and recommendation: The rate of DMF was low in Ethiopia and exhibited a significant clustering pattern across the country. These findings stress the need for tailored interventions addressing regional inequities, promoting age-specific nutrition, supporting maternal education, and empowering working women to improve children’s nutritional intake and ensure more equitable access to meals across Ethiopia.
Introduction
Adequate nutrition is vital for proper health and development (1). The age range of 6–24 months is crucial for addressing malnutrition, as it is characterized by growth setbacks and heightened nutritional needs that require energy-dense and nutrient-rich foods (2). The nutritional quality of food is crucial for the health and well-being of children (3).
DMF focuses on the number of meals offered to children of varying ages, excluding breast milk and breastfeeding, and is a key indicator for complementary feeding, which serves as a proxy for assessing a child’s energy needs (4). Breastfed children aged 6–8 months are considered to be fed minimum meal frequency (MMF) if they receive solid, semisolid, or soft foods at least twice a day. Breastfed children aged 6–23 months are considered to be fed with a MMF if they receive solid, semisolid, or soft foods at least three times a day. Non-breastfed children should receive four to five meals per day, which include both milk feeds and solid or semisolid foods, along with one to two snacks on the basis of the child’s preferences (5). According to the World Health Organization (WHO) 2023 report, although every infant and child has the right to obtain good and adequate nutrition, few children receive nutritionally adequate and safe complementary foods; in many countries, fewer than one-fourth of infants 6–23 months of age meet the criteria of dietary diversity and a feeding frequency that are appropriate for their age (5).
Globally, in 2022, approximately 148.1 million children were stunted, and approximately 45 million were wasted under five children (6). Half of under-five stunted children live in Asia (South Asia: 36%, East Asia and Pacific: 14%), and more than one-third live in Africa [Sub-Saharan Africa (SSA) contributes 38%], whereas more than two-thirds of all under-five wasted children live in Asia (South Asia: 55%, East Asia and Pacific: 13%), and more than one-quarter live in SSA (6). In Ethiopia, approximately 37, 7, and 21% of children under 5 years of age are stunted, wasted and underweight, respectively (7).
Delayed cognitive and physical development, irreversible stunting, and a significant risk of infectious and chronic diseases are a few of the consequences of inadequate newborn and young child feeding habits during the first 2 years of life (8). In addition, infants and children who receive suboptimal supplemental feeding practices are more susceptible to undernutrition, disease, and death (9, 10). Globally, undernutrition is estimated to be associated with 2.7 million child deaths annually or 45% of all child deaths (11). Moreover, the likelihood of common childhood illnesses such as diarrhea and infections is greater among children who do not receive adequate complementary food at the age of 6–24 months (12). Furthermore, nutritional deficiencies in the first 2 years of life can lead to impaired cognitive development, compromised educational outcomes, and reduced economic productivity (13, 14). Malnourished children are more likely to become sick and suffer from the long-term repercussions of poor nutrition, which can affect multiple generations (13, 15).
The age of the child (3, 8, 16–18), sex of the child (19), sex of the household head (20, 21), media exposure (16, 22), maternal working status (20), maternal decision-making power for household activities (16), timely initiation of breastfeeding (23), current breastfeeding status (23), postnatal visit (16, 17, 19), household wealth index (17, 24–26), maternal age (27), maternal education (27–29), place of delivery (29), number of antenatal care (ANC) visits (24), place of residence (3, 25), and region (17, 27) were found to be associated with the rate of daily meal frequency.
The WHO and the United Nations Children’s Fund (UNICEF) advise that complementary foods should be introduced at 6 months of age and must be given optimally and appropriately unless the infant’s growth may falter (30). Enhancing infant and young child feeding (IYCF) practices is also recognized as a critical component in enhancing child survival rates and fostering optimal growth and development (31–33). The United Nations Sustainable Development Goal-2 (SDG-2) aims to end all forms of malnutrition by 2030 (34). Efforts to reduce malnutrition in Ethiopia have been encouraged over the past decade. Stunting, wasting and underweight declined by 14, 5 and 12%, respectively, from 2005–2019. However, the baseline levels of malnutrition remain high, indicating a continued need for substantial investment in nutrition (35).
Unlike those studies that have been performed in different study areas in Ethiopia (8, 16, 17, 19, 29, 36), they used logistic regression to identify the factors associated with DMF; as far as our knowledge, our study is the first to employ a Bayesian hierarchical Poisson model to analyze daily meal frequency among children aged 6–23 months in Ethiopia. Compared with the frequentist approach, the Bayesian modeling approach offers more intuitive and meaningful inferences, better addresses complex research questions, and is better suited for clinical decision-making. In addition, current evidence on IYCF practices at the national level will assist the Ethiopian national nutrition programme in monitoring changes in feeding practices and designing interventions that are appropriate for increasing recommended feeding practices and thereby play a role in nutrition target achievement. Therefore, this study aimed to assess the rate of daily meal frequency and its associated factors in Ethiopia.
Materials and methods
Study setting
The study was conducted in Ethiopia, a country located in East Africa at a geographical location of 9°8′42″ North latitude and 40°29′22.8″ East longitude (37). Administratively, Ethiopia is divided into nine regions (Tigray, Afar, Amhara, Oromia, Somalia, Benishangul-Gumuz, SNNPR, Gambela, and Harari) and two self-administrative cities (Addis Ababa and Dire Dawa). Each of the nine administrative regions and two administrative cities are organized into zones, districts, and kebeles (7).
Study design and period
The 2019 mini-EDHS data were gathered via a cross-sectional study design. This survey was carried out by the Ethiopian Public Health Institute (EPHI) in partnership with the Ethiopian Central Statistical Agency (CSA) and the Ministry of Health. The survey was conducted between 21 March and 28 June 2019 and utilized a nationally representative sample, providing estimates at the national, regional, urban, and rural levels (7).
Study population and sample selection
A two-stage stratified cluster sampling method was employed for the survey. In the first stage, 305 enumeration areas (EAs) were selected—93 from urban areas and 212 from rural areas—using probabilities proportionate to the size of the EA, on the basis of the 2019 Ethiopian Population and Housing Census (EPHC) framework. In the second stage, 30 households were chosen from each cluster via equal probability systematic selection. For this study, the KR dataset, which contains maternal and child information, was used, with variable extraction based on literature. The study focused on infants and young children aged 6–23 months during the survey period. Further details on the data collection process, data quality control, sampling methodology, and questionnaires used in the survey can be found elsewhere (7). The data, including participant characteristics and coordinate files, were obtained from http://www.dhsprogram.com following an official request and permission. The final analysis included a weighted sample of 1,532 children aged 6–23 months. The sample selection is indicated in Figure 1.
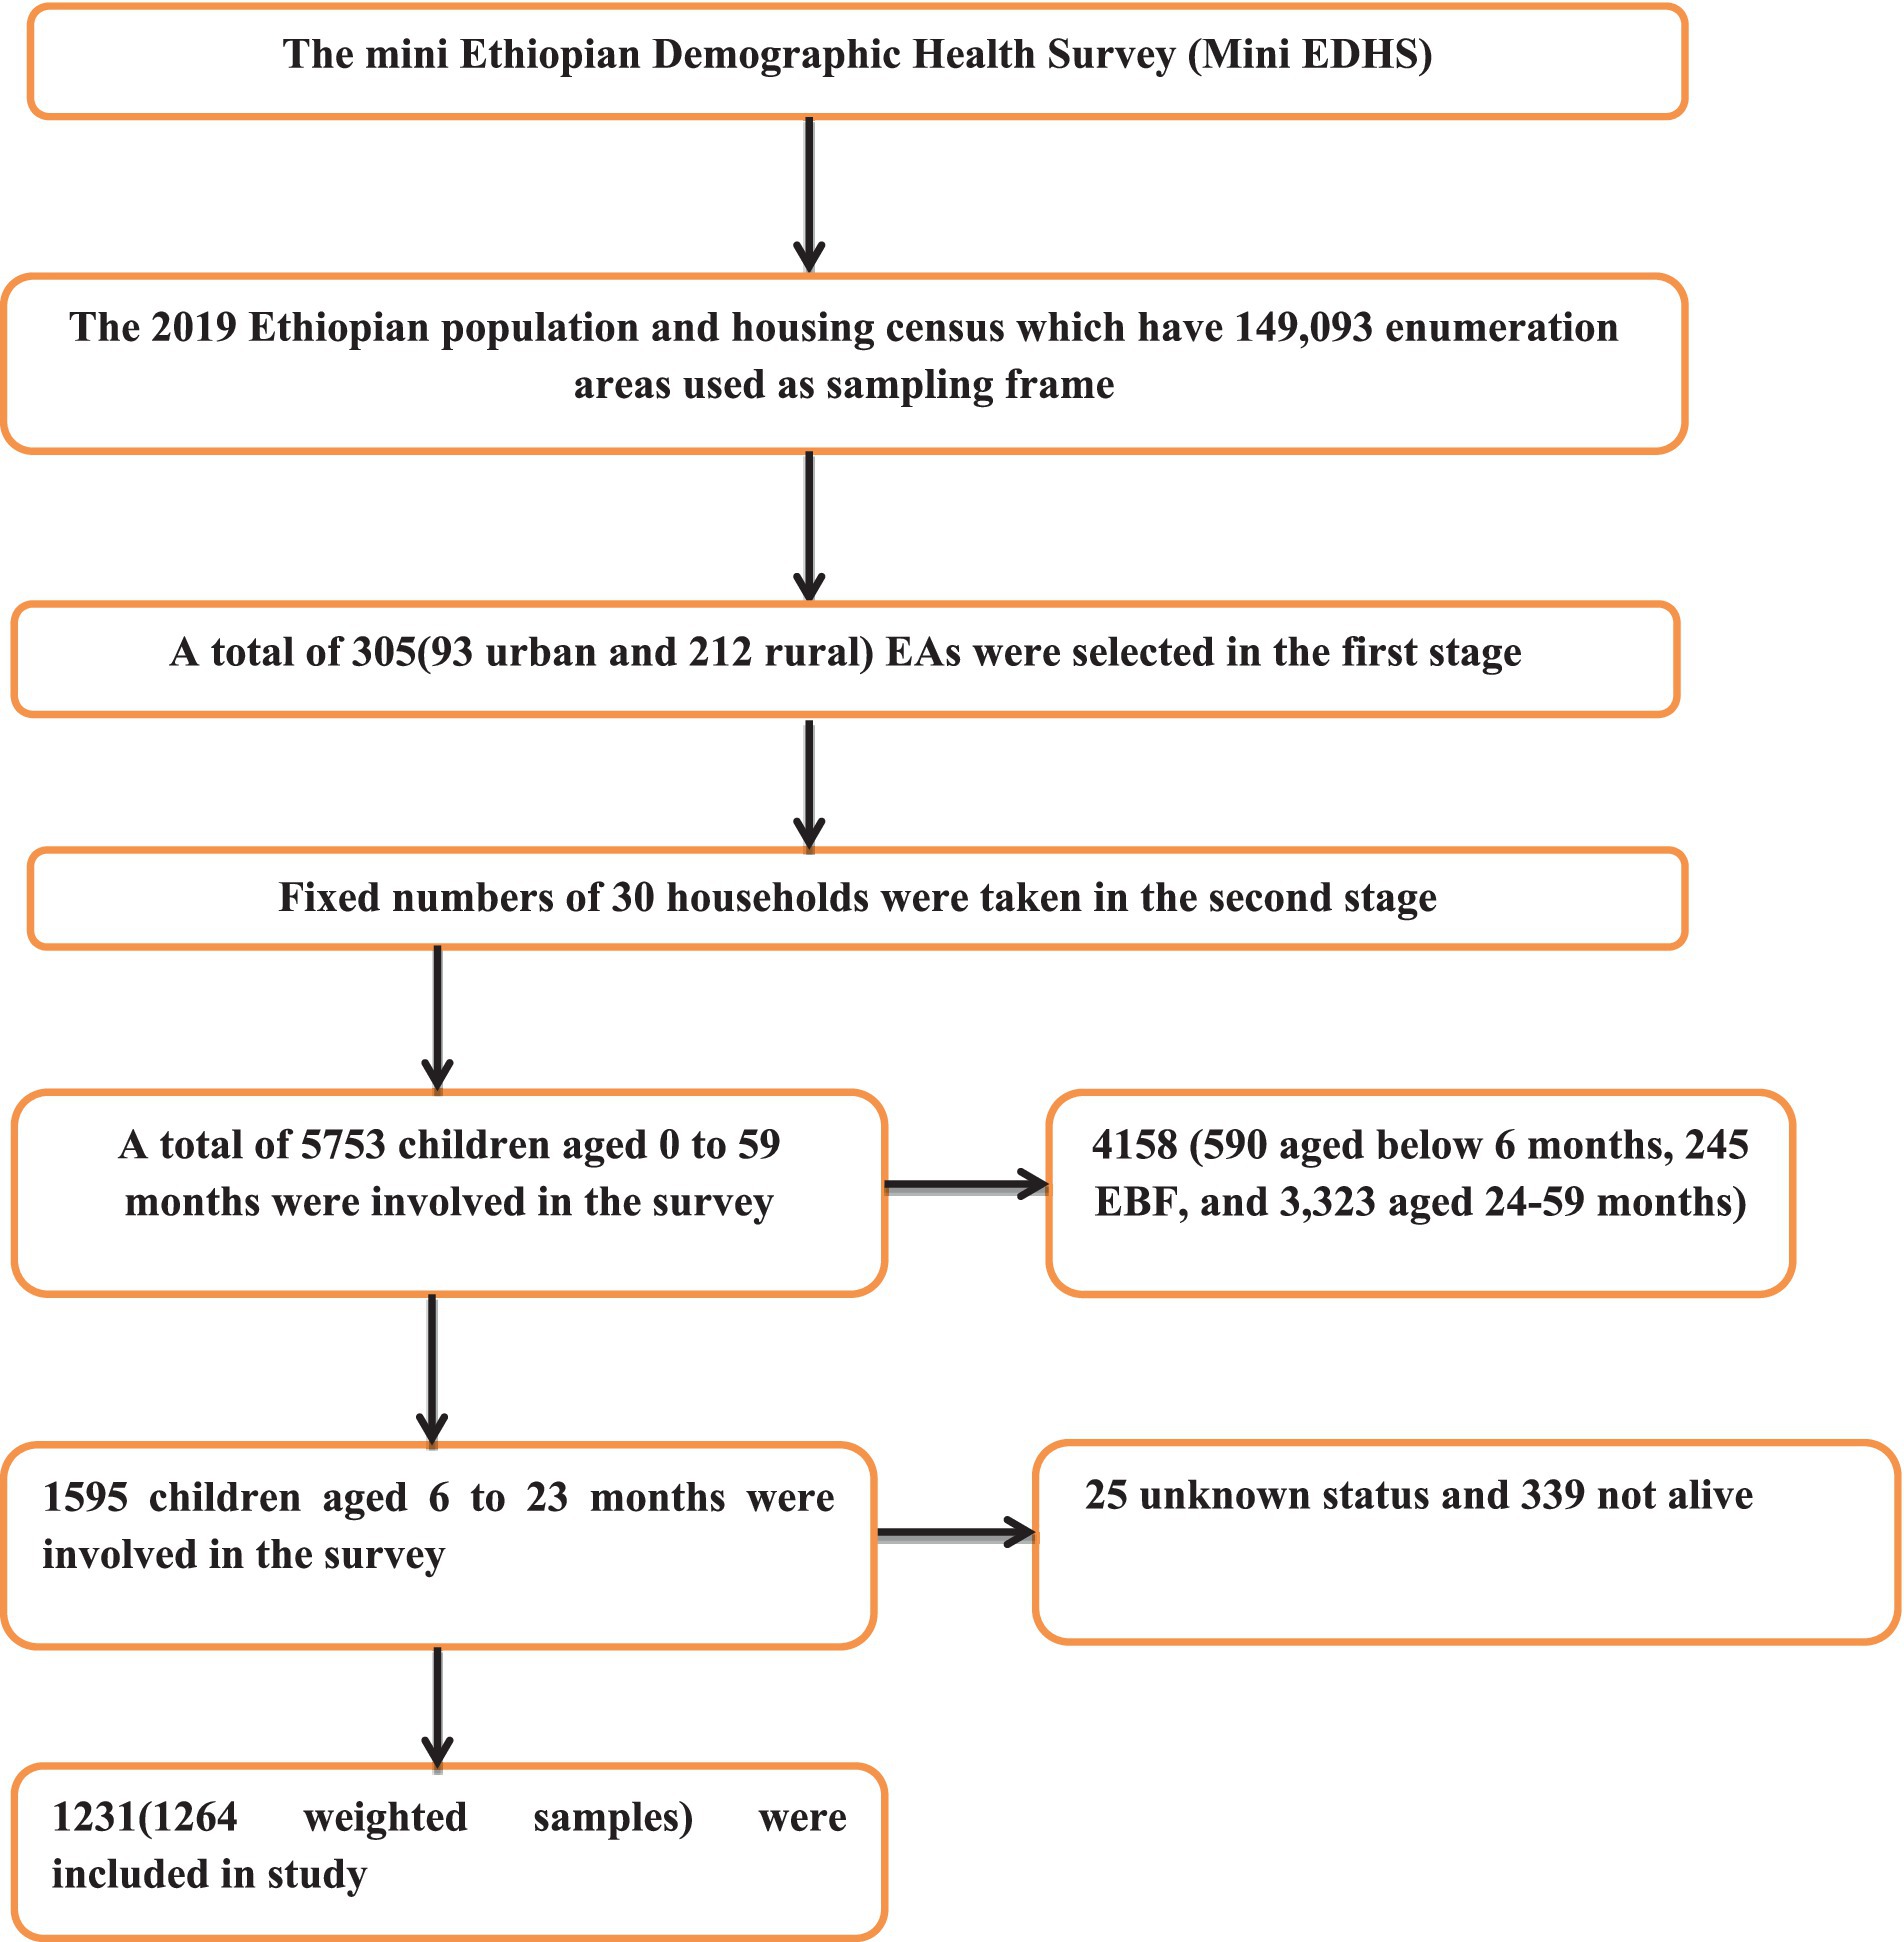
Figure 1. Flow diagram of the 2019 mini EDHS sampling design and data extraction process.
Study variables
Outcome variables: the daily number of times the children received anything to eat, in addition to breast milk, including both meals and snacks (m39), ranged from 1–7, as indicated in STANDARD RECODE MANUAL for DHS-7 Version 1.0 (38).
Independent variables: we considered the independent variables in two categories: individual-level variables (sociodemographic characteristics and maternal and child characteristics) and community-level variables (Table 1).
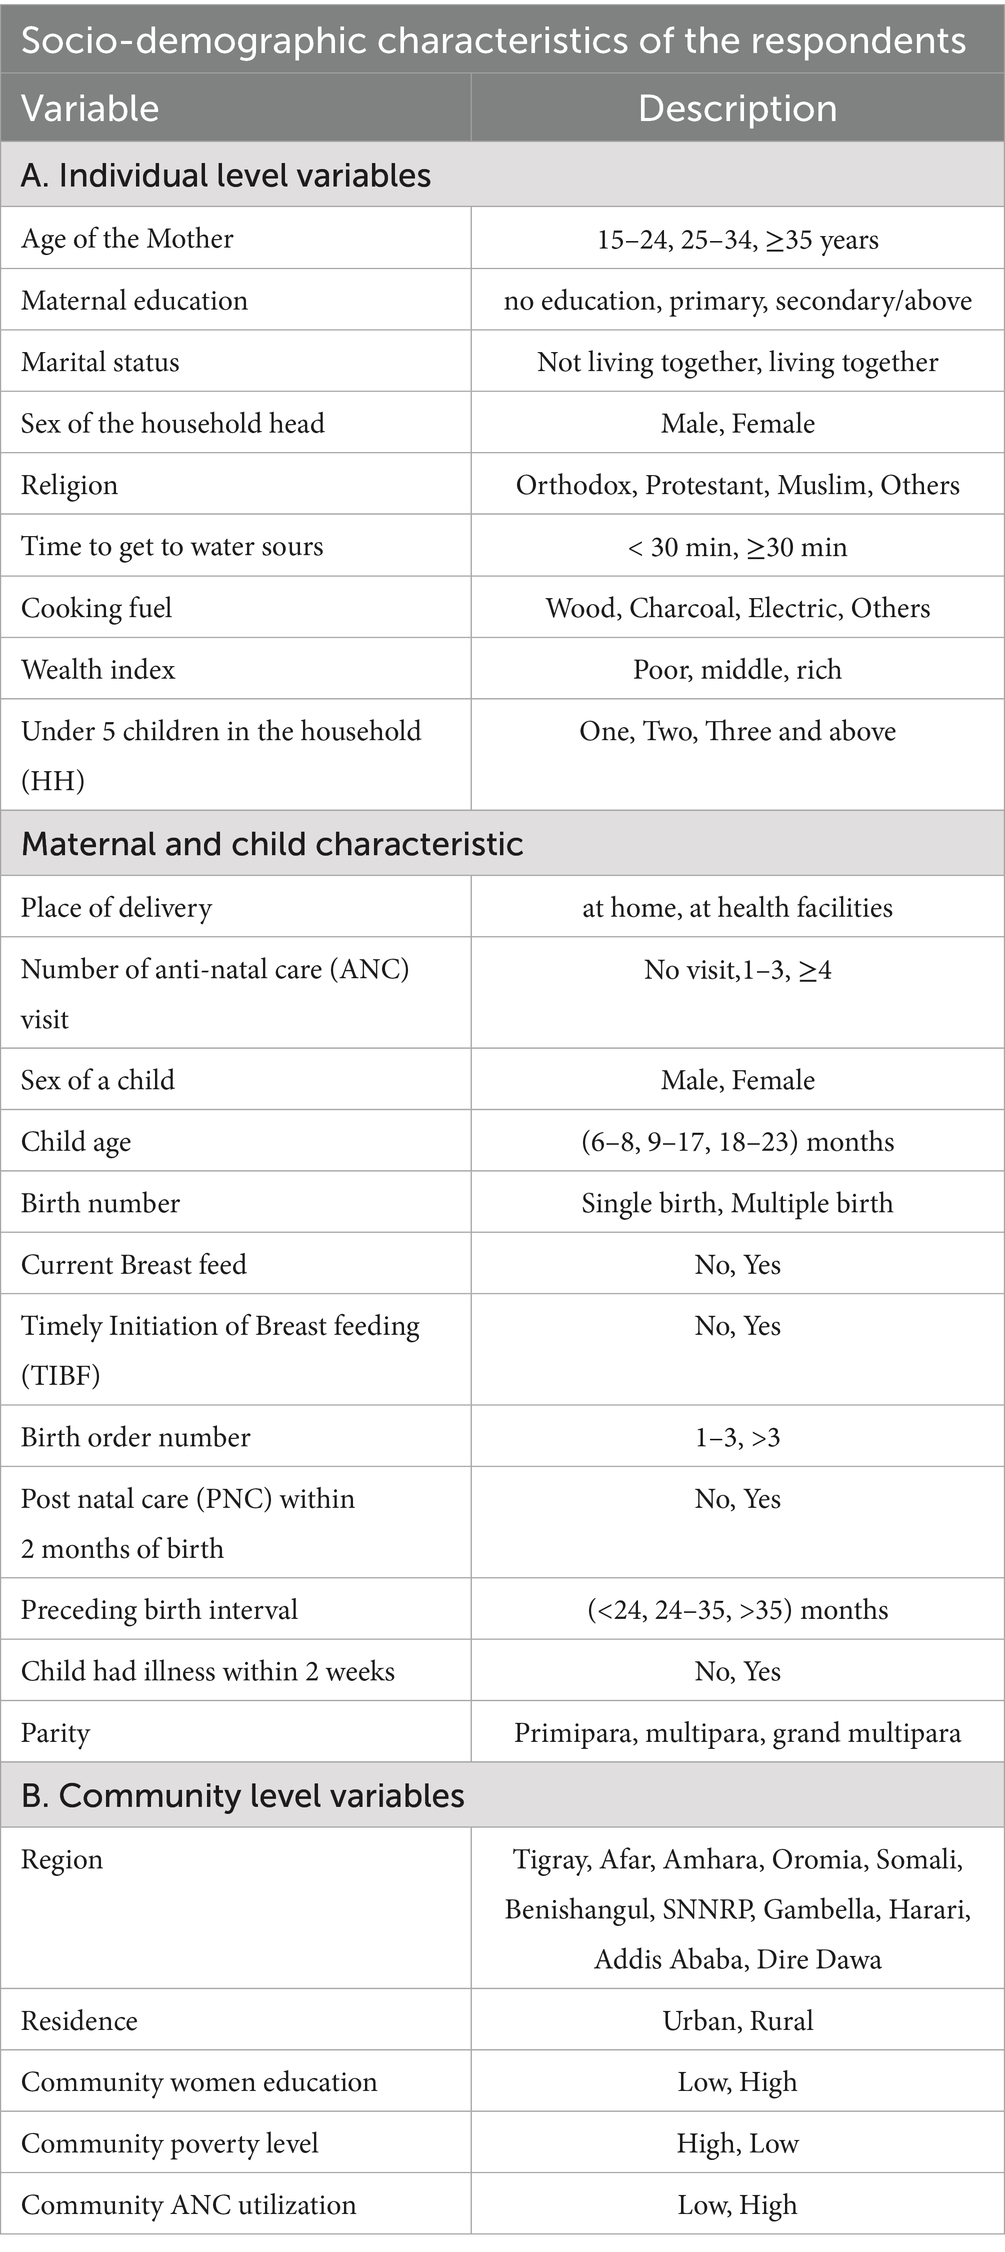
Table 1. Description and coding of individual independent variables.
Operational definitions
ANC utilization was defined as women who attended a minimum of four prenatal care appointments (39).
TIBF: Additionally, early initiation of breastfeeding (EIBF) involves putting newborns to feed them with breast milk within 1 h of birth (40).
Wealth index: Categorized as poor “if woman was in poorer and poorest household,” middle and rich “if woman was in richer and richest household” (41).
Postnatal visit refers to a health checkup for the newborn within 2 months after birth. It was recorded as “yes” if the child had received a health checkup within this two-month period. In addition to place of residence and region, community-level variables were created by aggregating individual-level factors. These community-level variables were then categorized into “low” and “high” categories on the basis of the median value of their distribution, as all the aggregated values were skewed. Previous studies have also used similar aggregated community variables from individual-level characteristics, categorizing them on the basis of the mean or median value (36, 42). The place of residence and region were originally recorded as separate variables, so no aggregation was performed for these variables.
Community ANC utilization is an aggregated variable based on the number of antenatal care (ANC) visits, representing the percentage of women in a community who had fewer than four ANC visits. The percentage of women with fewer than four ANC visits was considered “low” if it was less than 46% (the mean) in the community, whereas it was considered “high” if it was at least 46%.
Community poverty is an aggregated variable derived from the household wealth index, indicating the percentage of children in the community living in either poorer or poorest households. A percentage was considered “low” if it was below 32% (the median) and “high” if it was at least 32%.
Community women’s education is an aggregated variable based on women’s educational status, representing the percentage of women in the community who have completed secondary education or higher. A percentage was considered “low” if the percentage was less than 19% (the mean) and “high” if the percentage was at least 19%.
Data analysis
Descriptive statistics are analyzed and presented in terms of frequency and percentage. Owing to the hierarchical nature of Demographic Health Survey (DHS) data, the observation of the data violates the assumption of independence. This implies the need to consider the between-cluster variability by using a mixed-effect model (43). Therefore, a multilevel model was chosen over the traditional count models.
Before all these models were built, a bivariable mixed effect model using Poisson regression was employed to identify candidate variables for multivariable analysis in each category. We then fit a multivariable mixed effect Poisson and negative binomial models via Bayesian approach. Therefore, a multilevel Bayesian Poisson regression model was fitted to estimate the associations between the individual- and community-level variables and the rate of daily meal frequency.
We then fitted four multilevel Bayesian Poisson models: the null model (without independent variables), Model I (only individual-level variables) (child and maternal sociodemographic variables), Model II (only community-level variables), and Model III (both individual- and community-level variables). Leave-one-out cross-validation (LOO) and the Watanabe-Akaike information criterion (WAIC) were used to choose the best-fit model. Hence, the model with the lowest LOO and WAIC was considered the beat model. The AIRR corresponding to the 95% Bayesian credible interval (CrI) was calculated to identify the independent predictors of the rate of daily meal frequency. The variance inflation factor results revealed that the maximum variance inflation factor (VIF) was 2.36 for the wealth index, and the mean VIF was 1.5. On the basis of the VIF results, there is no multicollinearity between the covariates. Missing data were handled according to the DHS guidelines. Thus, all analyses were based on complete observations. The data were analyzed via R software version 4.3.1.
Bayesian hierarchical Poisson regression model
The Bayesian statistical approach offers the ability to incorporate additional prior information external to the data through prior distributions. By leveraging this additional prior information, the accuracy and credibility of effect size estimations can be improved. Consequently, applying the classical confidence interval interpretation is inappropriate, as the Bayesian statistical approach provides a more reasonable alternative. The Bayesian credible interval interpretation is more intuitive in this context, whereas frequentist confidence intervals are often misinterpreted. We used the random variable EAs to account for the variation in the number of daily meals across different EAs within the country. An intra-class correlation (ICC) value >5% was used as a threshold to consider the variation across EAs (44). Since the outcome variable was count (1–7), children within households were treated as level-1 units, whereas EAs were considered level-2 units. This hierarchical structure resulted in children being nested within EAs. We employed a Bayesian multilevel poison regression model to address the hierarchical nature of the data and account for the dependency of observations within the same cluster. This approach allowed us to obtain accurate and credible estimates of effect sizes, considering the clustering of children within EAs and the potential impact of the EA on the outcome variable (45).
Hence, the dependent variable was represented as follows:
, the number of daily meals of the child in the enumeration area follows a poison distribution:
The likelihood function
With the mean and variance given, respectively, as follows:
The two-level Poisson regression model can be expressed in vector form as:
Where denotes the Poisson distribution with mean , and are fixed effects coefficients, denotes a vector of additional covariates for the observation, represents the vector of random effects for the cluster, and .
Prior distributions for the multilevel Poisson model
Owing to the absence of prior information on the parameters of interest, noninformative priors are assigned. Non-informative priors for the parameters , whereas weakly informative prior for the parameter were chosen as recommended by (46). For the prior distributions, we assume the following distributions for each parameter (Table 2).
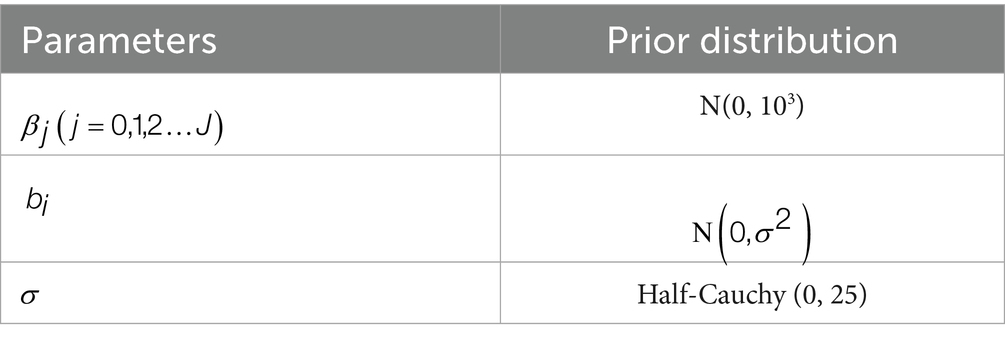
Table 2. Priors used for the parameters of daily meal frequency and its associated factors among children aged 6–23 months in Ethiopia, 2019.
Posterior distribution
Using Bayes’ theorem, the posterior distribution for the parameters is proportional to the likelihood multiplied by the priors:
Given the complexity of the posterior, direct analytical inference is not feasible. To estimate the parameters of the variable and the extent of random variations between clusters, we used the Brms-R package (46). It uses HMC and its extensions NUTS, which uses a recursive algorithm to build a set of likely candidate points that spans a wide swath of the target distribution, stopping automatically when it starts to double back and retraces its steps. These features allow it to converge to high-dimensional target distributions much more quickly than simpler methods, such as the random walk Metropolis or Gibbs sampler (47). Currently, in a multilevel framework, Brms provides an intuitive, powerful, and flexible formula syntax that extends the well-known formula syntax of lme4 (48). In addition, we employed iteration = 10,000, warm-up (number of discarded iterations) = 5,000, cores = 3 (specifying the number of cores used for the algorithm), chains =, adapt delta (controlling divergent transitions) = 0.95, and initials (starting values for the iterations) = 0 to estimate the posterior distribution. Model convergence was checked via Rhat, effective sample size, density, time series, and autocorrelation plots, and all the results were confirmed.
Measure of unobserved heterogeneity between levels
To estimate the EA effects on daily meal frequency outcomes and to quantify the variation in the outcome between EAs (i.e., clusters), we applied the variance partition coefficient (VPC) and the median rate ratio (MRR), respectively.
The ICC = VPC was calculated as follows:
where σ2μ is the variance of the random parameter at the cluster level, which represents the amount of unobserved heterogeneity between clusters, and the parameter represents the amount of unobserved heterogeneity between individuals (individual-level variance) (44).
The proportional change in variance (PCV) was calculated as , where V0 is the variance of the null model and Vx is the variance of each model at each level with variables (44).
The median rate ratio (MRR) was calculated as , where σ2 is the variance of each model and Φ−1 is the inverse of the standard normal cumulative distribution function (49).
Ethical consideration
Permission for data access and ethical approval was obtained from MEASURE DHS through the online formal request at www.dhsprogram.com. All methods were carried out in accordance with the relevant guidelines of the DHS program. Publicly available data with no personal identifiers were used. The participants and the general public were not involved in the design or analysis phase of this investigation. Additionally, the data were handled according to the Helsinki Declaration of the World Medical Association.
Results
Participant characteristics
In this study, a total of 1,264 weighted numbers of children were included. Among these, more than half (51.68%) of the children were males. Nearly nine children out of ten (86.51%) were from male-headed households. The majority of the children were between 12 and 17 months of age (40.18%). Among the total mothers interviewed, 49.43% were between 25 and 34 years of age. Approximately 31.14% of the children are second or third children in the family. Close to 61.37% of the women had no education, whereas 8% had secondary education or above. In addition, close to 40% of the populations were poor. Nearly 50% of the women had ≥4 ANC visits, and 58% of them gave birth at health facilities. However, only 16% of them had a postnatal checkup. With respect to community-level variables, nearly 81% of the participants were from Ormia, SNNPR and Amhara, and 72.5% were rural residents. Nearly 58% of the population consumes less than 30 min to access water. Approximately 82% of the population uses wood as a source of fuel for cooking. Approximately 63% of the children were from a community with a low level of education. Nearly 54 and 45% of the Community had high ANC utilization and poverty levels, respectively (Table 3).
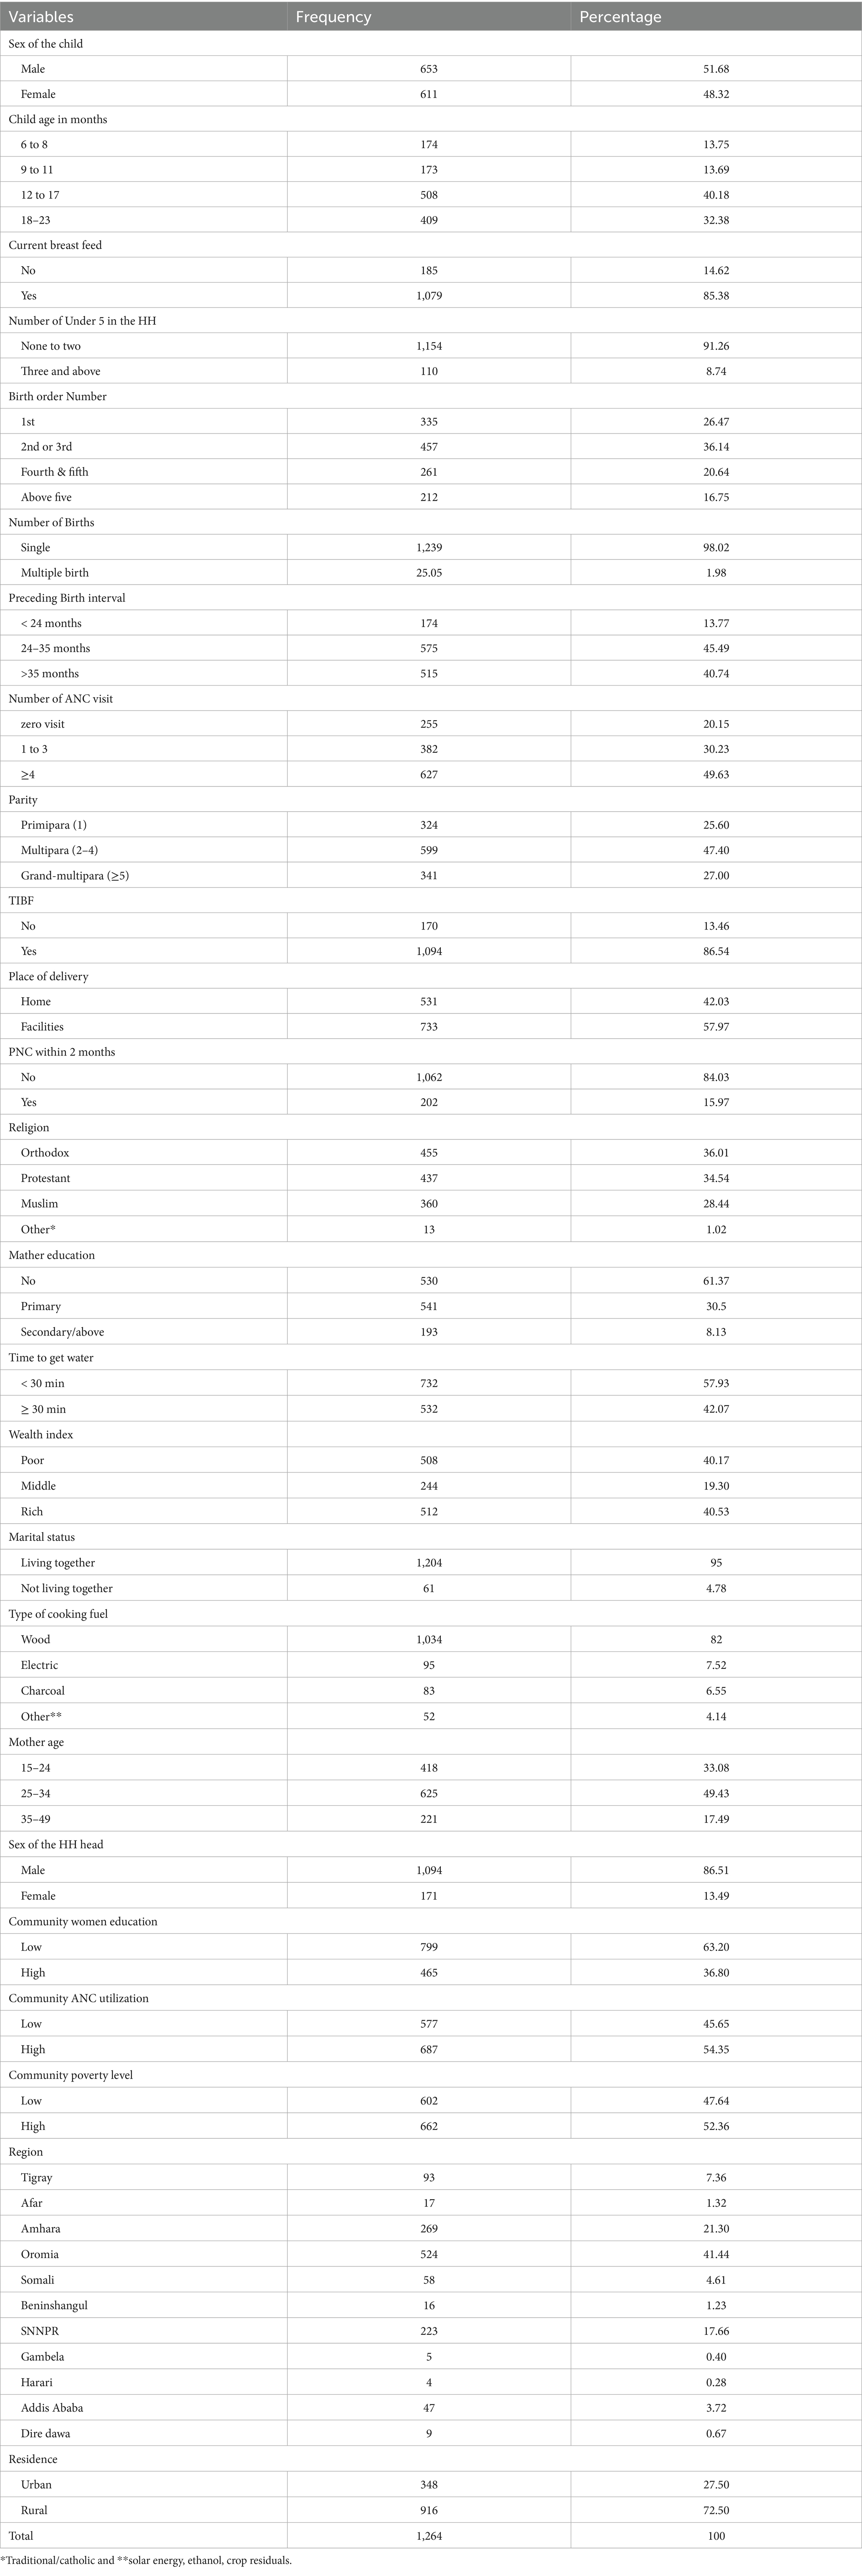
Table 3. Characteristics of the participants in terms of daily meal frequency and associated factors in Ethiopia, 2019.
Daily meal frequency (DMF)
The range of daily meal frequency (DMF) is 1–7. There were 1,264 observations, and the mean and standard deviation of the response variable were 3.36 and 1.60, respectively. The minimum number of children was 1, where the maximum number of children was 7. Only 40% of kids have at least three meals daily (Figure 2).
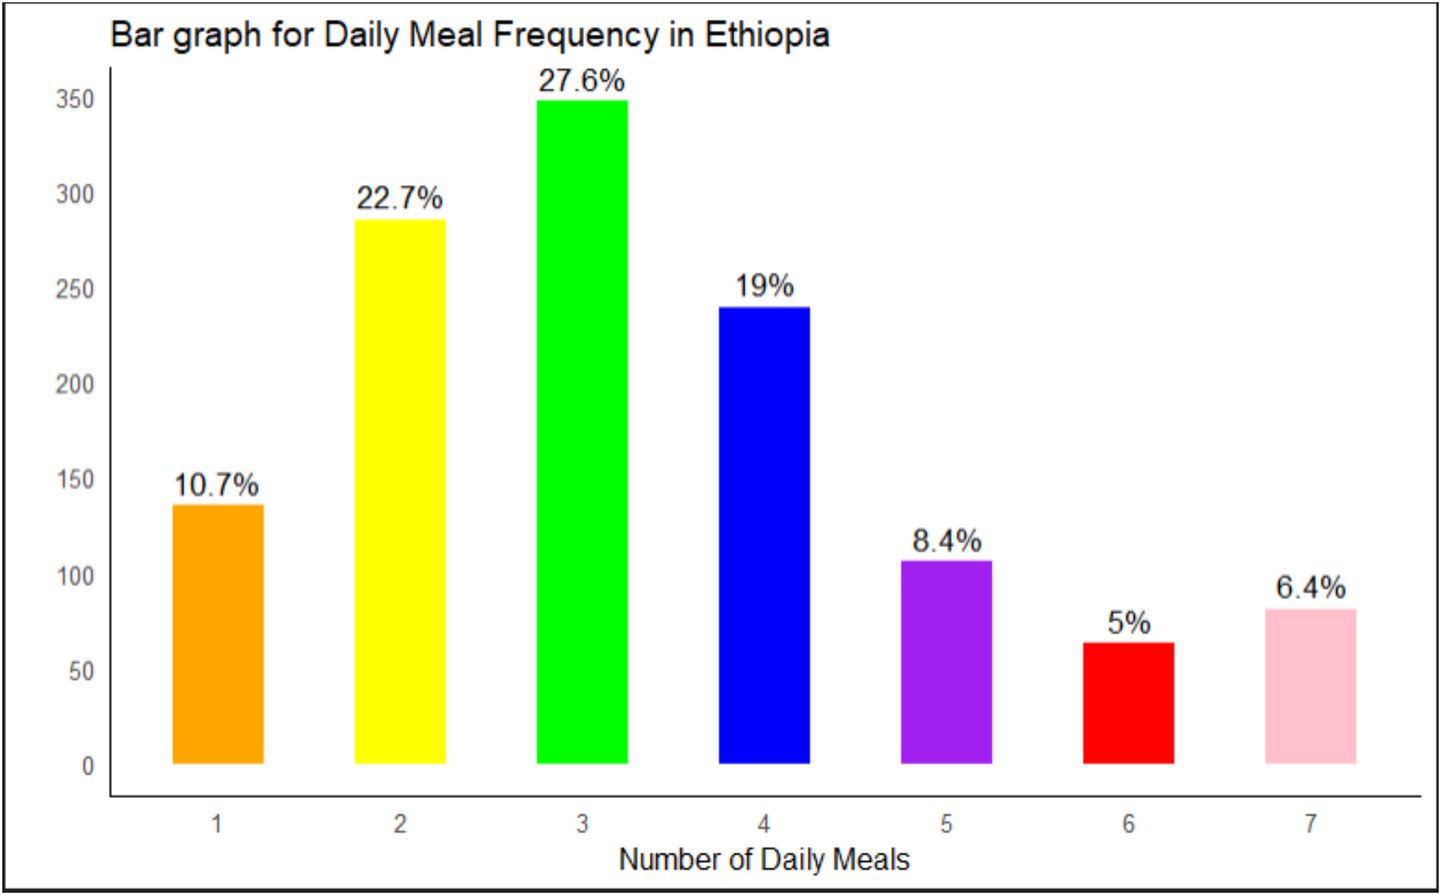
Figure 2. Daily meal frequency among children aged 6–23 months in Ethiopia in 2019.
Factors associated with daily meal frequency
According to the ICC value (mixed-effect vs. logistic model), models that considered the clustering effect (mixed-effect) were better fitted to the data than the classical logistic regression model was. A model with individual and community-level factors (Model IV) was found to be the best-fit model since it had the smallest LOO and WAIC (Table). Therefore, factors associated with inadequate meal frequency were reported on the basis of the best-fit model (Table 4). Variables such as region, current breastfeeding status, child age, and educational level were significantly associated with daily meal frequency among children aged 6–23 months.
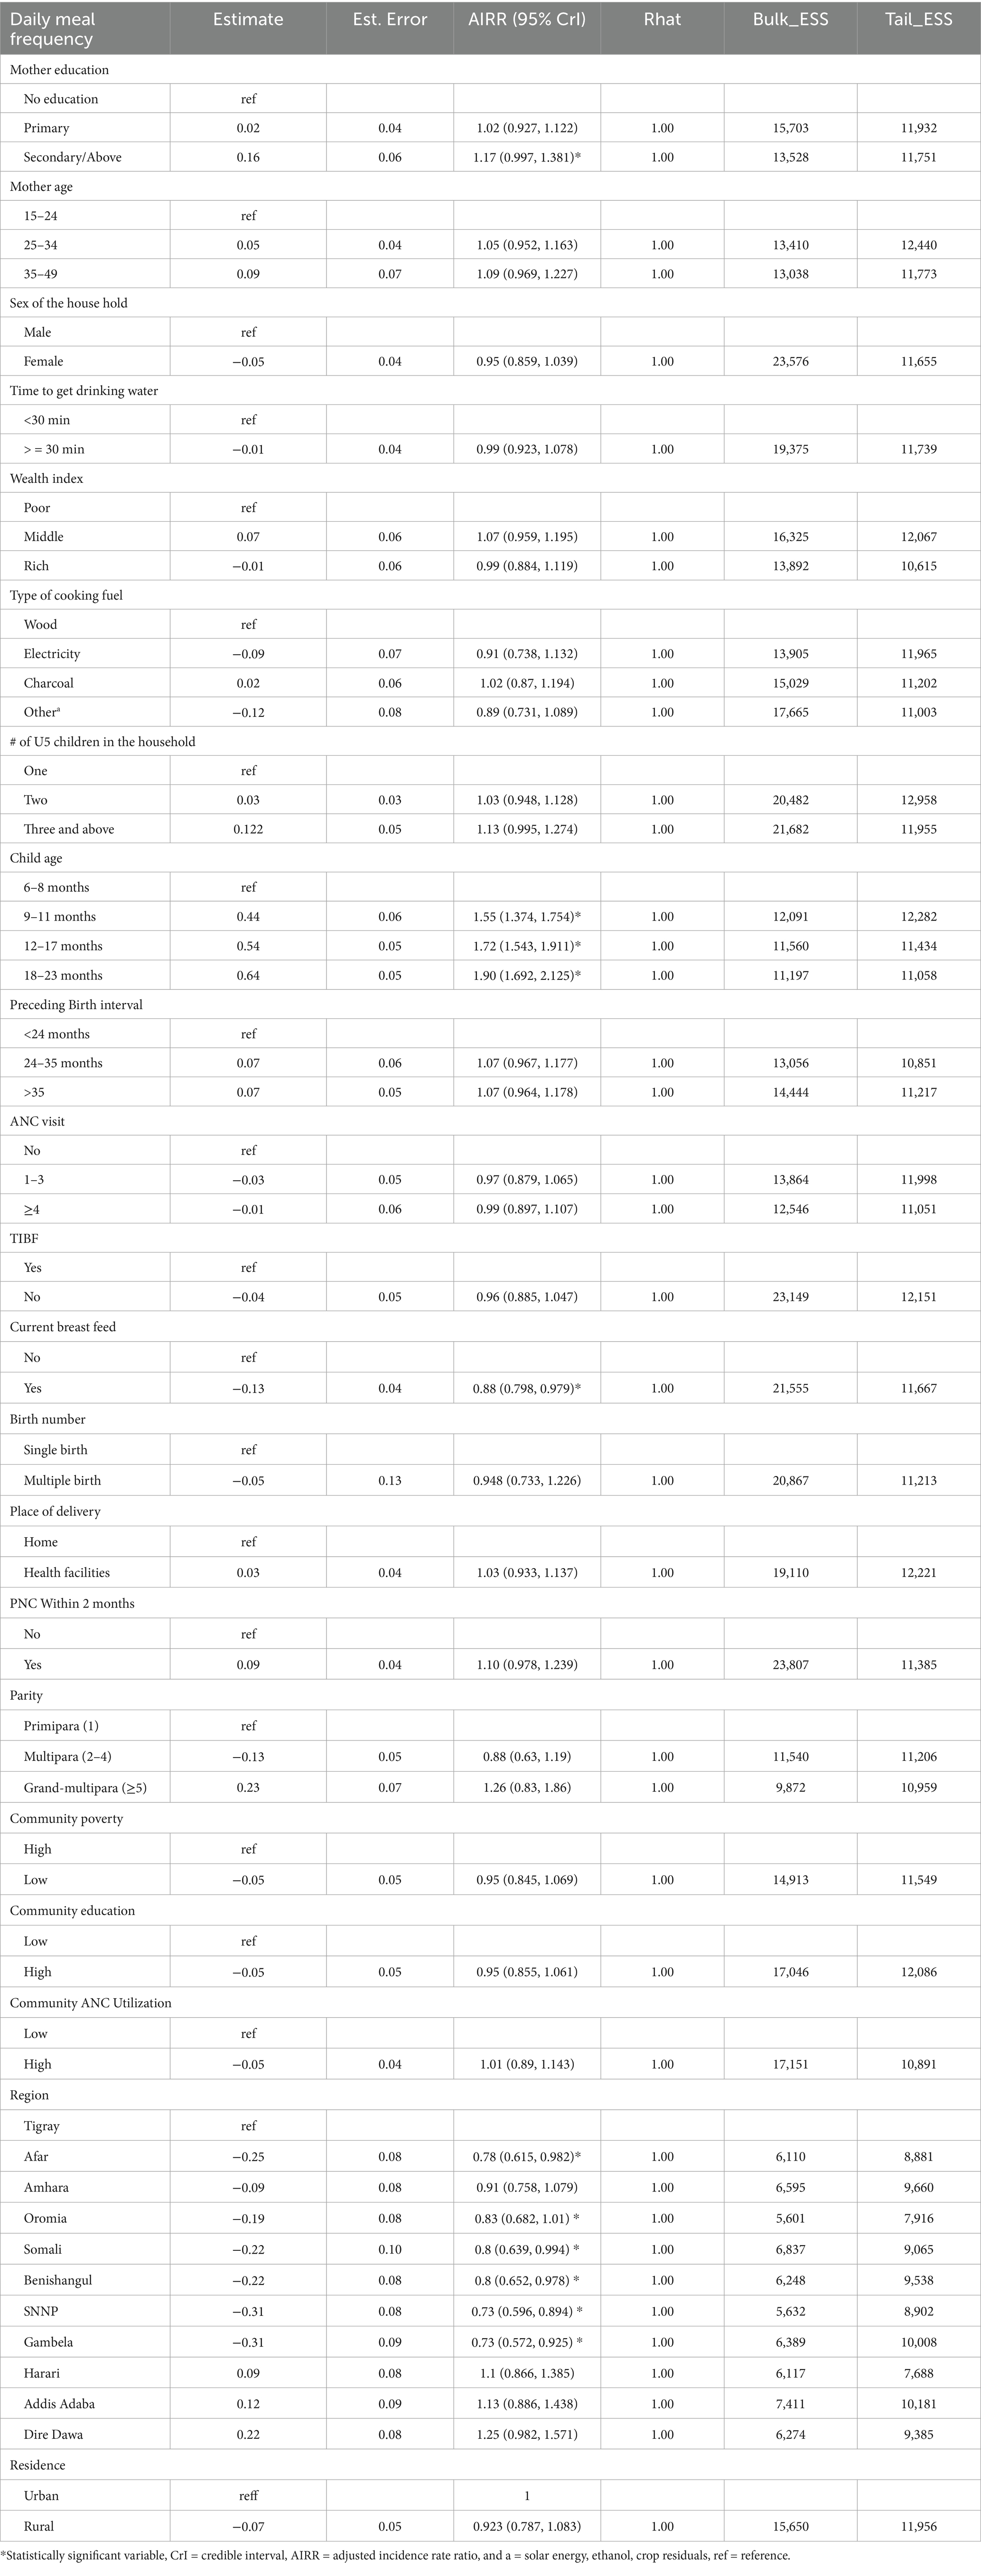
Table 4. Multivariable Bayesian multilevel poison regression analysis to identify factors associated with DMF among children aged 6–23 months in Ethiopia, mini EDHS 2019.
In the Afar region (IRR = 0.77, 95% CrI: 0.615, 0.982), Somalia (AIRR = 0.83, 95% CrI: 0.682, 1.01), Benishangul (AIRR = 0.8, 95% CrI: 0.639, 0.994), SNNP (AIRR = 0.73, 95% CrI: 0.596, 0.894), and (AIRR = 0.73, 95% CrI: 0.572, 0.925) decrease the daily meal frequency by 33, 17, 20, 27 and 27%, respectively, compared with that of children from Tigray. Kids currently being breastfed have a lower daily meal frequency (AIRR = 0.88, 95% CrI: 0.798, 0.979) by 10% than those who are not currently breastfeeding. Compared with children between the ages of 6–8 months, those between 9 and 11 months (AIRR = 1.55 95% CrI: 1.374, 1.754), 12–17 months (AIRR = 1.72, 95% CrI: 1.543, 1.911), and 18–23 months (AIRR = 95% CrI: 1.90, 1.692, 2.125) had 55, 72 and 90% higher rates of daily meal frequency, respectively. The rate of daily meal frequency was 1.17 times greater (AIRR = 1.17, 95% CrI: 0.997, 1.381) in children whose mothers had secondary/higher educational levels than in those whose mothers had no education (Table 4).
Random effect analysis
The amount of variability in daily meal frequency among children aged 6–23 months explained by cluster variation was 13.22% on the basis of the estimated ICC, whereas 86.78% of the variability in inadequate meal frequency was explained by individual-level variation. When a child moves from an area with a low rate to a high rate of daily meal frequency, a 37% increased rate of daily meal frequency was observed (MRR = 1.37). The amount of variability explained by individual-level factors, community-level factors, and both individual- and community-level factors together was 56.25, 62.5, and 64.34%, respectively (Table 5).
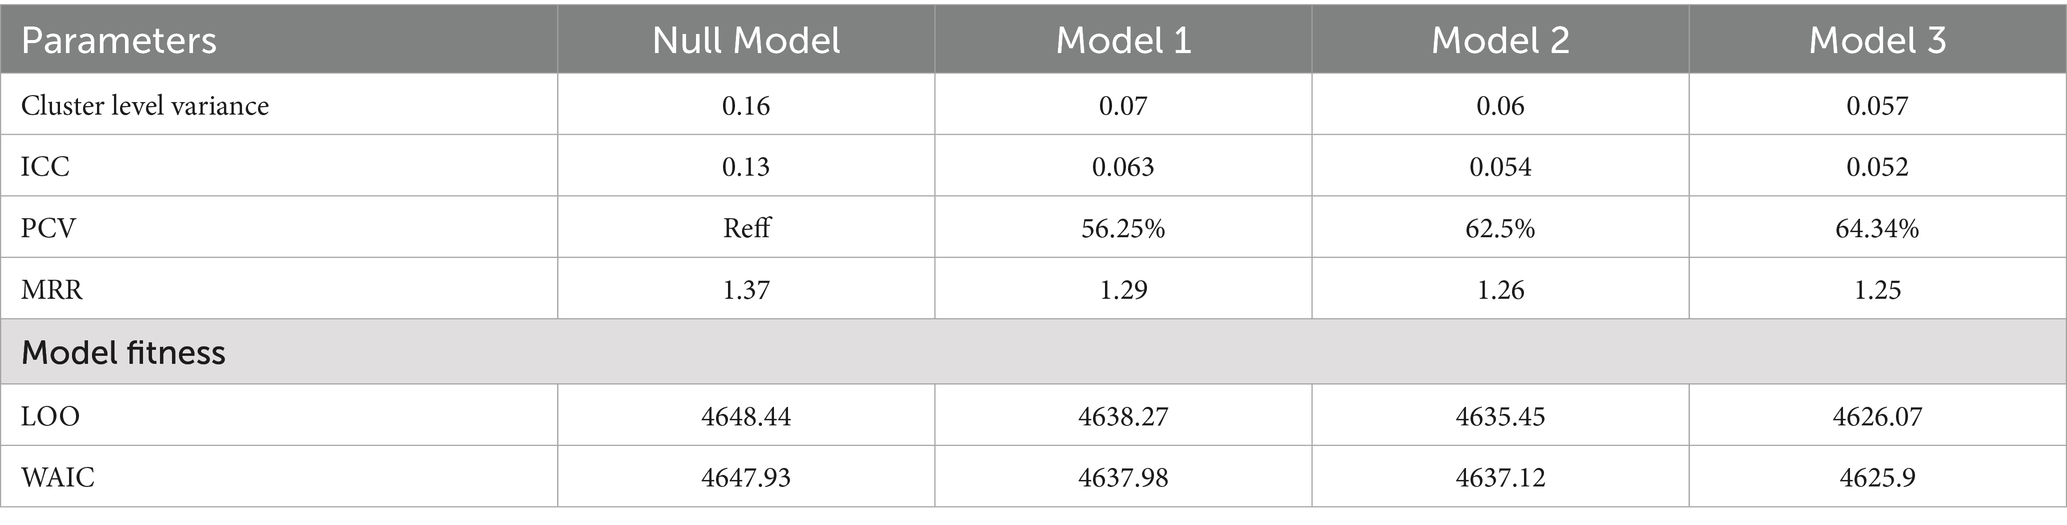
Table 5. Random effect analysis results and model comparison.
Discussion
This study revealed that mothers who have attended secondary or higher educational attainment are more likely to provide the recommended DMF for their children than mothers without formal educational enrollment. This finding is supported by studies performed in Malawi, Ghana, Gambia and Ethiopia (20, 25, 50, 51). This may be because educated mothers or parents are more open to learning new things, are more aware of the value of good child-feeding habits, and can modify their conduct more quickly than illiterate mothers or parents, who are more static and take longer to do so (52). In addition, the impact of education in improving maternal knowledge regarding appropriate feeding practices might result in better IYCF practices. Hence, non-educated mothers usually have a greater understanding of nutrition education than non-educated mothers do (53).
Compared with their peers, currently breastfeeding children were 12% less likely to meet the required DMF (AIRR = 0.88, 95% CI: 0.798, 0.979). This may be because breastfeeding children’s meal frequency is lower than that of non-breastfeeding children. Non-breastfeeding children are required to eat at least four meals per day, whereas breastfeeding children must reduce their meal frequency by at least one meal to meet the requirements (59). Mothers of breastfed children may believe that they do not require many more items, and they may have recently started using DMF in small doses (54).
Children between the ages of 9 to 11, 12 to 17 and 18 to 23 months had 55, 72 and 90% higher rates of receiving the required DMF, respectively, than those between 6 and 11 months. Studies carried out in Ethiopia (25, 50, 51), India (55), Bangladesh (56), and Gambia (20) have provided evidence in favor of this. All these studies indicate that the lower the age of the child is, the greater the risk of inadequate meal frequency (less likely to achieve the minimum meal frequency requirement). This is because many times infants and young children think that it will be difficult for them to eat food and that it will cause problems for their health, so they may not start feeding them soon. As they grow older, they can leave their mothers’ breast milk, increasing their chances of eating food (57).
In the Afar region (IRR = 0.77, 95% CI: 0.615, 0.982), Somalia (AIRR = 0.83, 95% CI: 0.682, 1.01), Benishangul (AIRR = 0.8, 95% CI: 0.639, 0.994), SNNP (AIRR = 0.73, 95% CI: 0.596, 0.894), and (AIRR = 0.73, 95% CI: 0.572, 0.925) decrease the rate of daily meal frequency by 33, 17, 20, 27 and 27%, respectively, compared with that of children from Tigray. This finding was consistent with the EDHS 2016 findings (58). This might be due to regional variations in food availability and accessibility (different regions might have varying levels of access to diverse food sources due to factors such as geographical location, climatic conditions, agricultural practices, infrastructure, and economic disparities). Regions with limited access to resources might experience challenges in ensuring consistent and diverse food availability, impacting meal frequency, socioeconomic disparities, and cultural and dietary practices.
Strengths and limitations of the study
The hierarchical form of the data and the fact that the data are nationally representative are strengths of this study. We employed the necessary advanced statistical analysis by considering individual- and community-level factors via the Bayesian estimation approach. The research participant sample is also appropriate. This study has several drawbacks, including recall bias caused by participant self-reports and a one-day, 24-h recall that failed to capture the child’s regular eating patterns. The recall bias and self-reported investigation together might not provide exact figures for the rate DMF practices in Ethiopia by affecting the women’s accurate past feeding experience with their children. However, the DHS uses trained data collector professionals, and interviewer and social desirability biases might affect the results. Furthermore, the use of secondary data limited our ability to incorporate other important explanatory variables, such as cultural and contextual variables. This might not accurately reflect participants’ past feeding habits.
Conclusion and recommendations
Daily meal frequency was found to be associated with the age of the child, current breastfeeding status, maternal education, and region. In addition, there was a significant clustering pattern across the country. These findings stress the need for tailored interventions addressing regional inequities, promoting age-specific nutrition, supporting maternal education, and empowering working women to improve children’s nutritional intake and ensure more equitable access to meals across Ethiopia. Further research into sociocultural factors is essential for targeted policy and intervention strategies.
Data availability statement
The original contributions presented in the study are included in the article/supplementary material, further inquiries can be directed to the corresponding author/s.
Author contributions
DA: Conceptualization, Data curation, Formal analysis, Funding acquisition, Investigation, Methodology, Project administration, Resources, Software, Supervision, Validation, Visualization, Writing – original draft, Writing – review & editing. AM: Data curation, Formal analysis, Funding acquisition, Supervision, Validation, Visualization, Writing – original draft, Writing – review & editing. EA: Data curation, Formal analysis, Funding acquisition, Supervision, Validation, Visualization, Writing – original draft, Writing – review & editing.
Funding
The author(s) declare that no financial support was received for the research and/or publication of this article.
Acknowledgments
The study’s ethical consideration was acknowledged by the authors as being handled by the DHSs Program office.
Conflict of interest
The authors declare that the research was conducted in the absence of any commercial or financial relationships that could be construed as a potential conflict of interest.
Generative AI statement
The authors declare that no Gen AI was used in the creation of this manuscript.
Publisher’s note
All claims expressed in this article are solely those of the authors and do not necessarily represent those of their affiliated organizations, or those of the publisher, the editors and the reviewers. Any product that may be evaluated in this article, or claim that may be made by its manufacturer, is not guaranteed or endorsed by the publisher.
References
1. World Health Organiation Indicators for assessing infant and young child feeding practices. Geneva, Switzerland: Definitions and measurement methods (2023)
2. Mekonen, EG, Workneh, BS, Ali, MS, Gonete, AT, Alemu, TG, Tamir, TT, et al. Minimum milk feeding frequency and its associated factors among non-breastfed children aged 6–23 months in sub-saharan Africa: a multilevel analysis of the recent demographic and health survey data. BMC Public Health. (2024) 24:1734. doi: 10.1186/s12889-024-19275-2
3. Dadzie, LK, Amo-Adjei, J, and Esia-Donkoh, K. Women empowerment and minimum daily meal frequency among infants and young children in Ghana: analysis of Ghana demographic and health survey. BMC Public Health. (2021) 21:1–9. doi: 10.1186/s12889-021-11753-1
4. Ma, S, Sopheab, H, and Chhea, C. Distribution of minimum meal frequency among children aged 6-23 months in Cambodia. Cambodia J Public Health. (2021) 2:2–4.
5. World Health Organization. Infant and young child feeding: Key facts. Available at: https://www.who.int/news-room/fact-sheets/detail/infant-and-young-child-feeding (Accessed 20 December 2023).
6. WHO. Levels and trends in child malnutrition child malnutrition: UNICEF/WHO/World Bank Group joint child malnutrition estimates. Geneva, Switzerland: Key findings of the 2023 edition World Health Organization (2023).
7. Ephi I. Ethiopian public health Institute (EPHI) and Federal Ministry of Health, Addis Ababa, and The DHS Program, ICF. (2029) Rockville, Maryland, USA. Ethiopia mini demographic and health survey Available at: https://dhsprogram.com/pubs/pdf/FR363/FR363.pdf (Accessed May, 2021).
8. Tegegne, M, Sileshi, S, Benti, T, Teshome, M, and Woldie, H. Factors associated with minimal meal frequency and dietary diversity practices among infants and young children in the predominantly agrarian society of bale zone, Southeast Ethiopia: a community based cross sectional study. Arch Public Health. (2017) 75:53. doi: 10.1186/s13690-017-0216-6
9. Sagaro, GG, and Alemayehu, M. Dietary diversity and associated factors among infants and young children in Wolaita zone, southern Ethiopia. Sci J Clin Med. (2017) 6:53. doi: 10.11648/j.sjcm.20170604.12
10. dos Reis Araujo, T, Davel, AP, and Carneiro, EM. Life-long health consequences of undernutrition in the Yanomami indigenous population in Brazil. Nat Med. (2024) 30:1–2. doi: 10.1038/s41591-024-02991-y
11. Gakidou, E, Afshin, A, Abajobir, AA, Abate, KH, Abbafati, C, Abbas, KM, et al. Global, regional, and national comparative risk assessment of 84 behavioural, environmental and occupational, and metabolic risks or clusters of risks, 1990–2016: a systematic analysis for the global burden of disease study 2016. Lancet. (2017) 390:1345–422. doi: 10.1016/S0140-6736(17)32366-8
12. Rao, S, Swathi, P, Unnikrishnan, B, and Hegde, A. Study of complementary feeding practices among mothers of children aged six months to two years-a study from coastal South India. Australas Med J. (2011) 4:252. doi: 10.4066/AMJ.2011.607
13. Victora, CG, Adair, L, Fall, C, Hallal, PC, Martorell, R, Richter, L, et al. Maternal and child undernutrition: consequences for adult health and human capital. Lancet. (2008) 371:340–57. doi: 10.1016/S0140-6736(07)61692-4
14. Oddy, WH, Kendall, GE, Blair, E, De Klerk, NH, Stanley, FJ, Landau, LI, et al. Breast feeding and cognitive development in childhood: a prospective birth cohort study. Paediatr Perinat Epidemiol. (2003) 17:81–90. doi: 10.1046/j.1365-3016.2003.00464.x
15. Black, RE, Allen, LH, Bhutta, ZA, Caulfield, LE, De Onis, M, Ezzati, M, et al. Maternal and child undernutrition: global and regional exposures and health consequences. Lancet. (2008) 371:243–60. doi: 10.1016/S0140-6736(07)61690-0
16. Beyene, M, Worku, AG, and Wassie, MM. Dietary diversity, meal frequency and associated factors among infant and young children in Northwest Ethiopia: a cross-sectional study. BMC Public Health. (2015) 15:1–9. doi: 10.1186/s12889-015-2333-x
17. Wake, AD. Prevalence of minimum meal frequency practice and its associated factors among children aged 6 to 23 months in Ethiopia: a systematic review and meta-analysis. Glob Pediatr Health. (2021) 8:2333794X211026184. doi: 10.1177/2333794X211026184
18. Kassa, T, Meshesha, B, Haji, Y, and Ebrahim, J. Appropriate complementary feeding practices and associated factors among mothers of children age 6–23 months in southern Ethiopia, 2015. BMC Pediatr. (2016) 16:1–10. doi: 10.1186/s12887-016-0675-x
19. Wuneh, AG, Ahmed, W, Bezabih, AM, and Reddy, PS. Dietary diversity and meal frequency practices among children aged 6-23 months in agro pastoral communities in Afar region, Ethiopia: a cross-sectional study. Ecol Food Nutr. (2019) 58:575–96. doi: 10.1080/03670244.2019.1644328
20. Terefe, B, Jembere, MM, and Abie Mekonnen, B. Minimum meal frequency practice and associated factors among children aged 6–23 months old in the Gambia: a multilevel mixed effect analysis. Sci Rep. (2023) 13:22607. doi: 10.1038/s41598-023-49748-0
21. Mekonen, EG, Zegeye, AF, and Workneh, BS. Complementary feeding practices and associated factors among mothers of children aged 6 to 23 months in sub-Saharan African countries: a multilevel analysis of the recent demographic and health survey. BMC Public Health. (2024) 24:115. doi: 10.1186/s12889-023-17629-w
22. Aemro, M, Mesele, M, Birhanu, Z, and Atenafu, A. Dietary diversity and meal frequency practices among infant and young children aged 6–23 months in Ethiopia: a secondary analysis of Ethiopian demographic and health survey 2011. J Nut Metabol. (2013) 2013:782931:1–8. doi: 10.1155/2013/782931
23. Wagris, M, Seid, A, Kahssay, M, and Ahmed, O. Minimum meal frequency practice and its associated factors among children aged 6–23 months in Amibara District, north East Ethiopia. J Environ Public Health. (2019) 2019:1–7. doi: 10.1155/2019/8240864
24. Ahmed, JA, Sadeta, KK, and Lenbo, KH. Magnitude and factors associated with appropriate complementary feeding practice among mothers of children 6–23 months age in Shashemene town, Oromia-Ethiopia: community based cross sectional study. PLoS One. (2022) 17:e0265716. doi: 10.1371/journal.pone.0265716
25. Belew, AK, Ali, BM, Abebe, Z, and Dachew, BA. Dietary diversity and meal frequency among infant and young children: a community based study. Ital J Pediatr. (2017) 43:1–10. doi: 10.1186/s13052-017-0384-6
26. Nsiah-Asamoah, C, Adjei, G, Agblorti, S, and Doku, DT. Association of maternal characteristics with child feeding indicators and nutritional status of children under-two years in rural Ghana. BMC Pediatr. (2022) 22:581. doi: 10.1186/s12887-022-03651-1
27. Khan, JR, Awan, N, and Sheikh, MT. A multilevel and spatial analysis of the infant and young child feeding practices and associated factors among the under-2 aged children in Bangladesh. Child Care Pract. (2022) 28:178–95. doi: 10.1080/13575279.2019.1680528
28. Tariqujjaman, M, Hasan, MM, Mahfuz, M, Hossain, M, and Ahmed, T. Association between mother’s education and infant and young child feeding practices in South Asia. Nutrients. (2022) 14:1514. doi: 10.3390/nu14071514
29. Mulat, E, Alem, G, Woyraw, W, and Temesgen, H. Uptake of minimum acceptable diet among children aged 6–23 months in orthodox religion followers during fasting season in rural area, DEMBECHA, north West Ethiopia. BMC Nut. (2019) 5:1–10. doi: 10.1186/s40795-019-0274-y
30. Organization WH. Infant and young child feeding: Model chapter for textbooks for medical students and allied health professionals. Geneva, Switzerland: World Health Organization (2009).
31. Prudhon, C, Benelli, P, Maclaine, A, Harrigan, P, and Frize, J. Informing infant and young child feeding programming in humanitarian emergencies: an evidence map of reviews including low and middle income countries. Matern Child Nutr. (2018) 14:e12457. doi: 10.1111/mcn.12457
32. Marriott, BP, White, A, Hadden, L, Davies, JC, and Wallingford, JC. World Health Organization (WHO) infant and young child feeding indicators: associations with growth measures in 14 low-income countries. Matern Child Nutr. (2012) 8:354–70. doi: 10.1111/j.1740-8709.2011.00380.x
33. Sinhababu, A, Mukhopadhyay, DK, Panja, TK, Saren, AB, Mandal, NK, and Biswas, AB. Infant-and young child-feeding practices in Bankura district, West Bengal, India. J Health Popul Nutr. (2010) 28:294. doi: 10.3329/jhpn.v28i3.5559
34. NU. CEPAL. (2016) The 2030 Agenda and the Sustainable Development Goals: An opportunity for Latin America and the Caribbean. Goals, Targets and Global Indicators. UNITED NATIONS, DIGITAL REPOSITORY: Economic commission for Latin America and the carideans. 2029-01-07. Available at: https://hdl.handle.net/11362/40156
35. MINISTREY OF HEALTH-ETHIOPIA. National Nutrition Program. (2028). Available at: https://www.moh.gov.et/en/initiatives-4-col/Nutrition?language_content_entity=en
36. Tesfie, TK, Endalew, B, Birhanu, MY, Haimanot, AB, Mneneh, AL, Mengie, MG, et al. Spatial distribution of inadequate meal frequency and its associated factors among children aged 6–23 months in Ethiopia: multilevel and spatial analysis. PLoS One. (2024) 19:e0306646. doi: 10.1371/journal.pone.0306646
37. Geodatos. Ethiopian geographic coordinates. (2021). Available at: https://www.geodatos.net/en/coordinates/ethiopia
38. Demographic I. Health surveys standard recode manual for dhs7 The Demographic and Health Surveys Program (2018) Rockville, Maryland, USA: ICF.
39. World Health Organization. WHO recommendations on antenatal care for a positive pregnancy experience. Guideline. Geneva: World Health Organization. Avaiable at: https://iris.who.int/bitstream/handle/10665/250796/9789241549912-eng.pdf?sequence=1 (Accessed 28 November, 2016).
40. Kramer, MS, and Kakuma, R. The optimal duration of exclusive breastfeeding: A systematic review. Adv Exp Med Biol. (2004) 554:63–77. doi: 10.1007/978-1-4757-4242-8_7
41. Alie, MS, Abebe, GF, and Negesse, Y. Magnitude and determinants of unmet need for family planning among reproductive age women in East Africa: multilevel analysis of recent demographic and health survey data. Contracep Reproduc Med. (2022) 7:1–11. doi: 10.1186/s40834-022-00168-x
42. Nkoka, O, Chuang, T-W, and Chen, Y-H. Multilevel analysis of factors associated with treatment-seeking behaviors among caregivers with febrile children in Malawi. Am J Trop Med Hyg. (2019) 100:1454–65. doi: 10.4269/ajtmh.18-0900
43. Li, B, Lingsma, HF, Steyerberg, EW, and Lesaffre, E. Logistic random effects regression models: a comparison of statistical packages for binary and ordinal outcomes. BMC Med Res Methodol. (2011) 11:1–11. doi: 10.1186/1471-2288-11-77
44. Hesketh, SR, and Skrondal, A. Multilevel and longitudinal modeling using Stata. College Station, Texas: STATA press (2021).
45. Lord, D, and Mannering, F. The statistical analysis of crash-frequency data: a review and assessment of methodological alternatives. Transp Res A Policy Pract. (2010) 44:291–305. doi: 10.1016/j.tra.2010.02.001
46. Bürkner, P-C. Brms: an R package for Bayesian multilevel models using Stan. J Stat Softw. (2017) 80:1–28. doi: 10.18637/jss.v080.i01
47. Gelman, A, and Rubin, DB. Inference from iterative simulation using multiple sequences. Stat Sci. (1992) 7:457–72. doi: 10.1214/ss/1177011136
48. Gelman, A. Data analysis using regression and multilevel/hierarchical models. Cambridge, UK: Cambridge university press (2007).
50. Mekonnen, TC, Workie, SB, Yimer, TM, and Mersha, WF. Meal frequency and dietary diversity feeding practices among children 6–23 months of age in Wolaita Sodo town, southern Ethiopia. J Health Popul Nutr. (2017) 36:1–8. doi: 10.1186/s41043-017-0097-x
51. Muche, T, Desalegn, S, Ali, H, Mareg, M, Sisay, D, Birhane, M, et al. Minimum dietary diversity and its associated factors among infants and young children in Ethiopia: evidence from Ethiopian demographic and health survey (2016). Heliyon. (2022) 8:3–5. doi: 10.1016/j.heliyon.2022.e08727
52. Na, M, Jennings, L, Talegawkar, SA, and Ahmed, S. Association between women’s empowerment and infant and child feeding practices in sub-Saharan Africa: an analysis of demographic and health surveys. Public Health Nutr. (2015) 18:3155–65. doi: 10.1017/S1368980015002621
53. Chapagain, R. Factors affecting complementary feeding practices of Nepali mothers for 6 months to 24 months children. J Nepal Health Res Counc. (2013) 11:205–7.
54. Avula, R RA, Oddo, V, Kadiyala, S SK, and Menon, P PM. Scaling-up interventions to improve infant and young child feeding in India: what will it take? Matern Child Nutr. (2017) 13:4–11. doi: 10.1111/mcn.12414
55. Patel, A, Pusdekar, Y, Badhoniya, N, Borkar, J, Agho, KE, and Dibley, MJ. Determinants of inappropriate complementary feeding practices in young children in India: secondary analysis of National Family Health Survey 2005–2006. Matern Child Nutr. (2012) 8:28–44. doi: 10.1111/j.1740-8709.2011.00385.x
56. Kabir, I, Khanam, M, Agho, KE, Mihrshahi, S, Dibley, MJ, and Roy, SK. Determinants of inappropriate complementary feeding practices in infant and young children in Bangladesh: secondary data analysis of demographic health survey 2007. Matern Child Nutr. (2012) 8:11–27. doi: 10.1111/j.1740-8709.2011.00379.x
57. Ahmed, KY, Page, A, Arora, A, and Ogbo, FA. Trends and factors associated with complementary feeding practices in Ethiopia from 2005 to 2016. Matern Child Nutr. (2020) 16:e12926. doi: 10.1111/mcn.12926
58. CSA I. Ethiopia demographic and health survey 2016. Addis Ababa, Ethiopia and Calverton. Maryland, USA: Central Statistical Agency and ICF International (2016). 430 p.
59. WHO U, USAID A, AED U. Indicators for assessing infant and young child feeding practices. Geneva: World Health Organization (2008).
Glossary
AIRR - Adjusted incidence rate ratio
CSA - Central Statistical Agency
DMF - Daily meal frequency
EAs - Enumeration areas
EPHI - Ethiopian Public Health Institute
HMC - Hamiltonian Monte Carlo
ICC - Intra class correlation
IYCF - Infant and young child feeding
KR - Kids record
LOO - leave-one-out cross-validation
MCMC - Markov chain Monte Carlo
MMR - Median rate ratio
Mini EDHS - Ethiopian mini demographic and health survey
MMF - Minimum meal frequency
NUTS - No-U-turn sampler
SDG-2 - Sustainable Development Goal-2
SNNP - Southern Nations, Nationalities and People
UNICEF - United Nations Children’s Fund
VPC - Variance partition coefficient
WAIC - Widely applicable information criterion
WHO - World Health Organization
Keywords: associated factors, Bayesian hierarchical model, children 6–23 months, daily meal frequency, Ethiopia
Citation: Asgedom DK, Mohammed AA and Anbesu EW (2025) Daily meal frequency and its associated factors among children aged 6–23 months in Ethiopia: a Bayesian hierarchical Poisson model. Front. Public Health. 13:1563392. doi: 10.3389/fpubh.2025.1563392
Edited by:
Edson Zangiacomi Martinez, University of São Paulo, BrazilReviewed by:
James Stamey, Baylor University, United StatesTeresa Abbattista, Senigallia Hospital, Italy
Jorge Alberto Achcar, University of São Paulo, Brazil
Fentaw Wassie Feleke, Woldia University, Ethiopia
Copyright © 2025 Asgedom, Mohammed and Anbesu. This is an open-access article distributed under the terms of the Creative Commons Attribution License (CC BY). The use, distribution or reproduction in other forums is permitted, provided the original author(s) and the copyright owner(s) are credited and that the original publication in this journal is cited, in accordance with accepted academic practice. No use, distribution or reproduction is permitted which does not comply with these terms.
*Correspondence: Dejen Kahsay Asgedom, ZGVqZW5rMkBnbWFpbC5jb20=