 Cuiting Yu
 Tianrun Li
 Qin Wan
- School of Economics and Management, Southwest Petroleum University, Chengdu, China
Introduction: Energy poverty significantly affects the well-being of vulnerable populations, particularly middle-aged and older adult individuals in rural China. This study investigates how energy poverty impacts health capital, using data from the China Health and Retirement Longitudinal Study (CHARLS).
Methods: We employed the Multidimensional Energy Poverty Index (MEPI) to measure energy poverty and used an ordered logit model to analyze its effects on self-rated health (SRH) as a proxy for health capital. The study utilized longitudinal data from 2013, 2015, 2018, and 2020, covering 9,464 observations, and included control variables such as age, gender, and chronic disease status. Endogeneity was addressed using instrumental variables and propensity score matching.
Results: The findings indicate that energy poverty has a significant negative impact on health capital, with a regression coefficient of −0.221(p<0.01), lowering self-rated health levels. This effect is consistent across physical health, mental health, and daily functioning. Heterogeneity analysis reveals that individuals with lower education levels and those in southern rural areas experience more severe health impacts. Mediation tests confirm that indoor environmental conditions partially mediate this relationship.
Discussion: The study underscores the urgent need for targeted interventions to mitigate energy poverty in rural China. Expanding access to clean energy, improving rural infrastructure, and providing financial subsidies are critical. Education and regional policies should also be prioritized to address disparities.
1 Introduction
Energy serves as the foundation of modern society, underpinning economic growth, technological advancement, and overall human wellbeing. However, more than 700 million people worldwide still live without access to electricity, while billions rely on inefficient and highly polluting energy sources, such as biomass fuels and coal, for daily activities (1). The lack of adequate energy access or its improper use not only perpetuates the cycle of poverty but also poses significant threats to human health (2–4). In many developing regions, limited access to reliable and affordable energy sources constrains economic opportunities, restricts access to education and healthcare, and increases reliance on hazardous traditional fuels. As a result, energy poverty has emerged as a critical issue that requires urgent attention (5). The United Nations Development Programme (UNDP) defines energy poverty as an absence of sufficient choice in accessing adequate, affordable, reliable, high-quality, and environmentally and health-friendly energy services to support economic development opportunities for communities (6). According to the International Energy Agency (IEA), energy poverty refers to a lack of access to electricity and dependence on traditional biomass for cooking and heating. Similarly, the Asian Development Bank (ADB) defines energy poverty as the inability to cook with modern fuels and the lack of minimum energy required to meet basic needs and income-generating activities after sunset (7). Many scholars, when studying energy poverty, incorporate Amartya Sen’s Capability Approach, framing energy poverty as a lack of capability or freedom to meet basic energy needs (8–11). This theory emphasizes that poverty is not merely a shortage of resources but rather a limitation on people’s ability to achieve fundamental functions and lead a dignified life. In the context of energy poverty, this perspective extends beyond mere energy availability to examine whether individuals or communities have the capacity to access, afford, and efficiently utilize energy to meet basic survival needs and improve their quality of life. In China, energy poverty is particularly prominent in rural areas. Consequently, Chinese scholars have actively investigated this phenomenon, conducting a series of studies. For example, Liao et al. (12) argue that due to factors such as income levels and energy availability, energy-poor households primarily rely on solid fuels for cooking and heating. Yang and Zhang (13) further assert that the root cause of energy poverty is not the inaccessibility or unaffordability of energy services but rather the deprivation of people’s capability to utilize them effectively.
Various methods have been proposed to effectively measure energy poverty. At the household level, these methods can be broadly categorized into two main types: unidimensional measurement methods and multidimensional measurement methods (14). Unidimensional measurement methods typically assess the extent of energy poverty based on a single indicator, such as energy consumption (15) or energy expenditure (16). In contrast, multidimensional measurement methods take into account multiple dimensions related to energy poverty, offering a more comprehensive evaluative perspective (17). The Multidimensional Energy Poverty Index (MEPI), developed by Nussbaumer et al. (9) based on the Oxford Poverty and Human Development Initiative’s Multidimensional Poverty Index (MPI), provides a more nuanced representation of the complexity and diversity of energy poverty. As a result, it has been widely adopted in academic research. For instance, Sadath and Acharya (8) applied MEPI to assess energy poverty in India, offering empirical insights for optimizing energy policies in developing countries. Similarly, Mendoza et al. (18) utilized the MEPI approach to examine energy poverty in the Philippines, while Sokołowski et al. (19) employed MEPI to measure household energy poverty in Poland. Many scholars have also explored energy poverty in China using this method. For example, He et al. (20), Xie (21), Zhao et al. (22), and Wang and Lin (23) have applied the MEPI to measure energy poverty in China. Given MEPI’s strong applicability and its ability to provide a reliable analytical framework, this study adopts MEPI as the core measurement tool to analyze energy poverty in rural China.
Energy poverty is closely related to health (24). In regions with limited energy access, many households still rely on solid fuels such as wood, coal, and animal dung as their primary energy sources. The combustion of these fuels in poorly ventilated environments leads to indoor air pollution, which adversely affects individual health (25). A wide consensus has developed that energy poverty affects a nation’s health (26–28), contributing to a range of negative health outcomes. As one of the largest developing countries in the world, China also faces an energy poverty crisis in some households. The impact of energy poverty on health has been supported by empirical data from China (29–31), including some studies specifically focusing on rural areas. For details, see Table 1. However, most of these studies have not focused on specific demographic groups. The health of middle-aged and older adult residents in rural China is significantly affected by energy poverty. On one hand, they have higher health demands; however, their low income and limited education create barriers to accessing and utilizing modern energy sources. On the other hand, the inadequate energy infrastructure in rural areas often forces residents to rely on traditional fuels for daily needs, further exacerbating health risks. According to a study, the likelihood of a home suffering from energy poverty increases by 2.4 percentage points when it is located in a rural area (32). Although existing research has made some progress in examining energy poverty and its health impacts, studies on the relationship between health capital and energy poverty among middle-aged and older adult populations in rural China remain insufficient. Given that this demographic constitutes a vital segment of rural communities and that their health capital is potentially threatened by energy poverty, greater attention is needed. This study, therefore, focuses on the health capital of middle-aged and older adult individuals in rural China. By thoroughly exploring the impact of energy poverty on their health capital, this research seeks to provide theoretical support for the development of more targeted energy and health policies, ultimately contributing to the enhancement of overall health and quality of life in rural areas.
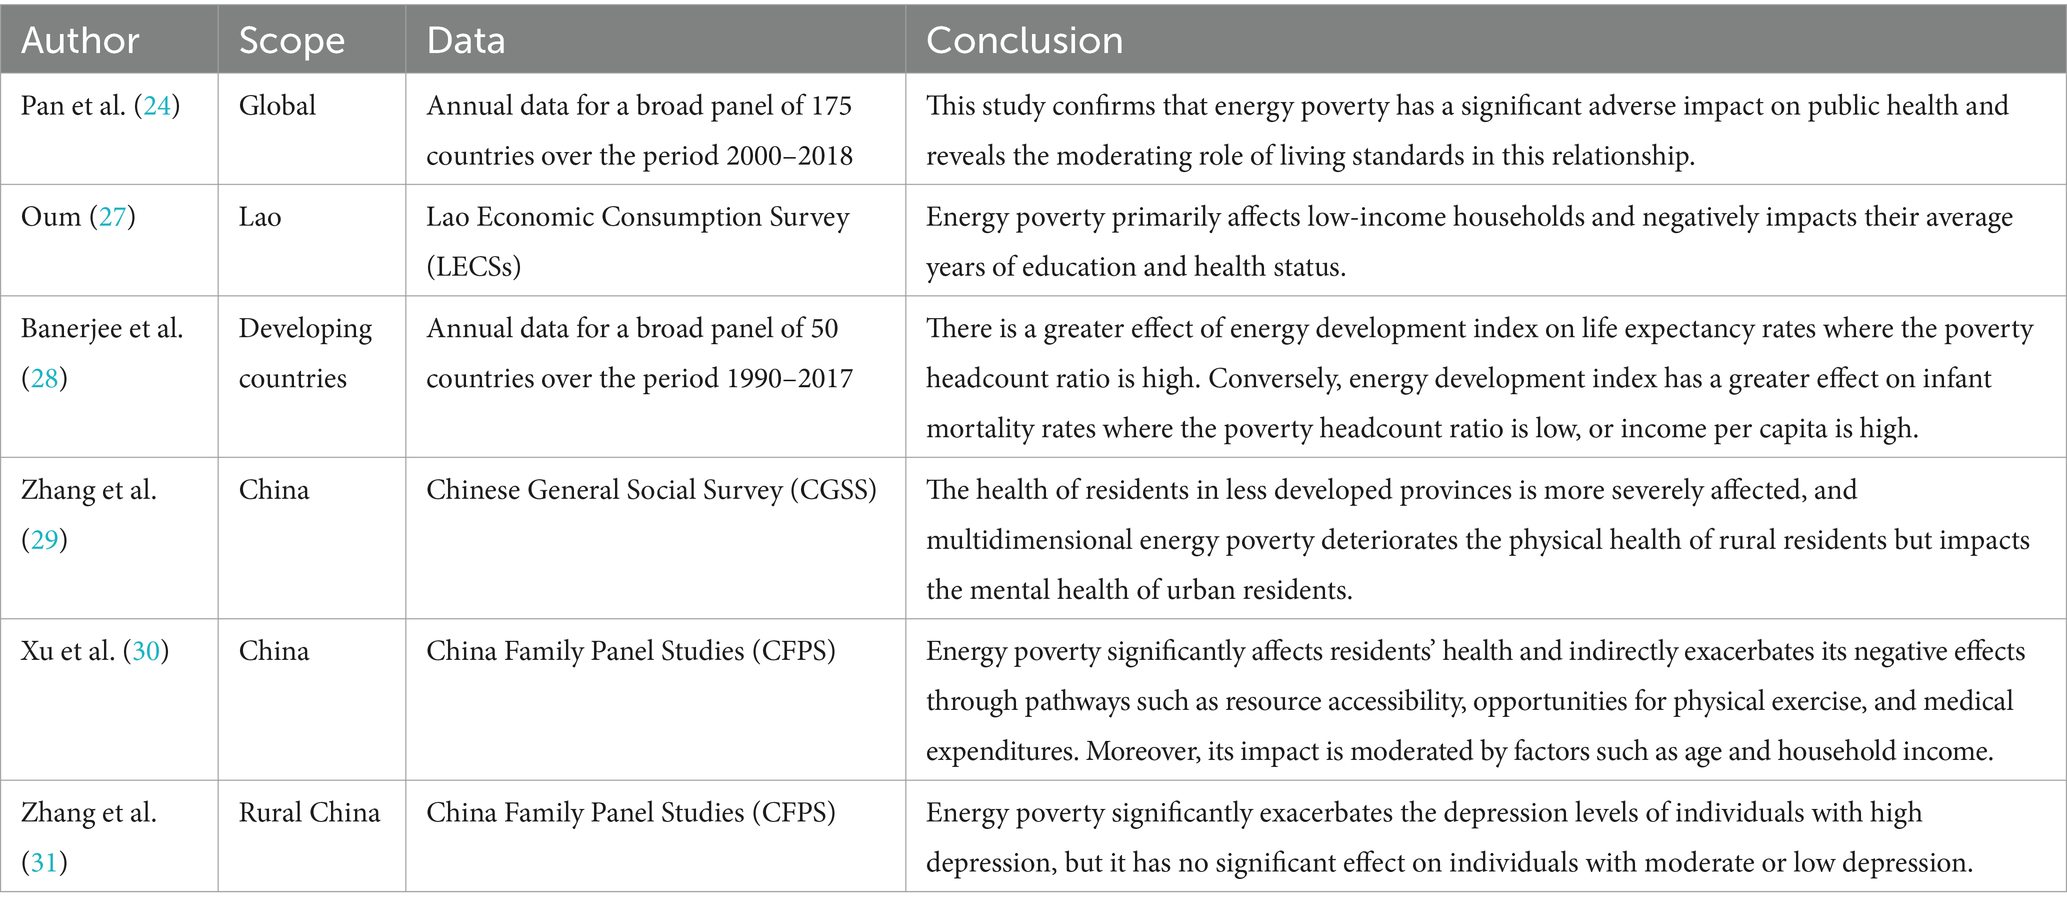
Table 1. Related literature.
2 Theoretical basis
2.1 Grossman health demand model
The Grossman health demand model is a classic theoretical framework in health economics that conceptualizes health as a consumption good, a factor of production, and a form of capital. In this model, individuals actively manage their own health, exercising subjective agency (33). Moreover, the model provides a strong explanatory framework for various health-related phenomena, including the relationship between socioeconomic status and health. According to the Grossman model, the following equation can be derived:
where i represents age, γi denotes the return on health as a productive input, and αi represents the return on health as a consumption good. Due to diminishing marginal returns and diminishing marginal utility, the marginal efficiency curve (MEC) of health capital slopes downward (Figure 1). Investing in health requires individuals to forgo the opportunity to allocate resources to other market investment projects, whose returns are equivalent to the interest rate r and the depreciation rate of health δi. Considering the rate of change in marginal cost across different periods (representing the change in marginal cost from period i − 1 to i), the return on health must be at least to ensure that health investment remains competitive with alternative investments. When Equation 1 holds, it signifies that the marginal return on health investment equals the cost of utilizing health capital. And the sum of the returns from alternative investments, the rate of change in marginal costs, and the depreciation rate ( ) represents the actual price of health capital.
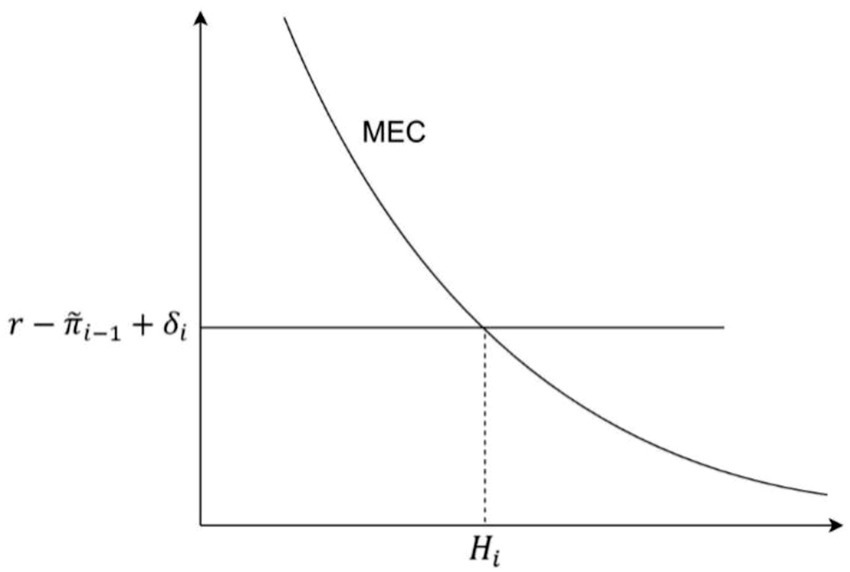
Figure 1. The demand curve for health capital and the equilibrium point.
2.2 Energy poverty and the expansion of the health demand model
For households, one significant way in which energy poverty affects health is through indoor pollution caused by the use of non-clean energy, which in turn negatively impacts health. Since pollution physically affects human health, it exogenously alters an individual’s health by accelerating health depreciation (34). The impact of energy poverty on health is similar to that of environmental pollution, as both affect physical health. Consequently, energy poverty also influences an individual’s health level by affecting health depreciation δi. The health depreciation rate can be expressed as:
where δ0 represents the initial health depreciation rate; i denotes age, which affects the health depreciation rate with a constant elasticity ; Pi represents the state of pollution; and Si represents other variables that influence health. Equation 2 helps to understand the mechanism through which energy poverty impacts health capital. Energy poverty leads to indoor pollution, which directly affects the depreciation of health capital.
Since γi and αi share similar properties, to simplify the model and facilitate analysis, it is assumed that acquiring more healthy time is the sole motivation for investing in health. This assumption leads to the following equation:
Taking the partial derivative of Equation 3 with respect to i yields the rate of decline in an individual’s health level over their lifetime: , where the tilde represents the rate of change of a variable over time. Here, , denotes the proportion of health depreciation in the total cost of health capital, while , represents the elasticity of health level with respect to health costs.
Differentiating Equation 3 with respect to results in:
Equation 4 indicates that when health depreciation changes due to energy poverty, an individual’s health also changes in the opposite direction. In addition to affecting health changes, energy poverty also impacts variations in health investment. By definition, net investment in the stock of health equals gross investment minus depreciation: , where Ii represents gross health investment. Rewriting this equation yields:
Taking the derivative of Equation 5 with respect to , we obtain:
Equation 6 demonstrates that energy poverty leads individuals to increase their health investments. However, this increased health investment often fails to restore their health levels to those of individuals who are not experiencing energy poverty. Individuals in energy poverty allocate part of their resources to offset the utility loss caused by energy poverty. To maximize utility, they do not invest sufficient resources to match the health levels of those not in energy poverty, ultimately sacrificing a certain degree of health. This dynamic can be better understood graphically: when energy poverty increases health depreciation from to , the rising cost of health capital causes health levels to decline from to (Figure 2). To empirically test the theoretical effect of energy poverty on health capital, the following research hypothesis is proposed:
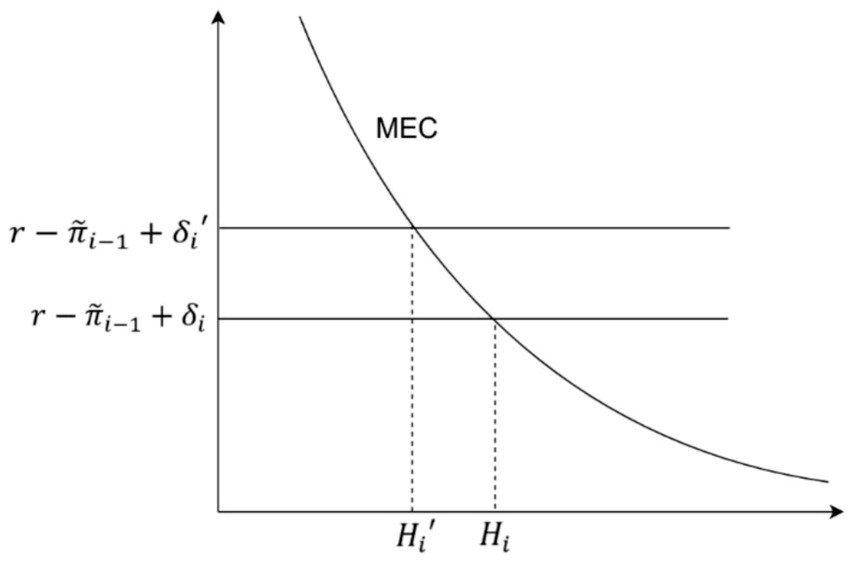
Figure 2. The negative health impacts of energy poverty.
Hypothesis 1: Energy poverty has a negative impact on residents’ health capital.
Hypothesis 2: Energy poverty affects residents’ health capital by deteriorating indoor environmental conditions.
2.3 Heterogeneity analysis of the health effects of energy poverty
The previous analysis is based on the assumption that all groups share common characteristics. However, health disparities exist widely, and the impact of energy poverty on health varies among individuals. For instance, according to the Efficient Producer Hypothesis, health disparities arise because, compared to less-educated individuals, those with higher education levels are more efficient in producing health (35). Education enhances an individual’s willingness to invest in long-term assets, including health. Additionally, more educated individuals are better at following medical advice and adhering to complex treatment regimens. To model this phenomenon, assume the gross health investment production function is given by: , where the function is homogeneous of degree one and can be rewritten as:
where , Mi represents medical services received in period i, and THi represents the time spent on health-promoting activities, such as exercise. The marginal product of time and medical services in health investment are given by: , . In the gross health investment function, the marginal product of human capital (education) Ei is:
If a circumflex over a variable denotes a percentage change per unit change in E, the last equation can be rewritten as:
This equation implies that a unit increase in human capital leads to a weighted average change in total health investment based on the marginal products of time and medical services. Since human capital enhances productivity, . Education increases the marginal productivity of direct inputs, which in turn reduces the amount of these inputs needed to produce a certain level of gross investment. As a result, without any change in input prices, an increase in education leads to a reduction in average or marginal costs. If represents the percentage change in average or marginal cost, . As a result, differences in health costs lead to variations in health levels.
When facing energy poverty, individuals with different levels of human capital exhibit different responses, leading to varied health impacts. The relationship between the elasticity of the marginal efficiency of capital (MEC) curve and human capital E confirms this:
Since , it follows that , leading to . This indicates that individuals with higher human capital experience a lower impact from external factors on their health compared to those with lower human capital. When faced with the threat of energy poverty, individuals seek to maximize utility by increasing their investment ( ) to maintain an appropriate level of marginal health output. However, the efficiency of health investment varies among individuals with different levels of human capital ( ). Consequently, the changes in health status due to external factors also differ. In graphical representation, individuals with different levels of human capital exhibit varying elasticities ( ), leading to heterogeneous effects of energy poverty on their health status (Figure 3).
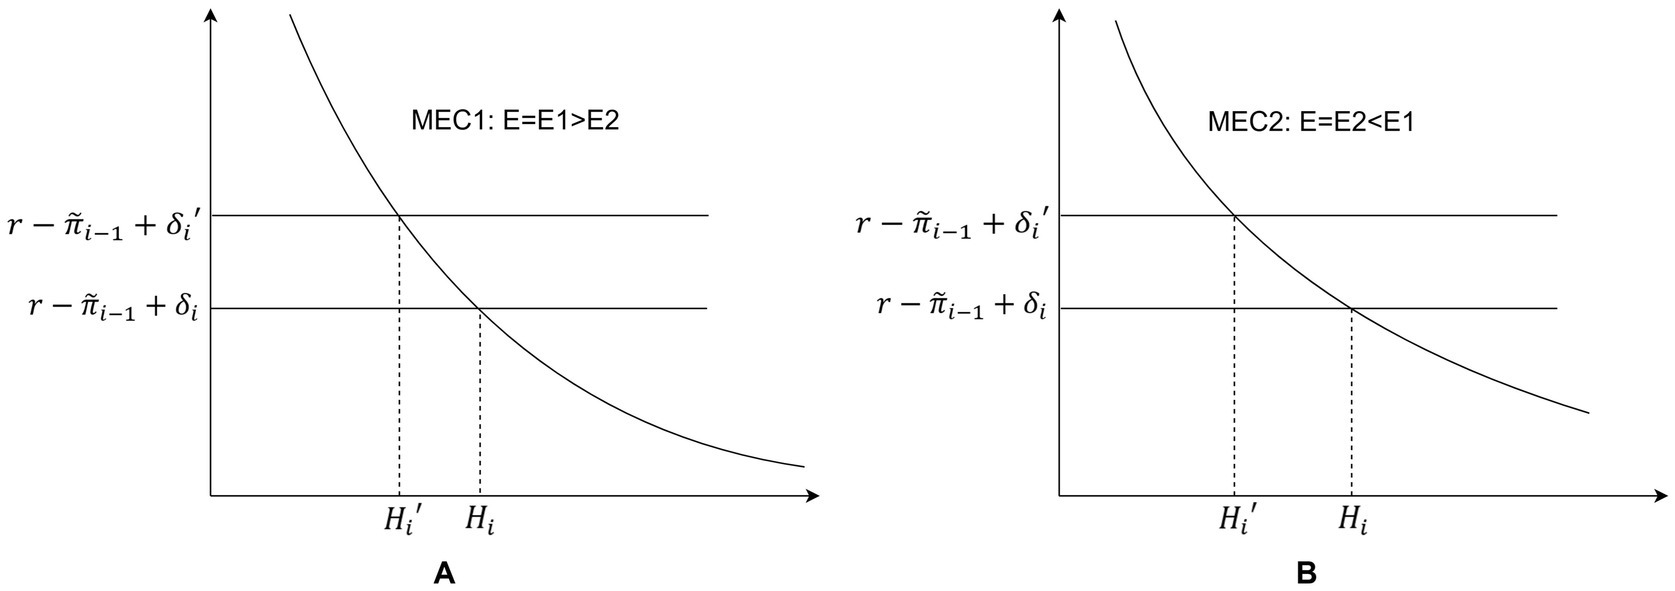
Figure 3. (A) Changes in health capital stock in individuals with higher human capital in the face of energy poverty. (B) Changes in health capital stock in individuals with lower human capital in the face of energy poverty.
Similarly, regional differences may also result in variations in health capital levels among individuals affected by energy poverty. Given China’s vast territory and significant temperature differences between the north and south, energy demands vary accordingly. In northern China, where cold weather necessitates heating, energy poverty is likely to have a more severe impact on residents’ health. To examine whether energy poverty leads to heterogeneous effects on health capital, the following research hypothesis is proposed:
Hypothesis 3: Energy poverty has heterogeneous effects on residents’ health capital, influenced by both educational attainment and regional differences.
3 Materials and methods
3.1 Data sources and variables
3.1.1 Data sources
This study utilizes data from the China Health and Retirement Longitudinal Study (CHARLS), a large-scale interdisciplinary survey project jointly conducted by Wuhan University and Peking University. The CHARLS database aims to collect high-quality microdata that are representative of Chinese households and individuals aged 45 and above, providing essential information for analyzing China’s aging population. The CHARLS questionnaire contains a rich set of information, including basic demographic characteristics, family structure and household finances, health status, healthcare utilization and insurance, retirement and pensions, and consumption patterns. This comprehensive dataset fully meets the needs of this study. The study selects longitudinal data from the 2013, 2015, 2018, and 2020 waves of CHARLS. After data cleaning, the final dataset comprises 9,464 observations, covering multiple health-related variables.
3.1.2 Variable selection
Health capital. Following the approach of Zhao Ming et al. (36), this study employs self-rated health (SRH) as a measure of individual health capital. Compared to single indicators such as disease incidence or medical expenditures, SRH more effectively captures middle-aged and older adult individuals’ overall perception of their health status. This subjective assessment is crucial, as it significantly influences life satisfaction, labor participation, and consumption behavior. Although SRH is a self-reported measure, it is highly correlated with various objective health indicators (e.g., chronic diseases, functional ability), reflecting long-term and multifaceted health outcomes beyond specific diseases or symptoms (37–39). The self-rated health variable (Health) is an ordinal variable, ranging from 1 (very poor) to 5 (very good), with higher values indicating better perceived health status.
Energy poverty. Gafa et al. (40) refined Nussbaumer’s Multidimensional Energy Poverty Index (MEPI), making it more applicable to rural areas. Based on their framework and incorporating the adaptation approach of Yang and Zhang (13) for the Chinese context, this study selects six indicators to measure energy poverty: access to electricity, access to tap water, access to piped gas, type of cooking fuel used, proportion of income spent on electricity and water bills, proportion of income spent on fuel costs (See Table 2 for details on energy poverty measurement).
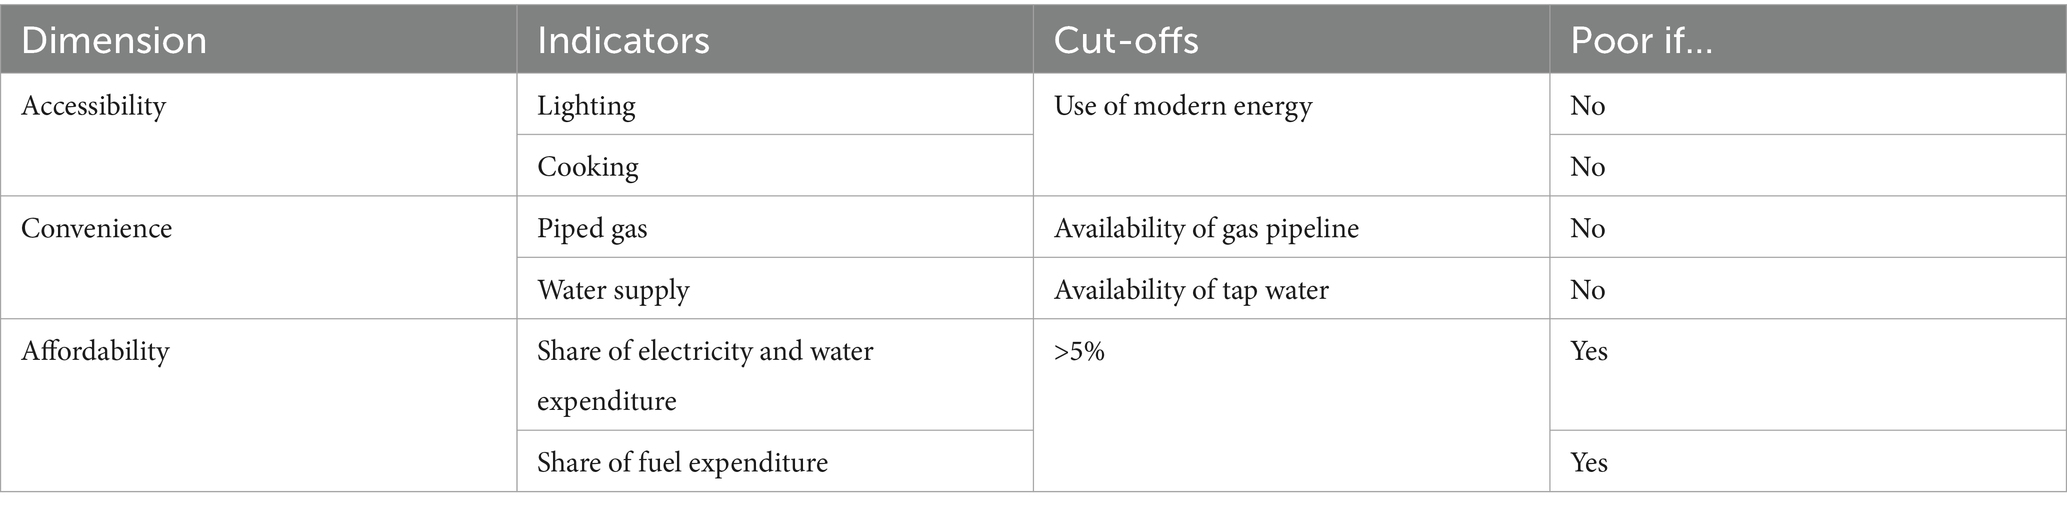
Table 2. Energy poverty evaluation indicators.
Control variables. This study includes sleep duration, presence of chronic diseases, age, consumption level, gender, exercise habits, and hospitalization in the past year as control variables (41, 42). These factors are widely recognized as being closely associated with individual health status (Table 3).
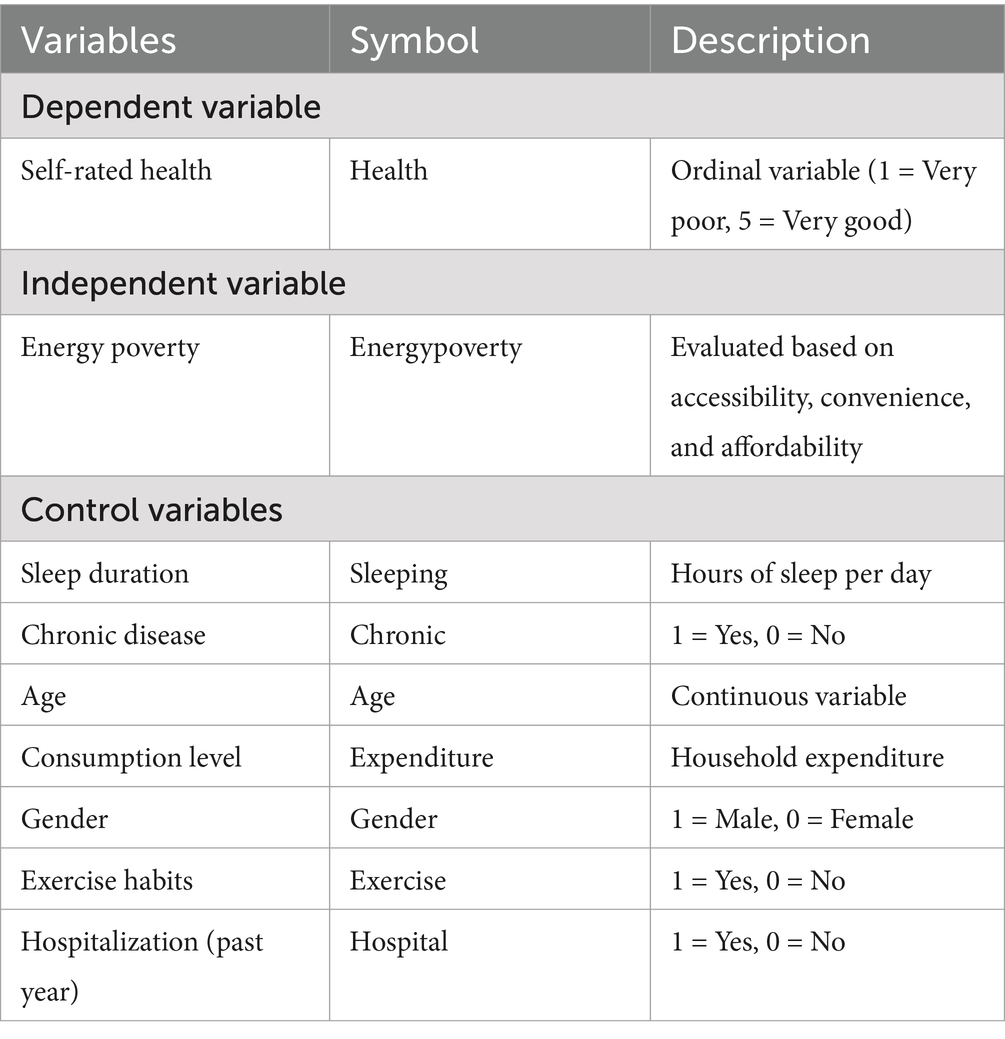
Table 3. Variables and their notation.
3.2 Methods for measuring energy poverty
Energy poverty, as a composite indicator, requires determining a specific value using comprehensive evaluation methods. This study adopts the entropy method to calculate the index. The detailed steps are as follows:
Step 1: Data standardization. Let denote the maximum value of the j-th indicator across evaluation objects, and denote the minimum value of the j-th indicator. For positive indicators, the standardization formula is:
For negative indicators, the standardization formula is:
After standardization and direction adjustment, the value range of zj is [0, 1].
Step 2: Constructing the normalized matrix. Based on the standardized indicator zj, the normalized matrix pij is constructed as follows:
Here, zij represents the standardized value of the j-th indicator for the i-th object, where n is the number of objects, and where m is the total number of indicators.
Step 3: Calculating the entropy value. Based on the normalized matrix pij, the entropy value of the j-th indicator is calculated as:
where k is a constant, defined as
Step 4: Calculating the degree of redundancy in information entropy. Based on the entropy value ej, the redundancy degree of information entropy is computed as:
Step 5: Calculating the weight of each indicator. Based on the redundancy degree dj, the weight of the j-th indicator relative to its corresponding dimension is calculated as:
Here, l represents the number of dimensions, and energy poverty includes three dimensions. ml denotes the number of sub-indicators under each dimension. The weight wj reflects the contribution of the j-th indicator to the composite score. The larger the weight, the greater the indicator’s influence on the composite score. The final computed score ranges between 0 and 1. Based on the research by Nussbaumer et al. (9), this study considers a score below 0.33 as indicating a state of energy poverty.
3.3 Construction of the ordered logit regression model
The dependent variable, self-rated health (Health), is ordinal in nature, but the exact differences between categories are unknown. Therefore, this study constructs an ordered logit model. A latent variable, Health*, is introduced to establish the relationship between observable explanatory variables and the observed ordinal dependent variable Health, which takes values from 0 to K. The latent health status of individual i at time t is linearly determined by Energypovertyit, Controlit, and two unobservable components, ui and εit:
The mapping between the latent variable and observed ordinal outcomes is governed by:
where denotes individualized thresholds. Following standard identification constraints, the boundary thresholds are set as and , with strictly monotonic thresholds satisfying:
The error term follows a logistic probability distribution characterized by:
The conditional probability of observing health category k for individual i at time t is derived as:
In Equation 7, represents energy poverty status, indicating whether an individual experiences energy poverty. denotes control variables included in the model. ui captures individual effects, and εit is the stochastic disturbance term. The parameter α measures the effect of energy poverty on health, while β represents the coefficients of the control variables. The model parameters are estimated using the maximum likelihood estimation method.
4 Results
4.1 Descriptive statistics
Overall, the mean health capital of the sample population is 2.80, indicating a moderate level of health. Approximately 41% of individuals are classified as experiencing energy poverty. The average sleep duration is 6.39 h, with a minimum of 3 h and a maximum of 11 h, highlighting significant variation in sleep patterns among respondents. Additionally, about 80% of the sample population reports having chronic diseases. The average age of the sample is 60.56 years, suggesting that the study primarily focuses on middle-aged and older adult individuals. Consumption levels exhibit considerable heterogeneity, with an average value of 6.58. Moreover, approximately 66% of the respondents engage in regular physical exercise, while 56% are male. The hospitalization rate remains relatively low, at 14% (Table 4).
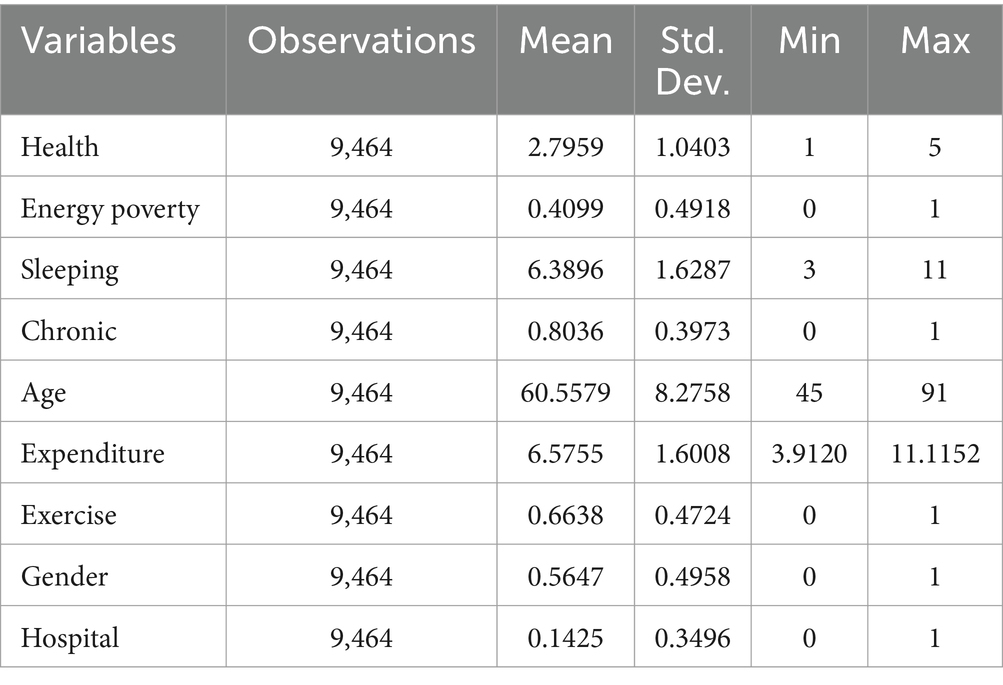
Table 4. Descriptive statistics of variables.
4.2 Estimation results of weights
Based on the entropy method, this study analyzes the weight distribution of the energy poverty indicator system to assess the relative importance of different dimensions.
Among the primary indicators, accessibility has a weight of 31.74%. This dimension comprises two secondary indicators: electricity access and clean fuel availability, with clean fuel carrying a significantly higher weight of 96.33%, compared to electricity at 3.67%. This suggests that the availability of clean fuel is the core issue in energy accessibility, likely due to its substantial impact on health, the environment, and energy efficiency. The low weight of electricity may indicate that its accessibility is already well-established under current energy supply conditions, whereas clean fuel still requires more extensive promotion and adoption.
Convenience holds the highest weight among the primary indicators at 36.83%, underscoring the importance of ease of energy access and use. Among its secondary indicators, piped gas accounts for 86.38%, significantly outweighing tap water at 13.62%. This discrepancy suggests that accessibility challenges associated with piped gas require more focused attention than those of tap water. The complexity and high costs associated with piped gas infrastructure, coupled with geographical and economic constraints, make it a critical factor in assessing energy convenience (Table 5).
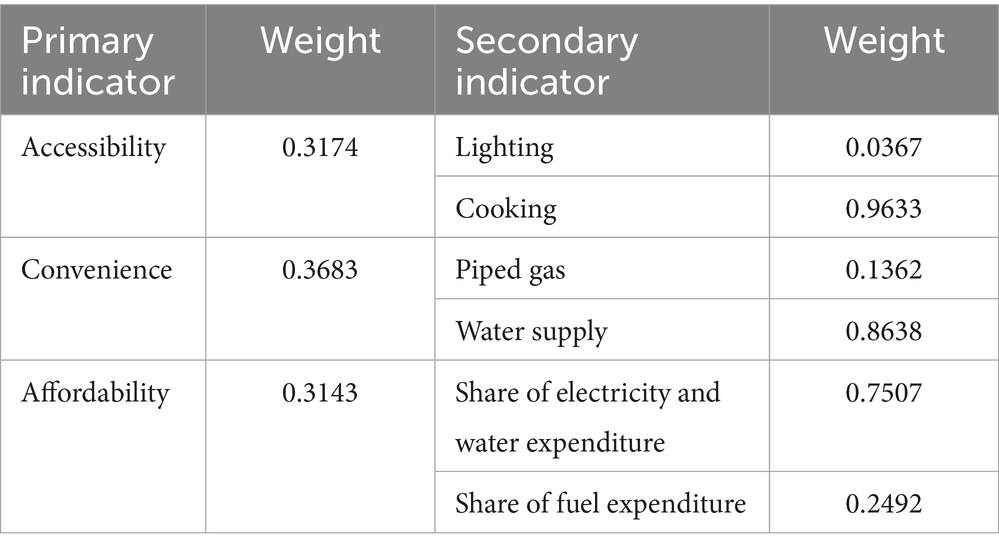
Table 5. Weight estimation results of MEPI.
The weight of the affordability indicator is 31.43%, closely aligning with that of accessibility. Among its secondary indicators, the proportion of water and electricity expenditure holds a weight of 75.07%, significantly higher than that of fuel expenditure at 24.92%. This distribution indicates that water and electricity costs play a more significant role in assessing energy poverty, likely because these are essential daily utilities whose price fluctuations have a more pronounced impact on household budgets. In contrast, fuel expenses constitute a smaller proportion of total energy costs and thus have a relatively lower impact.
4.3 The impact of energy poverty on health
4.3.1 Baseline regression
Based on the baseline regression results presented in Table 6, energy poverty has a significant negative impact on health. The regression coefficient is −0.143, and the effect is statistically significant at the 5% level (p < 0.05). This finding indicates that, holding other variables constant, energy poverty leads to a substantial decline in health levels. This reflects that energy deprivation restricts the fulfillment of basic living needs, thereby exerting adverse effects on physical health and overall quality of life.
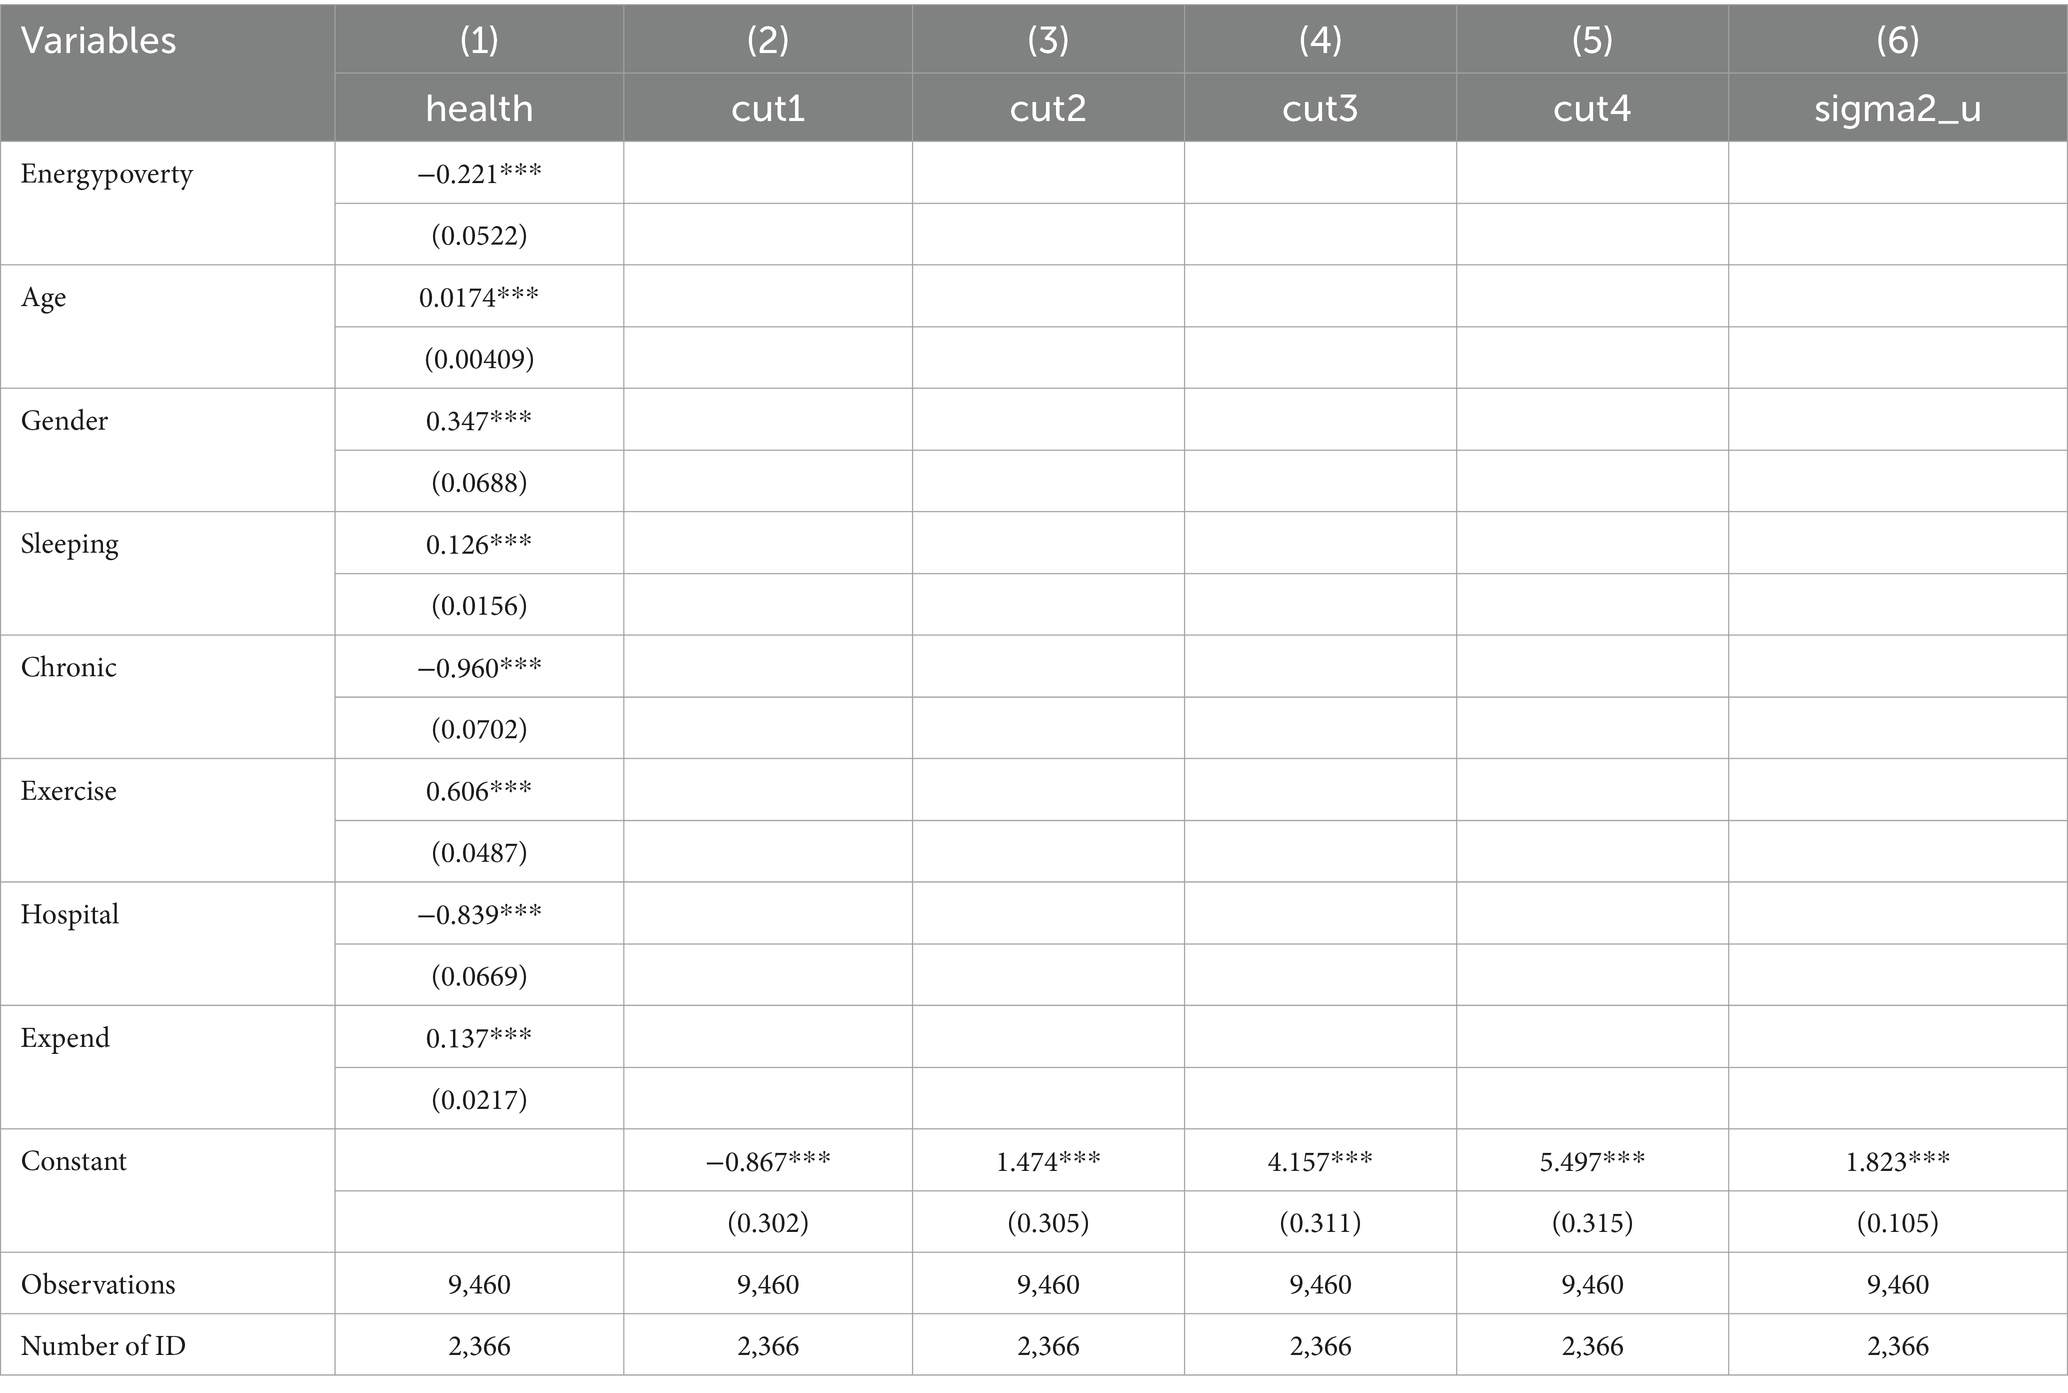
Table 6. Baseline regression results.
4.3.2 Endogeneity test
When exploring the impact of energy poverty on the health capital of middle-aged and older adult individuals in rural areas, endogeneity issues may lead to biased estimates, affecting the accuracy of the results. The primary sources of endogeneity include: omitted variable bias, where unobserved variables may simultaneously influence both energy poverty and health capital, leading to estimation bias; reverse causality, where individuals with poorer health are more likely to fall into energy poverty, for example, due to reduced labor capacity resulting from poor health, which subsequently lowers income levels and affects energy access; and measurement error, where the measurement of energy poverty may contain noise, leading to imprecise variable estimation and affecting the reliability of the results. This study addresses the endogeneity issues using instrumental variables and propensity score matching methods.
This study selects housing construction materials (HCM) as an instrumental variable. Although housing conditions may be associated with health to some extent, the construction materials themselves do not directly affect residents’ health status. Instead, they influence health indirectly by affecting energy accessibility. For example, houses with brick-and-concrete structures are more suitable for the installation of clean energy facilities (such as solar water heaters and natural gas pipelines), whereas wooden or adobe houses are more likely to rely on traditional biomass fuels. Additionally, more robust housing structures typically indicate higher construction costs, which are associated with a household’s long-term economic capacity. Since economic conditions influence access to energy, housing construction materials are correlated with household energy poverty. Housing materials are typically determined at the time of construction and do not change easily in response to variations in residents’ health status. Therefore, the selection of housing construction materials can be considered relatively exogenous. This study employs housing construction materials as an instrumental variable and applies the two-stage residual inclusion (2SRI) estimation method. The 2SRI approach is an extension of the two-stage least squares (2SLS) method and is widely used to address endogeneity issues in nonlinear models (43). Specifically, in the first stage, the endogenous variable is regressed on the instrumental variable and all exogenous variables. In the second stage, the residuals from the first-stage regression are included in the model before estimation.
The results of the instrumental variable regression indicate that in the first-stage regression (Column (1) of Table 7), housing construction materials have a significant impact on energy poverty, demonstrating strong relevance. The second-stage regression (Column (2) of Table 7) shows that the negative impact of energy poverty on health capital remains significant, further confirming that the effect of energy poverty on health capital is robust and has not been substantially biased due to endogeneity issues.
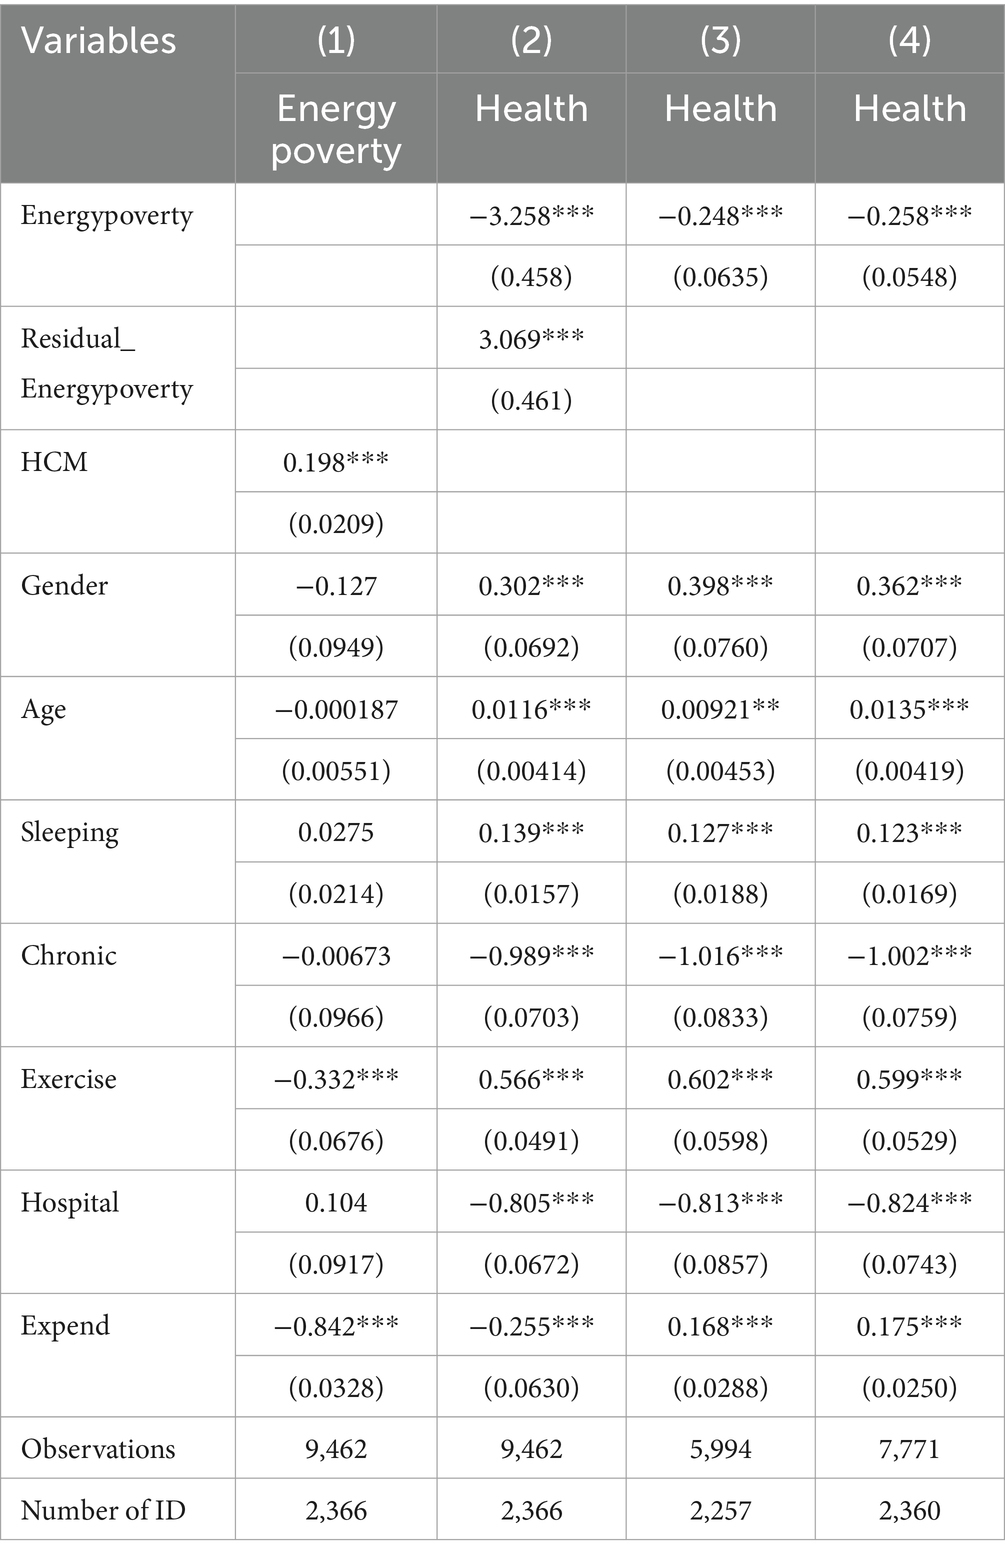
Table 7. Endogeneity test results.
Furthermore, the use of the propensity score matching (PSM) method helps mitigate selection bias caused by observable variables. The nearest-neighbor matching method is applied with a matching radius of 0.05, selecting the 1 and 3 nearest neighboring observations for matching. The results indicate that regardless of whether 1 or 3 neighboring observations are matched, the negative impact of energy poverty on health capital remains significant (Columns (3) and (4) of Table 7), reinforcing the robustness of the baseline regression results.
Although energy poverty may involve certain endogeneity concerns, validation through the 2SRI and PSM methods suggests that its negative effect on health capital remains consistent across different estimation approaches. Therefore, it can be concluded that endogeneity issues have not substantively affected the study’s conclusions.
4.3.3 Robustness test
In empirical research, robustness analysis is a crucial step in verifying the reliability of research conclusions. This study conducts robustness checks by separately replacing the independent and dependent variables to assess the negative impact of energy poverty on health. The objective is to eliminate potential biases arising from the measurement of energy poverty and the selection of specific health dimension variables, thereby ensuring the generalizability and reliability of the findings.
To achieve this, the study replaces the independent variable with equally weighted energy poverty (EWEP, instead of using the entropy method to assign weights to each dimension of MEPI, it applies an equally weighted approach) and uses three distinct health dimensions as alternative dependent variables: mental health (Mental), daily functional health (Instrumental Activities of Daily Living, IADL5), and physical health [diseases associated with energy poverty, Asthma (44)]. Table 8 presents the regression results of the robustness tests. As shown in the table, after replacing the independent variable, the regression coefficient of EWEP for health is −0.185, which is statistically significant at the 1% level (p < 0.01). Additionally, energy poverty exerts a significant negative impact across all three health dimensions: in the mental health dimension (Mental), the regression coefficient of energy poverty is −0.137, which is statistically significant at the 1% level (p < 0.01); in the daily functional health dimension (IADL5), the coefficient is −0.223, also significant at the 1% level (p < 0.01); in the physical health dimension (Asthma), the regression coefficient is −0.427, with significance at the 5% level (p < 0.05). These findings consistently indicate that energy poverty has a substantial and statistically significant negative effect across multiple dimensions of health. The robustness analysis reinforces the reliability of the main conclusion, confirming that energy poverty adversely affects both physical and mental health.

Table 8. Robustness tests results.
4.3.4 Mediation effect test
According to the theoretical analysis, one of the key pathways through which energy poverty affects residents’ health is by contributing to indoor pollution. Thus, the indoor environment serves as a crucial mediating mechanism in this relationship. Households experiencing energy poverty are more likely to rely on solid fuels (such as coal and firewood) for cooking and heating (45). The combustion of these fuels not only increases air pollution but also leads to the accumulation of dust, soot, and grease indoors, thereby deteriorating the overall living environment. Additionally, energy-poor households may lack sufficient resources to maintain household hygiene, such as purchasing cleaning equipment or improving ventilation and smoke exhaust systems, further reducing indoor cleanliness. This study further investigates the mediating role of the indoor environment in the relationship between energy poverty and health capital. The regression results in Table 9 indicate a significant negative relationship between energy poverty and indoor cleanliness, suggesting that energy poverty leads to poorer indoor environmental conditions. Given that a better indoor environment has a positive impact on health, it can be concluded that part of the negative effect of energy poverty on rural residents’ health capital is realized through the deterioration of the indoor environment.
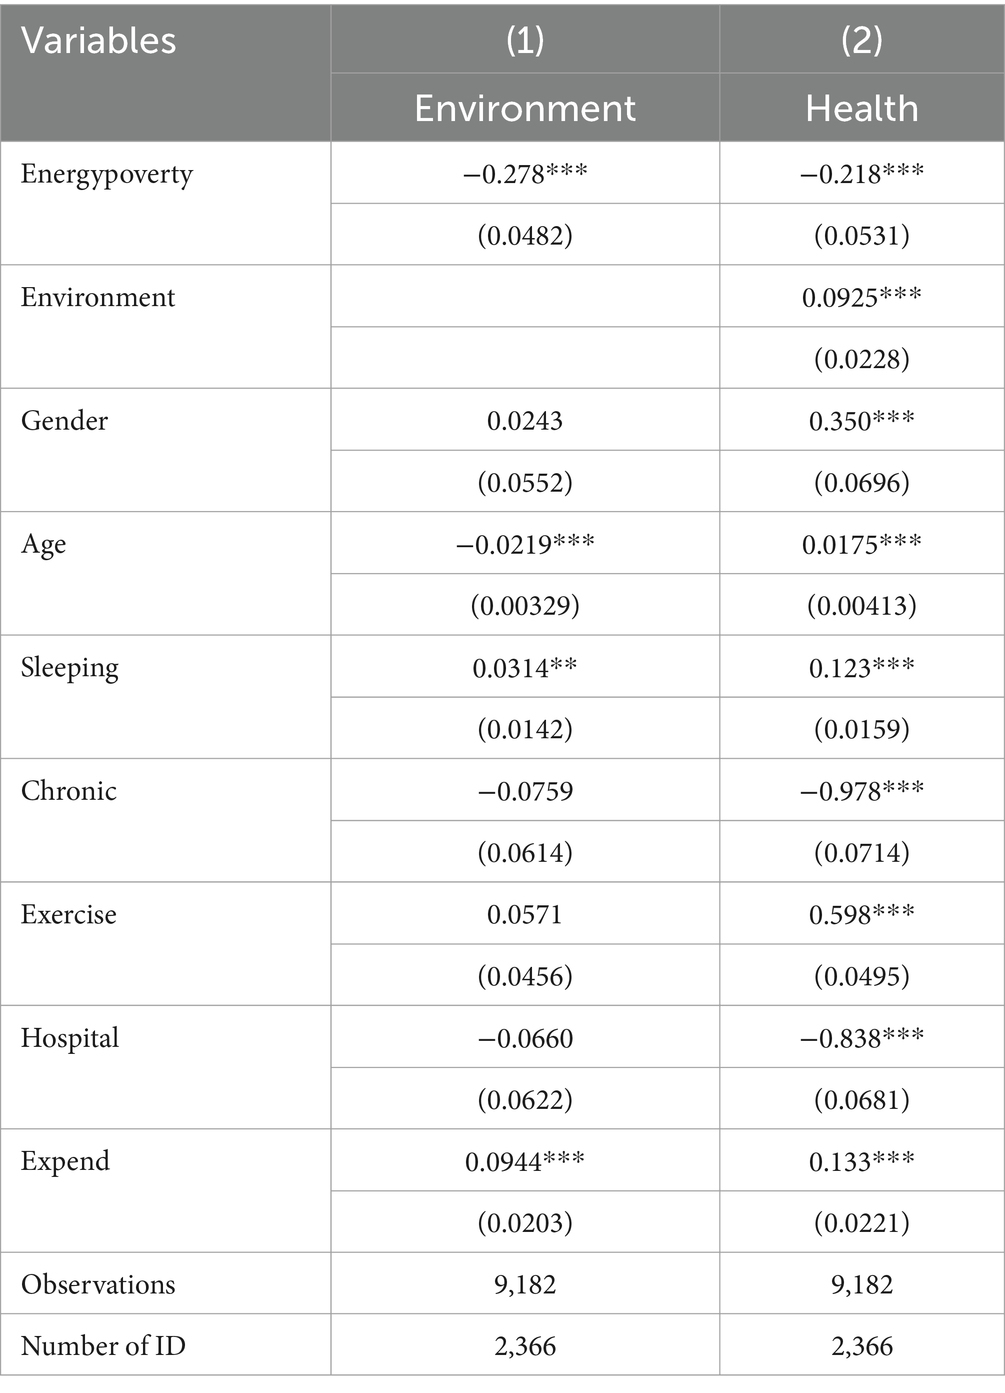
Table 9. Mediation effect tests results.
4.4 The heterogeneous effects of energy poverty
To further investigate the heterogeneity in the impact of energy poverty on health, this study examines how the effects vary based on education level and geographical region. And the regression results are presented in Table 10.
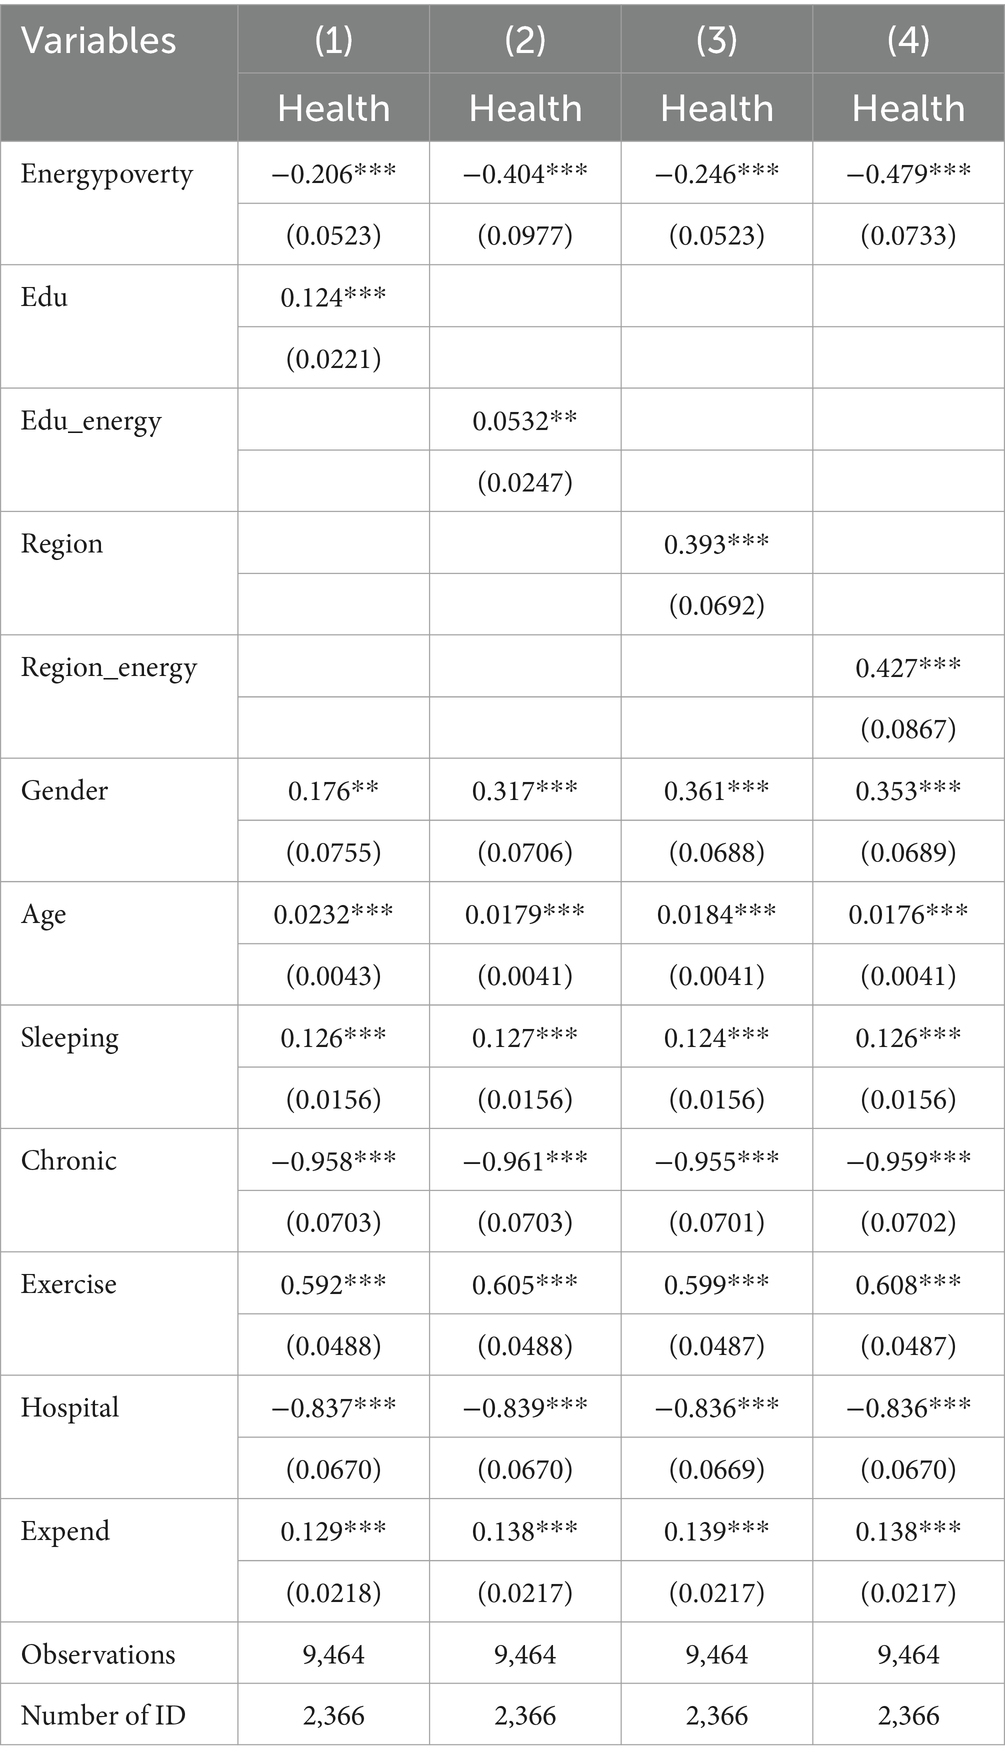
Table 10. Heterogeneous effect tests results.
The analysis of educational heterogeneity indicates that the regression coefficient of education level (Edu) is 0.124, which is statistically significant at the 1% level (p < 0.01). This suggests that individuals with higher education levels tend to have better health outcomes. Furthermore, the interaction term between energy poverty and education (Edu_energy) has a coefficient of 0.0532, which is significant at the 5% level (p < 0.05). This finding implies that education can effectively mitigate the negative impact of energy poverty on health.
The analysis of regional heterogeneity demonstrates that the regression coefficient of the regional variable (Region) is 0.393, which is significant at the 1% level (p < 0.01), indicating substantial differences in individual health status across different regions. Moreover, the interaction term between region and energy poverty (Region_energy) has a coefficient of 0.427, also significant at the 1% level (p < 0.01), suggesting that the effect of energy poverty on health varies across regions.
5 Conclusion and discussion
5.1 Conclusion
This study analyzes the impact of energy poverty on the health capital of middle-aged and older adult rural residents in China from both theoretical and empirical perspectives. Utilizing data from the China Health and Retirement Longitudinal Study (CHARLS), the study measures energy poverty based on a multidimensional energy poverty index and examines its effect on health using an ordered Logit model. Additionally, it explores the heterogeneous effects of energy poverty by education level and regional differences. The main findings are as follows:
First, energy poverty has a significant negative impact on the health capital of rural middle-aged and older adult residents. Robustness tests reveal that energy poverty exerts significant negative effects across various dimensions of health, including mental health, physical health, and daily living capacity.
Second, individuals with lower education levels are more significantly affected by energy poverty, suggesting that higher education levels can mitigate the adverse health effects of energy poverty.
Third, the negative effect of energy poverty on rural residents’ health is more severe in southern regions compared to northern regions. This discrepancy is likely due to the lack of centralized heating in southern rural areas, where energy shortages disproportionately impact daily life, especially for the older adult in cold and damp winters.
5.2 Discussion
5.2.1 Contributions
Our study aligns with previous research indicating that energy poverty is a major determinant of health outcomes, particularly in vulnerable populations. For instance, Kose (4) found that energy poverty in Turkey significantly worsens self-reported health outcomes. Similarly, Ma and Nie (45) explored the negative impact of energy deprivation on physical and mental health based on data from China. Our findings are consistent with their research, indicating that in rural China, energy poverty is associated with lower self-rated health (SRH) among middle-aged and older adult individuals. Furthermore, our study expands upon previous research by demonstrating that energy poverty has a heterogeneous impact across different demographic and geographic groups. While previous studies examined the adverse effects of energy poverty on health at a national level, our study reveals that individuals with lower education levels are disproportionately affected. This is consistent with the Efficient Producer Hypothesis, which suggests that individuals with higher education levels are more effective at producing health capital. Additionally, our regional analysis provides novel insights. Unlike previous studies that focused on northern China’s heating challenges, our study highlights that the adverse health effects of energy poverty are more pronounced in the south. This contradicts the common perception that colder northern regions experience the most severe energy poverty-related health risks.
5.2.2 Policy recommendations
Based on our findings, we propose the following policy recommendations:
Expansion of clean energy access: Given that reliance on traditional biomass fuels significantly contributes to health deterioration, policymakers should prioritize the expansion of clean energy sources, such as natural gas and renewable energy, in rural areas. Subsidizing clean cooking fuels and improving infrastructure for energy access could help mitigate the health risks associated with energy poverty.
Education and awareness campaigns: Our findings suggest that individuals with higher education levels are better equipped to mitigate the adverse effects of energy poverty. Therefore, policies that promote education and awareness regarding energy-efficient practices and health management should be implemented. Programs that provide energy literacy training, particularly for older adults, could enhance their ability to adopt healthier energy usage behaviors.
Targeted regional policies: The regional disparities identified in our study indicate the need for region-specific energy policies. In northern China, continued investments in household heating systems and insulation could help alleviate energy poverty. In the south, where energy poverty is more strongly linked to poor health outcomes, policymakers should focus on improving access to affordable heating solutions and reducing energy costs for vulnerable populations.
5.2.3 Limitations
Future research should further explore the causal mechanisms linking energy poverty and health, such as the persistence of energy poverty over time and its influence on the accumulation of health capital from a dynamic perspective. Additionally, interdisciplinary collaboration should be strengthened, integrating insights from health economics, environmental science, and social policy to examine the intersectionality between energy poverty and broader socioeconomic challenges. Such approaches will contribute to more comprehensive and scientifically informed policy designs aimed at mitigating energy poverty and its associated health risks.
Data availability statement
The original contributions presented in the study are included in the article/supplementary material, further inquiries can be directed to the corresponding author.
Author contributions
CY: Conceptualization, Funding acquisition, Supervision, Writing – review & editing. TL: Formal analysis, Software, Writing – original draft, Writing – review & editing. QW: Methodology, Writing – review & editing.
Funding
The author(s) declare that financial support was received for the research and/or publication of this article. This study was supported by the Natural Science Foundation of Sichuan Province, Grant/Award Numbers: 2023NSFSC1043, 2023NSFSC1055, 2024NSFSC1066; the 2022 National Social Science Foundation Major Project, Research on the High-Quality Development Path of the Natural Gas Industry Driven by the Energy Revolution, Grant/Award Number: 22&ZD105; and the Southwest Petroleum University Humanities Special Fund for Distinguished Talents Program, Grant/Award Number: 2022-2023RW001.
Acknowledgments
We thank the National Development Research Institute of Peking University and the China Social Science Survey Center of Peking University for providing the CHARLS data.
Conflict of interest
The authors declare that the research was conducted in the absence of any commercial or financial relationships that could be construed as a potential conflict of interest.
Generative AI statement
The authors declare that no Gen AI was used in the creation of this manuscript.
Publisher’s note
All claims expressed in this article are solely those of the authors and do not necessarily represent those of their affiliated organizations, or those of the publisher, the editors and the reviewers. Any product that may be evaluated in this article, or claim that may be made by its manufacturer, is not guaranteed or endorsed by the publisher.
References
2. Churchill, SA, and Smyth, R. Energy poverty and health: panel data evidence from Australia. Energy Econ. (2021) 97:105219. doi: 10.1016/j.eneco.2021.105219
3. Jessel, S, Sawyer, S, and Hernández, D. Energy, poverty, and health in climate change: a comprehensive review of an emerging literature. Front Public Health. (2019) 7:357. doi: 10.3389/fpubh.2019.00357
4. Kose, T. Energy poverty and health: the Turkish case. Energy Sources B: Econ Plan Policy. (2019) 14:201–13. doi: 10.1080/15567249.2019.1653406
5. Primc, K, Dominko, M, and Slabe-Erker, R. 30 years of energy and fuel poverty research: a retrospective analysis and future trends. J Clean Prod. (2021) 301:127003. doi: 10.1016/j.jclepro.2021.127003
6. Thompson, G, and Bazilian, M. Democratization, energy poverty, and the pursuit of symmetry. Global Pol. (2014) 5:127–31. doi: 10.1111/1758-5899.12103
7. Sovacool, BK. The political economy of energy poverty: a review of key challenges. Energy Sustain Dev. (2012) 16:272–82. doi: 10.1016/j.esd.2012.05.006
8. Sadath, AC, and Acharya, RH. Assessing the extent and intensity of energy poverty using multidimensional energy poverty index: empirical evidence from households in India. Energy Policy. (2017) 102:540–50. doi: 10.1016/j.enpol.2016.12.056
9. Nussbaumer, P, Bazilian, M, and Modi, V. Measuring energy poverty: focusing on what matters. Renew Sust Energ Rev. (2012) 16:231–43. doi: 10.1016/j.rser.2011.07.150
10. Day, R, Walker, G, and Simcock, N. Conceptualising energy use and energy poverty using a capabilities framework. Energy Policy. (2016) 93:255–64. doi: 10.1016/j.enpol.2016.03.019
11. González-Eguino, M. Energy poverty: an overview. Renew Sust Energ Rev. (2015) 47:377–85. doi: 10.1016/j.rser.2015.03.013
12. Liao, H, Tang, X, and Wei, Y. Current situation and prospects of energy poverty research. China Soft Sci. (2015) 8:58–71. doi: 10.3969/j.issn.1002-9753.2015.08.007
13. Yang, J, and Zhang, Y. Identification and measurement of China's energy poverty in the new development stage: an empirical study based on CFPS. Study Pract. (2023) 2:82–90. doi: 10.19624/j.cnki.cn42-1005/c.2023.02.014
14. Sy, SA, and Mokaddem, L. Energy poverty in developing countries: a review of the concept and its measurements. Energy Res Soc Sci. (2022) 89:102562. doi: 10.1016/j.erss.2022.102562
15. Parikh, KS. Energy use for subsistence and prospects for development. Energy. (1978) 3:631–7. doi: 10.1016/0360-5442(78)90078-6
16. Leach, G. Household energy in South Asia. Biomass. (1987) 12:155–84. doi: 10.1016/0144-4565(87)90034-5
17. OECD/European Union/EC-JRC. Handbook on constructing composite indicators: methodology and user guide. Paris: OECD Publishing (2008). doi: 10.1787/9789264043466-en
18. Mendoza, CB, Cayonte, DDD, Leabres, MS, and Manaligod, LRA. Understanding multidimensional energy poverty in the Philippines. Energy Policy. (2019) 133:110886. doi: 10.1016/j.enpol.2019.110886
19. Sokołowski, J, Lewandowski, P, Kiełczewska, A, and Bouzarovski, S. A multidimensional index to measure energy poverty: the polish case. Energy Sources B: Econ Plan Policy. (2020) 15:92–112. doi: 10.1080/15567249.2020.1742817
20. He, K, Zhu, X, and Li, F. Accumulating carbon to form ‘energy’: how can carbon trading policy alleviate rural energy poverty? J Manag World. (2023) 39:122–44. doi: 10.19744/j.cnki.11-1235/f.2023.0143
21. Xie, E. Economic impacts of energy poverty on rural households in China. J Huazhong Agric Univ (Soc Sci Ed). (2021) no. 1:99–108, 178–179. doi: 10.13300/j.cnki.hnwkxb.2021.01.012
22. Zhao, J, Shahbaz, M, and Dong, X. Assessing energy poverty and its effect on CO₂ emissions: the case of China. Energy Econ. (2021) 97:105191. doi: 10.1016/j.eneco.2021.105191
23. Wang, Y, and Lin, B. Can energy poverty be alleviated by targeting the low income? Constructing a multidimensional energy poverty index in China. Appl Energy. (2022) 321:119374. doi: 10.1016/j.apenergy.2022.119374
24. Pan, L, Biru, A, and Lettu, S. Energy poverty and public health: global evidence. Energy Econ. (2021) 101:105423. doi: 10.1016/j.eneco.2021.105423
25. Fang, L, and Nan, L. Can the middle-aged and the elderly achieve their health improvement from domestic energy consumption structure optimization in rural China. China Popul Resour Environ. (2019) 29:40–9.
26. Njiru, CW, and Letema, SC. Energy poverty and its implication on standard of living in Kirinyaga, Kenya. J Energy. (2018) 2018:1–12. doi: 10.1155/2018/3196567
27. Oum, S. Energy poverty in the Lao PDR and its impacts on education and health. Energy Policy. (2019) 132:247–53. doi: 10.1016/j.enpol.2019.05.030
28. Banerjee, R, Mishra, V, and Maruta, AA. Energy poverty, health and education outcomes: evidence from the developing world. Energy Econ. (2021) 101:105447. doi: 10.1016/j.eneco.2021.105447
29. Zhang, Z, Shu, H, Yi, H, and Wang, X. Household multidimensional energy poverty and its impacts on physical and mental health. Energy Policy. (2021) 156:112381. doi: 10.1016/j.enpol.2021.112381
30. Xu, W, Xie, B, Lou, B, Wang, W, and Wang, Y. Assessing the effect of energy poverty on the mental and physical health in China—evidence from China family panel studies. Front Energy Res. (2022) 10:944415. doi: 10.3389/fenrg.2022.944415
31. Zhang, J, He, Y, and Zhang, J. Energy poverty and depression in rural China: evidence from the quantile regression approach. Int J Environ Res Public Health. (2022) 19:1006. doi: 10.3390/ijerph19021006
32. Costa-Campi, MT, Jové-Llopis, E, and Trujillo-Baute, E. Energy poverty in Spain: an income approach analysis. Energy Sources B: Econ Plan Policy. (2019) 14:327–40. doi: 10.1080/15567249.2019.1710624
33. Grossman, M. On the concept of health capital and the demand for health. J Polit Econ. (1972) 80:223–55. doi: 10.1086/259880
35. Lleras-Muney, A. The relationship between education and adult mortality in the United States. Rev Econ Stud. (2005) 72:189–221. doi: 10.1111/0034-6527.00329
36. Zhao, M, Zhou, X, and Kaidi, X. The impact of internet use on labor participation of young-old people: from the perspective of enhancing human capital of older people. Popul Dev. (2024) 30:48–60, 157.
37. Wuorela, M, Lavonius, S, Salminen, M, Vahlberg, T, Viitanen, M, and Viikari, L. Self-rated health and objective health status as predictors of all-cause mortality among older people: a prospective study with a 5-, 10-, and 27-year follow-up. BMC Geriatr. (2020) 20:120. doi: 10.1186/s12877-020-01516-9
38. Jylhä, M. What is self-rated health and why does it predict mortality? Towards a unified conceptual model. Soc Sci Med. (2009) 69:307–16. doi: 10.1016/j.socscimed.2009.05.013
39. Zhang, K, Luo, D, Chen, Z, Yang, P, and Xiao, S. A longitudinal study on self-rated health status and its influencing factors among medical personnel. J Central South Univ (Med Sci). (2024) 49:1456–68. doi: 10.11817/j.issn.1672-7347.2024.240111
40. Gafa, DW, and Egbendewe, AYG. Energy poverty in rural West Africa and its determinants: evidence from Senegal and Togo. Energy Policy. (2021) 156:112476. doi: 10.1016/j.enpol.2021.112476
41. Zhou, Q, Tian, S, Wang, M, and Pan, J. Theoretical and empirical study on the impact of rural social pension insurance on residents’ health behaviors. Insur Stud. (2024) 11:96–112. doi: 10.13497/j.cnki.is.2024.11.008
42. Wang, Y, and Luo, N. Air pollution, health depreciation and medical costs: research based on the three perspectives of physical health, mental health and social adaptability. Econ Res J. (2020) 55:80–97.
43. Terza, JV, Basu, A, and Rathouz, PJ. Two-stage residual inclusion estimation: addressing endogeneity in health econometric modeling. J Health Econ. (2008) 27:531–43. doi: 10.1016/j.jhealeco.2007.09.009
44. Liu, H, Chen, J, Peng, Q, and Li, J. Environmental, health, and low-carbon benefits and economic costs of household energy transition in china. Modern Econ Sci. (2024) 46:88–103. doi: 10.20069/j.cnki.DJKX.202401007
Keywords: energy poverty, health capital, rural China, aging population, ordered logit model
Citation: Yu C, Li T and Wan Q (2025) The impact of energy poverty on the health capital of middle-aged and older adult residents in rural China. Front. Public Health. 13:1580069. doi: 10.3389/fpubh.2025.1580069
Edited by:
Shihu Zhong, Shanghai National Accounting Institute, ChinaReviewed by:
Soufiane Boukarta, University of Blida, AlgeriaMack Shelley, Iowa State University, United States
Lanfang Cao, Central South University Forestry and Technology, China
Copyright © 2025 Yu, Li and Wan. This is an open-access article distributed under the terms of the Creative Commons Attribution License (CC BY). The use, distribution or reproduction in other forums is permitted, provided the original author(s) and the copyright owner(s) are credited and that the original publication in this journal is cited, in accordance with accepted academic practice. No use, distribution or reproduction is permitted which does not comply with these terms.
*Correspondence: Tianrun Li, dGlhbnJ1bi5sQGZveG1haWwuY29t