 Yilin Zhou
 Dan Deng
- Department of Health Statistics, College of Public Health, Chongqing Medical University, Chongqing, China
Objective: Using an urban area in southwest China as a case study, this research investigates and analyzes the supply and demand of community-based older adult care services to provide a basis for optimizing the older adult care service system.
Methods: A two-stage sampling method was employed to select older participants. Questionnaires, designed based on the Kano model, were administered to participants, and semi-structured interviews were conducted with community senior center managers and services users. The Kano model, Better-Worse index analysis and Analytic Hierarchy Process (Kano-BW-AHP) was used for quantitative analysis, while the two-step cluster analysis was employed for user profiles. Qualitative analysis was based on interview data.
Results: A total of 259 questionnaires and 16 interview reports were collected. The Kano analysis identified 34 community older adult services, with most categorized as attractive or indifferent attributes, and only emergency assistance was identified as a one-dimensional attribute. The BW analysis revealed 3 must-be, 9 attractive, and 1 one-dimensional service. The top five services, based on the Kano-BW-AHP model, were contact with friends and relatives, emergency assistance, regular medical checkups, older adult canteen and meal delivery, and special policy consultation. A comparison between those who chose community-based older adult care and those who did not showed statistically significant differences in six variables: age, education, employee medical insurance, a regular pension, living status, and services awareness (p < 0.05). Cluster analysis of participants who chose community older adult care revealed two user profiles: 51 (73.9%) were urban, high-educated users with strong consumption willingness; 18 (26.1%) were rural, low-education individuals with limited income. Community older adult care centers face issues included limited service variety, inadequate beds, insufficient staffing, lack of funding, and no follow-up plans. Additionally, the older adult displayed limited understanding of care services, dissatisfaction with catering, and demand for spiritual support.
Conclusion: The community-based older adult care system shows a structural imbalance between supply and demand, particularly in terms of service quantity, quality, and efficiency. The findings provides a reference for policy formulation and the improvement of community-based older adult care services.
1 Introduction
With improvements in healthcare standards, global life expectancy continues to rise (1). Concurrently, the declining fertility rates have become a common trend in global population development (2), leading to the global issue of aging. According to the United Nations’ World Population Prospects 2022, the proportion of the global population aged 65 and older will rise from 10% in 2022 to 16% by 2050. In China, the number of individuals aged 65 and older reached 209.78 million by the end of 2022, accounting for 14.9% of the total population, and is projected to reach 26.1% by 2050 (3), nearing developed-country levels. However, China’s aging process, amid ongoing modernization, reflects both global patterns and distinct national challenges, such as “growing old before getting rich (4)“and “aging before preparation (5)“in certain regions. Consequently, China must adapt its older adult care model rather than simply replicate those of developed countries.
China’s older adult care model comprises home-based, community-based, and institutional care. The key objective of reforming and developing older adult care services is to coordinate these three service forms to create an optimal system (6). Yer the evolving demand structure for older adult exposes imbalances and inadequacies of older adult care service systems: the rise of empty-nest households have rendered home-based care insufficient in meeting the high-quality needs of the older adult, while public health emergencies have highlighted the limitations of institutional care (7). Although studies suggest that the older adult continue to prioritize home care (8–10), social and cognitive factors make institutional care appealing compared to the community -based care (11), revealing a mismatch with service models such as Shanghai’s “90-7-3” and Beijing’s “90-6-4” patterns (12).
In this context, community-based older adult care, with government-enterprise cooperation as its primary operational model, combines the geographical advantages of home care with the specialization of institutional care. As such, it aligns more closely with China’s national conditions (13). Although increasingly recognized as a critical research area, studies on community-based older adult care remain limited (14). Most studies analyze the issue from either the demand or supply side, often from a single perspective (15). In Chongqing, the municipality with the highest aging rate in western China, research on community care for the older adult is limited, typically confined to single district or street (16, 17), with most studies relying on descriptive analysis or traditional qualitative methods (18, 19). Therefore, accurately identifying service demands and strengthening community-based service provision is crucial.
The Kano model, proposed by Professor Noriaki Kano in 1984 (20), explains the non-linear correlation between a product’s performance and user satisfaction. It classifies product attributes into five categories: Attractive, One-dimensional, Must-be, Indifferent and Reverse attributes (21, 22). The Kano model is a simple and effective tool, widely applied across industries for demand classification and prioritization (23–25). Nevertheless, its application in older adult care remains limited, mainly focusing on care demand analysis and application design (26, 27). Given potential inaccuracies in older adult feedback due to cognitive and expression limitations, this study combines hierarchical analysis process with opinions of experts, community-based older adult service managers, grassroots workers and researchers. This approach effectively addresses the limitations of the Kano model in the context of older adult care services. Furthermore, the study incorporates the average satisfaction coefficient as a correction factor in the hierarchical analysis process, reducing the qualitative biases and enhancing the model robustness.
This study is conducted from both supply and demand perspectives, combining quantitative and qualitative analysis to explore supply and demand status of community-based older adult care. The findings aim to provide a decision-making basis for government departments in optimizing the older adult care service system, which will have a profound positive impact on alleviating the imbalance in older adult care service system, improving the well-being of the older adults, and addressing the global aging challenge.
2 Materials and methods
2.1 Participants
From December 2023 to June 2024, participants were recruited using two-stage sampling in Chongqing, China. In the first stage, one community older adult care center from each of the five-leaf, four-leaf, and three-leaf categories was randomly selected, along with an additional institution to ensure sample representativeness. In the second stage, convenience sampling was employed to conduct an intercept survey of community-dwelling older adults in public spaces within the community, while cluster sampling was used for surveys of older adult residents in care centers. Managers and service users from these three centers were interviewed. A total of 261 questionnaires were received. Two extreme value questionnaires, where all responses were “it does not matter” were excluded. Ultimately, 16 interviews and 259 valid questionnaires were collected, with a 99.2% effective response rate. Inclusion criteria for the older adult participants were: I. ≥ 55 years old; II. ability to answer independently and provide informed consent. Exclusion criteria were: (1) Communication or cognitive impairments; (2) Refusal to participate.
2.2 Methods
2.2.1 Questionnaires
The questionnaire comprised two sections: the first part addressed basic demographic information, economic status, and health condition. The second part focused on the supply and demand of community-based older adult care, including understanding of this model, willingness to pay, the preferred care model, and the demand scale for community-based older adult care services based on the Kano model. After a comprehensive review of relevant policies and literature, the five-point Likert scale was developed based on expert consultation and a pre-survey. Service dimensions included life care, medical care, spiritual comfort, culture and entertainment, safety and security, and legal and policy services, with a total of 34 items listed in Table 1. Each item included both positive and negative questions: “How would you feel if this service was provided?” “How would you feel if this service was not offered?” Responses were categorized as “satisfied,” “as it should be,” “it does not matter,” “tolerable,” and “not satisfied.” Reliability and validity was strong, with Cronbach’s alpha for the positive and negative questions were 0.941 and 0.950, respectively, with KMO values of 0.932 and 0.910, respectively, and p<0.001.
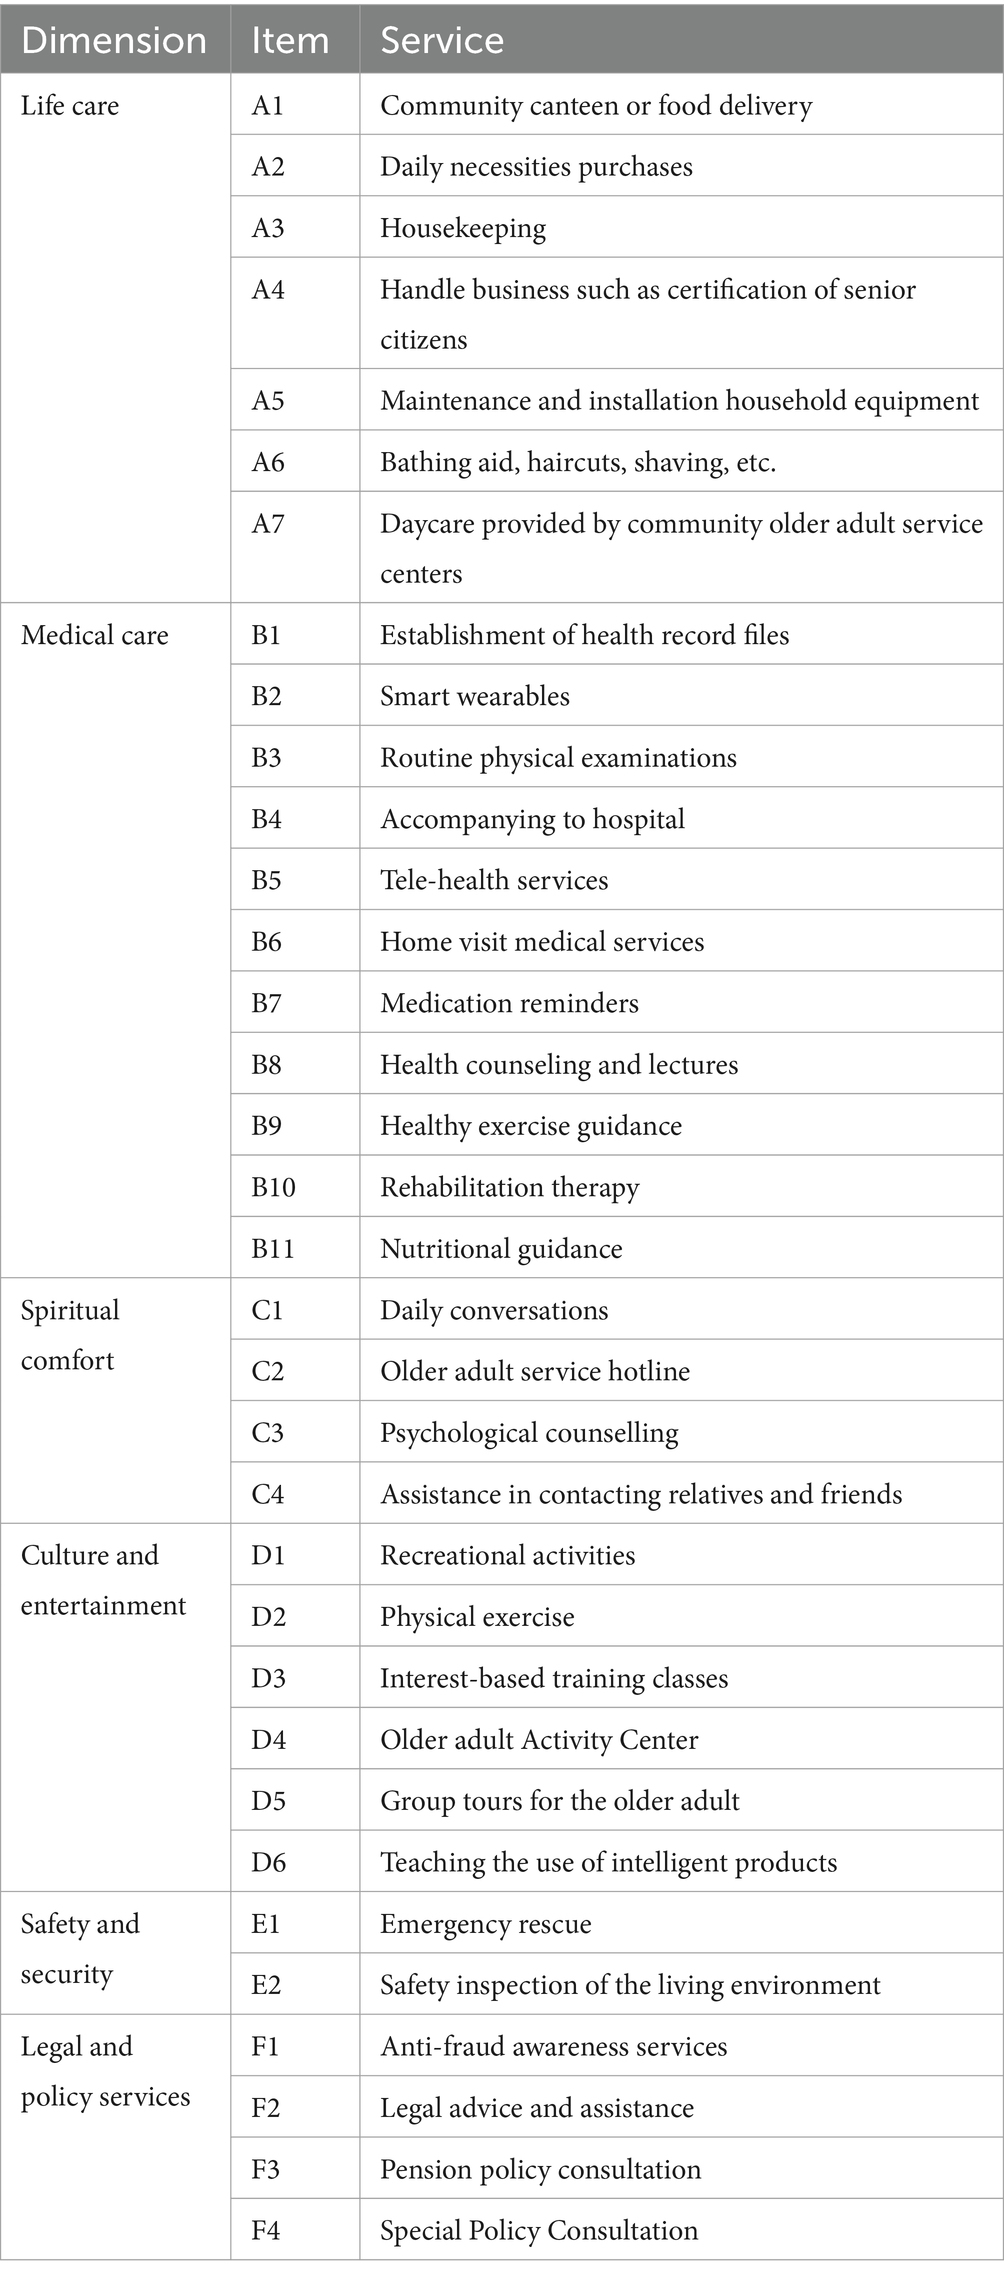
Table 1. Service dimensions and items.
2.2.2 Kano model
Traditional satisfaction theory posits a linear relationship between product functionality and satisfaction. However, Professor Noriaki Kano challenged this view, proposing the Kano model, inspired by the two-factor theory. According to the model, users have varying levels of demand for product quality, and different elements contribute differently to improving user satisfaction. As shown in Figure 1, must-be attributes do not increase satisfaction when provided, but satisfaction decreases if not provided. Attractive attributes increase satisfaction when provided but do not decrease satisfaction if not provided. One-dimensional attributes have a linear relationship, where satisfaction increases when the attribute performs well, while the satisfaction decreases when the attribute does not perform well. Indifference attributes do not affect the user satisfaction. Reverse attributes lead to a strong user dissatisfaction and should not be provided. Additionally, Questionable attributes, indicating erroneous responses, should be excluded.
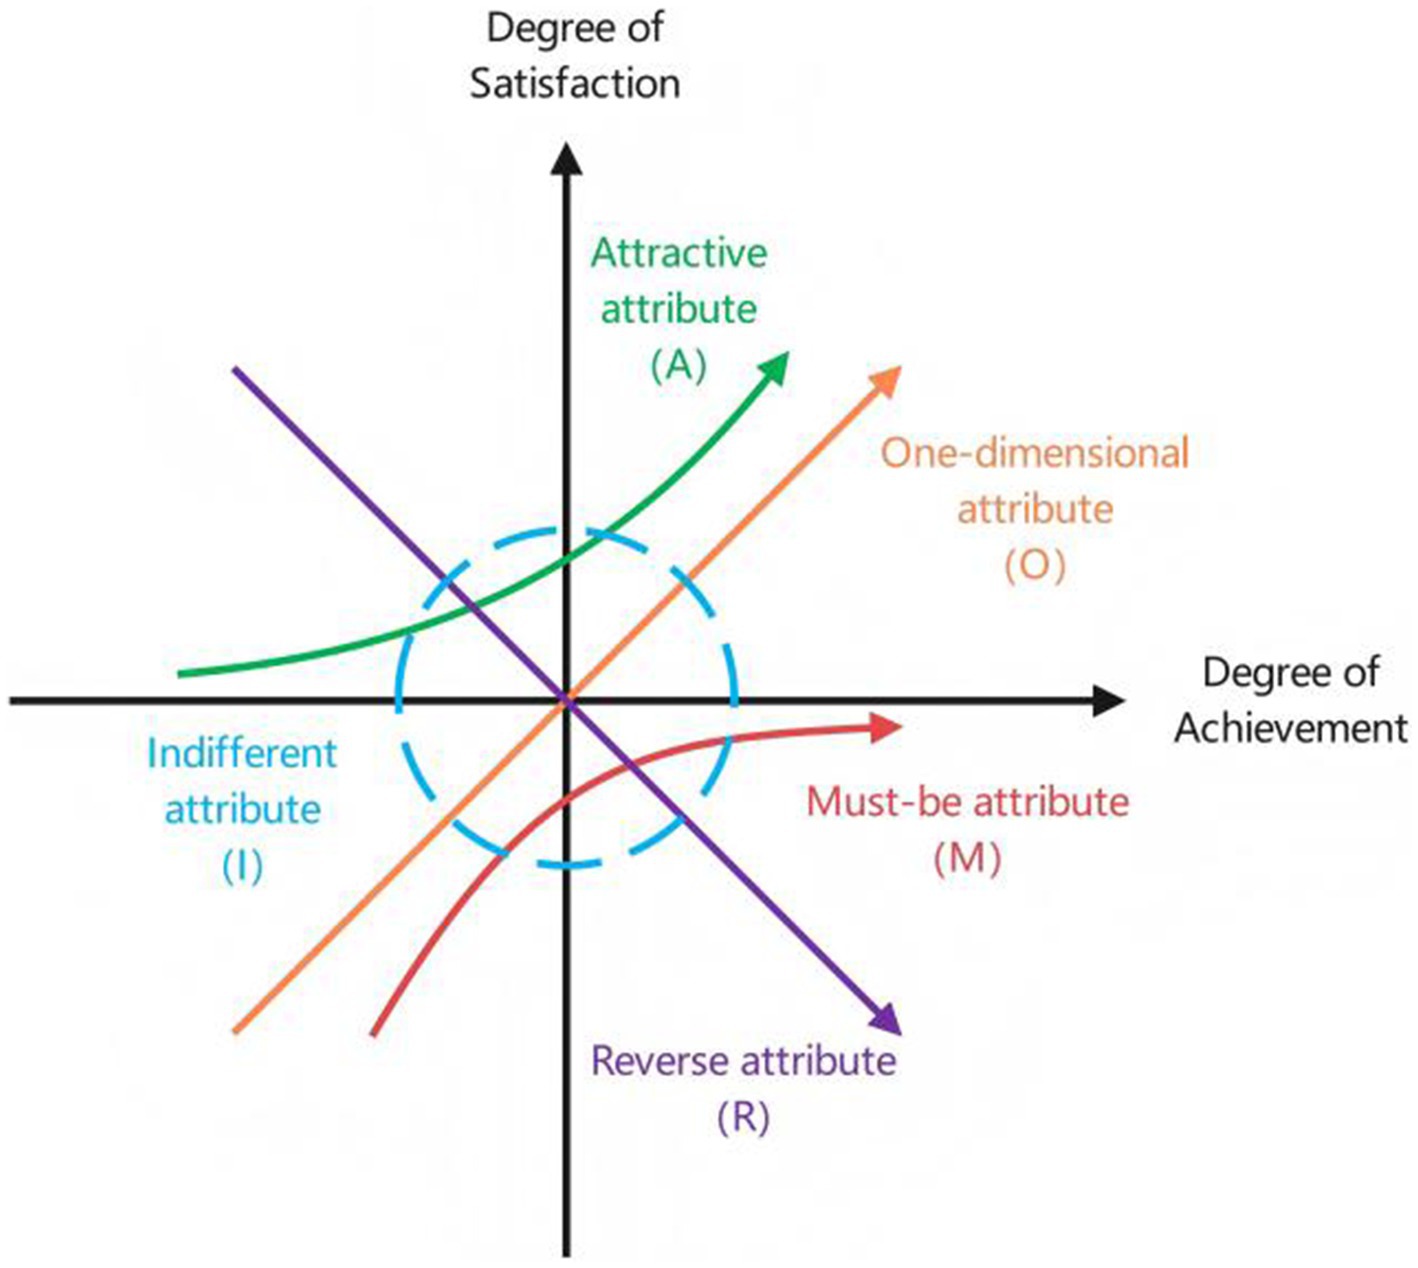
Figure 1. Kano model.
2.2.3 Better-Worse (BW) index analysis
As shown in Table 2, users’ responses to positive and negative questions yield 25 possible outcomes, corresponding to different attributes of the Kano model. After determining demand attributes, the Better-Worse index can be calculated.
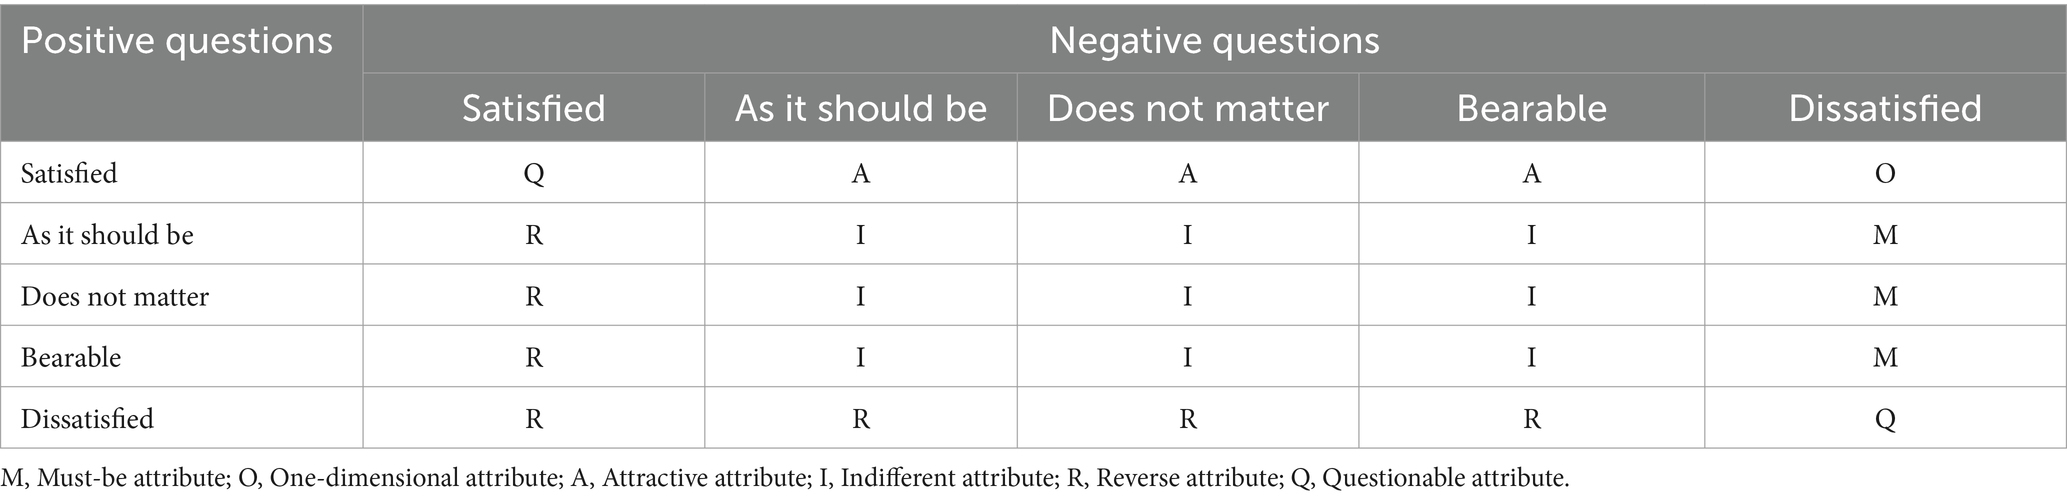
Table 2. Kano model attribute classification table.
The Better index is the satisfaction index (SI), and calculated as: Equation 1, which represents the increase in user satisfaction after the service is provided. The closer its value is to 1, the better the satisfaction improvement. The Worse index is the dissatisfaction index (DI), and calculated as: Equation 2, which represents the increase in dissatisfaction when the service is not provided. The closer its absolute value is to 1, the stronger the dissatisfaction effect. The average satisfaction coefficient (ASC) is the arithmetic mean of the absolute values of both indices, and calculated as: Equation 3.
2.2.4 Analytic hierarchy process (AHP)
AHP is a hierarchical weighted decision analysis method proposed by Thomas L. Saaty. It treats the decision-making problem as a system, decomposes the objectives into multiple criteria, and then into multiple scenarios, thereby constructing a hierarchical structure model. Subsequently, indicators are compared until a complete judgment matrix is formed (Equation 4). In this study, the 1–5 scale method was used to facilitate understanding and judgment by the older adult.
Then, the weight vectors of the matrices were computed using the sum-product method for hierarchical single sorting (Equations 5, 6), and a consistency test was conducted (Equations 7–9).
When the consistency ratio is less than 0.1, the degree of consistency in the judgment matrix is considered acceptable; otherwise, the judgment matrix should be considered.
Finally, a hierarchical ranking can be performed and the decision result can be outputted. In this study, the correction coefficients were constructed using normalized ASC to obtain the corrected comprehensive weights (Equation 10).
2.3 Statistics analysis
Data were analyzed using IBM SPSS 26.0. Quantitative variables that met normality assumptions were described as mean ± standard deviation, and t-tests were used for between-group comparisons. Frequency and percentages were used to describe categorical and ordinal variables, and chi-square tests and Mann–Whitney U tests were applied for between-group comparisons. The Kano-BW-AHP coupling model was employed to categorize and prioritize the attributes of services. The two-step clustering method was utilized to group participants based on their preferences for community-based older adult care. User profile were developed in accordance with the findings of the qualitative analysis.
3 Results
3.1 General findings
A total of 259 valid questionnaires were collected, with an average age of 78.449.54 years. As shown in Table 3, 11 (4.2%) and 63 (24.3%) participants rated their health status as very poor and poor, respectively, while 106 (41%) participants considered themselves healthy or very healthy. Up to 221 (85.3%) participants had chronic diseases: 85 with one chronic disease, 136 with two or more chronic diseases. When asked about their understanding of the community-based care model, only 12 participants reported knowing it very well, 65 were somewhat familiar, 75 knew a little, and 107 (41.3%) had never heard of it. Regarding their preferred care model, 99 older adult individuals chose traditional institutional care, 91 chose home-based care, and 69 participants preferred community-based care, accounting for 26.6%. Participants’ monthly disposable income and the amount they are willing to pay for community-based older adult care are shown in Figure 2.
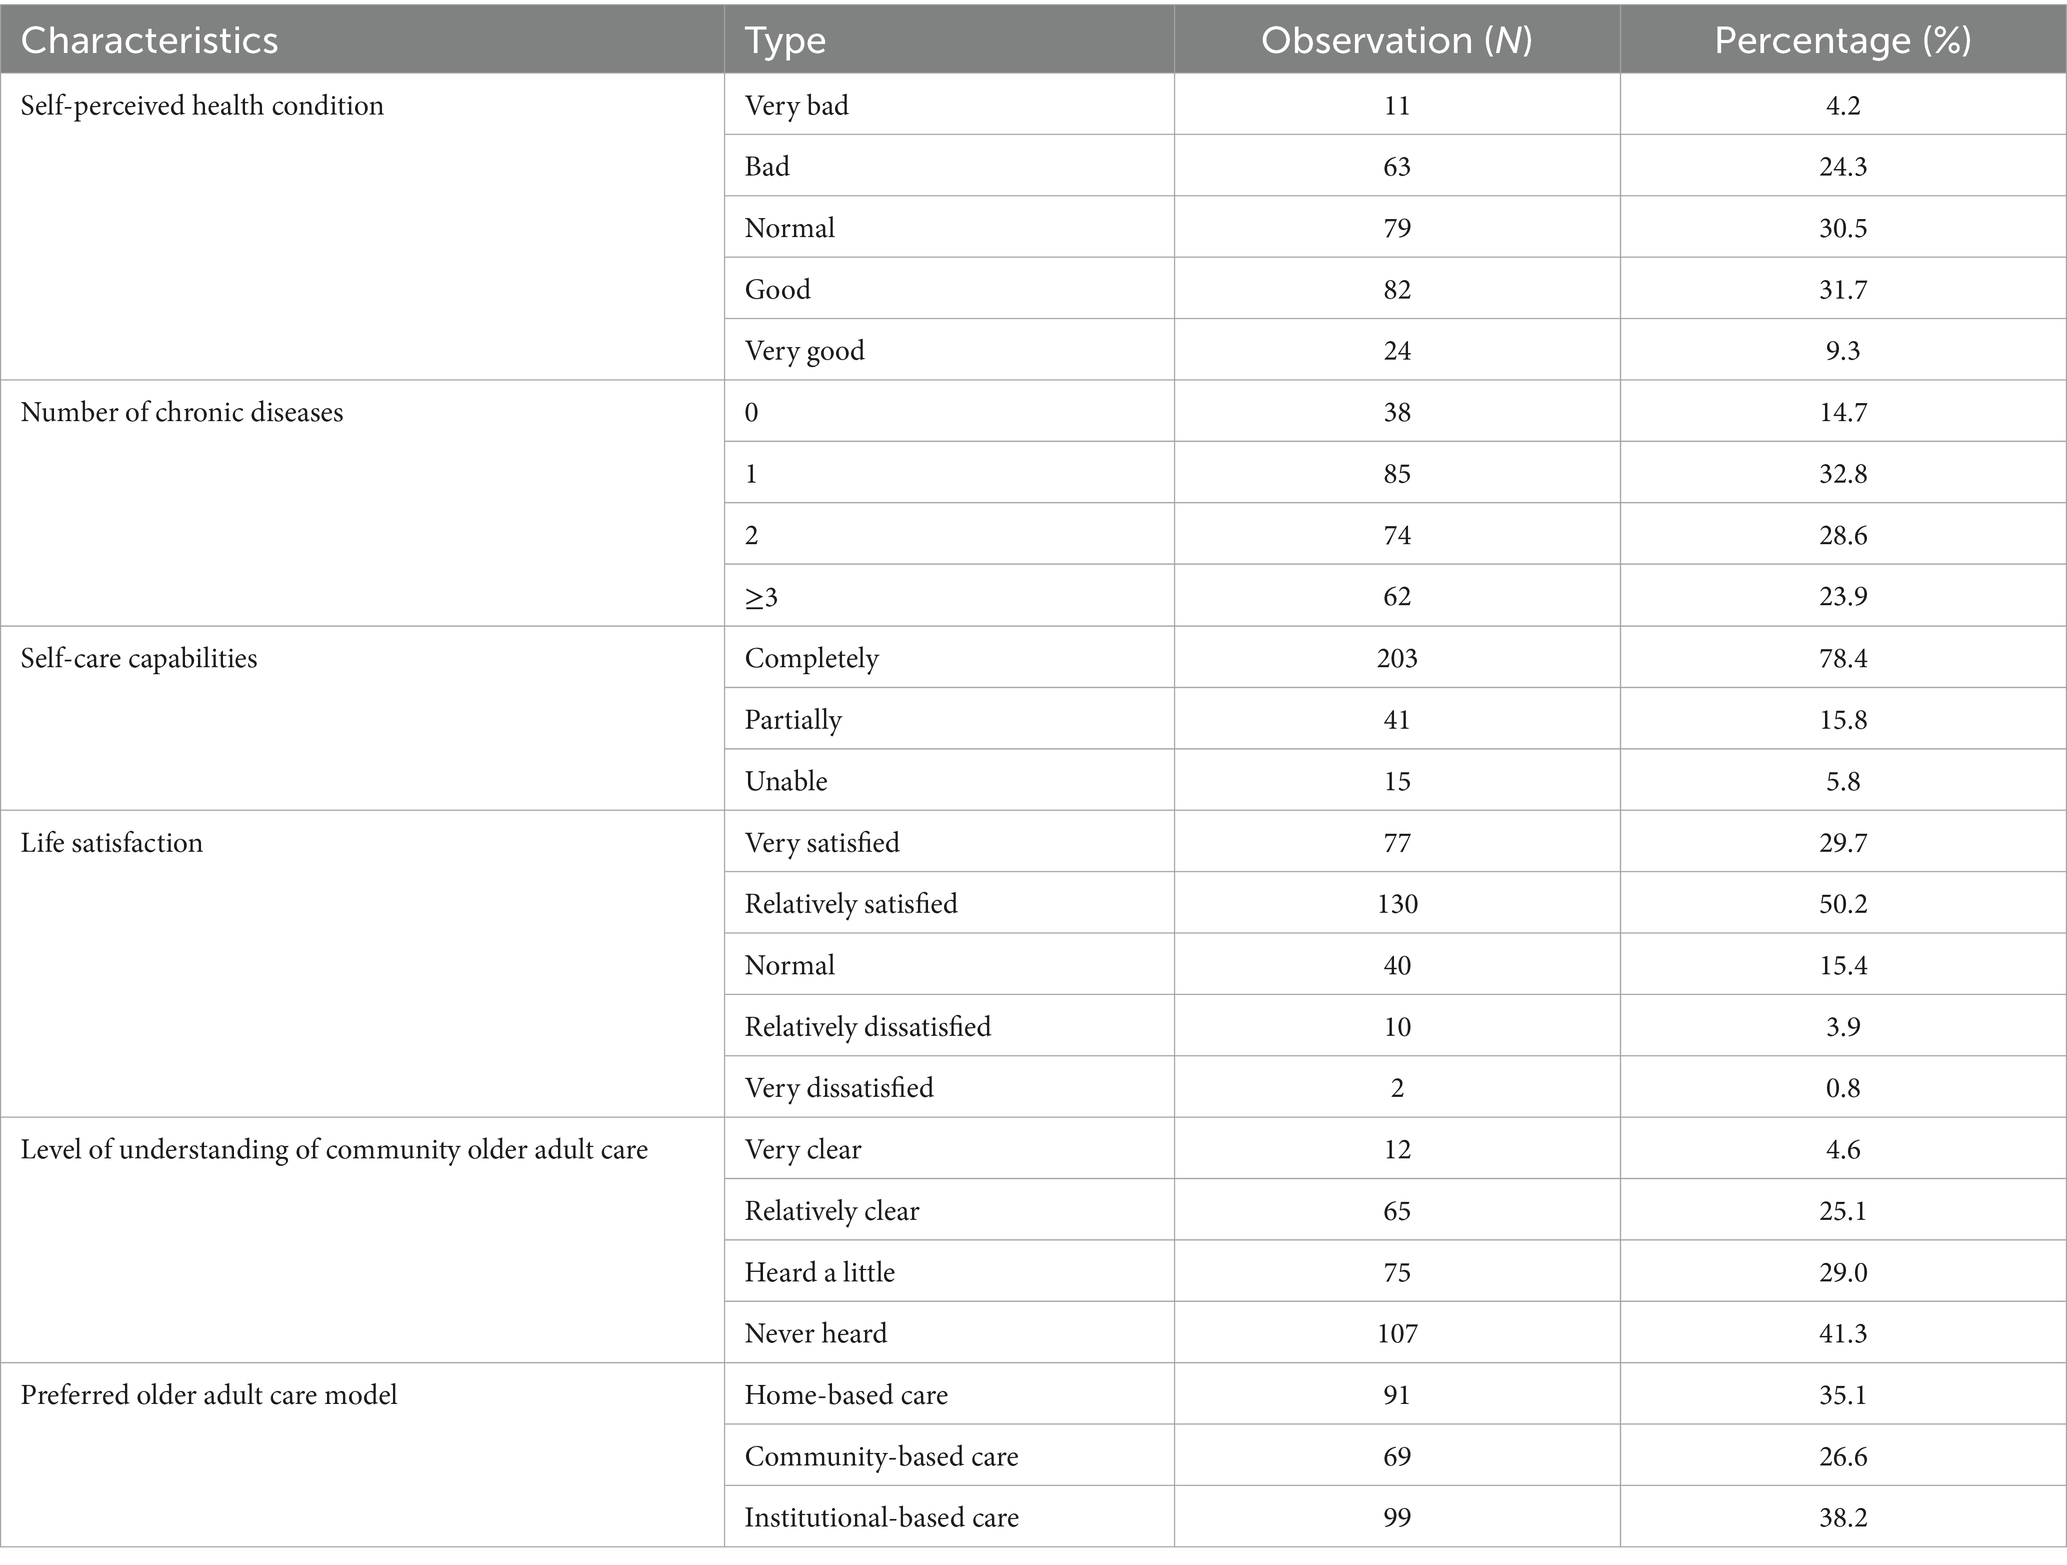
Table 3. Participants’ conditions related to community-based older adult care (N = 259).
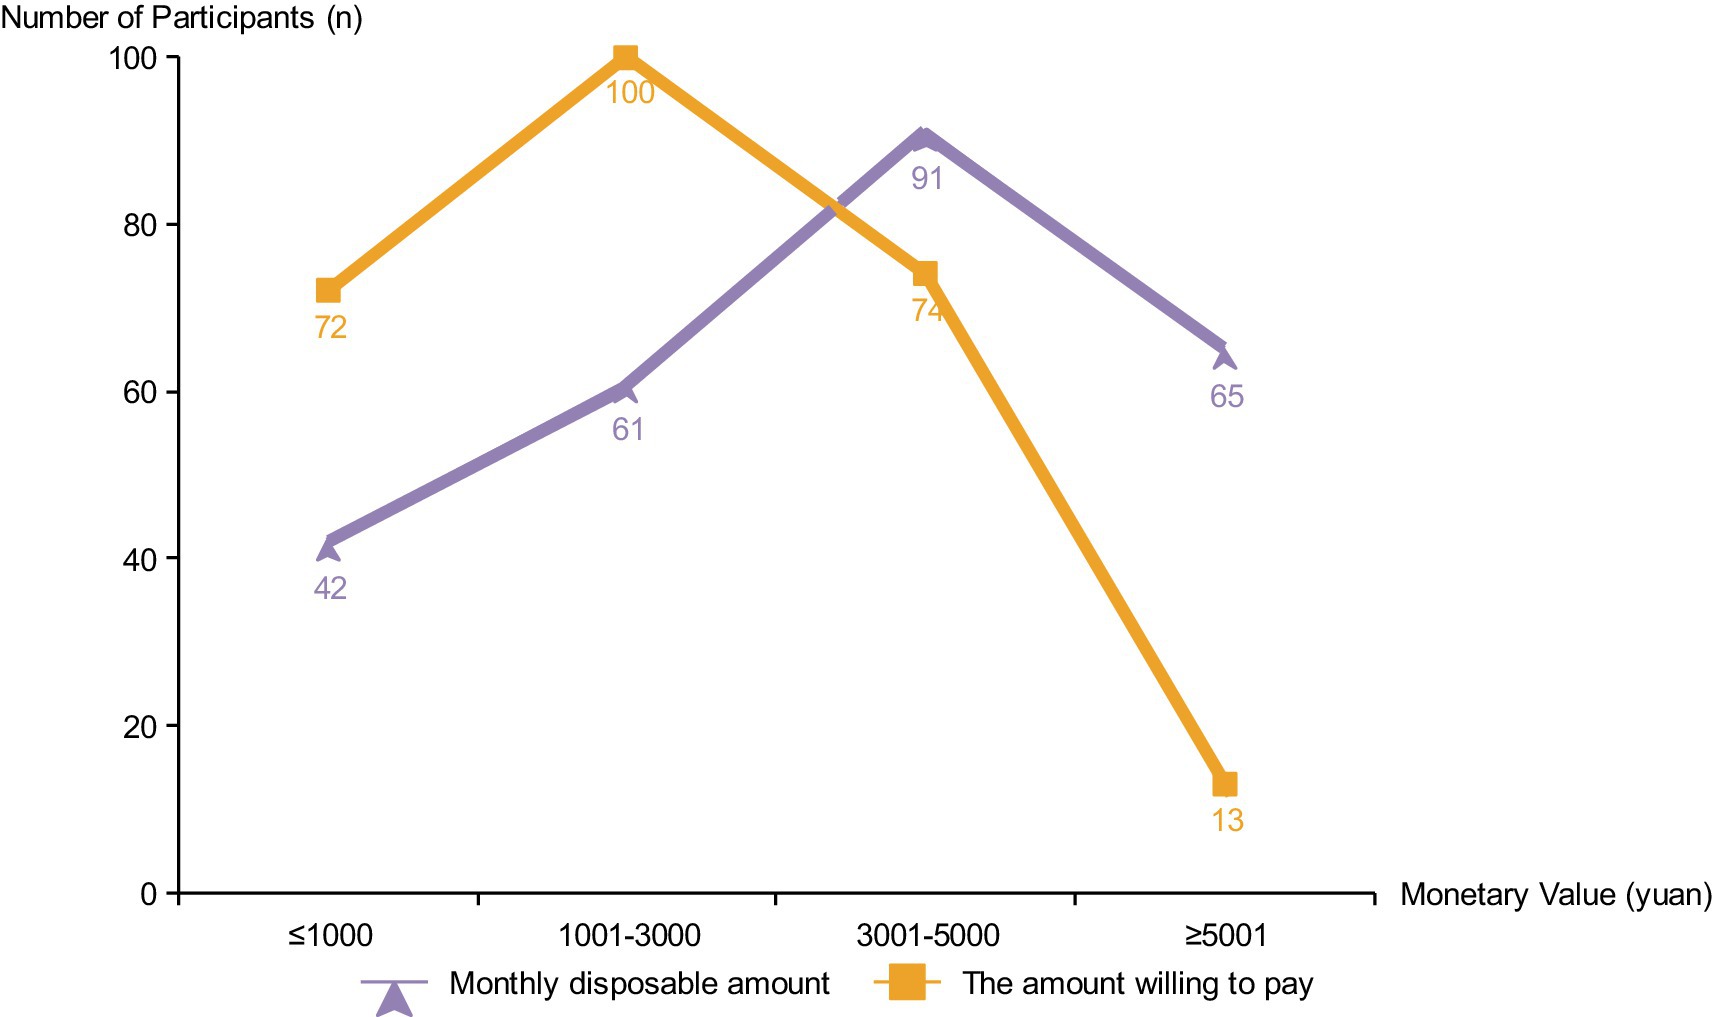
Figure 2. Comparison of disposable income and willingness to pay.
3.2 Demand classification based on Kano model
The results of the demand classification were presented in Table 4. None of the 34 services was classified as M, one was designated as O, 20 as A, and 13 as I. In the life care dimension, all services were judged to be A except for A4 handle business, which was judged to be I. In the health care dimension, B2 smart wearables, B5 telehealth services, and B10 rehabilitation therapy were judged to be I, and the rest of them were judged to be A. While the services in the spiritual comfort and legal policy dimensions were mostly judged to be I, except for C1 daily chat and F1 anti-fraud promotion services, which were A.
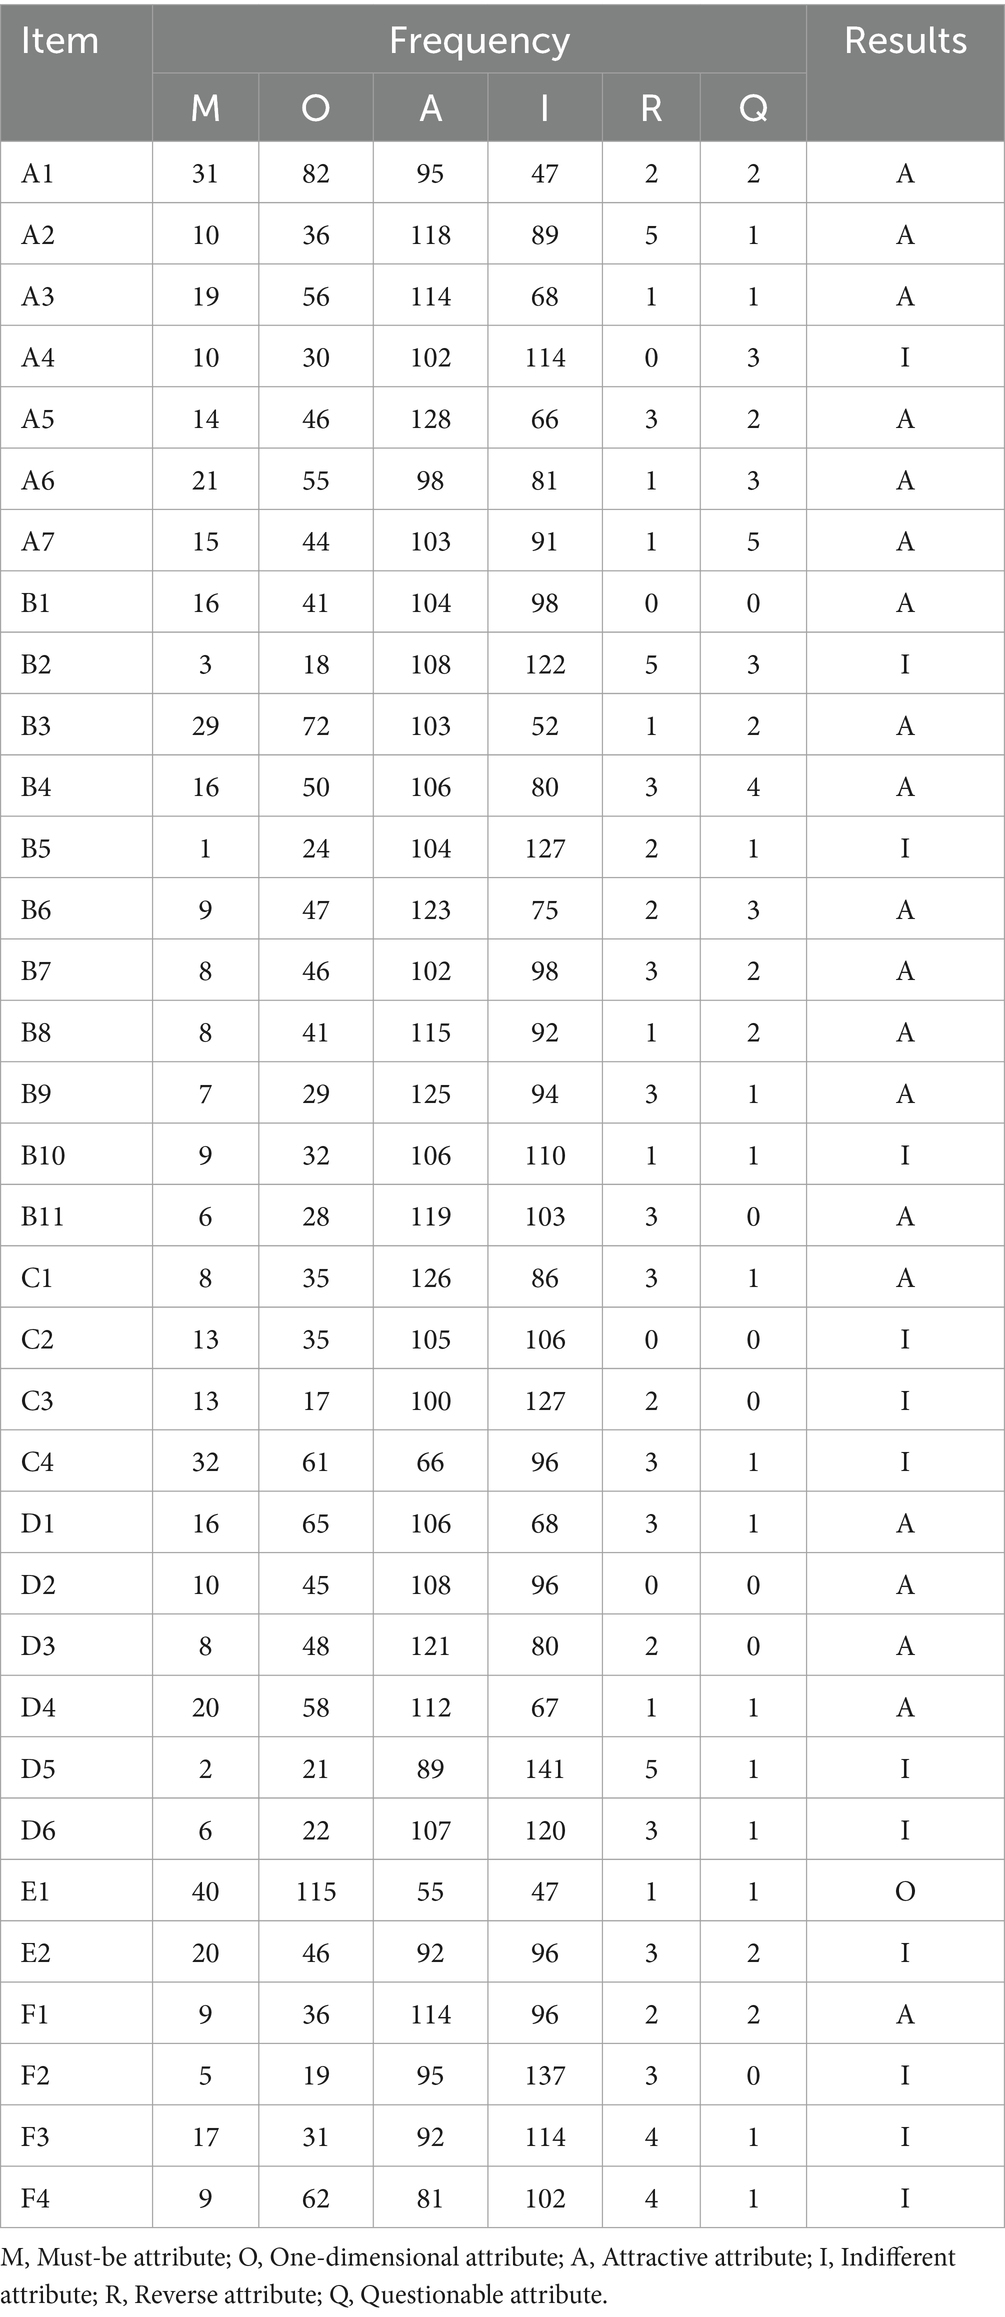
Table 4. Frequency of demand for community-based older adult care services.
3.3 The Better-Worse index analysis
As shown in Figure 3, the average value of the Better-Worse index of 34 services (0.225, 0.580) was used as the origin of coordinate system, with the Y-axis representing the Better value and the X-axis representing the absolute value of the Worse. A four-quadrant chart was constructed, and from the first quadrant to the fourth quadrant represents O, A, I, and M, respectively. Among these, the ASC is the highest in the first quadrant, with E1 emergency rescue having the highest ASC, followed by A1 community canteen or food delivery, B3 routine physical examination. In the second quadrant, the ASC of B6 home visit medical services and B4 accompanying to hospital was higher. The third quadrant includes B1 health records, C2 older adult service hotline, B11 nutrition guidance. The ASC in the fourth quadrant, from high to low, is C4 assistance in contacting relatives and friends, F4 special policy consultation, and E2 safety inspection of the living environment.
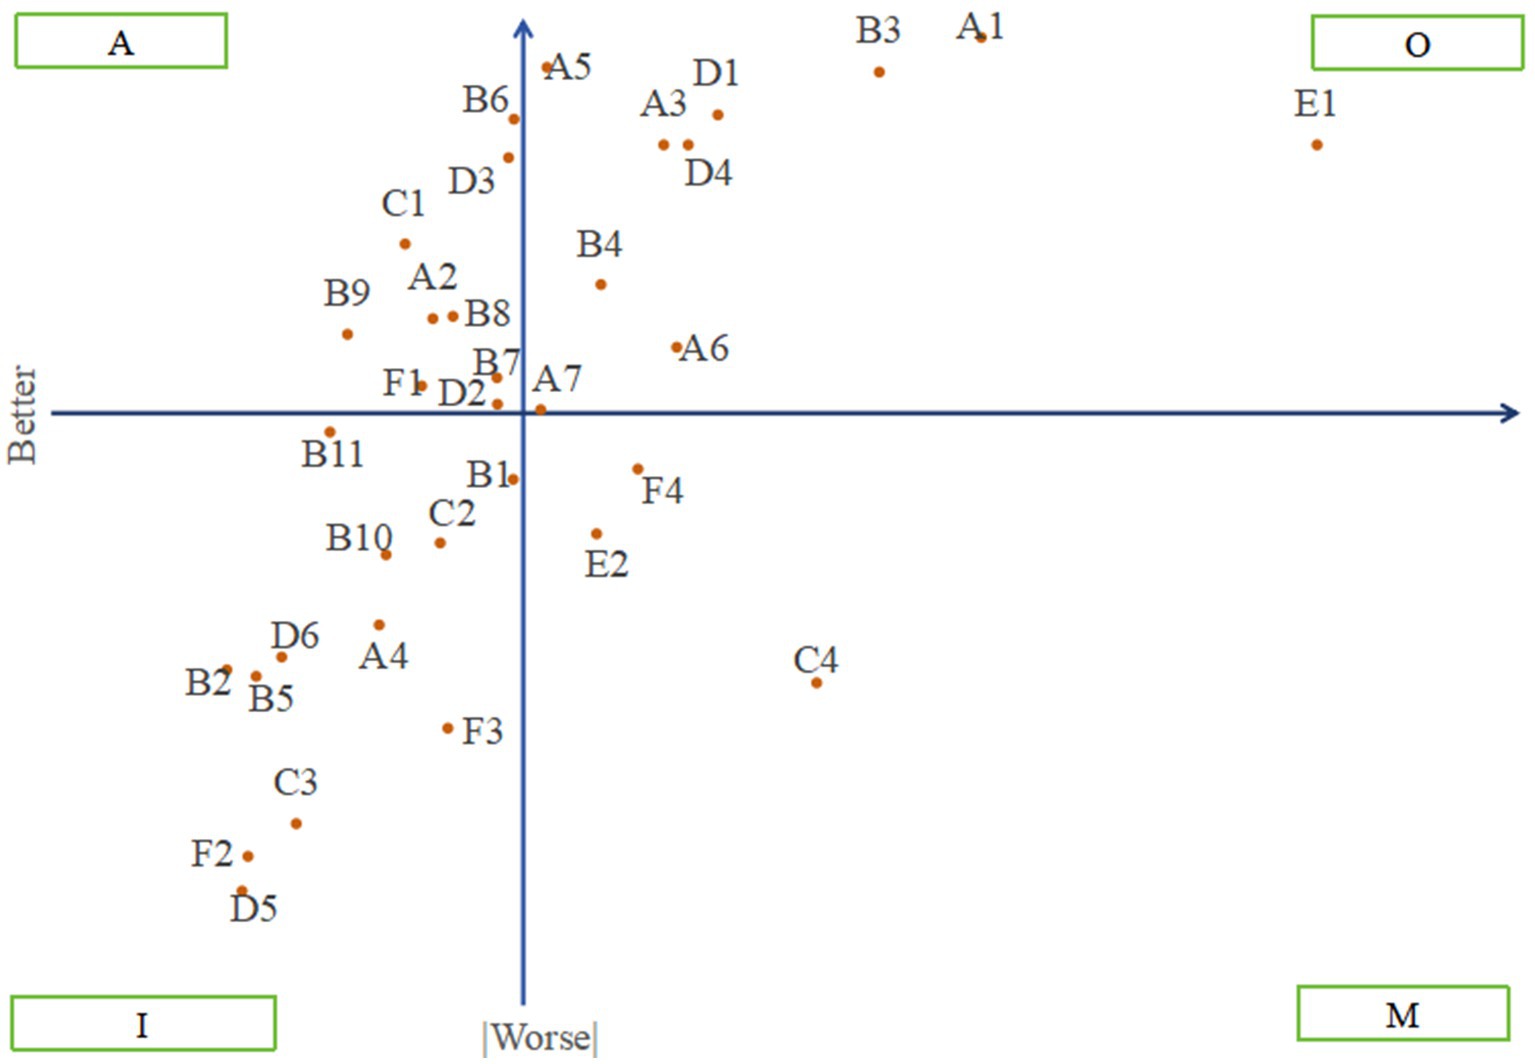
Figure 3. Four-quadrant scatterplot of community-based older adult care services.
3.4 Results of the analytic hierarchy process
Based on the results of the Better-worse index analysis, the indifferent attribute in the third quadrant was eliminated, and the must-be, one-dimensional, and attractive attributes were output as the standard-level indicators of the AHP model. The service items under each attribute were used as the scheme-level indicators. Judgment matrices were constructed, and experts were invited to compare and score multiple indicators pairwise. A total of 10 individuals were invited to score: four managers from older adult care service centers, three knowledgeable older adult individuals, two staff members who participated in the survey throughout the process, and one industry expert. All integrated matrices underwent consistency testing, with CR<0.1, validating the results. The results of the hierarchical single sorting are presented in Table 5.
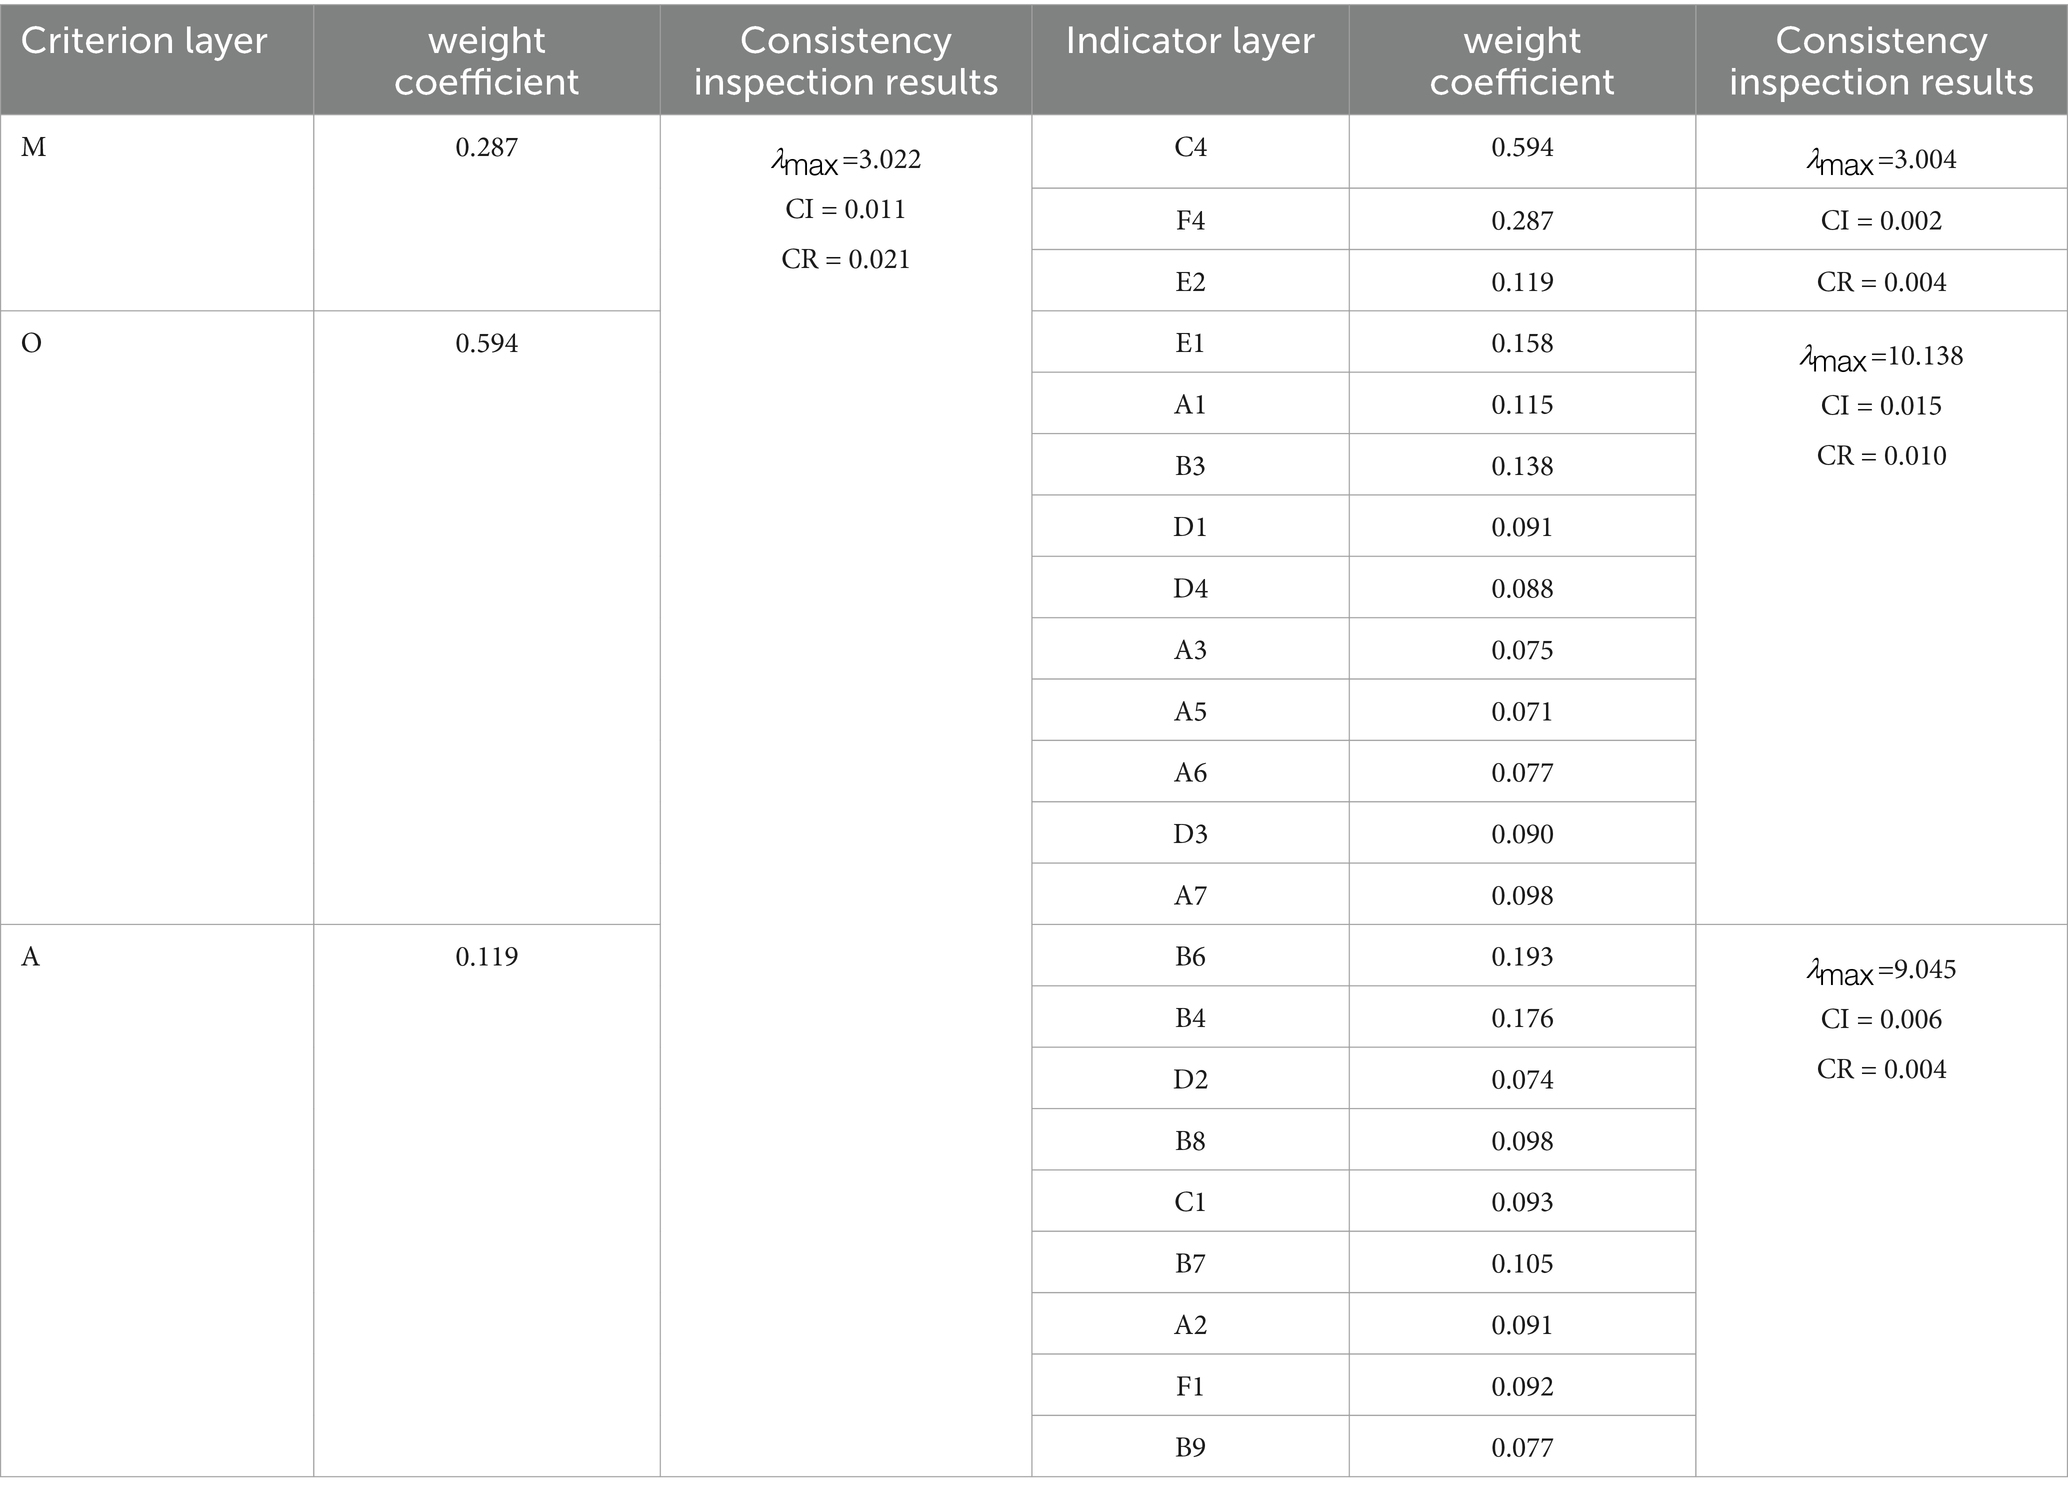
Table 5. Results of the hierarchical single sorting.
3.5 Ranking results based on coupling model
The hierarchical total sorting results and the corrected comprehensive weights are shown in Table 6. The top five services are C4 Contacting Relatives and Friends, E1 Emergency Rescue, B3 Regular Physical Examination, A1 Canteen or Meal Delivery, and F4 Special Policy Consultation. Conversely, the bottom five services are F1 Anti-fraud Publicity, B9 Health Exercise Guidance, and D2 Sports Fitness. After the correction, significant changes occurred in the ranking of C4 Contacting Relatives and Friends and D2 Sports Fitness. The corrected rankings were further confirmed through the questionnaire survey process and in-depth interviews with the older adult, demonstrating their authentic and effective.
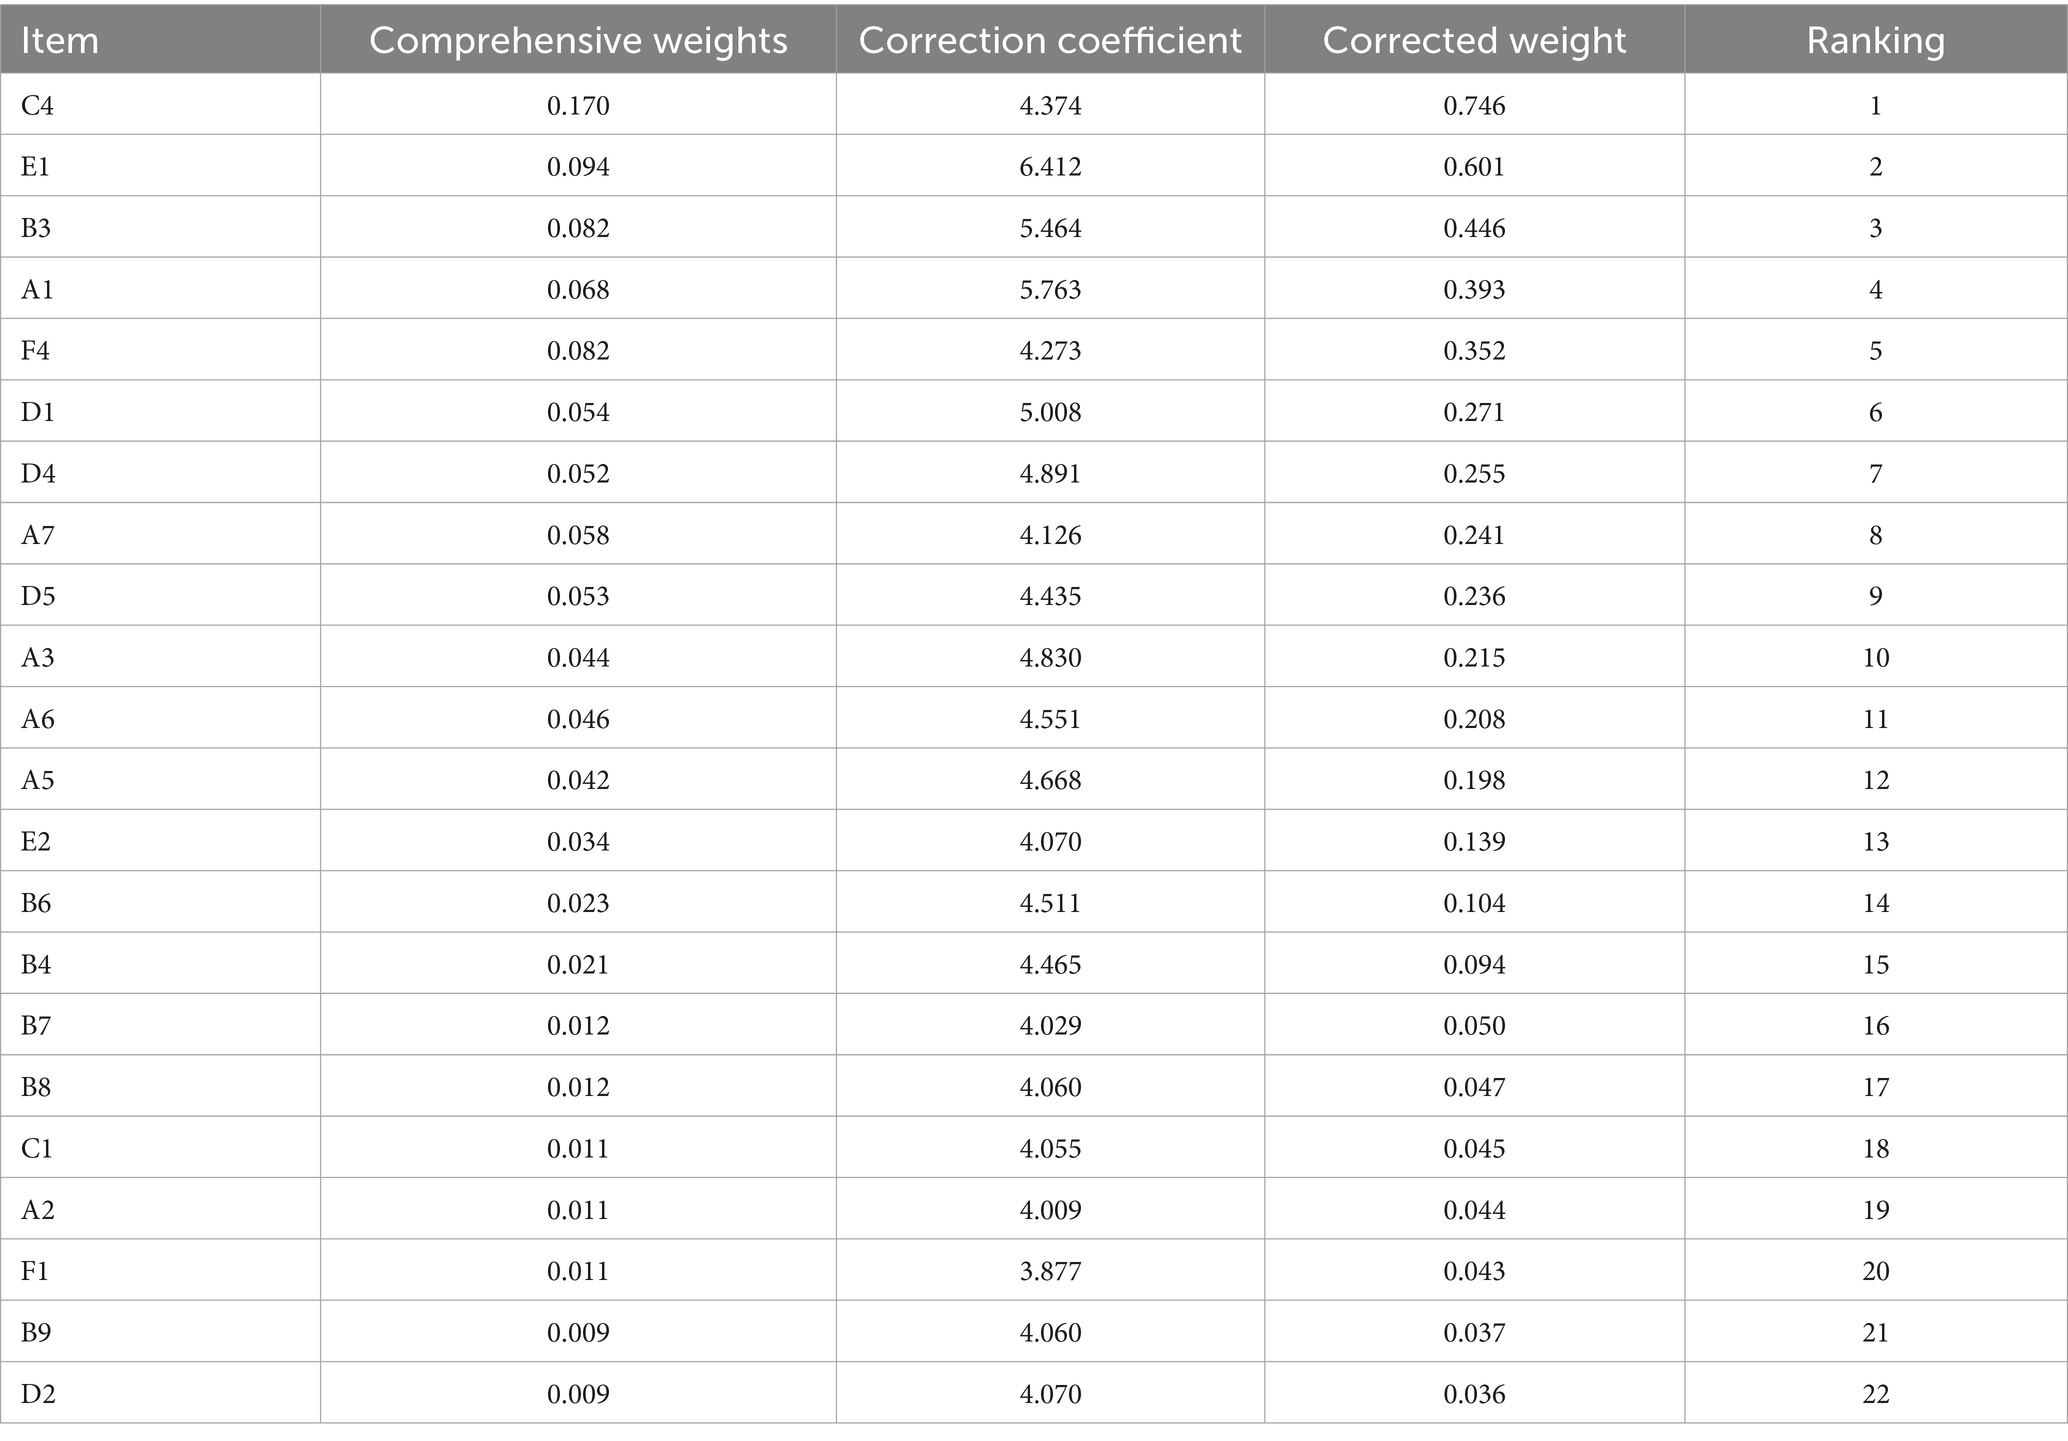
Table 6. Hierarchical total sorting and the comprehensive weights.
3.6 User profile based on cluster analysis
The mean age of participants in the group selecting community-based older adult care (76.09 ± 9.76) was significantly lower than the group choosing other options (79.29 ± 9.4), t = 2.42, p<0.05. The results of the univariate analysis are shown in Table 7. Between the two groups of participants, whether they community-based older adult care, the differences in age, education level, employee medical insurance, a regular pension, living situation, and understanding of community-based care were all statistically significant (p<0.05). After comprehensive consideration, the aforementioned six variables, along with three fundamental variables—gender, household registration type, and resident medical insurance—and two economic variables, namely, the amount of monthly disposable income and the amount of money willing to pay for community-based older adult care, were included in the two-step cluster analysis. The clustering results of user portraits identified two categories, and the importance of the predictor variables is shown in Figure 4.
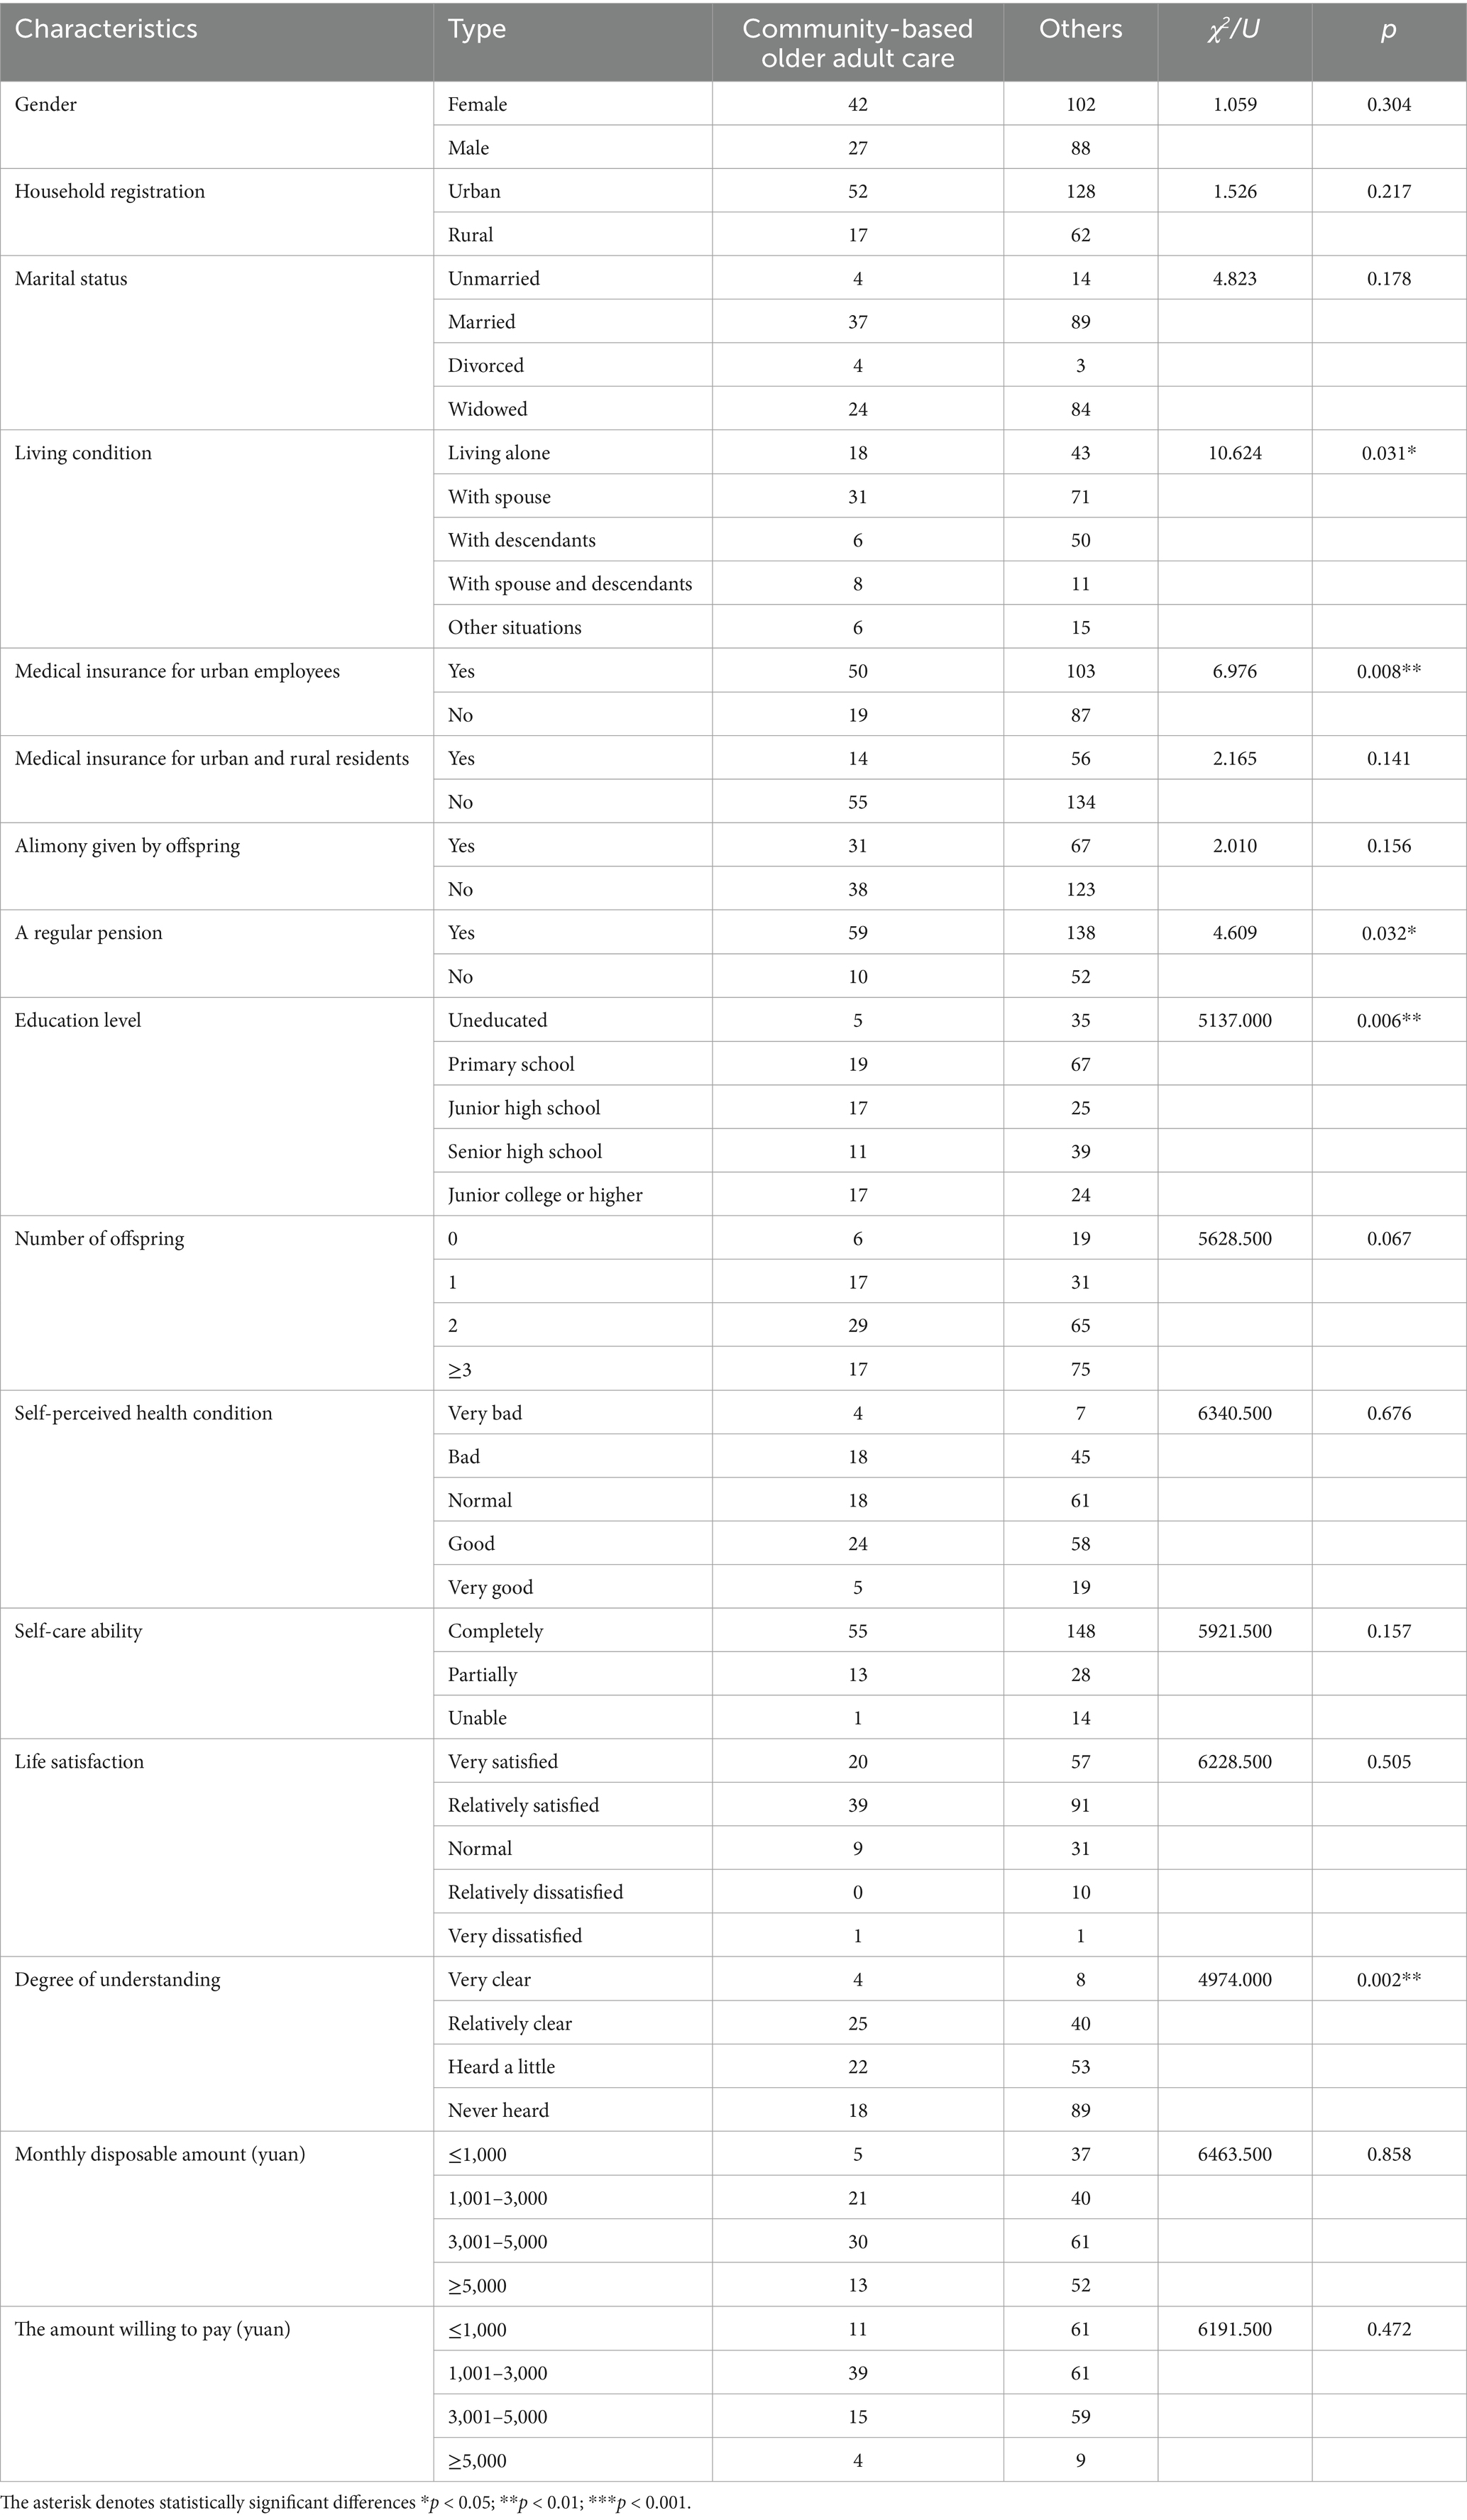
Table 7. Univariate analysis of whether to choose community-based care for the older adult.
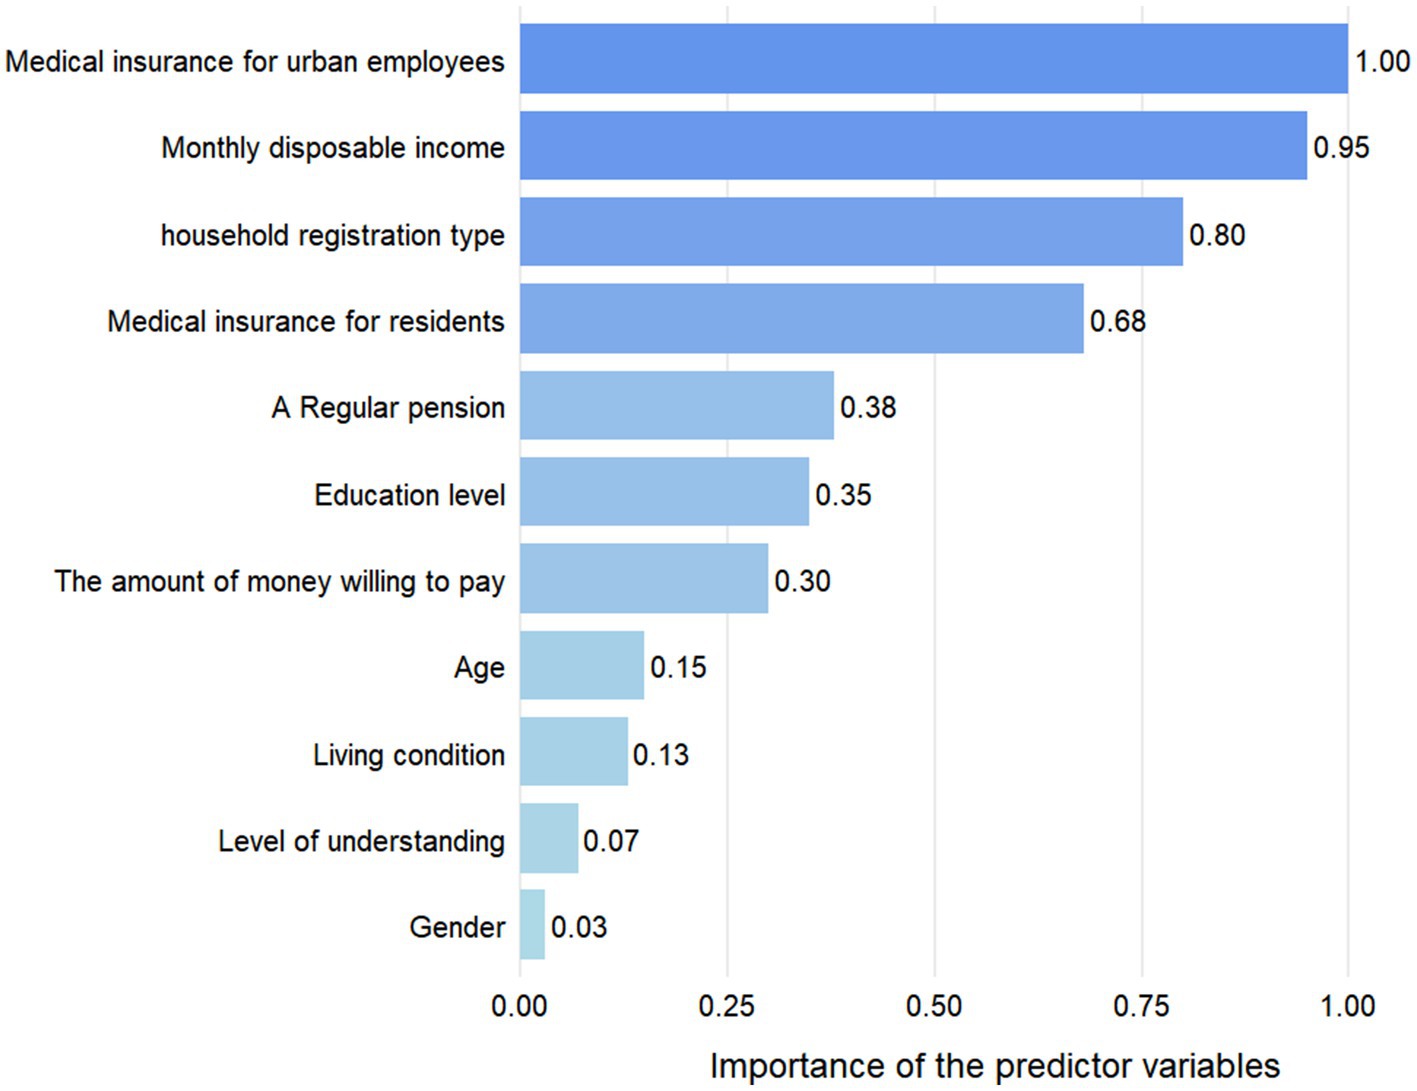
Figure 4. The predictor materiality.
In category 1, there were 51 (73.9%) participants with a mean age of 77.5 years. Of these, 47 (92.2%) were urban residents with employee medical insurance; 43 (84.3%) participants had a monthly disposable income exceeding 3,000 yuan; 48 (94.1%) received a regular pension; 28 (54.9%) had a high school education or higher, and only 1 participant was uneducated; 28 (54.9%) were willing to pay 1,001–3,000 yuan per month for community-based care, while 19 (28%) were willing to pay over 3,000 yuan per month. In category 2, there were 18 (26.1%) participants with a mean age of 72.1 years. Of these, 11 (61.1%) had medical insurance for urban and rural residents; 13 (72.2%) had a monthly disposable income of 1,001–3,000 yuan, while the rest had less than 1,000 yuan; 13 (72.2%) held a rural household registration; 11 (61.1%) received a regular pension; 14 (77.8%) had completed primary school or junior high school, while the remaining participants being uneducated; 11 (61.1%) were willing to pay 1,001–3,000 yuan for community-based care, while the remaining 7 (38.9%) were willing to pay less than 1,000 yuan.
The results yielded two types of user profiles: the urban, high-educated group with favorable economic conditions and strong consumption willingness, and the rural, low-education group with limited income and weak ability to pay.
3.7 Qualitative analysis results
The three centers faced five common operational problems: I. The service forms were predominantly long-term care and daycare, with home visit services less frequently conducted. II. The centers had 118/90/28 beds respectively, and almost all of them were occupied. III. Inadequate staffing was a significant concern, 40/14/12 staff members respectively, leading to situations where one person worked across multiple departments. Occasional services by volunteers from social organizations or schools were mainly focused on spiritual recreational activities. IV. Government subsidies were insufficient, and the centers were primarily financed by the older adult at their own expense. V. The primary services provided were medical care, life care, and spiritual entertainment, with canteens being the most commonly utilized services while free entertainment services were the most popular. Notably, all three centers indicated that they had no follow-up plans.
Interviews with the older adult also revealed four common problems: (1) 12 older adult interviewees had a low level of understanding of community-based older adult care, with their primary sources of information being TV, WeChat posts, and conversations with relatives and friends. Only 1 person had consulted the service center offline for a systematic understanding; (2) Regarding existing services, 7 respondents mentioned that the quality of catering services was suboptimal, 1 respondent suggested enhancements to the medical technology, and 1 proposed shorter inspection intervals. (3) When queried about prospective service utilization, two respondents expressed a need for assistance in contacting relatives and friends, while another expressed a desire for long-term companionship services for individuals with prolonged bedridden status. (4) Older adult people with impaired self-care ability believed that the quality of long-term custodial services would not be good, and therefore, they still preferred home-based services.
4 Discussion
4.1 Summary
Based on 259 valid questionnaires and 16 interviews for both the supply and demand sides of community older adult care, this study systematically analyzed the demand attributes and priorities of 34 community older adult services using the Kano-BW-AHP coupled model. Two types of user profiles were identified through two-step clustering, and supply–demand contradictions were summarized through qualitative analysis, revealing the current structural imbalance between supply and demand for community-based older adult care services in western China.
4.2 Discussion
In line with the existing research (26–29), 69 (26.6%) older adult participants prefer community-based older adult care services, and 182 (70.3%) participants knew little about them. In contrast, findings from a study in Beijing were quite different, with more than 75% of older adults having used community-based aging services or having some knowledge of them, and over 80% expressing a strong willingness to use community-based aging service facilities (30). This spatial heterogeneity suggests that the deepening implementation of community-based older adult services in the western China faces the dual dilemmas of perception and choice. Therefore, the government, media, and community should enhance the systematic publicity of community-based older adult care services, with age-appropriate messaging.
In the Kano analysis, no service was judged as M, and only 1 service was judged as O. Researchers observed that Chinese older adult individuals tend to be subtle and easy-going, often not expressing dissatisfaction. Thus, re-identifying needs through BW analysis was necessary and effective. The Kano-BW analysis reclassified 3 services as M, 9 as O and 10 as A. This study also introduces empirical opinions from experts and managers through AHP, constructing correction coefficients using the original data of the preorder model, which ultimately forms the Kano-BW-AHP model. After correction, the rankings of helping to contact relatives and friends and special policy counseling increased significantly, which was confirmed in interviews, validating the applicability and effectiveness of the model.
Through Kano-BW-AHP analysis, the top five services in the demand ranking are various dimensions of contacting relatives and friends, emergency assistance, regular medical checkups, canteen or meal delivery, and special policy consultation. This indicates that the overall demand for community older adult services is multidimensional, suggesting the need for service providers to establish a multi-level structure with hierarchical demand levels. Furthermore, it is apparent from these demand dimensions that older adults have a heightened need for safety. A study in Helsinki (31) found that loneliness, limited social networks, and social age discrimination were sources of insecurity among home-dwelling older adults. Studies in China have shown that the sense of security among home-dwelling older adult individuals is linked to parent–child support, community environment, and social care (32, 33). Therefore, community-based older adult services should strengthen the sense of security for the older adult in all aspects, enhance community service promotion with family participation and support, modify the community environment to be age-friendly, and foster a positive community atmosphere for the older adult.
The study found that the older adult have a high prevalence of chronic diseases (85.3%), and the comorbidity of chronic diseases was common (52.5%). Similar to the previous findings (34), services under the healthcare dimension, such as regular medical checkups and home visit medical services, remain the focus of older adult individuals’ attention. Efforts should be made to improve the quality and efficiency of healthcare services and enhance accessibility for the older adult. On the other hand, the demand for smart wearable devices and telemedicine was not high, which aligns with the low willingness of the older adult to use smart medical services, as noted in relevant studies (35). Some studies have identified subjective and objective difficulties in the acceptance and use of smart devices by the older adult (36). In the digital information age, a more reliable user-friendly smart healthcare service environment should be created for the older adult.
Previous studies (37) have demonstrated that recreational activities are significantly related to the mental health and well-being of the older adult. The interviewed older adult also expressed their demand for recreational activities and senior activity centers, which they ranked 6th and 7th, respectively. It is thus essential to ensure the availability of activity venues and diversify the types of activities offered. Nevertheless, fitness exercise ranked last. This disparity may stem from factors related to physical condition and inherent beliefs. It is recommended that relevant institutions promote recreational activities with fitness benefits, such as dancing, and card games, and strengthen health education efforts.
However, older adult individuals with disabilities placed more importance on life care-related services, which were predominantly categorized as A in this study. The difficulty of home-based care and the shortage of institutional-based care personnel are urgent practical problems that need addressing. The pressure of aging on society and families should be alleviated through various approaches, such as strengthening nursing professional training (38), developing auxiliary care equipment like multi-functional nursing beds (39) and household mobility devices (40), and encouraging community residents to join time banks for mutual older adult assistance (41).
The continued development of home visit services should be a priority for policymakers, as previous studies (42) have indicated that home visits are one of the unmet community-based care services for older people. The results of this study reveal that emergency assistance, living environment safety inspection, home delivery, and home medical care are services urgently needed by the older adult. The development of community mutual care model is a promising strategy to meet this demand amidst a shortage of human resource (27).
Finally, two types of user profiles through cluster analysis. On the one hand, urban high-educated users (73.9%) with high income and a strong willingness to pay are the primary consumers of the silver-hair economy, and their diverse demands need to be met through service quality improvements to promote the high-quality development of community-based older adult care services. On the other hand, the pilot reform of community older adult care has been particularly effective in promoting consumption and improve the welfare of low-age older adult, low-income older adult families, and rural older adult individuals (43), which comprise the second category of users (26.1%) in this study. This group requires policy support and basic services to improve service accessibility and unlock the payment potential of these groups. Additionally, the differences in the profiles and proportions of these two user types indicate a structural imbalance in the supply and demand for community-based older adult care services.
At the community older adult care service system is fully implemented, relevant departments should continue to empower the system, with particular focus on talent training, publicity and education, financial guarantee, and policy support to address the current imbalance in community-based older adult care services.
4.3 Limitation
This study has certain limitations. Firstly, potential bias may arise from the small sample size and the use of convenience sampling in the two-stage sampling process. Secondly, due to the older age of those who voluntarily participated in the survey on older adult service demand and supply, the demand of younger older adult individuals for community-based older adult services was not explored, and some older adult individuals refused to participate due to hearing problems, which affected the generalizability of the findings. Finally, the cross-sectional data of the current survey are used, and the analysis results are relatively limited. In the future, these problems will be supplemented and solved, and the research on community-based older adult care services will be further improved.
5 Conclusion
This study comprehensively evaluates the status of community-based older adult care services from both supply and demand perspectives. By applying the Kano-BW-AHP model, the demand attributes of each service were distinguished and ranked, providing a quantitative analytical framework to accurately identify the older adult’s demands. Through clustered user profiling and qualitative analysis, the characteristics of two types of users who are likely to choose community-based older adult care were summarized, common problems requiring resolution by both supply and demand were discussed, and the study reveals an imbalance between the supply and demand of community-based older adult care services in terms of quantity, quality, efficiency, and structure. The findings can serve as a reference for policymakers, practitioners, and researchers, providing a basis for optimizing resource allocation, accurately supplying multidimensional services, and improving the imbalance between supply and demand.
Data availability statement
The raw data supporting the conclusions of this article will be made available by the authors, without undue reservation.
Ethics statement
The studies involving humans were approved by the Ethics Committee of Chongqing Medical University, China. The studies were conducted in accordance with the local legislation and institutional requirements. The participants provided their written informed consent to participate in this study.
Author contributions
YZ: Conceptualization, Writing – original draft, Writing – review & editing, Data curation, Formal analysis, Investigation, Methodology, Supervision. XT: Writing – original draft, Data curation, Investigation, Methodology. YT: Data curation, Investigation, Visualization, Writing – original draft. PP: Investigation, Supervision, Writing – original draft. DD: Conceptualization, Funding acquisition, Project administration, Resources, Supervision, Writing – original draft, Writing – review & editing.
Funding
The author(s) declare that financial support was received for the research and/or publication of this article. This work was supported by Chongqing Association of Higher Education [grant numbers 221011].
Acknowledgments
We would like to thank all the participants of the study and the volunteers during the investigation of the project.
Conflict of interest
The authors declare that the research was conducted in the absence of any commercial or financial relationships that could be construed as a potential conflict of interest.
Generative AI statement
The authors declare that no Gen AI was used in the creation of this manuscript.
Publisher’s note
All claims expressed in this article are solely those of the authors and do not necessarily represent those of their affiliated organizations, or those of the publisher, the editors and the reviewers. Any product that may be evaluated in this article, or claim that may be made by its manufacturer, is not guaranteed or endorsed by the publisher.
References
1. GBD 2021 Forecasting Collaborators. Burden of disease scenarios for 204 countries and territories, 2022-2050: a forecasting analysis for the global burden of disease study 2021. Lancet. (2024) 403:2204–56. doi: 10.1016/S0140-6736(24)00685-8
2. Vollset, SE, Goren, E, Yuan, CW, Cao, J, Smith, AE, Hsiao, T, et al. Fertility, mortality, migration, and population scenarios for 195 countries and territories from 2017 to 2100: a forecasting analysis for the global burden of disease study. Lancet. (2020) 396:1285–306. doi: 10.1016/S0140-6736(20)30677-2
3. National Bureau of Statistics. Major Figures on 2020 Population Census of China [EB/OL]. (2021-11-26) [2025-3-29]. Available online at: https://www.stats.gov.cn/sj/pcsj/rkpc/d7c/.html
4. Wang, J, Zhao, J, Zheng, H, and Sun, X. What to rely on before getting rich? A Study on the Adaptability of China’s Financial Market to the Pension System and Population Aging. Northern Finance Journal. (2024) 12:95–98. doi: 10.16459/j.cnki.15-1370/f.2024.12.010
5. Liu, H, and Wu, P. Coupling coordination of economic development, population aging, and healthy aging services in China. Geogr Sci. (2025) 45:278–89. doi: 10.13249/j.cnki.sgs.20231184
6. The State Council issued the “14th Five-Year Plan for the Development of the National Aging Career and Pension Service System”[N]. Xinhua Daily Telegraph. (2022). doi: 10.28870/n.cnki.nxhmr.2022.001445
7. Grabowski, DC. The future of long-term care requires investment in both facility-and home-based services. Nat Aging. (2021) 1:10–1. doi: 10.1038/s43587-020-00018-y
8. Huajie, Y, Xiang, H, Jiabin, L, Zhihui, J, Qingguo, W, and Haoxiang, W. Differences in the elderly care service demand, preference, and tendency between urban and rural area in the Pearl River Delta. Acta Acad Med Sin. (2024) 46:193–203.
9. Jingbo, H, Yisong, Y, Ling, J, Diyue, L, Maomin, J, Yiyang, Z, et al. Intentions of home-based pension of the elderly in China and related factors: a nationalwide cross-sectional study. Military Nursing. (2024) 41:41–5.
10. Xiaoli, X, Xinhui, M, and Li, L. Influencing factors of the willingness of the elderly in China based on the two-way fixed-effect model. Modern Preven Med. (2023) 50:2991–9. doi: 10.20043/j.cnki.MPM.202212042
11. Guo, J, Konetzka, RT, Magett, E, and Dale, W. Quantifying long-term care preferences. Med Decis Mak. (2015) 35:106–13. doi: 10.1177/0272989X14551641
12. Bao, J, Zhou, L, Liu, G, Tang, J, Lu, X, Cheng, C, et al. Current state of care for the elderly in China in the context of an aging population. Biosci Trends. (2022) 16:107–18. doi: 10.5582/bst.2022.01068
13. Qiu, Y-m, and Yang, H-s. Research on the operation model of community elderly care services from the perspective of social Enterprise: taking Beijing community elderly home care services as an example. Soc Sci Beijing. (2023) 9:95–102. doi: 10.13262/j.bjsshkxy.bjshkx.230908
14. Haotian, C, Bobo, H, Yanan, L, Tiantian, L, Xiang, L, and Xiaohua, Z. Visual analysis of the current research status of domestic community home-based elderly care services based on CiteSpace. J Adv Clin Nurs. (2024) 3:106–11. doi: 10.12208/j.jacn.202400119
15. Liu, X, and Li, Q. A review and prospect of community home-based elderly care research: a bibliometric analysis based on Citespace. Study Explor. (2022) 3:33–40. doi: 10.3969/j.issn.1002-462X.2022.03.006
16. Shao, J. Improvement of community elderly care service facilities in response to the aging trend: taking directly affiliated streets of Liangjiang new area, Chongqing as an example. Urban Arch Space. (2025) 32:90–2.
17. Qiu, L. The experience of Yubei in the pilot reform of home and community care services. Soc Welfare. (2020) 11:41–3.
18. Luo, W. Study on the sustainable development of community elderly care services in Chongqing. Chong Qing Administration. (2023) 24:45–8. doi: 10.3969/j.issn.1008-4029.2023.04.015
19. Liu, H. Research on the sustainable development of community home-based elderly care services in Chongqing. Employ Guarantee. (2022) 4:42–4.
20. Kano, N, Seraku, N, Takahashi, F, and Tsuji, S. Attractive quality and must-be quality. J Jpn Soc Qual Control. (1984) 14:147–156.
21. Zhong, S, Lyu, J, Chen, Y, Yang, H, Guo, X, and Chen, M. Hierarchical analysis of regional cultural and creative product demand based on fuzzy Kano model. E3S Web Conf. (2020) 179:02007. doi: 10.1051/e3sconf/202017902007
22. Yuan, Y, Liu, Y, Gong, L, Chen, H, Zhang, S, Kitayama, A, et al. Demand analysis of telenursing for community-dwelling empty-nest elderly based on the Kano model. Telemed e-Health. (2020) 27:414–21. doi: 10.1089/tmj.2020.0037
23. Margarita, Z, Aleksandr, R, and Richard, T. Listening to the voice of the customer in the hospitality industry: Kano model application. Worldwide Hospital Tourism Themes. (2018) 10:436–48. doi: 10.1108/WHATT-03-2018-0020
24. Na, G. Research on functional requirements of smart aged service platform based on Kano model. Intell Comp App. (2020) 10:178–82. doi: 10.3969/j.issn.2095-2163.2020.01.036
25. Tufail, MMB, Shakeel, M, Sheikh, F, and Anjum, N. Implementation of lean six-sigma project in enhancing health care service quality during COVID-19 pandemic. AIMS Public Health. (2021) 8:704–19. doi: 10.3934/publichealth.2021056
26. Yuan, Y, Tao, C, Yu, P, Wang, Y, Kitayama, A, Takashi, E, et al. Demand analysis of telenursing among empty-nest elderly individuals with chronic diseases based on the Kano model. Front Public Health. (2022) 10:990295. doi: 10.3389/fpubh.2022.990295
27. Zhou, Z, Wang, L, and Dong, Y. Research on innovative design of community mutual aid elderly care service platform based on Kano model. Heliyon. (2023) 9:e15546. doi: 10.1016/j.heliyon.2023.e15546
28. Hu, J, Zhang, Y, Wang, L, and Shi, V. An evaluation index system of basic elderly care services based on the perspective of accessibility. Int J Environ Res Public Health. (2022) 19:4256. doi: 10.3390/ijerph19074256
29. Zhang, Q, Li, Y, Zhang, J, et al. A study of community home care willingness and influencing factors of Chinese urban elderly. J Nurs Adm. (2025):1–7.
30. Li, J, Cheng, X, Li, S, and Qin, L. Research and insights on the demand level for community based elderly care facilities: a case study of Chentral district of Beijing. World Arch. (2024) 6:41–6. doi: 10.16414/j.wa.2024.06.004
31. Knuutila, MT, Lehti, TE, Karppinen, H, Kautiainen, H, Strandberg, TE, Öhman, H, et al. Determinants of a sense of insecurity among home-dwelling older people. Scand J Public Health. (2024) 52:64–70. doi: 10.1177/14034948221131419
32. Zhou, W, Hong, Z, Hu, R, Zhu, T, Liu, S, Zhang, L, et al. Parent-child support and elder’s depression: roles of sense of security and emotional expression. Psychol Dev Educ. (2020) 36:249–56. doi: 10.16187/j.cnki.issn1001-4918.2020.02.14
33. Chen, L, Xu, J, Zhang, W, et al. Residents' sense of urban public security and community environments: analysis based on a large-scale questionnaire survey of Beijing [J]. Acta Geograph Sin. (2021) 76:1939–50.
34. Qin, S, Cheng, Y, Zhang, H, and Ding, Y. Home/community-based medical and elderly care services utilization in China: a cross-sectional study from the middle-aged and elderly population. Healthcare (Basel). (2023) 11:2431. doi: 10.3390/healthcare11172431
35. Yandang, S, and Qiangfen, W. Survey on the intention to use smart healthcare services in Guilin's middle-aged and elderly population: based on a theoretical model of technology adoption and application integration. Health Develop Policy Res. (2023) 26:798–803. doi: 10.13688/j.cnki.chr.2023.230208
36. Zhao, Y, and Li, J. Opportunities and challenges of integrating artificial intelligence in China's elderly care services. Sci Rep. (2024) 14:9254. doi: 10.1038/s41598-024-60067-w
37. Hossain, MA, Alamri, A, Almogren, AS, Hossain, SK, and Parra, J. A framework for a context-aware elderly entertainment support system. Sensors. (2014) 14:10538–61. doi: 10.3390/s140610538
38. Song, P, and Tang, W. The community-based integrated care system in Japan: health care and nursing care challenges posed by super-aged society. Biosci Trends. (2019) 13:279–81. doi: 10.5582/bst.2019.01173
39. Xing, J, and Wang, AF. Optimized design of multi-functional nursing bed based on Kano and trize theories. Ind Des. (2021) 8:154–6.
40. Chen, Y, Ning, M, Xu, XK, et al. Design of home-use auxiliary shifting equipment based on Kano model. J Mach Des. (2016) 33:109–14.
41. Collom, E. Engagement of the elderly in time banking: the potential for social capital generation in an aging society. J Aging Soc Policy. (2008) 20:414–36. doi: 10.1080/08959420802186282
42. Meng, D, Xu, G, and Davidson, PM. Perceived unmet needs for community-based long-term care services among urban older adults: a cross sectional study. Geriatr Nurs. (2021) 42:740–7. doi: 10.1016/j.gerinurse.2021.03.013
Keywords: community-based older adult care, Kano model, analytic hierarchy process, cluster analysis, supply and demand
Citation: Zhou Y, Tian X, Tang Y, Peng P and Deng D (2025) Exploring supply and demand imbalance of community-based older adult care: an observational study in Chongqing, China. Front. Public Health. 13:1581039. doi: 10.3389/fpubh.2025.1581039
Edited by:
Esther-Lee Marcus, Herzog Hospital, IsraelReviewed by:
Keerti Singh, The University of the West Indies, BarbadosSimin Mouodi, Babol University of Medical Sciences, Iran
Copyright © 2025 Zhou, Tian, Tang, Peng and Deng. This is an open-access article distributed under the terms of the Creative Commons Attribution License (CC BY). The use, distribution or reproduction in other forums is permitted, provided the original author(s) and the copyright owner(s) are credited and that the original publication in this journal is cited, in accordance with accepted academic practice. No use, distribution or reproduction is permitted which does not comply with these terms.
*Correspondence: Dan Deng, MTAwMDc5QGNxbXUuZWR1LmNu