 Linbo Li
 Chunhai Cai2
- 1Central Laboratory, Qidong People's Hospital, Qidong Liver Cancer Institute, Affiliated Qidong Hospital of Nantong University, Qidong, Jiangsu, China
- 2State Key Laboratory of Cardiology and Medical Innovation Center, Shanghai East Hospital, Frontier Science Center for Stem Cell Research, School of Life Sciences and Technology, Tongji University, Shanghai, China
Background: Childhood and adolescent brain and central nervous system cancers (CABCs) represent the leading cause of cancer-related mortality among individuals aged 0–19 years; however, global trends and socio-demographic disparities remain insufficiently explored.
Methods: We utilized the Global Burden of Disease (GBD) 2021 dataset to evaluate the evolving burden of CABCs across 204 countries from 1990 to 2021. We analyzed age-standardized prevalence rate (ASPR), age-standardized incidence rate (ASIR), age-standardized mortality rate (ASMR), and age-standardized disability-adjusted life years (ASDR) among individuals aged 0–19 years. Methodological approaches, including Joinpoint regression, decomposition analysis, and age-period-cohort modeling, were applied to assess trends across five Sociodemographic Index (SDI) levels. Data robustness was further enhanced through temporal smoothing and adjustments to the mortality-to-incidence ratio for pediatric populations.
Results: Globally, ASPR exhibited a modest increase (average annual percentage change [AAPC] = 0.42, 95% CI: 0.29–0.54), while ASIR, ASMR, and ASDR demonstrated significant declines (AAPC = −0.29, −1.31, and −1.34, respectively). High-SDI regions experienced the highest ASPR (18.0 per 100,000) and ASIR (2.6 per 100,000), a reflection of advanced diagnostic capabilities and improved survival outcomes. In contrast, Low-SDI regions saw an upward trajectory in both mortality (AAPC = 0.06) and disability-adjusted life years (DALYs) with the burden disproportionately affecting children under 5 years of age. East Asia accounted for the highest burden of cases (63,271 prevalent cases in 2021), while Sub-Saharan Africa exhibited alarming increases in the incidence among young children. Decomposition analysis revealed that the global reduction in DALYs (−498,553) was predominantly offset by population growth and rising prevalence in low-resource settings.
Conclusion: While advancements in medical care have contributed to the reduction of CABC mortality in high-SDI regions, persistent disparities in Low-SDI areas necessitate urgent interventions. Targeted strategies—such as scalable diagnostic tools, establishment of regional treatment hubs, and equitable financial support through global initiatives like the WHO Childhood Cancer Initiative—are crucial to addressing these disparities. This study underscored the dual challenge of enhancing survivorship outcomes in high-income settings while rectifying systemic healthcare gaps in low-resource regions to promote global equity in pediatric oncology care.
Introduction
Childhood and adolescent brain and central nervous system cancers (CABCs) are among the most devastating pediatric malignancies, representing a leading cause of cancer-related mortality in individuals aged 0–19 years (1, 2). These tumors pose unique clinical challenges due to their complex neuroanatomical locations and aggressive biology, and survivors often face lifelong neurological, cognitive, and psychosocial sequelae (3, 4). Despite advancements in neuroimaging, surgical techniques, and multimodal therapies, significant disparities persist, with survival outcomes varying widely across socio-economic settings (5, 6). While high-income regions benefit from early detection and state-of-the-art treatment protocols, low- and middle-Sociodemographic Index (SDI) areas often experience diagnostic delays, limited treatment accessibility, and poorer prognoses (7, 8).
Existing epidemiological research on childhood cancers has predominantly focused on high-resource environments, leaving critical gaps in our understanding of CABCs in low-SDI regions (9–11). Additionally, variations in cancer registry completeness and diagnostic practices complicate direct comparisons across countries, potentially masking the true disease burden (12). These limitations underscore the urgent need for comprehensive, standardized global data to inform equitable healthcare policies and optimize resource allocation (13, 14). Recognizing this gap, international initiatives—such as the WHO Global Initiative for Childhood Cancer—have prioritized improving survival rates through early diagnosis and access to effective therapies.
Leveraging the Global Burden of Disease (GBD) 2021 dataset, this study systematically evaluated temporal trends and socio-demographic disparities in the burden of CABCs across 204 countries from 1990 to 2021. Using advanced analytical techniques—including joinpoint regression, decomposition analysis, and age-period-cohort modeling—we assessed changes in age-standardized prevalence rate (ASPR), age-standardized incidence rate (ASIR), age-standardized mortality rate (ASMR), and age-standardized disability-adjusted life years rate (ASDR). In addition, we conduct a frontier analysis to explore the theoretical minimum burden achievable given a country’s SDI level (15, 16), providing a more accurate understanding of global inequities. By identifying key determinants of regional disparities, this study aimed to guide targeted interventions, including scalable diagnostic strategies, regional treatment hubs, and improved access to care, thereby contributing to the broader goal of reducing childhood cancer mortality and advance health equity in pediatric oncology (17).
Methods
Study design and data sources
We conducted a repeated cross-sectional study of CABCs using annual estimates from the GBD 2021 study. Specifically, we analyzed GBD data for each calendar year (1990–2021) at the global and regional levels to assess temporal trends in prevalence, incidence, mortality, and disability-adjusted life years (DALYs). Each year’s data constitute an independent cross-sectional “snapshot,” allowing us to examine changes in the burden of CABCs over time.
DALY is a composite metric used to quantify the overall burden of disease (15). It is calculated as the sum of years of life lost (YLLs) due to premature mortality and years lived with disability (YLDs), providing a comprehensive measure of health loss. This metric enables cross-country and cross-disease comparisons by integrating both mortality and morbidity data.
The GBD 2021 dataset provides comprehensive estimates for 371 diseases and injuries across 204 countries and territories by integrating data from cancer registries, vital registration systems, hospital records, and population-based surveys (15). This robust dataset enabled the quantification of incidence, prevalence, mortality, and DALYs associated with CABCs on a global scale. To ensure data quality, we prioritized high-quality cancer registry data where available, supplemented by modeled estimates for regions with incomplete or missing data. Data integration involved rigorous quality control measures, including cross-validation between sources, imputation of missing values using GBD standard methods, and temporal smoothing to reduce fluctuations in regions with sparse data.
Additionally, countries and regions were categorized by SDI, a composite measure based on income per capita, educational attainment, and fertility rates. SDI ranges from 0 to 1, with higher values indicating greater socio-demographic development (18). For analysis purposes, SDI levels were classified into five categories: High, High-middle, Middle, Low- middle, and Low based on GBD-defined thresholds. This stratification facilitates the comparison of disease burden across different stages of development.
As this study utilized anonymized, publicly available data, ethical approval was not required in accordance with institutional guidelines.
Study population and case definition
The study focused on individuals aged 0–19 years. CABCs were identified in accordance with GBD criteria using International Classification of Diseases, 10th Revision (ICD-10) codes C70–C72 and C75.1–C75.3 (1). These codes were mapped to the GBD classification system through a standardized crosswalk methodology, aligning ICD-10 codes with GBD cause lists to ensure consistency in disease categorization across datasets. To enhance pediatric-specific accuracy, mortality-to-incidence ratios were refined using high-quality cancer registry data, and temporal smoothing techniques were applied to mitigate fluctuations in regions with sparse case data.
Statistical analysis
Age-standardized rates (ASRs)
ASPR, ASIR, ASMR, and ASDR were calculated per 100,000 population by adjusting for variations in age distribution using the GBD reference population. Rates were weighted by age-specific population proportions, and 95% uncertainty intervals (UI) were derived using Monte Carlo simulation methods to reflect estimation precision.
Temporal trend analysis
Temporal trends from 1990 to 2021 were examined using joinpoint regression analysis. This method identifies statistically significant changes in trend slopes by allowing for up to five joinpoints, selected based on permutation tests. Statistical significance was assessed using Wald χ2 tests, and average annual percentage changes (AAPCs) with corresponding 95% confidence intervals (CIs) were computed to quantify trends over time (1, 19). Additionally, variations in the SDI and regional differences were accounted for to ensure a more comprehensive analysis.
Decomposition analysis
The Das Gupta method was used to decompose changes in DALYs into contributions from four distinct factors: population growth, shifts in age structure, changes in disease prevalence, and variations in case fatality/severity. The Das Gupta approach involves calculating the attributable change in DALYs for each component while holding other components constant. Special attention was paid to the pediatric population (0–19 years) to capture the impact of demographic shifts.
Age–period–cohort modeling
To disentangle the intertwined effects of age, period, and birth cohort, intrinsic estimator models were utilized. These models allowed estimation of net drift (the overall temporal trend) and local drift (age-specific trends). Cohort effects were normalized to the 1995–1999 birth cohort, and statistical significance was assessed using Wald χ2 tests (20, 21). Additionally, the models adjusted the SDI and regional differences.
Health inequity and frontier analyses
Health inequities were quantified using two complementary metrics. The Slope Index of Inequality (SII) was calculated using regression-based methods to measure absolute disparities, while the Concentration Index (CI) was employed to assess relative disparities, with negative CI values indicating a disproportionate burden in low-SDI regions. Both metrics were computed with 1,000 bootstrap iterations to derive 95% confidence intervals. Additionally, frontier analysis was performed using locally weighted regression (LOESS) with 1,000 bootstrap iterations to model the theoretical minimum achievable ASMR and ASDR at each SDI level. The frontier values were defined as the lowest observed burden for a given SDI level, representing the theoretical minimum achievable under optimal conditions. The difference between observed and frontier values helped identify countries where further improvements in care delivery could be prioritized (22, 23).
Software and sensitivity analyses
All analyses were conducted in R (version 4.4.1) and the Joinpoint Regression Program (version 5.2.0). Sensitivity analyses were undertaken to assess the robustness of the findings to potential biases due to missing data or variable data quality across regions. All analytic code and aggregated data are publicly accessible via the Global Health Data Exchange (GHDx).
Results
Global burden of CABCs
From 1990 to 2021, the global ASPR and ASIR of CABCs remained relatively stable. In contrast, both ASMR and ASDR showed a consistent annual decline across both sexes (Figure 1). In 2021, the global prevalence of CABCs was estimated at 199,214 cases (95% UI: 166,466.2 to 241,711.8), with 40,535 new incidences (95% UI: 33,345.9 to 49,609), 19,923 deaths (95% UI: 16,061.8 to 24,531.8), and 1,632,940 DALYs (95% UI: 1,312,423.7 to 2,014,237). The corresponding ASRs were 7.6 (95% UI: 6.3 to 9.2) for prevalence, 1.5 (95% UI: 1.3 to 1.9) for incidence, 0.8 (95% UI: 0.6 to 0.9) for mortality, and 62 (95% UI: 49.8 to 76.4) for DALYs.
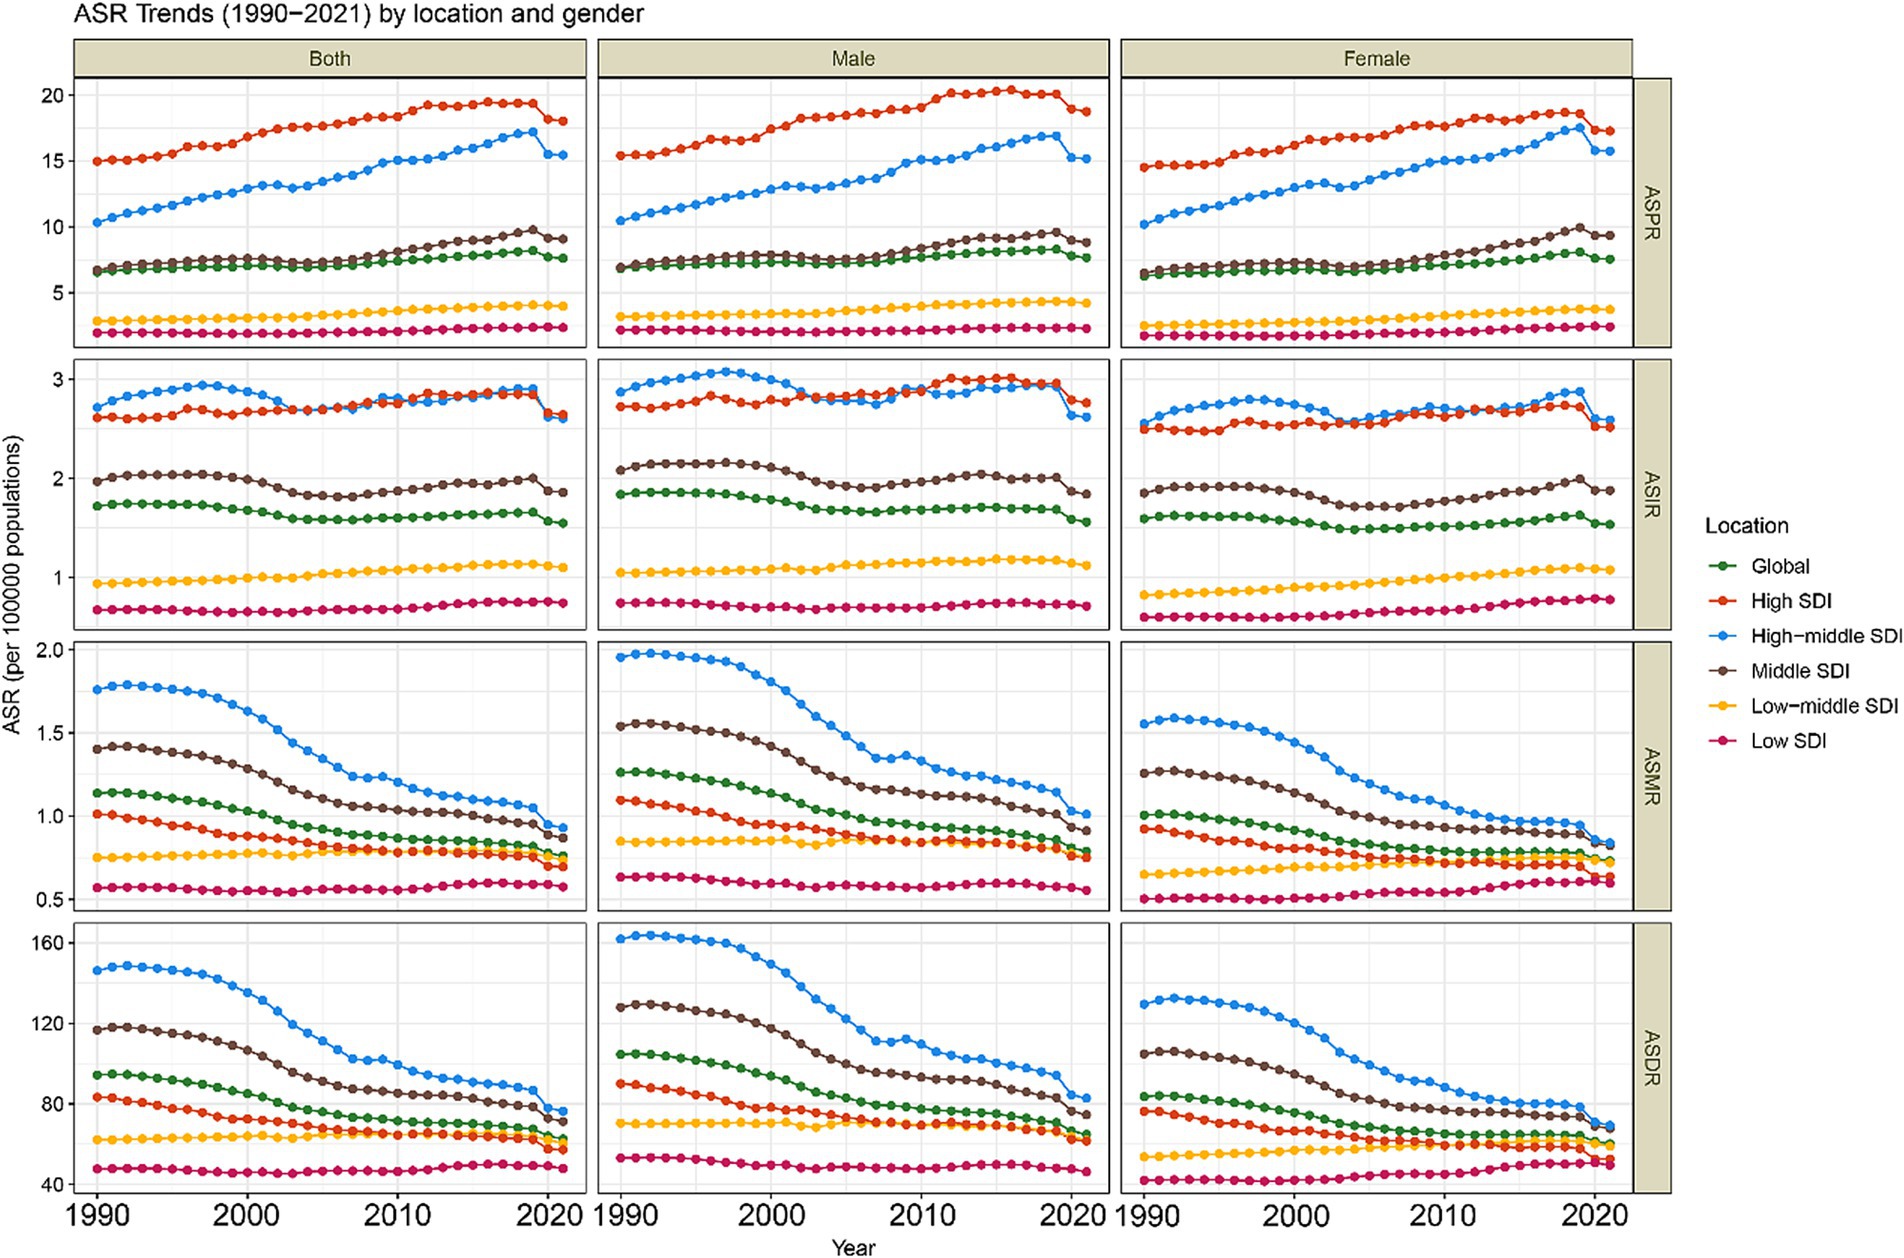
Figure 1. Trends in age-standardized rates (ASRs) of CABCs (1990–2021) by location and gender. SDI, socio-demographic index. CABCs, childhood and adolescent brain and central nervous system cancers. ASPR, age-standardized prevalence rate; ASIR, age-standardized rates for incidence; ASMR, age-standardized mortality rate; ASDR, age-standardized DALY rate; DALYs, disability adjusted life years.
Compared to 1990, the global burden of CABCs showed an increase in prevalence, with an AAPC of 0.42 (95% CI: 0.29 to 0.54). Conversely, incidence, mortality, and DALYs all decreased, with AAPCs of −0.29 (95% CI: −0.41 to −0.17), −1.31 (95% CI: −1.48 to −1.13), and −1.34 (95% CI: −1.51 to −1.16), respectively (Table 1 and Supplementary Table 1).
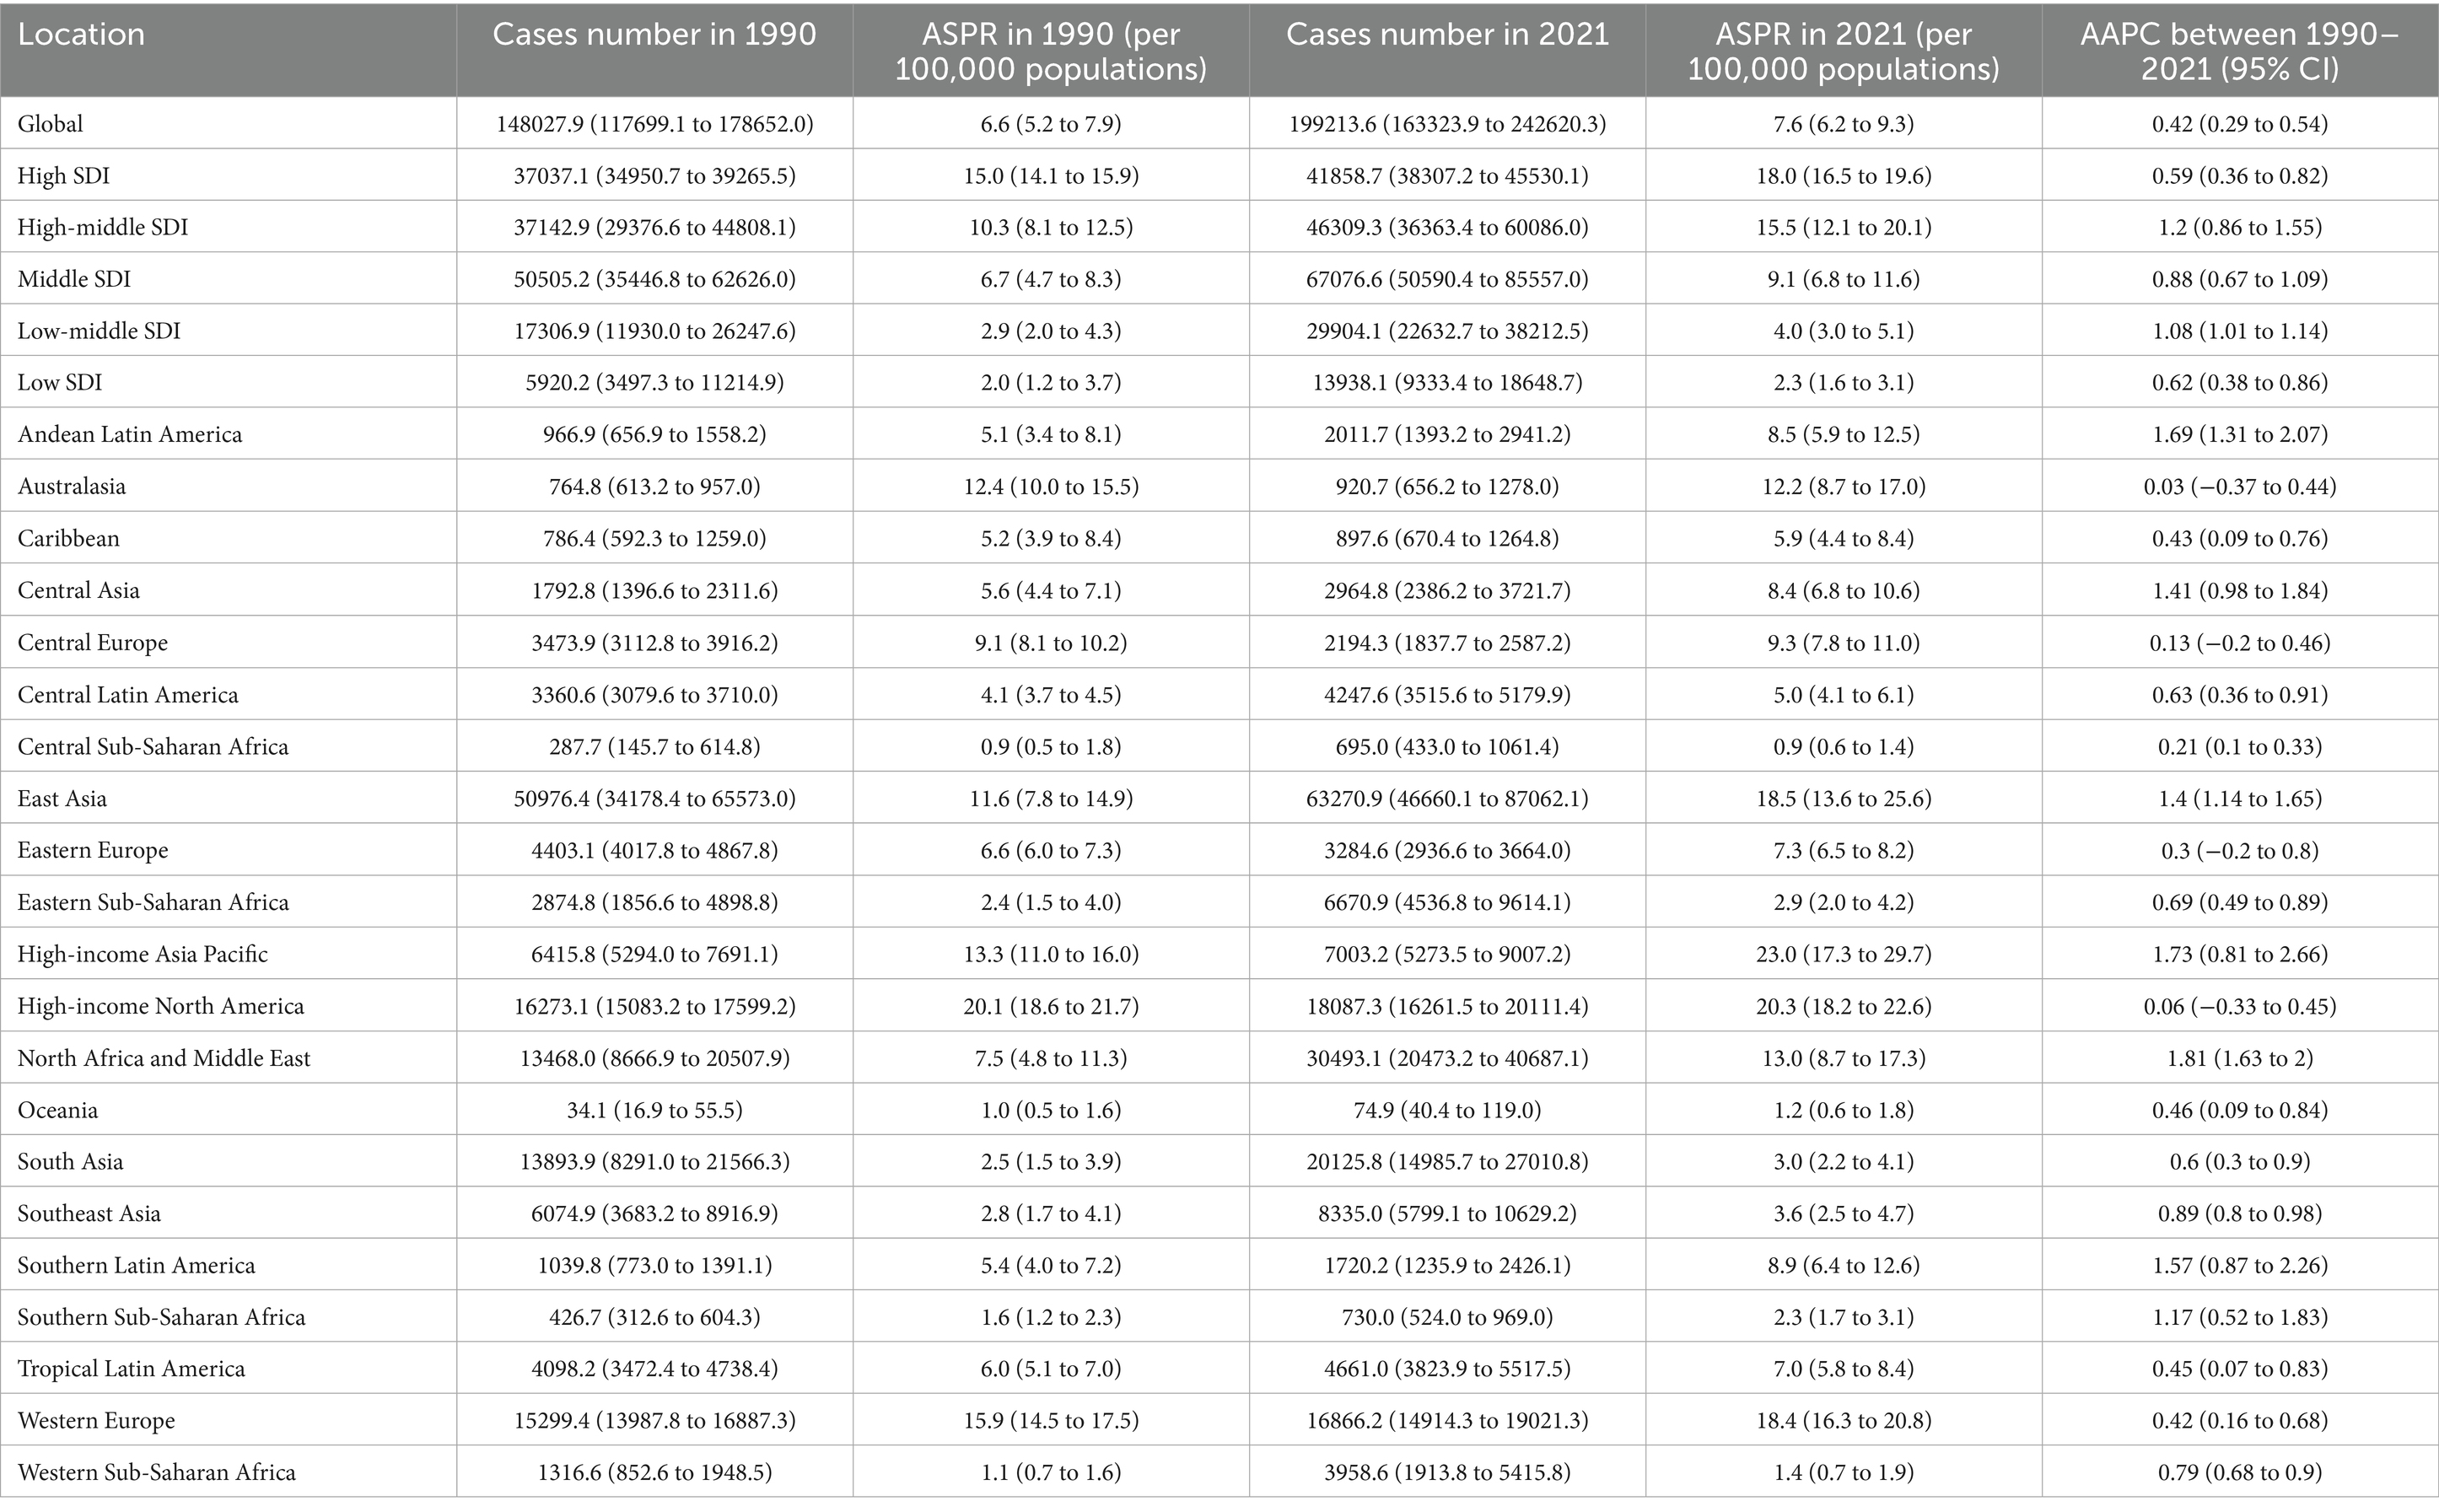
Table 1. Prevalence of CABCs between 1990 and 2021 at the global and regional levels.
Joinpoint regression analysis revealed that the global ASPR increased until 2019, after which it declined significantly (APC = −4.04) (Figure 2). Meanwhile, ASIR slightly increased from 2004 to 2019 (APC = 0.31) (Supplementary Figure 1). Over the past three decades, both ASMR and ASDR consistently decreased (Supplementary Figures 2, 3).

Figure 2. Joinpoint regression analysis of prevalence of CABCs at global and SDI levels (1990–2021). SDI, socio-demographic index; CABCs, childhood and adolescent brain and central nervous system cancers; ASPR, age-standardized prevalence rate; AAPC, average annual percentage changes. APC, annual percentage change.
SDI burden of CABCs
The burden of CABCs varied significantly by SDI level. High SDI regions consistently exhibited the highest ASPR, followed by High-Middle SDI regions, which also maintained higher ASIRs. For ASMR and ASDR, High-Middle SDI regions showed elevated levels, while Low SDI regions had the lowest rates across all metrics (Figure 1). In 2021, High SDI regions had the highest ASPR at 18.0 (95% UI: 16.5 to 19.6), while High-Middle SDI regions reported the highest ASIR, ASMR, and ASDR at 2.6 (95% UI: 2.1 to 3.4), 0.9 (95% UI: 0.8 to 1.2), and 76.3 (95% UI: 62.3 to 96.0), respectively (Table 1 and Supplementary Table 1).
From 1990 to 2021, prevalence increased across all SDI regions, with High-Middle SDI regions experiencing the highest growth rate (AAPC = 1.2, 95% CI: 0.86 to 1.55). Notably, Low SDI regions experienced a gradual but consistent increase in prevalence, suggesting a growing burden. While incidence decreased in High-Middle and Middle SDI regions, other SDI regions, particularly Low SDI regions, saw slight increases in incidence. Mortality and DALYs increased minimally in Low SDI regions (AAPC = 0.06, 95% CI: −0.15 to 0.26 and AAPC = 0.04, 95% CI: −0.16 to 0.24, respectively), but decreased in other SDI regions (Table 1 and Supplementary Table 1).
Post-2019 trends highlighted regional disparities, with Low SDI regions showing a worrying trend of stagnation and gradual increase in several metrics. While ASPR declined in all SDI regions except Low SDI, where it remained stable, the burden in Low SDI regions did not decrease as significantly as in other regions. High-Middle SDI regions experienced the most significant decline in ASPR (APC = −6.18) (Figure 2). Conversely, ASIR in Low SDI regions showed a steady increase, reflecting a lack of significant progress in reducing disease burden (Supplementary Figure 1). Low-Middle and Low SDI regions showed flatter trends for ASIR, ASMR, and ASDR, but these rates began declining only after 2016, indicating a delayed response to interventions (Supplementary Figures 2, 3).
The Middle SDI region had the highest burden, particularly among children aged 0–14 years. Increases in prevalence were most notable in 10–14-year-olds, while mortality and DALYs were concentrated in younger children. However, Low SDI regions showed a concerning annual increase in all metrics, particularly in children under 5, underscoring the increasing burden in these areas (Supplementary Figure 4).
Regional burden of CABCs
The burden of CABCs displayed significant regional variation. East Asia reported the highest overall burden across all age groups, followed by South Asia and North Africa and the Middle East. In contrast, Sub-Saharan Africa, particularly in the Western and Eastern regions, saw annual increases in burden, especially among children under 5 years old. Oceania, on the other hand, exhibited the lowest burden across all age groups (Supplementary Figure 5).
In 2021, East Asia had the highest prevalence (63,270.9; 95% UI: 46,660.1 to 87,062.1) and incidence (10,667.4; 95% UI: 7,894.9 to 14,713.6), with an ASIR of 3.1 (95% UI: 2.3 to 4.3). South Asia recorded the highest number of deaths and DALYs, while Central Asia exhibited the highest ASMR and ASDR (Table 1 and Supplementary Table 1).
When comparing the situation to 1990, prevalence increased across all regions. Notably, North Africa and the Middle East experienced the highest growth rate (AAPC = 1.81, 95% CI: 1.63 to 2.00). High-Income Asia Pacific had the highest incidence growth rate (AAPC = 1.18, 95% CI: 0.36 to 2.00), whereas Central Europe showed the smallest decrease in incidence (AAPC = −0.92, 95% CI: −1.25 to −0.59). Southern Sub-Saharan Africa experienced the largest increases in mortality and DALYs (AAPC = 1.04 and 1.03, respectively), while East Asia demonstrated the most substantial reductions in these metrics (AAPC = −2.55 and −2.60, respectively) (Table 1 and Supplementary Table 1).
A strong positive correlation was observed between ASPR and ASIR with the SDI (ρ = 0.79 and ρ = 0.73, respectively), suggesting that regions with higher SDI levels tended to have higher disease prevalence and incidence. Conversely, ASMR and ASDR showed a non-linear relationship with SDI, peaking in regions with moderate SDI levels (e.g., East Asia and Central Asia) before declining in regions with higher SDI (Supplementary Figure 6).
National burden of CABCs
On a national level, China and the United States had the highest prevalence in 2021, while China and India reported the highest incidence, deaths, and DALYs. Smaller nations, such as the Cook Islands and Niue, had the lowest numbers across all metrics due to their smaller populations (Supplementary Table 2). Monaco exhibited the highest ASPR and ASIR, at 54.4 (95% UI: 29.3 to 89.9) and 7.6 (95% UI: 4.1 to 12.5), respectively (Figures 3A,B and Supplementary Table 2). A total of 82 and 90 countries exceeded global ASPR and ASIR levels, respectively. Additionally, Tajikistan had the highest ASMR at 2.4 (95% UI: 1.5 to 3.9) (Figure 3C and Supplementary Table 2), and Tokelau reported the highest ASDR at 203.3 (95% UI: 101.6 to 315.3) (Figure 3D and Supplementary Table 2). The Gambia recorded the lowest ASPR and ASIR, while the Cook Islands had the lowest ASMR and ASDR (Figure 3 and Supplementary Table S2).
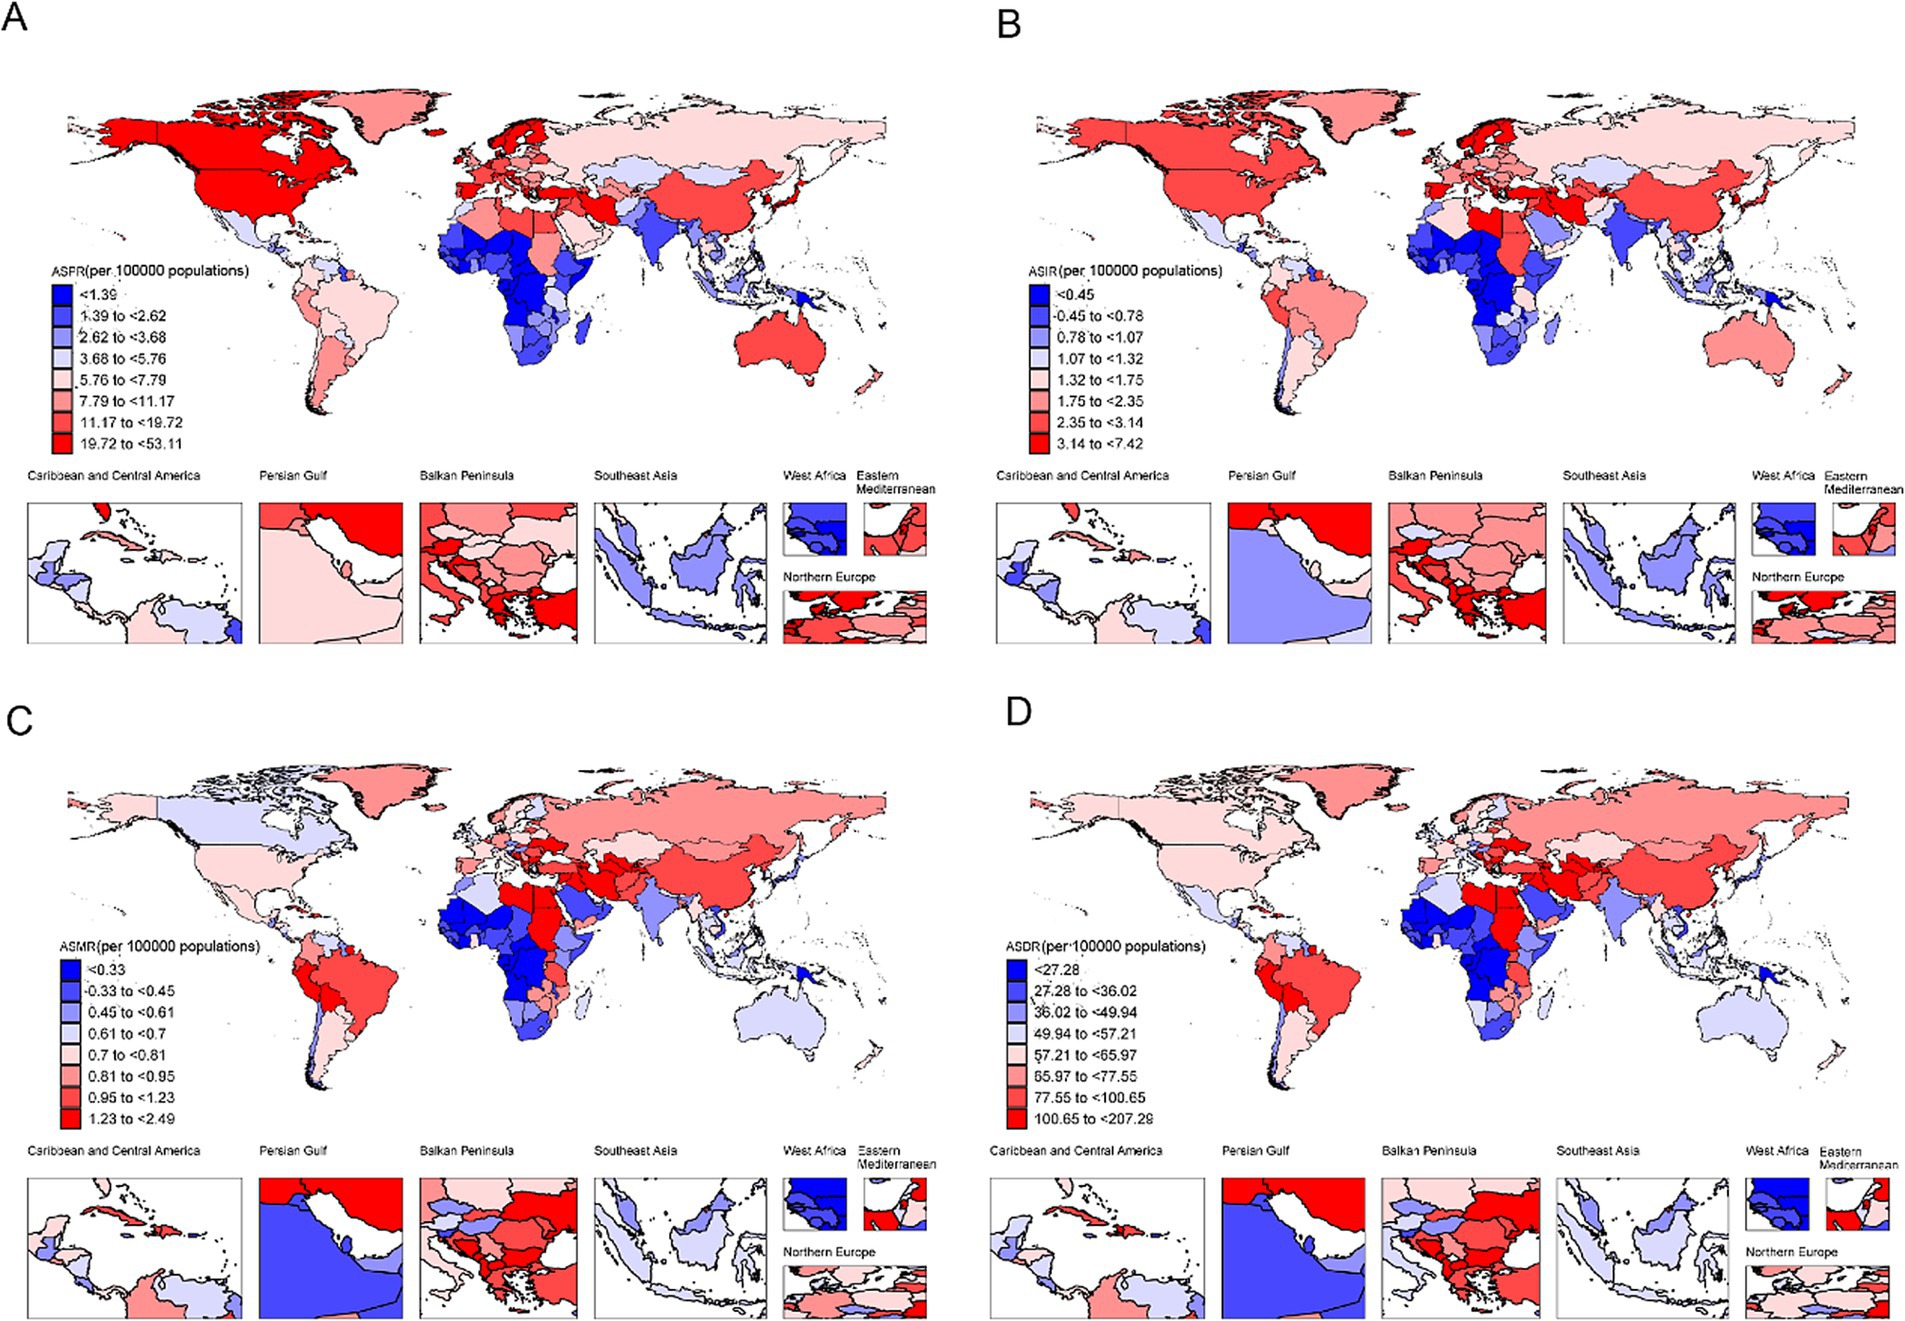
Figure 3. The burden of CABCs at national level in 2021. (A) ASPR, (B) ASIR, (C) ASMR, (D) ASDR. Countries are color-coded based on the octile (8 quantiles) of each metric, with the color gradient ranging from dark blue (lowest burden) to dark red (highest burden). The color assigned to each country represents its burden level for the specific metric in 2021. CABCs, childhood and adolescent brain and central nervous system cancers; ASPR, age-standardized prevalence rate; ASIR, age-standardized incidence rate; ASMR, age-standardized mortality rate; ASDR, age-standardized DALY rate; DALYs, disability adjusted life years.
From 1990 to 2021, countries like Tokelau experienced significant increases in prevalence, incidence, mortality, and DALYs, with AAPCs of 9.89 (95% CI: 9.42 to 10.35), 9.11 (95% CI: 8.45 to 9.77), 8.32 (95% CI: 7.52 to 9.13), and 8.44 (95% CI: 7.60 to 9.29), respectively. Greenland showed the greatest reductions in prevalence and incidence (AAPC = −1.47, 95% CI: −1.81 to −1.13; APC = −2.09, 95% CI: −2.42 to −1.75), while Serbia exhibited the largest decreases in mortality and DALYs (AAPC = −2.85, 95% CI: −3.31 to −2.38; APC = −2.89, 95% CI: −3.37 to −2.41) (Supplementary Table 2). ASPR and ASIR were positively correlated with SDI (ρ = 0.75 and ρ = 0.66, respectively), while ASMR and ASDR reached peak levels in mid-SDI regions before declining in higher-SDI areas (Supplementary Figures 7–10).
Decomposition analysis of DALYs in CABCs
Globally, DALYs decreased by 498,553, largely due to a reduction in case fatality and disease severity (contribution: −1,052,909; −211%). However, this was offset by an increase in prevalence (contribution: 283,801; 57%) and a declining population size (contribution: −59.8%). In regions with Low-SDI and Low-Middle SDI, DALYs rose by 140,352 and 78,442, respectively, driven mainly by population growth and increased prevalence. Although reductions in case fatality and disease severity mitigated some of these increases, they were insufficient to counterbalance these upward trends. In contrast, Middle-SDI, High-SDI, and High-Middle SDI regions experienced significant reductions in DALYs of −349,205, −73,230, and −294,463, respectively, largely due to improvements in case fatality and disease severity, despite rising prevalence (Figure 4).
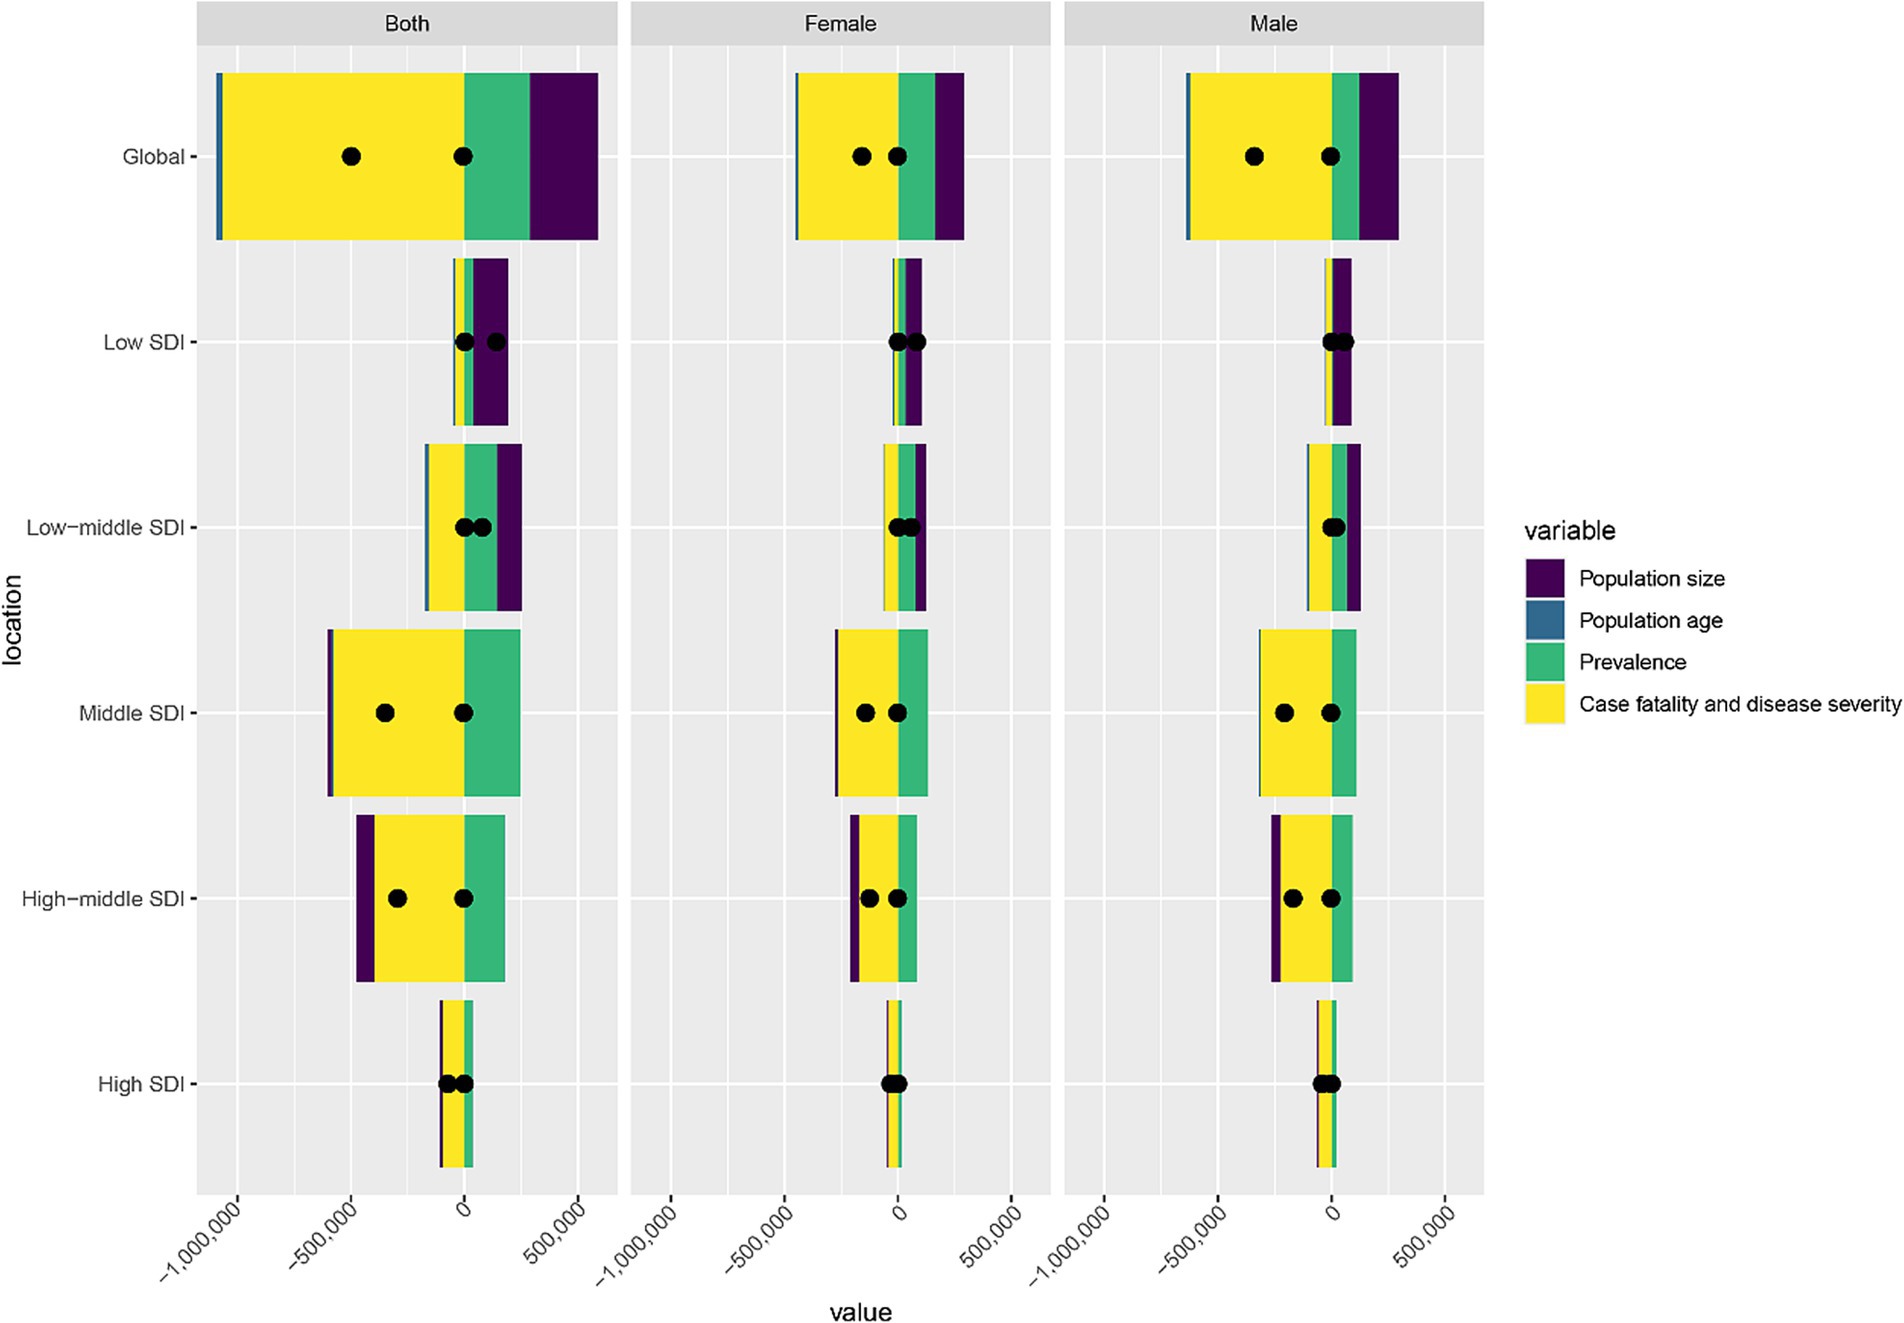
Figure 4. Decomposition analysis of DALYs burden for CABCs in 2021 by location and gender. SDI, socio-demographic index; CABCs, childhood and adolescent brain and central nervous system cancers; DALYs, disability adjusted life years.
Trends in DALYs reductions were consistent across males and females, with slightly greater reductions in males, possibly reflecting disparities in disease management or resource allocation (Figure 4). These findings underscore global progress in reducing CABCs-related mortality and severity, especially in higher-SDI regions. However, the rising prevalence and population growth in Low-SDI regions highlight the continuing challenges and the need for targeted interventions in resource-limited settings.
Age-period-cohort analysis
The Age-Period-Cohort analysis revealed distinct patterns in CABCs burden. Globally, ASPR, ASIR, ASMR, and ASDR peaked in children under 5 years of age, followed by a decline with age. This decline was more pronounced in High-SDI regions, while Low-SDI regions sustained higher overall burden levels. Notably, children aged 5–9 years in High-SDI regions exhibited higher ASIR, ASMR, and ASDR compared to other age groups (Figure 5).
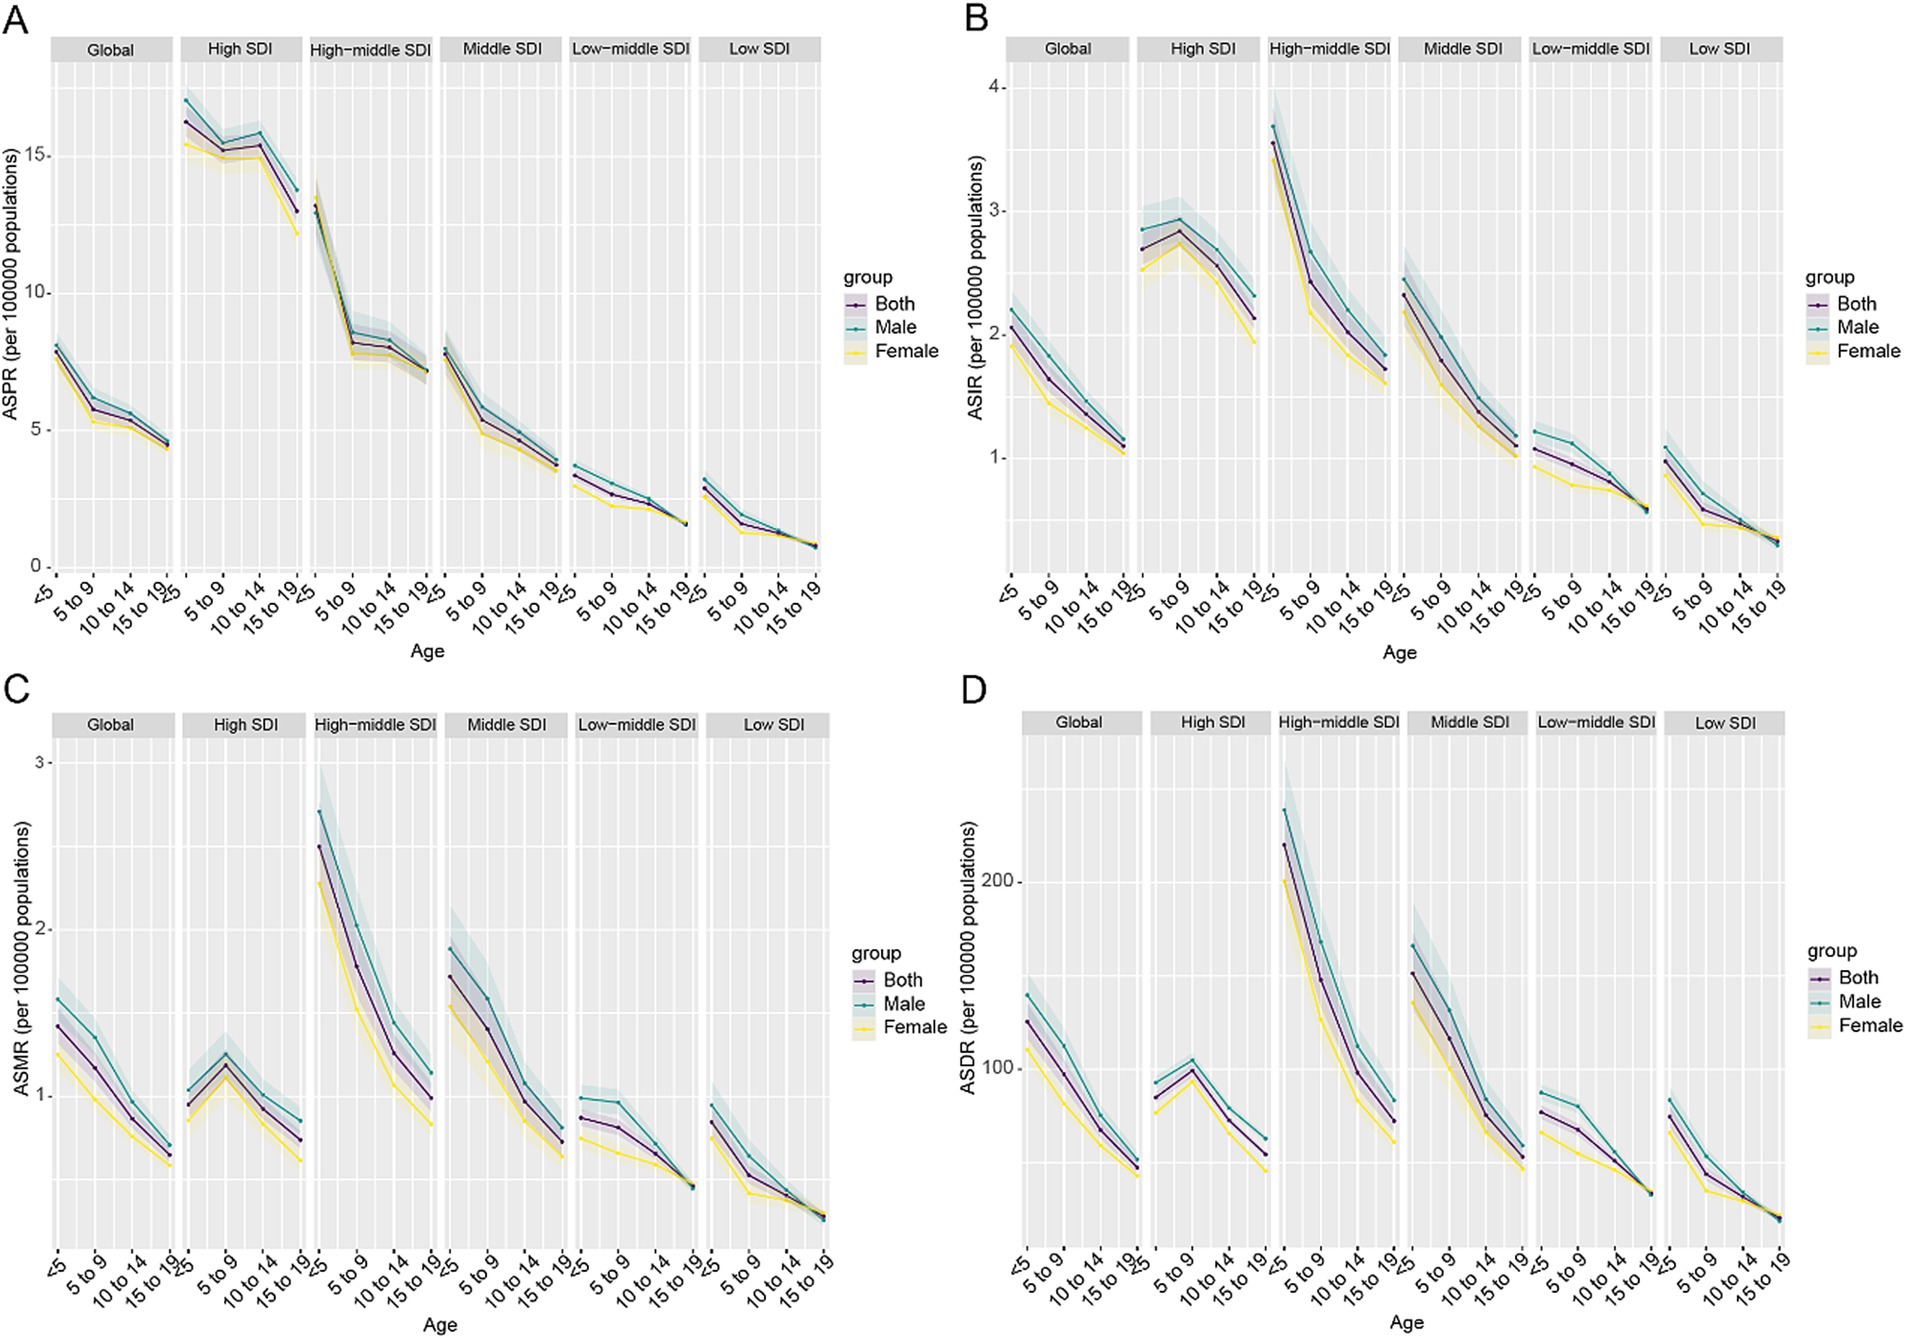
Figure 5. Age-specific trends in ASR metrics of CABCs by location and gender in 2021. (A) ASPR, (B) ASIR, (C) ASMR, (D) ASDR. SDI, socio-demographic index; CABCs, childhood and adolescent brain and central nervous system cancers; ASPR, age-standardized prevalence rate; ASIR, age-standardized incidence rate; ASMR, age-standardized mortality rate; ASDR, age-standardized DALY rate; DALYs, disability adjusted life years.
Sex differences were evident, with males generally exhibiting higher incidence and mortality rates than females (Figures 5B,C). However, in Low-SDI and Low-Middle SDI regions, females demonstrated a more pronounced increase in the risk ratio (RR) of prevalence and incidence over time, likely reflecting disparities in healthcare access and awareness. Similarly, RRs for mortality and DALYs declined globally, with significant reductions in High-SDI regions. However, a resurgence was observed among recent female cohorts in Low-SDI regions, indicating worsening disease burdens in these resource-limited settings (Supplementary Figure 11). Annual percentage changes revealed increasing prevalence and incidence with age across all SDI levels, especially among female adolescents in Low-SDI regions. Mortality and DALYs showed significant annual decreases globally, especially in High-SDI regions, emphasizing the positive impact of medical advancements. However, Low-SDI regions showed an increasing trend in mortality and DALYs among females aged 15–19 years, signaling the need for targeted interventions in this demographic (Supplementary Figure 12). Cohort effects further revealed that recent birth cohorts (2000s) experienced higher prevalence and incidence risks, particularly in Low and Low-Middle SDI regions, compared to earlier cohorts (1970s–1980s). This trend was especially notable for females, reflecting potential disparities in disease management or delayed interventions (Supplementary Figure 13).
Frontier analysis and health inequity analysis
Frontier analysis between 1990 and 2021 indicated general declines in ASMR and ASDR for CABCs across most countries. However, despite overall improvements, nations such as Monaco, Tokelau, Azerbaijan, Albania, Turkmenistan, and Uzbekistan continued to experience a substantial burden of mortality and DALYs, even in higher SDI regions (Supplementary Figure 14).
Health inequity analysis revealed an intensification of CABCs prevalence and incidence over time. From 1990 to 2021, the concentration index for ASPR increased from 0.3 to 0.37, and for ASIR, from 0.19 to 0.25 (Figures 6A–D). These findings suggest that regions with higher SDI levels consistently bore a greater burden of prevalence and incidence. On the other hand, health inequities in ASMR and ASDR showed a decline, reflected by decreasing concentration indices (from 0.09 to 0.07), indicating relative reductions in mortality and DALYs in Low-SDI regions (Figures 6E–H).
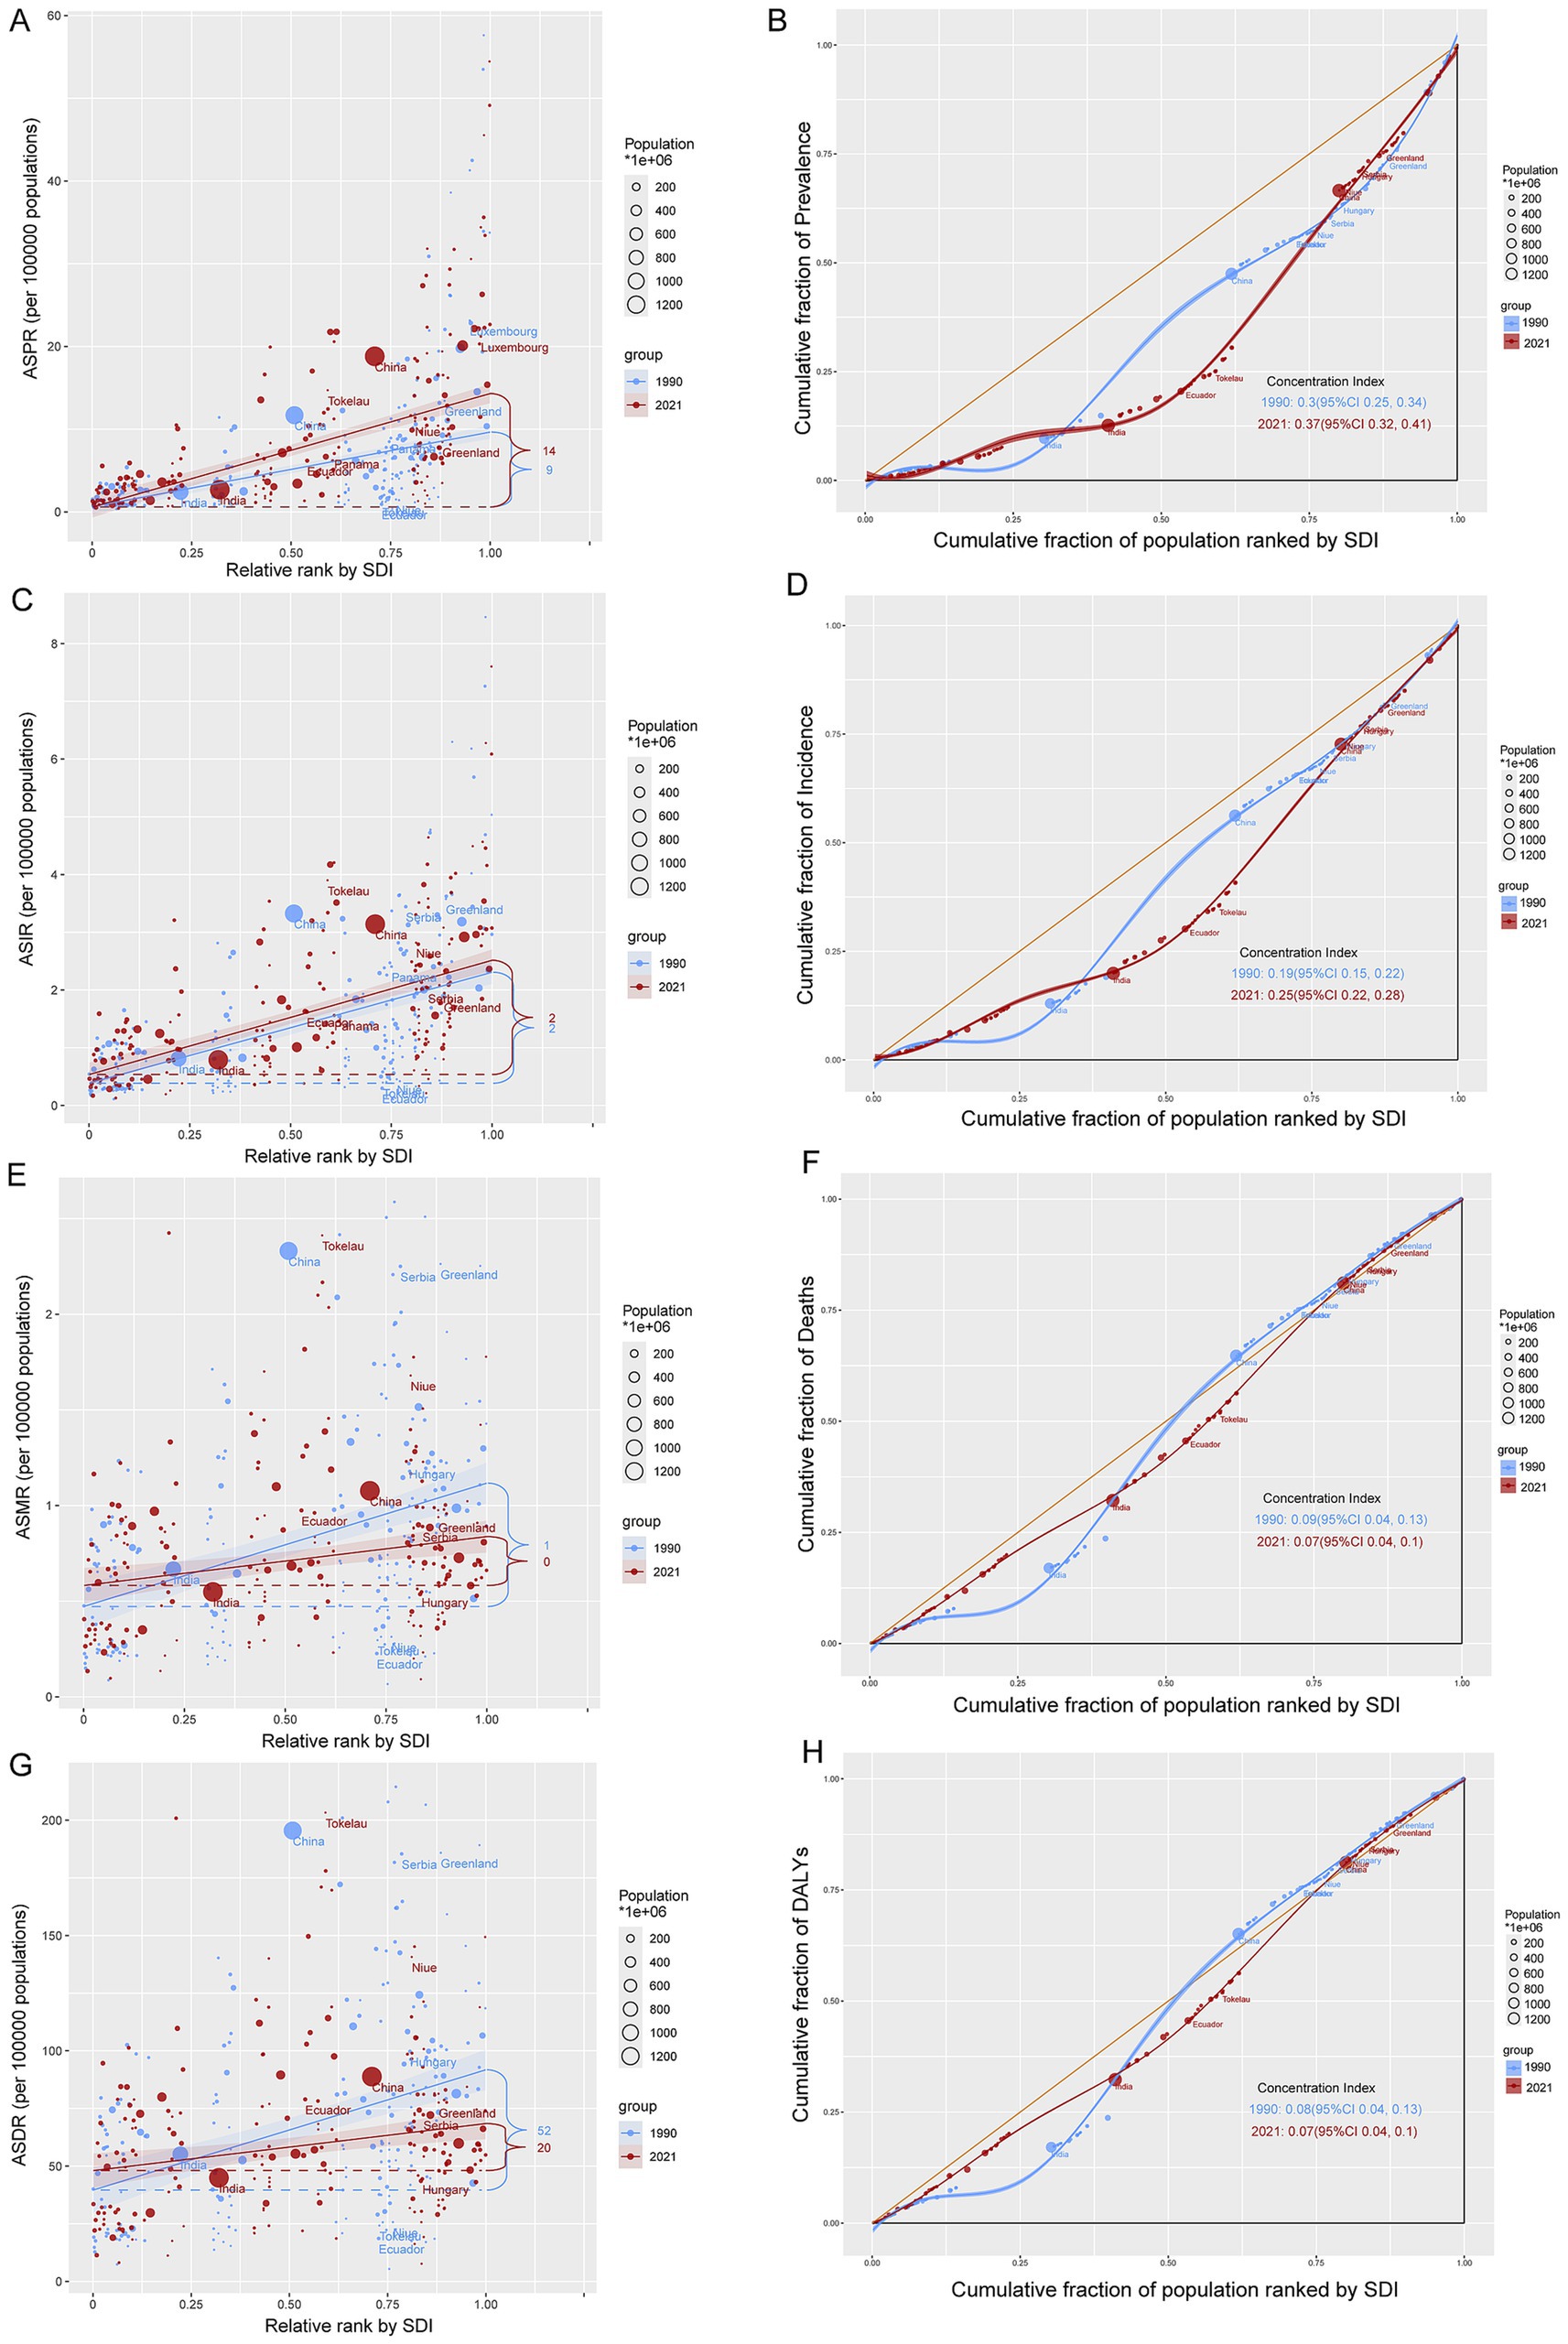
Figure 6. Absolute and relative cross-country inequality of CABCs, 1990–2021. Slope index of (A) ASPR, (C) ASIR, (E) ASMR and (G) ASDR. Countries are ranked by SDI on the x-axis. The y-axis shows the metric value. Each point represents a country, sized by its population (1990: light blue; 2021: red). The solid line (slope) indicates the health inequality trend. The numbers denote the count of countries with high values for each metric in 1990 and 2021. Concentration index of (B) prevalence, (D) incidence, (F) mortality and (H) DALYs. The y-axis shows the cumulative proportion of the disease metric burden. The yellow diagonal line represents the line of equality (where points would lie if burden was distributed equally across the SDI gradient). CI measures relative inequality across the entire socioeconomic distribution (range: −1 to +1). A positive CI indicates higher burden in higher-SDI countries; an increase in CI from 1990 to 2021 signifies worsening inequality. SDI, socio-demographic index; CABCs, childhood and adolescent brain and central nervous system cancers; ASPR, age-standardized prevalence rate; ASIR, age-standardized incidence rate; ASMR, age-standardized mortality rate; ASDR, age-standardized DALY rate; DALYs, disability adjusted life years.
Discussion
This study analyzes the global, regional, and national burden of CABCs from 1990 to 2021. Our findings indicate that while the ASPR and ASIR remained relatively stable globally, there was a consistent annual decline in ASMR and ASDR across both sexes. In 2021, global CABCs prevalence reached 199,214 cases, with substantial variations across SDI regions and geographical areas. High SDI regions exhibited the highest ASPR and ASIR, likely due to advanced diagnostic capabilities and improved case detection, whereas low SDI regions showed alarming increases in prevalence, incidence, mortality, and DALYs despite having the lowest overall burden. These trends underscore both progress in management and widening healthcare disparities.
The stability of ASPR and ASIR globally suggests no significant increase in actual CABCs occurrence over three decades, potentially reflecting advancements in diagnostic technologies enabling earlier detection rather than true rising incidence (24–27). However, underdiagnosis remains a critical concern in low SDI regions, where limited diagnostic tools, incomplete cancer registries, and delayed healthcare-seeking behaviors (28, 29) may lead to case underestimation. Discrepancies between high and low SDI regions arise not only from true disease frequency differences but also variations in diagnostic capacity. High SDI countries benefit from universal health coverage, advanced imaging (MRI, CT), and robust cancer surveillance, while low SDI regions often lack infrastructure, resulting in missed diagnoses and artificially lower reported burdens.
The consistent decline in ASMR and ASDR indicates substantial improvements in treatment outcomes, particularly in high SDI regions. This progress stems from medical advancements (30), early diagnosis (31), and more effective therapies (32), including multimodal approaches with advanced radiotherapy, targeted treatments, and immunotherapies (33–36). However, increasing CABCs survivors highlight the growing need for long-term follow-up addressing neurological, cognitive, and psychosocial challenges through integrated rehabilitation and survivorship care (37–40).
Distinct regional disparities exist. High and High-Middle SDI regions show elevated ASPR and ASIR, likely reflecting enhanced diagnostics through screening and advanced imaging (41–43) rather than genuine incidence increases. Conversely, Low SDI regions face rising prevalence, incidence, mortality, and DALYs, driven by population growth (44), environmental/genetic risk factors (45), malnutrition, poor maternal-child healthcare, and environmental toxins (46, 47). Late-stage diagnoses due to limited healthcare access (48) worsen outcomes in these regions. Mortality and DALY declines in higher SDI regions underscore the importance of early detection programs and advanced treatments (29).
Significant geographic variations were observed, with East Asia bearing the highest burden, followed by South Asia and North Africa/Middle East. These patterns may stem from genetic predispositions, environmental exposures (49), healthcare infrastructure, and resource access (50). East Asian populations may have higher susceptibility to specific CNS tumors potentially due to genetics, while air pollution, diet, and prenatal factors (51) could contribute. Western and Eastern Sub-Saharan Africa experience rising burden among children under five, highlighting urgent needs for pediatric oncology services and diagnostics (44). The lack of specialized facilities and trained oncologists exacerbates disparities, necessitating region-specific interventions like expanding MRI/CT access and professional training (52). Oceania maintains the lowest burden, possibly due to smaller populations and effective healthcare (53).
At the national level, populous countries like China, India, and the United States report the highest cases, deaths, and DALYs, reflecting large populations (54) and higher detection rates (55). Smaller nations like Cook Islands report the lowest burdens. Interestingly, Monaco and Tokelau have exceptionally high ASPR and ASIR, possibly due to advanced diagnostics in Monaco (56) and small population effects in Tokelau (57). These national disparities highlight healthcare infrastructure, public health policies, and socioeconomic conditions (58–60) as critical determinants, requiring tailored interventions.
Decomposition analysis reveals that the global ~50% DALY reduction primarily results from improved case fatality and reduced severity (45), driven by multidisciplinary care teams and oncology centers (61). However, prevalence increases and population growth partially offset gains in low SDI regions. Despite case fatality improvements (62), rising affected child numbers outpace healthcare capacity (63), straining limited resources and demanding urgent investments in early detection and capacity building.
Age-Period-Cohort analysis shows the highest burden among children under five, with more pronounced declines in ASMR/ASDR in High SDI regions (64), highlighting the role of early intervention. In Low and Low-Middle SDI regions, relative risk for prevalence and incidence increased over time, particularly among females (65), suggesting emergent gender-based barriers in patriarchal societies where girls face delayed care. This female-specific increase may partly reflect cultural and structural barriers—such as restrictions on girls’ mobility, lower household decision-making power, and discriminatory attitudes of providers—that delay diagnosis and treatment; intersectionality work in agro-pastoral Tanzania and WHO analyses highlight how these factors disproportionately hinder girls’ access to care (66, 67). Conversely, declining mortality and DALYs in High SDI regions reflect established oncology services and survivorship programs (29, 68).
Frontier analysis identifies inefficiencies relative to expected burdens. Countries like Monaco and Tokelau show gaps between observed ASDR and frontier values (69), indicating potential inefficiencies in resource use or systemic care barriers requiring optimized diagnostics and care coordination (70). Conversely, Tajikistan and Uzbekistan represent priorities for international aid given their disproportionately high disease burdens, necessitating cost-effective diagnostics like portable MRI (71), workforce training, and regional treatment hubs (9). We note that our frontier analysis represents relative efficiency in converting health-system inputs into outcomes, and does not imply an absolute minimum incidence or mortality rate achievable regardless of genetic, environmental, or other non-health-system determinants.
Health inequity analysis confirms widening disparities, with concentrated ASMR/ASDR burdens (negative Concentration Index) in low-SDI regions due to diagnostic/treatment barriers (63). Global initiatives like WHO’s ‘Global Initiative for Childhood Cancer’ must prioritize low-SDI regions through funding, technical support (72), and community health worker integration (73) to facilitate early referrals. While High SDI regions show increased prevalence/incidence from superior diagnostics, low-SDI regions require enhanced cancer registries and provider training to address underreporting (74).
The study highlights critical global health inequities, emphasizing persistently high low-SDI mortality requiring interventions like portable MRI for early detection and regional treatment centers. Strengthening global collaboration through WHO programs (29), developing regional oncology networks for resource sharing, and workforce initiatives (75) are essential. Prevention strategies including nutritional support and school-based screenings (76) can reduce risks. Together, these measures can enhance diagnostics and treatment while reducing inequities in resource-limited settings.
Despite these insights, our study has limitations. The reliance on GBD data and aggregated metrics may introduce measurement bias and limit histology-specific analyses. For example, limited cancer registry data in low-income regions may underestimate the true disease burden, while variations in diagnostic criteria across regions can lead to inconsistencies. Regional differences in data quality, incomplete cancer registries, and diagnostic criteria variations can influence observed patterns. Although we adjusted for cancer registry completeness, estimates in low-SDI countries remain considerably less precise: the 95% UIs are approximately 3 times larger than in high-SDI settings (see Table 1 and Supplementary Tables). Such wider intervals may obscure true geographic differences in burden and should be interpreted with caution. Moreover, because detailed histology-specific data (e.g., on medulloblastoma vs. glioma) were unavailable, our aggregate estimates of childhood and adolescent brain cancer may conceal divergent trends by subtype, which could limit the specificity of policy recommendations. Future research should incorporate more detailed data, investigate genetic and environmental risk factors, and conduct longitudinal cohort studies to clarify causality. Additionally, qualitative research on healthcare access barriers in low-SDI settings can guide could inform context-specific interventions and policy reforms.
Conclusion
This study highlights significant progress in reducing mortality and DALYs associated with CABC globally, especially in high-SDI regions. However, the increasing prevalence and burden in low- and low-middle SDI regions underscore ongoing and emerging challenges. Addressing these disparities requires targeted public health interventions, equitable resource allocation, and continued advancements in medical care. By understanding the complex dynamics of CABC burden across different socio-demographic contexts, stakeholders can develop informed strategies to mitigate the global impact of these devastating cancers on children and adolescents.
Data availability statement
The original contributions presented in the study are included in the article/Supplementary material, further inquiries can be directed to the corresponding authors.
Ethics statement
Ethical approval was not required for the study involving humans in accordance with the local legislation and institutional requirements. Written informed consent to participate in this study was not required from the participants or the participants’ legal guardians/next of kin in accordance with the national legislation and the institutional requirements.
Author contributions
LL: Conceptualization, Data curation, Funding acquisition, Investigation, Methodology, Supervision, Validation, Visualization, Writing – original draft, Writing – review & editing. CC: Conceptualization, Investigation, Validation, Writing – original draft. QZ: Conceptualization, Data curation, Investigation, Methodology, Writing – original draft. CF: Conceptualization, Investigation, Methodology, Writing – original draft. JF: Conceptualization, Supervision, Writing – original draft.
Funding
The author(s) declare that financial support was received for the research and/or publication of this article. This study was supported by Nantong University Special Research Fund for Clinical Medicine (2024JZ026), Nantong Municipal Health Commission (MS2024103), Qidong Municipal Science and Technology Program (2024).
Conflict of interest
The authors declare that the research was conducted in the absence of any commercial or financial relationships that could be construed as a potential conflict of interest.
Generative AI statement
The authors declare that no Gen AI was used in the creation of this manuscript.
Any alternative text (alt text) provided alongside figures in this article has been generated by Frontiers with the support of artificial intelligence and reasonable efforts have been made to ensure accuracy, including review by the authors wherever possible. If you identify any issues, please contact us.
Publisher’s note
All claims expressed in this article are solely those of the authors and do not necessarily represent those of their affiliated organizations, or those of the publisher, the editors and the reviewers. Any product that may be evaluated in this article, or claim that may be made by its manufacturer, is not guaranteed or endorsed by the publisher.
Supplementary material
The Supplementary material for this article can be found online at: https://www.frontiersin.org/articles/10.3389/fpubh.2025.1591309/full#supplementary-material
Abbreviations
CABC, Childhood and Adolescent Brain and Central Nervous System Cancer; GBD, Global Burden of Disease; ASPR, Age-Standardized Prevalence Rate; ASIR, Age-Standardized Incidence Rate; ASMR, Age-Standardized Mortality Rate; ASDR, Age-Standardized DALY Rate; DALYs, Disability-Adjusted Life Years; AAPC, Average Annual Percentage Change; APC, Annual Percentage Change; SDI, Sociodemographic Index; WHO, World Health Organization; SII, Slope Index of Inequality; CI, Concentration Index; LOESS, Locally Weighted Regression; UI, Uncertainty Interval; ICD-10, International Classification of Diseases, 10th Revision; R, R programming language; GHDx, Global Health Data Exchange.
References
1. Steliarova-Foucher, E, Colombet, M, Ries, LAG, Moreno, F, Dolya, A, Bray, F, et al. International incidence of childhood cancer, 2001-10: a population-based registry study. Lancet Oncol. (2017) 18:719–31. doi: 10.1016/S1470-2045(17)30186-9
2. Ward, E, DeSantis, C, Robbins, A, Kohler, B, and Jemal, A. Childhood and adolescent cancer statistics, 2014. CA Cancer J Clin. (2014) 64:83–103. doi: 10.3322/caac.21219
3. Gatta, G, Botta, L, Rossi, S, Aareleid, T, Bielska-Lasota, M, Clavel, J, et al. Childhood cancer survival in Europe 1999-2007: results of EUROCARE-5--a population-based study. Lancet Oncol. (2014) 15:35–47. doi: 10.1016/S1470-2045(13)70548-5
4. Kaatsch, P. Epidemiology of childhood cancer. Cancer Treat Rev. (2010) 36:277–85. doi: 10.1016/j.ctrv.2010.02.003
5. Kulubya, ES, Kercher, MJ, Phillips, HW, Antony, R, and Edwards, MSB. Advances in the treatment of Pediatric brain Tumors. Children. (2022) 10:62. doi: 10.3390/children10010062
6. Cohen, AR. Brain Tumors in children. N Engl J Med. (2022) 386:1922–31. doi: 10.1056/NEJMra2116344
7. Allemani, C, Matsuda, T, Di Carlo, V, Harewood, R, Matz, M, Niksic, M, et al. Global surveillance of trends in cancer survival 2000-14 (CONCORD-3): analysis of individual records for 37 513 025 patients diagnosed with one of 18 cancers from 322 population-based registries in 71 countries. Lancet. (2018) 391:1023–75. doi: 10.1016/S0140-6736(17)33326-3
8. Osorio, DS, Qaddoumi, I, and Moreira, DC. Editorial: Pediatric CNS tumors in low- and middle-income countries: expanding our understanding. Front Oncol. (2025) 15:1548727. doi: 10.3389/fonc.2025.1548727
9. Ezzat, S, Kamal, M, El-Khateeb, N, El-Beltagy, M, Taha, H, Refaat, A, et al. Pediatric brain tumors in a low/middle income country: does it differ from that in developed world? J Neuro-Oncol. (2016) 126:371–6. doi: 10.1007/s11060-015-1979-7
10. Agrawal, S, and Bansal, N. Advances and challenges in pediatric cancers. Cancer Reports. (2019) 2:2. doi: 10.1002/cnr2.1202
11. Piscitelli, P, Marino, I, Falco, A, Rivezzi, M, Romano, R, Mazzella, R, et al. Hospitalizations in Pediatric and adult patients for all Cancer type in Italy: the EPIKIT study under the E.U. COHEIRS project on environment and health. Int J Environ Res Public Health. (2017) 14:14. doi: 10.3390/ijerph14050495
12. Siegel, RL, Miller, KD, Fuchs, HE, and Jemal, A. Cancer statistics, 2021. CA Cancer J Clin. (2021) 71:7–33. doi: 10.3322/caac.21654
13. Howard, SC, Metzger, ML, Wilimas, JA, Quintana, Y, Pui, CH, Robison, LL, et al. Childhood cancer epidemiology in low-income countries. Cancer. (2008) 112:461–72. doi: 10.1002/cncr.23205
14. Smith, ER, Cotache-Condor, C, Leraas, H, Truche, P, Ward, ZJ, Stefan, C, et al. Towards attainment of the 2030 goal for childhood cancer survival for the World Health Organization global initiative for childhood Cancer: an ecological, cross-sectional study. PLOS Glob Public Health. (2024) 4:e0002530. doi: 10.1371/journal.pgph.0002530
15. Diseases, GBD, and Injuries, C. Global incidence, prevalence, years lived with disability (YLDs), disability-adjusted life-years (DALYs), and healthy life expectancy (HALE) for 371 diseases and injuries in 204 countries and territories and 811 subnational locations, 1990-2021: a systematic analysis for the global burden of disease study 2021. Lancet. (2024) 403:2133–61. doi: 10.1016/S0140-6736(24)00757-8
16. Ferlay, J, Colombet, M, Soerjomataram, I, Mathers, C, Parkin, DM, Pineros, M, et al. Estimating the global cancer incidence and mortality in 2018: GLOBOCAN sources and methods. Int J Cancer. (2019) 144:1941–53. doi: 10.1002/ijc.31937
17. Ward, ZJ, Yeh, JM, Bhakta, N, Frazier, AL, Girardi, F, and Atun, R. Global childhood cancer survival estimates and priority-setting: a simulation-based analysis. Lancet Oncol. (2019) 20:972–83. doi: 10.1016/S1470-2045(19)30273-6
18. IHME, GHDx. Global burden of disease study 2021 (GBD 2021) socio-demographic index (SDI) 1950–2021 (2021). Available online at: https://ghdx.healthdata.org/record/global-burden-disease-study-2021-gbd-2021-socio-demographic-index-sdi-1950-2021 (accessed March 5, 2025)
19. Kim, HJ, Fay, MP, Feuer, EJ, and Midthune, DN. Permutation tests for joinpoint regression with applications to cancer rates. Stat Med. (2000) 19:335–51. doi: 10.1002/(SICI)1097-0258(20000215)19:3<335::AID-SIM336>3.0.CO;2-Z
20. Yang, Y, and Land, KC. Age-period-cohort analysis: New models, methods, and empirical applications. New York: Chapman and Hall/CRC (2013).
21. Ahlbom, A. Modern epidemiology, 4th edition. TL lash, TJ Vander Weele, S Haneuse, KJ Rothman. Wolters Kluwer, 2021. Eur J Epidemiol. (2021) 36:767–8. doi: 10.1007/s10654-021-00778-w
22. Kakwani, N, Wagstaff, A, and van Doorslaer, E. Socioeconomic inequalities in health: measurement, computation, and statistical inference. J Econom. (1997) 77:87–103. doi: 10.1016/S0304-4076(96)01807-6
23. Murray, CJ, and Lopez, AD. Measuring the global burden of disease. N Engl J Med. (2013) 369:448–57. doi: 10.1056/NEJMra1201534
24. Williams, LA, Hubbard, AK, Scheurer, ME, Spector, LG, and Poynter, JN. Trends in paediatric central nervous system tumour incidence by global region from 1988 to 2012. Int J Epidemiol. (2021) 50:116–27. doi: 10.1093/ije/dyaa176
25. Desandes, E, Guissou, S, Chastagner, P, and Lacour, B. Incidence and survival of children with central nervous system primitive tumors in the French National Registry of childhood solid Tumors. Neuro-Oncology. (2014) 16:975–83. doi: 10.1093/neuonc/not309
26. Withrow, DR, Berrington de Gonzalez, A, Lam, CJK, Warren, KE, and Shiels, MS. Trends in Pediatric central nervous system tumor incidence in the United States, 1998-2013. Cancer Epidemiol Biomarkers Prev. (2019) 28:522–30. doi: 10.1158/1055-9965.EPI-18-0784
27. Ribeiro, K, and Epelman, S. Temporal and global geographic variation in the incidence of pediatric CNS tumors, 1998–2012 EPID-12. Neuro-Oncol. (2020) 22:iii321. doi: 10.1093/neuonc/noaa222.198
28. Crowell, C, Crooks, B, Walling, S, Boileau, K, Bowes, L, Rutledge, R, et al. RARE-01. Assessing the symptom diagnostic interval for children with central nervous system tumours. Neuro-oncol. (2021) 23: i40-i40. doi: 10.1093/neuonc/noab090.162
29. Wang, P, Huang, S, Shi, X, Xu, H, Wang, R, Peng, J, et al. Global, regional, and national burdens of cancer in children aged zero to nine years from 1990 to 2019. J Glob Health. (2024) 14:04104. doi: 10.7189/jogh.14.04104
30. Fruhwald, MC, and Rutkowski, S. Tumors of the central nervous system in children and adolescents. Dtsch Arztebl Int. (2011) 108:390–7. doi: 10.3238/arztebl.2011.0390
31. Journy, NMY, Zrafi, WS, Bolle, S, Fresneau, B, Alapetite, C, Allodji, RS, et al. Risk factors of subsequent central nervous system Tumors after childhood and adolescent cancers: findings from the French childhood Cancer survivor study. Cancer Epidemiol Biomarkers Prev. (2021) 30:133–41. doi: 10.1158/1055-9965.EPI-20-0735
32. Brinkman, TM, Krasin, MJ, Liu, W, Armstrong, GT, Ojha, RP, Sadighi, ZS, et al. Long-term neurocognitive functioning and social attainment in adult survivors of Pediatric CNS Tumors: results from the St Jude lifetime cohort study. J Clin Oncol. (2016) 34:1358–67. doi: 10.1200/JCO.2015.62.2589
33. Polivka, J Jr, Polivka, J, Holubec, L, Kubikova, T, Priban, V, Hes, O, et al. Advances in experimental targeted therapy and immunotherapy for patients with glioblastoma multiforme. Anticancer Res. (2017) 37:21–33. doi: 10.21873/anticanres.11285
34. Tang, L, Zhang, M, and Liu, C. Advances in nanotechnology-based immunotherapy for glioblastoma. Front Immunol. (2022) 13:882257. doi: 10.3389/fimmu.2022.882257
35. Yifan, YZ, Huntoon, K, Jiang, W, and Kim, B. Advanced immunotherapy approaches for glioblastoma. Adv Ther. (2021) 4:2100046. doi: 10.1002/adtp.202100046
36. Armstrong, GT, Liu, Q, Yasui, Y, Huang, S, Ness, KK, Leisenring, W, et al. Long-term outcomes among adult survivors of childhood central nervous system malignancies in the childhood Cancer survivor study. J Natl Cancer Inst. (2009) 101:946–58. doi: 10.1093/jnci/djp148
37. Bhatia, S, Tonorezos, ES, and Landier, W. Clinical care for people who survive childhood cancer: a review. JAMA. (2023) 330:1175–86. doi: 10.1001/jama.2023.16875
38. He, F, Huang, H, Ye, L, Wen, X, and Cheng, ASK. Meta-analysis of neurocognitive rehabilitation for cognitive dysfunction among pediatric cancer survivors. J Cancer Res Ther. (2022) 18:2058–65. doi: 10.4103/jcrt.jcrt_1429_22
39. Otth, M, Wyss, J, and Scheinemann, K. Long-term follow-up of pediatric CNS tumor survivors-a selection of relevant long-term issues. Children. (2022) 9:447. doi: 10.3390/children9040447
40. Stavinoha, PL, Askins, MA, Powell, SK, Pillay Smiley, N, and Robert, RS. Neurocognitive and psychosocial outcomes in Pediatric brain tumor survivors. Bioengineering. (2018) 5:73. doi: 10.3390/bioengineering5030073
41. Hou, X, Song, Z, Zhang, F, Liu, Z, Long, W, Long, Z, et al. Burden of brain and other central nervous system cancer in China, 1990-2019: a systematic analysis of observational data from the global burden of disease study 2019. BMJ Open. (2022) 12:e059699. doi: 10.1136/bmjopen-2021-059699
42. Thompson, JA, Carozza, SE, and Zhu, L. Geographic risk modeling of childhood cancer relative to county-level crops, hazardous air pollutants and population density characteristics in Texas. Environ Health. (2008) 7:45. doi: 10.1186/1476-069X-7-45
43. Zhang, Y, Ding, Y, Zhu, N, Mi, M, Lu, Y, Zheng, J, et al. Emerging patterns and trends in global cancer burden attributable to metabolic factors, based on the global burden of disease study 2019. Front Oncol. (2023) 13:1032749. doi: 10.3389/fonc.2023.1032749
44. Ren, HM, Liao, MQ, Tan, SX, Cheng, C, Zhu, S, Zheng, L, et al. Global, regional, and National Burden of Cancer in children younger than 5 years, 1990-2019: analysis of the global burden of disease study 2019. Front Public Health. (2022) 10:910641. doi: 10.3389/fpubh.2022.910641
45. Maimaiti, A, Tuersun, M, Wang, X, Mijiti, M, Wu, H, Cong, C, et al. Global, regional, and National Burden of brain and central nervous system cancers for males from 1990 to 2021 and its predicted level in the next 25 years. Neuroepidemiology. (2024):1–20. doi: 10.1159/000541917
46. Li, H, Ren, H, Guo, X, and Chen, Z. Nutritional deficiencies in low-sociodemographic-index countries: a population-based study. Front Nutr. (2023) 10:985221. doi: 10.3389/fnut.2023.985221
47. Ji, S, Zhou, Y, Zhao, Q, Chen, R, and Su, Z. Trends in three malnutrition factors in the global burden of disease: iodine deficiency, vitamin a deficiency, and protein-energy malnutrition (1990-2019). Front Nutr. (2024) 11:1426790. doi: 10.3389/fnut.2024.1426790
48. Boua, PR, Rouamba, T, Bambara, E, Kabore, S, Compaore, EWR, Ouedraogo, B, et al. Undernutrition in children aged 0-59 months by region and over time: secondary analysis of the Burkina Faso 2012-2018 National Nutrition Surveys. BMJ Open. (2023) 13:e066509. doi: 10.1136/bmjopen-2022-066509
49. Ko, KP, Shin, A, Cho, S, Park, SK, and Yoo, KY. Environmental contributions to gastrointestinal and liver cancer in the Asia-Pacific region. J Gastroenterol Hepatol. (2018) 33:111–20. doi: 10.1111/jgh.14005
50. Fan, Y, Zhang, X, Gao, C, Jiang, S, Wu, H, Liu, Z, et al. Burden and trends of brain and central nervous system cancer from 1990 to 2019 at the global, regional, and country levels. Arch Public Health. (2022) 80:209. doi: 10.1186/s13690-022-00965-5
51. Dhillon, PK, Jeemon, P, Arora, NK, Mathur, P, Maskey, M, Sukirna, RD, et al. Status of epidemiology in the WHO South-East Asia region: burden of disease, determinants of health and epidemiological research, workforce and training capacity. Int J Epidemiol. (2012) 41:847–60. doi: 10.1093/ije/dys046
52. Chivukula, MV, and Tisocki, K. Approaches to improving access to essential cancer medicines in the WHO South-East Asia region. WHO South East Asia J Public Health. (2018) 7:62–6. doi: 10.4103/2224-3151.239415
53. Liu, X, Cheng, LC, Gao, TY, Luo, J, and Zhang, C. The burden of brain and central nervous system cancers in Asia from 1990 to 2019 and its predicted level in the next twenty-five years: burden and prediction model of CNS cancers in Asia. BMC Public Health. (2023) 23:2522. doi: 10.1186/s12889-023-17467-w
54. Bigio, J, Hannay, E, Pai, M, Alisjahbana, B, Das, R, Huynh, HB, et al. The inclusion of diagnostics in national health insurance schemes in Cambodia, India, Indonesia, Nepal, Pakistan, Philippines and Vietnam, BMJ Glob Health. (2023); 8.
55. Moreira, D, Qaddoumi, I, Bhakta, N, Gajjar, A, and Rodríguez-Galindo, C. EPID-07. A global perspective on the burden of pediatric central nervous system tumors. Neuro-oncol. (2020) 22:iii320–14. doi: 10.1093/neuonc/noaa222.193
56. Leslie, HH, Sun, Z, and Kruk, ME. Association between infrastructure and observed quality of care in 4 healthcare services: a cross-sectional study of 4, 300 facilities in 8 countries. PLoS Med. (2017) 14:e1002464. doi: 10.1371/journal.pmed.1002464
57. Prince, MJ, Acosta, D, Guerra, M, Huang, Y, Jacob, KS, Jimenez-Velazquez, IZ, et al. Intrinsic capacity and its associations with incident dependence and mortality in 10/66 dementia research group studies in Latin America, India, and China: a population-based cohort study. PLoS Med. (2021) 18:e1003097. doi: 10.1371/journal.pmed.1003097
58. Karim-Kos, HE, Hackl, M, Mann, G, Urban, C, Woehrer, A, Slavc, I, et al. Trends in incidence, survival and mortality of childhood and adolescent cancer in Austria, 1994-2011. Cancer Epidemiol. (2016) 42:72–81. doi: 10.1016/j.canep.2016.03.015
59. Ostrom, QT, Patil, N, Cioffi, G, Waite, K, Kruchko, C, and Barnholtz-Sloan, JS. CBTRUS statistical report: primary brain and other central nervous system tumors diagnosed in the United States in 2013-2017. Neuro-Oncology. (2020) 22:iv1–iv96. doi: 10.1093/neuonc/noaa200
60. Miller, KD, Ostrom, QT, Kruchko, C, Patil, N, Tihan, T, Cioffi, G, et al. Brain and other central nervous system tumor statistics, 2021. CA Cancer J Clin. (2021) 71:381–406. doi: 10.3322/caac.21693
61. Ostrom, Q, Price, M, Ryan, K, Edelson, J, Neff, C, Cioffi, G, et al. CBTRUS statistical report: pediatric brain tumor foundation childhood and adolescent primary brain and other central nervous system tumors diagnosed in the United States in 2014-2018. Neuro-oncol. (2022) 24:iii1–iii38. doi: 10.1093/neuonc/noac161
62. Collaborators, GBDCC. The global burden of childhood and adolescent cancer in 2017: an analysis of the global burden of disease study 2017. Lancet Oncol. (2019) 20:1211–25. doi: 10.1016/S1470-2045(19)30339-0
63. Brain GBD Other CNSCC. Global, regional, and national burden of brain and other CNS cancer, 1990-2016: a systematic analysis for the global burden of disease study 2016. Lancet Neurol. (2019) 18:376–93. doi: 10.1016/S1474-4422(18)30468-X
64. Huang, J, Chan, SC, Lok, V, Zhang, L, Lin, X, Lucero-Prisno, DE, et al. Disease burden, risk factors, and trends of primary central nervous system (CNS) cancer: a global study of registries data. Neuro-Oncology. (2023) 25:995–1005. doi: 10.1093/neuonc/noac213
65. Kassebaum, N, Kyu, H, Zoeckler, L, Olsen, H, Thomas, K, Pinho, C, et al. Child and adolescent health from 1990 to 2015. JAMA Pediatr. (2017) 171:573–92. doi: 10.1001/jamapediatrics.2017.0250
66. Barasa, V, and Virhia, J. Using intersectionality to identify gendered barriers to health-seeking for febrile illness in agro-pastoralist settings in Tanzania. Front Glob Womens Health. (2021) 2:746402. doi: 10.3389/fgwh.2021.746402
67. World Health Organization. Health topics/gender. Available online at: https://www.who.int/health-topics/gender (accessed March 5, 2025)
68. Soerjomataram, I, Lortet-Tieulent, J, Parkin, DM, Ferlay, J, Mathers, C, Forman, D, et al. Global burden of cancer in 2008: a systematic analysis of disability-adjusted life-years in 12 world regions. Lancet. (2012) 380:1840–50. doi: 10.1016/S0140-6736(12)60919-2
69. Access GBDH, Quality Collaborators. Electronic address cue, Access GBDH, Quality C. Healthcare Access and Quality index based on mortality from causes amenable to personal health care in 195 countries and territories, 1990-2015: a novel analysis from the global burden of disease study 2015. Lancet. (2017) 390:231–66. doi: 10.1016/S0140-6736(17)30818-8
70. Gatta, G, Botta, L, Comber, H, Dimitrova, N, Leinonen, MK, Pritchard-Jones, K, et al. The European study on centralisation of childhood cancer treatment. Eur J Cancer. (2019) 115:120–7. doi: 10.1016/j.ejca.2019.04.024
71. Tettamanti, G, Shu, X, Adel Fahmideh, M, Schuz, J, Roosli, M, Tynes, T, et al. Prenatal and postnatal medical conditions and the risk of brain Tumors in children and adolescents: an international Multicenter case-control study. Cancer Epidemiol Biomarkers Prev. (2017) 26:110–5. doi: 10.1158/1055-9965.EPI-16-0451
72. Fuentes-Alabi, S. Navigating the economic challenges in childhood cancer control in low- and middle-income countries: insights from the CC-BRIDGE tool and the global initiative for childhood cancer. Cancer. (2024) 130:1025–7. doi: 10.1002/cncr.35209
73. Koptyra, M, Rahti, K, Zhu, Y, Farrow, B, Miller, D, Kraya, A, et al. Abstract 3566: expansion of the Pediatric brain tumor atlas: children's brain tumor Network, kids first data resource and childhood Cancer data initiative open science effort. Cancer Res. (2023) 83:3566–6. doi: 10.1158/1538-7445.AM2023-3566
74. Mohammadi, E, Ghasemi, E, Azadnajafabad, S, Rezaei, N, Saeedi Moghaddam, S, Ebrahimi Meimand, S, et al. A global, regional, and national survey on burden and Quality of care index (QCI) of brain and other central nervous system cancers; global burden of disease systematic analysis 1990-2017. PLoS One. (2021) 16:e0247120. doi: 10.1371/journal.pone.0247120
75. Pritchett, J, Paludo, J, Shi, Q, Khera, N, Yetmar, Z, Wilson, J, et al. Decreasing the burden of febrile neutropenia through dynamic remote patient monitoring: the DEFeNDER program. J Clin Oncol. (2023) 41:1535–5. doi: 10.1200/JCO.2023.41.16_suppl.1535
Keywords: pediatric brain cancer, global burden of disease, health inequity, sociodemographic index, joinpoint regression
Citation: Li L, Cai C, Zhao Q, Fan C and Fan J (2025) Worldwide patterns and trends in childhood and adolescent brain cancers, 1990–2021: insights from the global burden of disease study 2021. Front. Public Health. 13:1591309. doi: 10.3389/fpubh.2025.1591309
Edited by:
Chi-kong Li, The Chinese University of Hong Kong, Hong Kong SAR, ChinaReviewed by:
Maral Adel Fahmideh, Uppsala University, SwedenNir Shimony, St. Jude Research Children’s Hospital, United States
Marina Caballero-Bellón, Sant Joan de Déu Hospital, Spain
Copyright © 2025 Li, Cai, Zhao, Fan and Fan. This is an open-access article distributed under the terms of the Creative Commons Attribution License (CC BY). The use, distribution or reproduction in other forums is permitted, provided the original author(s) and the copyright owner(s) are credited and that the original publication in this journal is cited, in accordance with accepted academic practice. No use, distribution or reproduction is permitted which does not comply with these terms.
*Correspondence: Linbo Li, cWRzcm15eV9MaW5ib0BhbGl5dW4uY29t; Jian Fan, anNxZGZqMDAxQDE2My5jb20=