 Jikai You
 Jing Long1
 Yanan Yang
- 1School of Physical Education, Jiangxi Normal University, Nanchang, China
- 2Department of Health Management, Faculty of Military Health Service, Naval Medical University, Shanghai, China
Background: This study aimed to investigate the associations of physical activity (PA) volume and intensity with the risk of depression symptoms.
Methods: The data utilized in this study came from the 2011–2014 National Health and Nutrition Examination Survey. PA was measured using a triaxial accelerometer and calculated using the Monitor-Independent Movement Summary (MIMS), MIMS units are a novel metric derived from wrist-worn accelerometer data, representing the intensity of PA for each minute across the entire monitoring period. PA volume and intensity were expressed by the average of daily accumulated MIMS (Daily MIMS) and peak 30-min MIMS (Peak-30MIMS; Peak 30-min intensity), respectively. Depression symptoms were defined as Patient Health Questionnaire-9 score ≥10. Weighted logistic regression and restricted cubic splines were used to evaluate the associations between PA metrics and depression symptoms.
Results: After adjusting for all covariates, higher Daily MIMS and Peak-30MIMS were associated with lower depression risk. Each additional 1,000 units in Daily MIMS and 1-unit in Peak-30MIMS were associated with a 5% [Odds ratio (OR) = 0.95, 95% confidence interval (95% CI): 0.94, 0.98] and 2% (OR = 0.98, 95% CI: 0.97, 0.99) reduction in depression risk, respectively. When including both MIMS metrics in the same model, the association between Peak-30MIMS and depression remained significant (p = 0.02), whereas Daily MIMS did not (p = 0.60). The spline analysis indicated a monotonic decrease in the OR with higher Daily MIMS values (P for non-linear = 0.21). An initial increase followed by a decrease in OR was observed with rising Peak-30MIMS values (P for non-linear <0.01).
Conclusion: Our findings indicate that higher PA volume and intensity are associated with lower depression risk. The association between PA volume and reduced depression risk was negated after adjusting for PA intensity in US adults.
1 Introduction
Depression is a major public health issue, affecting more than 300 million people worldwide, with increasing prevalence rates each year (1). The World Health Organization predicts that major depression will be the leading cause of the global burden of disease by 2030 (2, 3). Identifying factors that contribute to depression is essential for developing effective public health prevention strategies and delivering targeted health communication.
Many studies have indicated that physical activity (PA) have protective effects against depression symptoms (4, 5). A meta-analysis encompassing eight randomized controlled trials has provided consistent evidence that PA can reduce depression across children, adults, and older adults (6). However, the majority of previous studies on PA have relied on the Global Physical Activity Questionnaire (GPAQ) (7, 8). Despite their utility, self-reported interview data have some limitations, including the variability in respondents’ perceptions of activity intensity and the difficulty in recalling and quantifying physical activity periods (9). In contrast, accelerometers are advanced wearable devices capable of objectively measuring the intensity and duration of an individual’s PA in daily life over prolonged periods (10, 11). A synthesized meta-analysis of eight studies indicated that in the general population, the maximum reduction in all-cause mortality risk associated with accelerometer-measured moderate to vigorous physical activity (MVPA), about 60%, was approximately twice the magnitude found in studies using self-reported PA (12). The use of an accelerometer could facilitate the revelation of the true extent of the correlation between PA and depressive symptoms, thereby improving the personalization of depression treatment strategies.
The National Health and Nutrition Examination Survey (NHANES) in 2020 released physical activity monitor data obtained through wrist accelerometers during the 2011–2014 survey period. John et al. (13) utilized a novel algorithm for monitor-independent movement summary (MIMS) to process data from worn wrist triaxial accelerometers. A key advantage of the MIMS metric lies in its generation through a device-agnostic, universal algorithm, which facilitates cross-study and cross-design comparisons (13). PA volume and intensity were expressed as daily accumulated MIMS (Daily MIMS) (14) and peak 30-min MIMS (Peak-30MIMS) (15–18), respectively. Zheng et al. (19) found that higher peak effort and daily accumulation were associated with improved cognitive function. However, to date, few studies have explored the associations of PA volume and intensity with depression symptoms using Daily MIMS and Peak-30MIMS.
To address these knowledge gaps, the present study aimed to investigate the associations of PA volume and intensity, as assessed by Daily MIMS and Peak-30MIMS, with the risk of depression symptoms among a nationally representative sample of adults, utilizing data from the 2011–2014 NHANES.
2 Materials and methods
2.1 Study population and design
NHANES is an ongoing, nationally representative, cross-sectional survey of the nutrition and health of the deinstitutionalized US civilian population. It received approval from the National Center for Health Statistics Ethics, all participants provided written informed consent.
A total of 14,693 participants with accelerometry data were collected from NHANES 2011–2014. In this study, we included adults aged ≥20 years with ≥3 days of valid accelerometry data, where a valid day was defined as >80% wear time (20, 21). Participants whose accelerometer was worn on the dominant hand and had missing depression symptoms data were excluded. Additionally, data from day 1 and day 9 were excluded due to incomplete 24-h records. Ultimately, 8,597 participants were included in the analysis, with the participant selection process detailed in Figure 1.
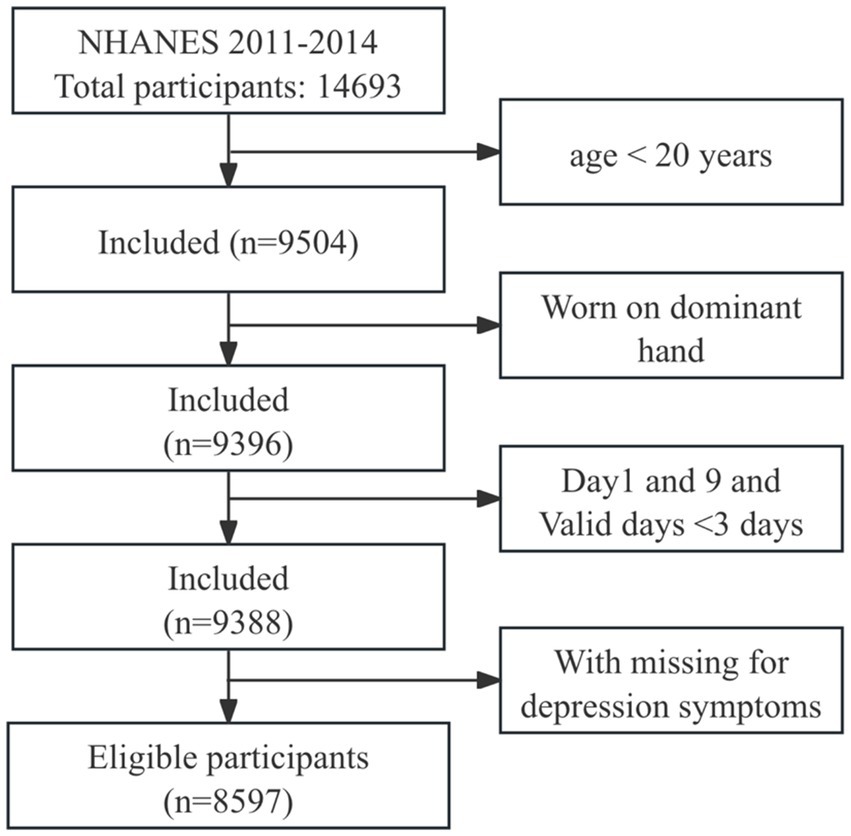
Figure 1. Flowchart of the participants selection.
2.2 Accelerometer data
PA was measured using a triaxial accelerometer (ActiGraph GT3X+, ActiGraph Corp., Pensacola, FL; 80 Hz sampling frequency) worn on the non-dominant wrist for 7 consecutive days. NHANES processes, labels, and summarizes accelerometer data on a minute-by-minute basis, using the MIMS metric. MIMS is a non-proprietary, open-source, device-independent generic summary metric. It shows higher consistency across different devices than other summary metrics (13). MIMS/min data was obtained from the NHANES released in 2022, and device wear status was determined by an open-source machine learning algorithm that identified for each minute device wear status (22). Daily MIMS was calculated by summing the MIMS values for the day, and then mean number of valid days was noted. Peak-30MIMS was calculated by identifying the highest 30 MIMS/min values, averaging these 30 values, and then averaging the result over the valid days.
2.3 Depression symptoms
In this research, depression symptoms were identified by a Patient Health Questionnaire-9 (PHQ-9) score of ≥10 (23, 24). This cut-off point is widely applied in depression research, has a validated sensitivity and specificity of 88% (25).
2.4 Covariates
We selected these covariates, referencing related previous studies (26–28), including demographic factors (sex, race/ethnicity, education, and age), body mass index (BMI; obesity ≥30 kg/m2, overweight: 25–29.9 kg/m2, normal weight: 18.5–24.9 kg/m2, low weight: <18.5 kg/m2) and hypertension. Hypertension was defined by meeting at least one of the following criteria: systolic blood pressure ≥140 mmHg, diastolic blood pressure ≥90 mmHg, or a diagnosis by a healthcare professional (27).
2.5 Statistical analysis
The data for analysis were weighted with the requirements of the National Center for Health Statistics using “survey” package in R. Participants were classified into two groups based on their depression symptomatology. Custom R scripts was used to compute Daily MIMS (MIMS/day), Peak-30MIMS (MIMS/min), and to calculate the weighted quartiles of MIMS metrics. In addition, smooth curve was used to fit the relationship between age and MIMS metrics. Continuous variables were expressed as means ± standard deviation, and categorical variables were represented by frequency (weighted percentage).
Weighted multiple logistic regression and restricted cubic spline (RCS) with three knots were used to estimate the relationship between each MIMS metric (Daily MIMS, Peak-30MIMS) and depression symptoms, adjusting for covariates. In addition, we constructed a model that includes both Daily MIMS and Peak-30MIMS to investigate depression symptoms. All data were analyzed using R 4.3.1 statistical software, and p < 0.05 was considered statistically significant.
3 Results
3.1 General characteristics of included individuals
The study included 8,597 participants (weighted population: 184,156,375, age = 49.26 ± 17.56 years, 4,417 (52%) females), and the characteristics of participants with depression symptoms are detailed in Table 1. Participants without depression symptoms demonstrated greater volume and intensity of PA. The smoothing plots in Figure 2 indicate that Daily MIMS initially rises and then falls with increasing age, in contrast to Peak-30 MIMS, which monotonically decreases with age.
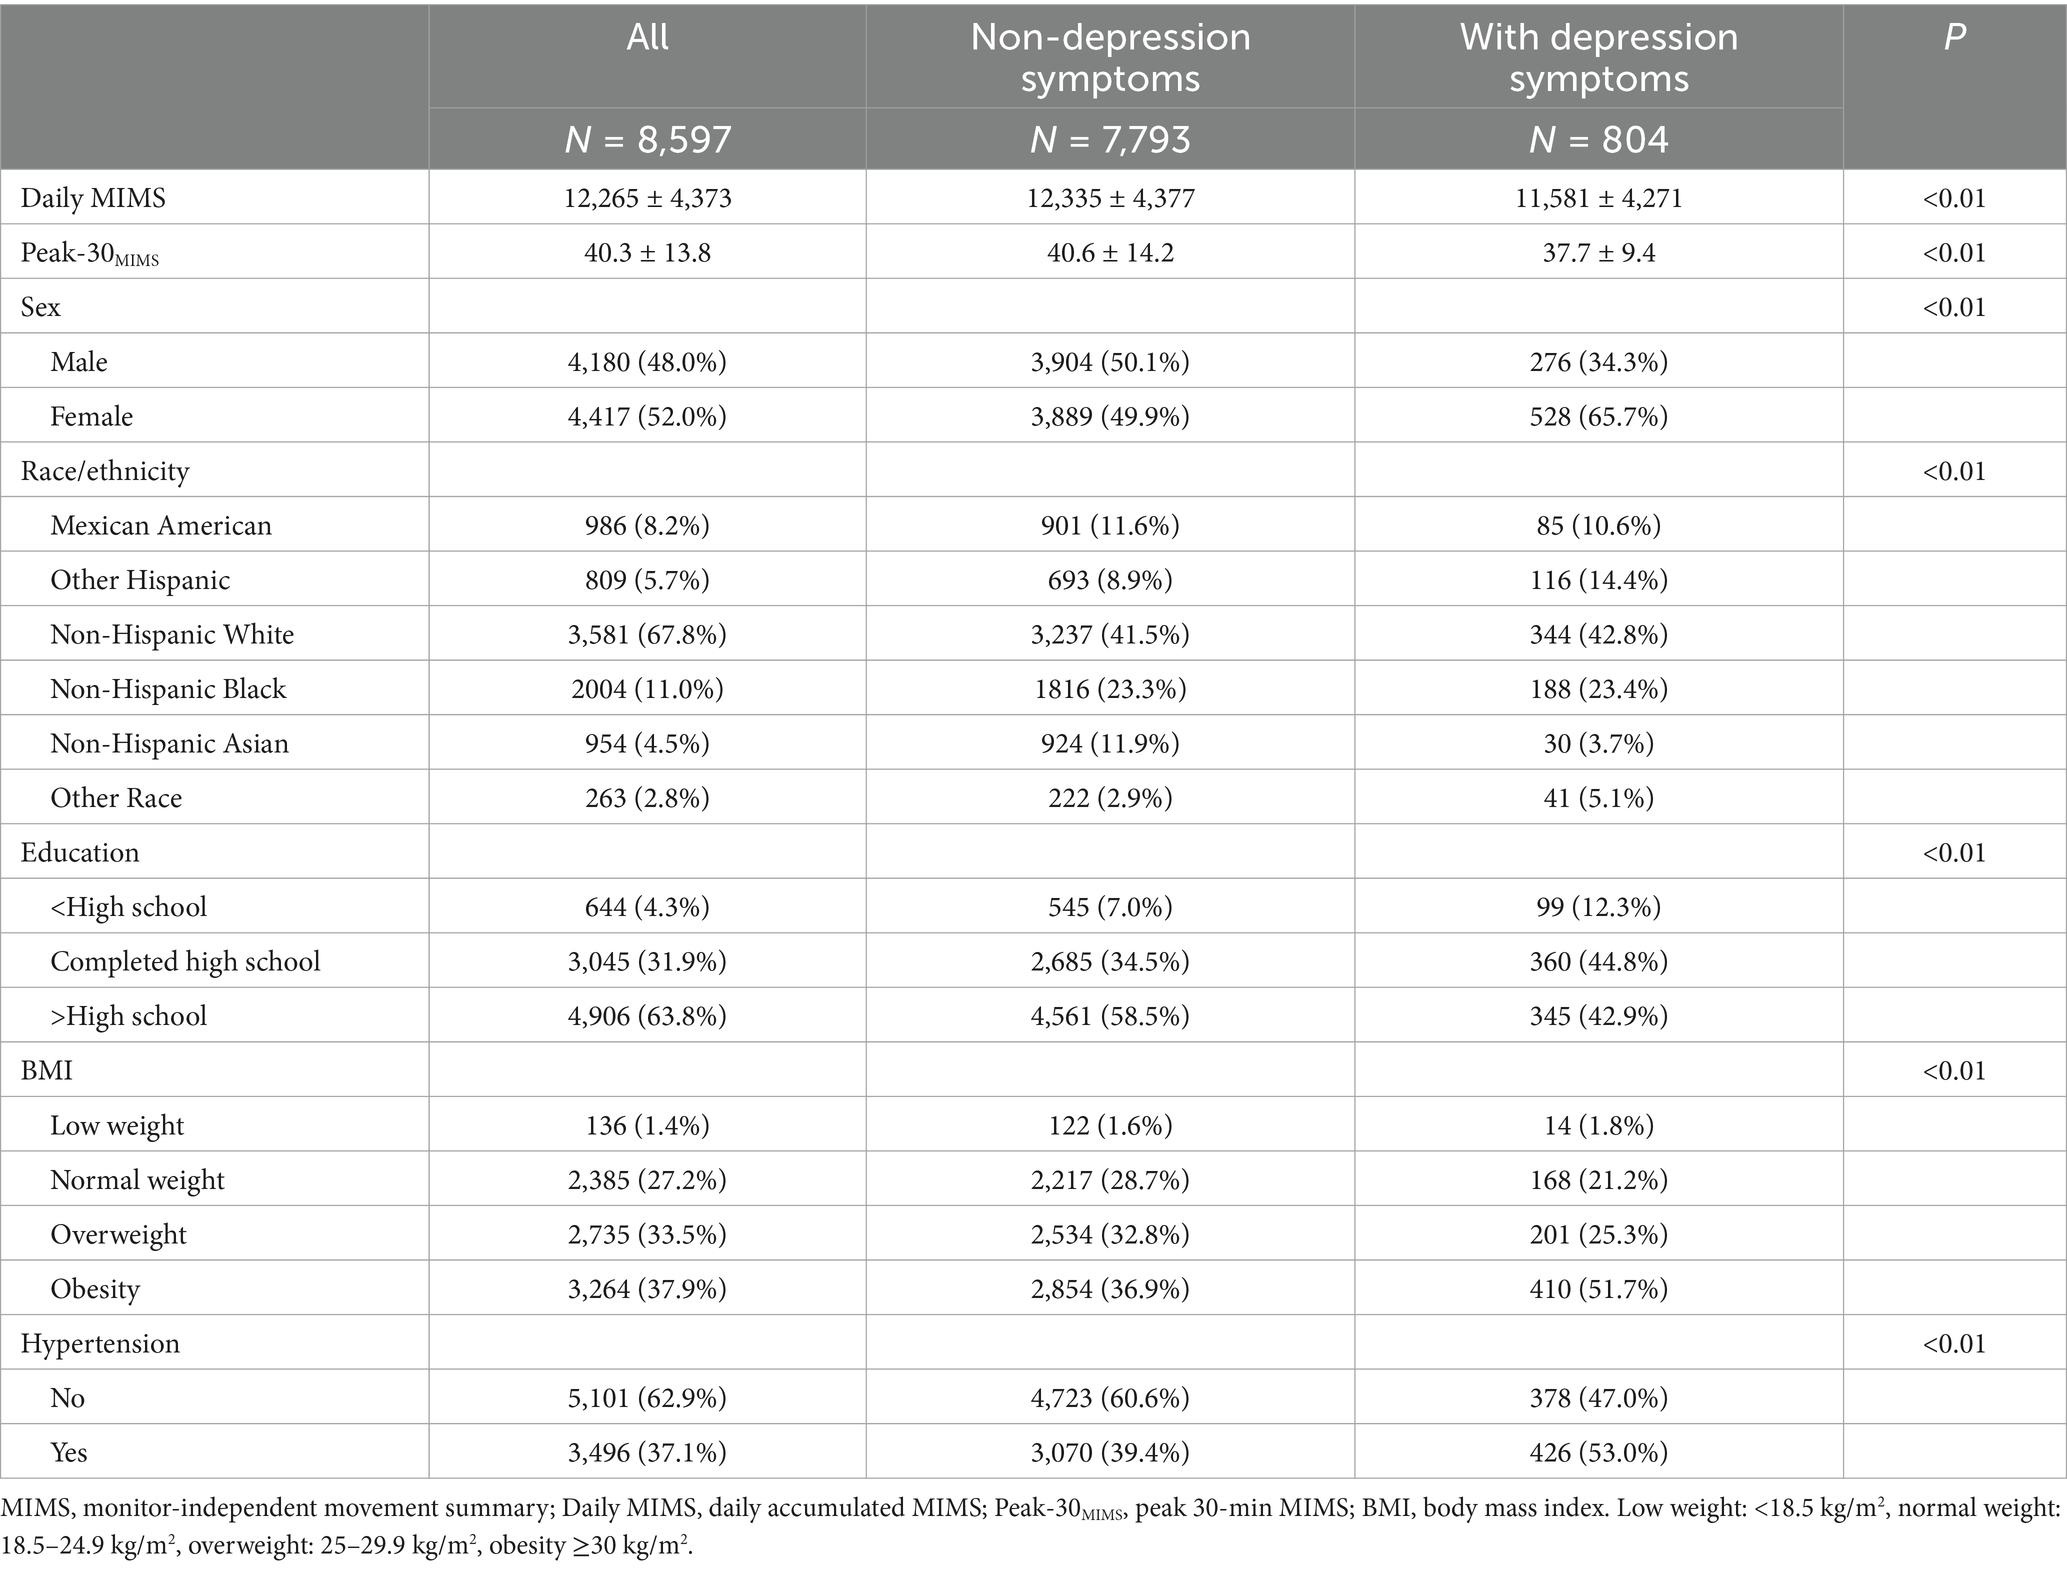
Table 1. The characteristics by depression symptoms from NHANES 2011 to 2014.
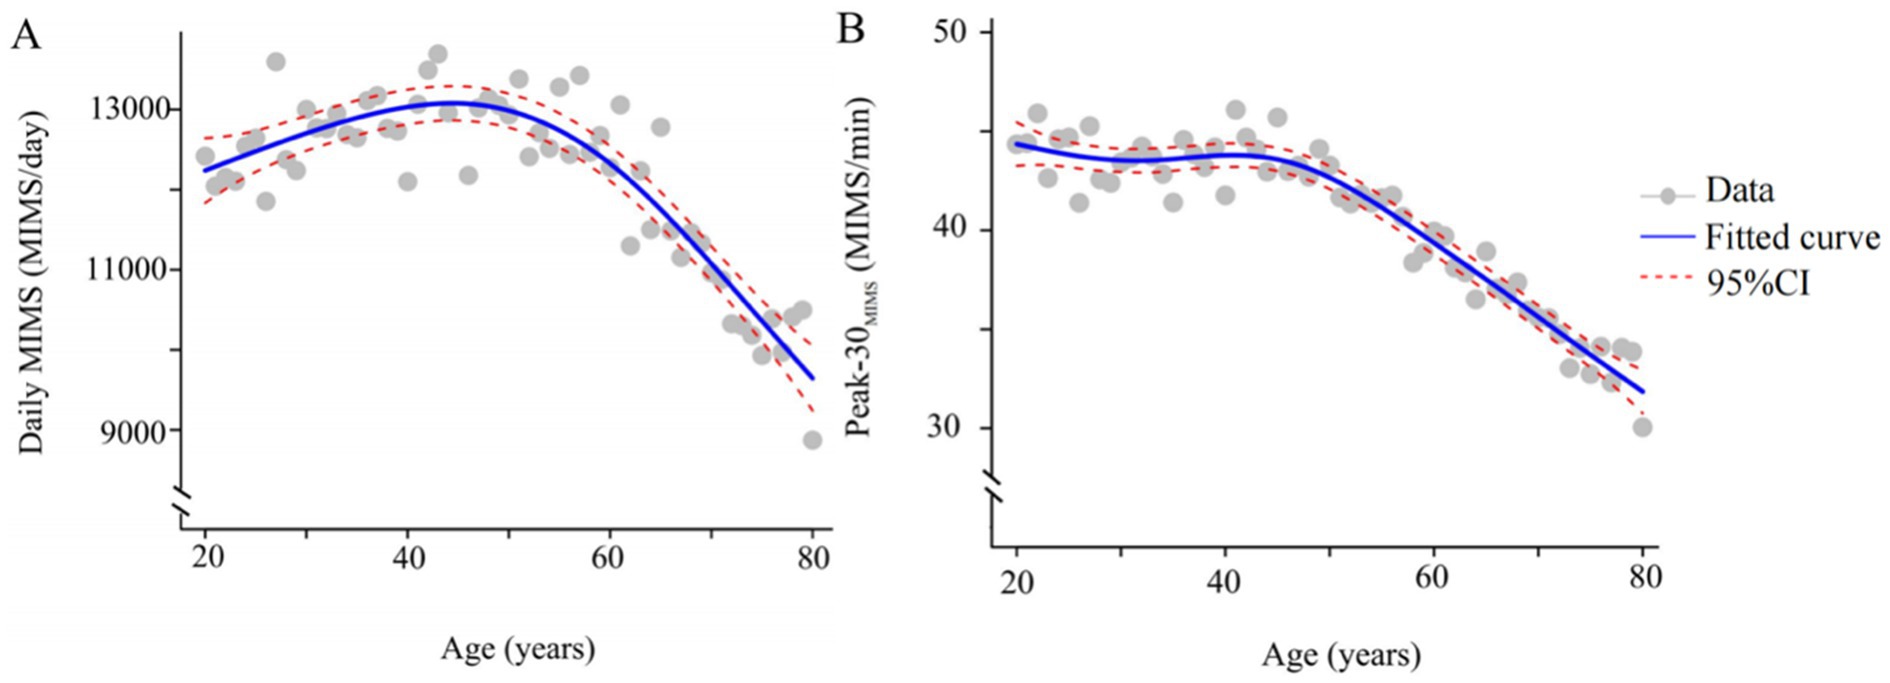
Figure 2. Smoothing spline plots of daily MIMS (A), Peak-30MIMS (B) and age. Blue solid lines represent the fitted curve between age and MIMS metric. Red dotted lines represent the 95% CI. Data represent the weighted mean MIMS metrics. MIMS, monitor-independent movement summary; Daily MIMS, daily accumulated MIMS; Peak-30MIMS, peak 30-min MIMS.
3.2 Association between weighted quartiles of MIMS metrics and depression symptoms
The Daily MIMS values at the 25th, 50th, and 75th percentiles were 9855.92, 12461.04, and 15071.64, respectively, and for Peak-30MIMS, these values were 35.49, 40.67, and 46.25, respectively, with all data divided into quartiles (Q1-Q4) according to weighted percentiles. Table 2 illustrates the association between the Daily MIMS, Peak-30MIMS (classified into quartiles based on weighted percentiles) and depression symptoms, after adjusting for all covariates. Increased MIMS metrics was associated with lower depression symptoms risk. Specifically, participants in the highest quartile (Q4) for Daily MIMS and Peak-30MIMS had a 39% [Odds ratio (OR) = 0.61, 95% confidence interval (95% CI): 0.45–0.82] and 54% (OR = 0.46, 95% CI: 0.34–0.63) lower risk of depression symptoms compared to those in the lowest quartile (Q1).
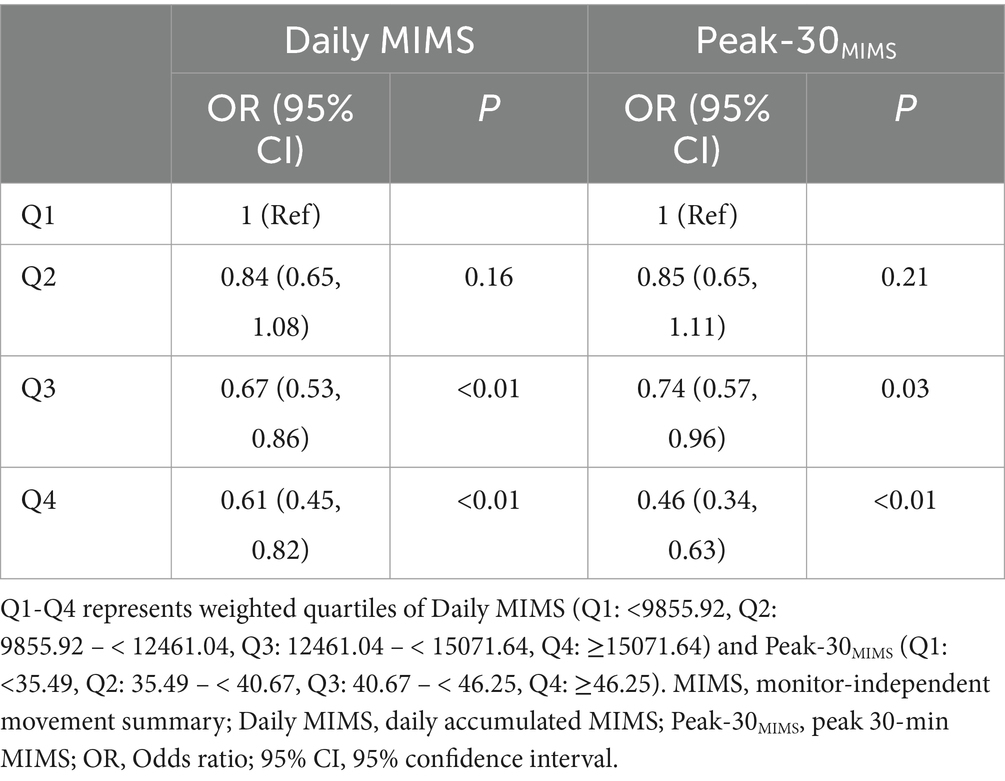
Table 2. Relationship between physical activity separated by weighted quartiles and depression symptoms among adults.
3.3 Dose–response associations between MIMS metrics and depression symptoms
After adjusting for covariates, a significant dose–response association was exhibited between MIMS metrics and the risk of depression symptoms in models with either Daily MIMS or Peak-30MIMS alone, as shown in Table 3. Specifically, every additional 1,000 MIMS/day in Daily MIMS and 1 MIMS/min in Peak-30MIMS were associated with a 5% (OR = 0.95, 95% CI: 0.94, 0.98) and 2% (OR = 0.98, 95% CI: 0.97, 0.99) reduction in the risk of depression symptoms, respectively. The association between Peak-30MIMS (OR = 0.98, 95% CI: 0.97, 0.99) and depression symptoms remained statistically significant in models with both Daily MIMS and Peak-30MIMS included, while the significance of Daily MIMS was not maintained (p = 0.60).
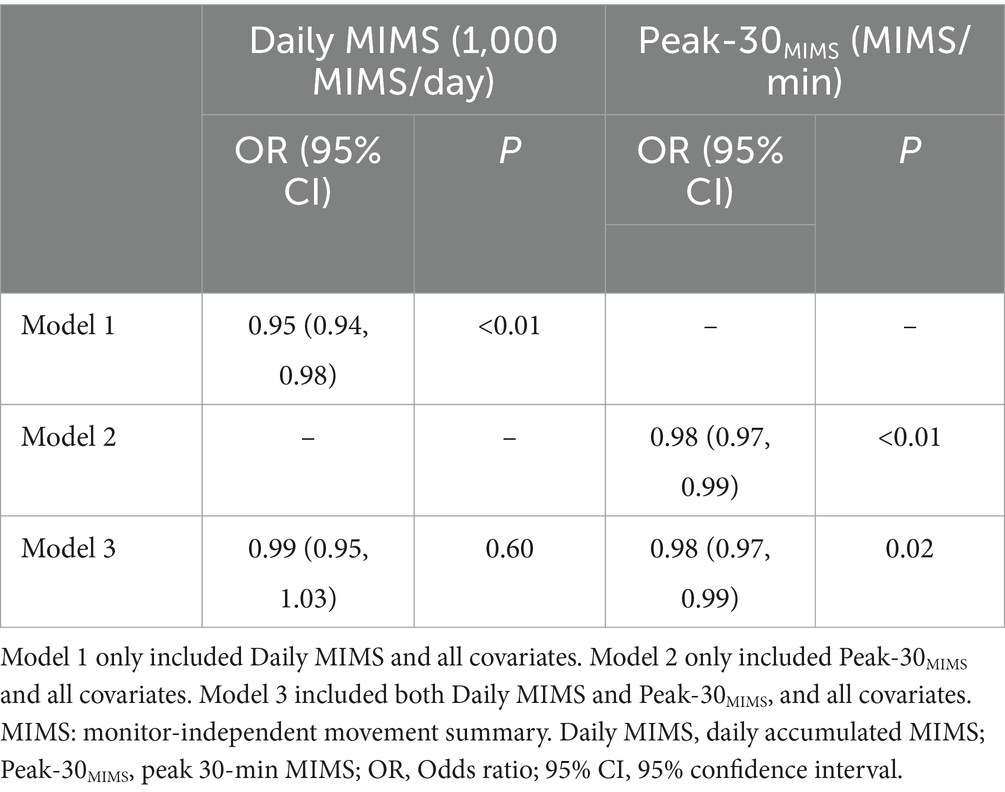
Table 3. Dose–response relationship between physical activity and depression symptoms among adults.
3.4 Analysis of restricted cubic spline
After adjusting for covariates in the restricted cubic spline analysis depicted in Figure 3, a significant nonlinear relationship was identified between Peak-30MIMS and the risk of depression symptoms (P for nonlinear < 0.01). Unlike Daily MIMS, which did not exhibit such a relationship (P for nonlinear = 0.21). The risk of depression symptoms decreases with higher PA volume, and the risk of depression symptoms falling below a relative risk of 1 when the Daily MIMS reaches approximately 12,373 MIMS/day. Initially, the risk of depression symptoms rises with increasing PA intensity before declining, and it falls below a relative risk of 1 at about 40 MIMS/min of Peak-30MIMS.
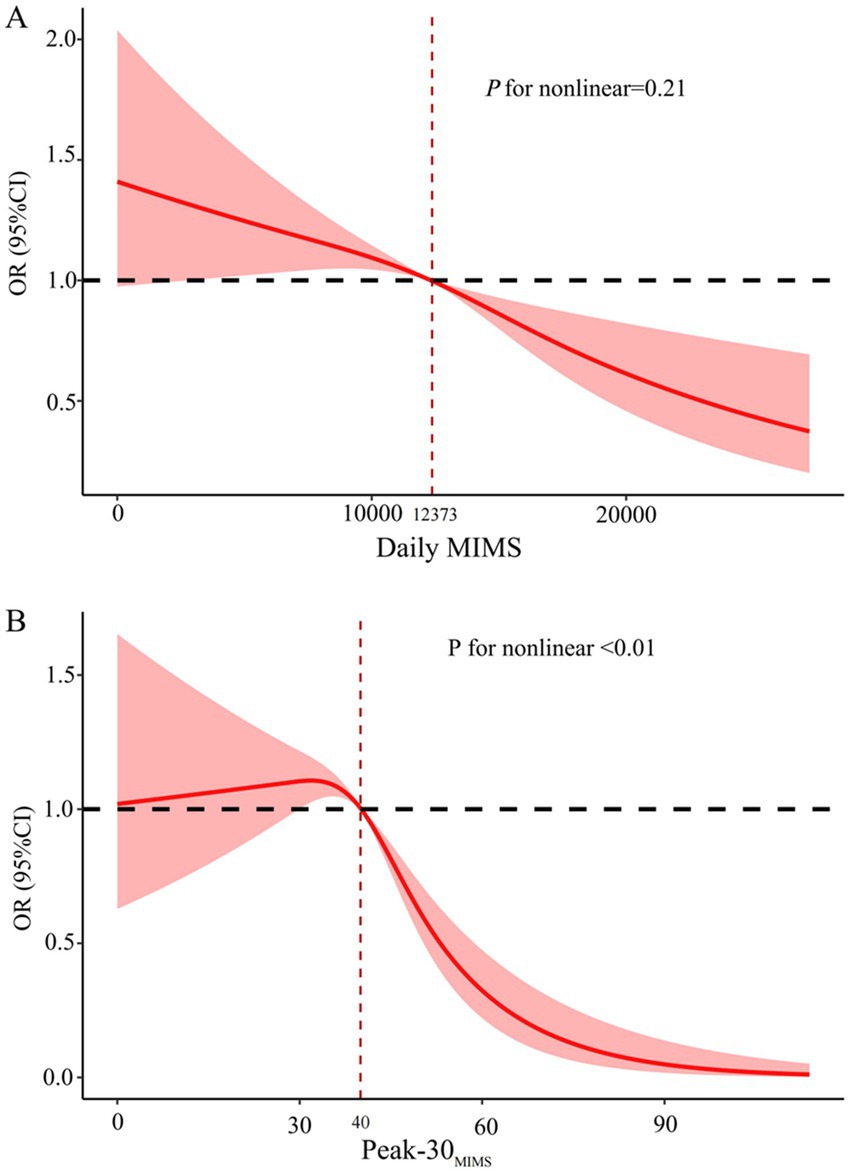
Figure 3. Dose–response associations between daily MIMS (A) and Peak-30MIMS (B) with depression symptoms. MIMS, monitor-independent movement summary; Daily MIMS, daily accumulated MIMS; Peak-30MIMS, peak 30-min MIMS; OR, Odds ratio; 95% CI, 95% confidence interval.
4 Discussion
To our knowledge, this is the first study to investigate the dose–response relationship between PA volume, intensity and depression symptoms using nationally representative population of US adults who worn wrist physical activity monitor. Our results indicated that higher Daily MIMS and Peak-30MIMS were associated with lower depression symptoms risk. However, the association between Daily MIMS and depression symptoms became nonsignificant when both Daily MIMS and Peak-30MIMS were included in the analysis. In other words, among adults with similar PA volumes, those who participated in higher intensity activities during the day had a decreased risk of depression symptoms, highlighting the significant link between peak effort (intensity) and depression symptoms.
Previous studies have found that an increase in PA volume, as measured by the global physical activity questionnaire, is associated with a reduction in depression (27, 29). For example, He et al. (27) used NHANES 2007–2018 data and found that leisure-time PA was associated with a lower risk of depressive symptoms at any amount. A systematic review and meta-analysis encompassing over 2 million person-years from 15 prospective studies found that individuals accumulating at least half the recommended physical activity volume (4.4 marginal metabolic equivalent task hours per week, 4.4 mMET-h/week) had an 18% (95% CI: 13–23%) lower risk of depression, while those reaching 8.8 mMET-h/week had a 25% (95% CI: 18–32%) reduction in risk, compared with adults who not reporting any activity (30). Our findings are consistent with these previous results, showing that PA volume measured by Daily MIMS using accelerometry is inversely associated with the risk of depression symptoms. However, the significance of PA volume in relation to depression symptoms were negated when controlling for PA intensity. The main reason for this observation is largely attributed to the methodology of PA measurement (31, 32). Specifically, there was independence between PA volume and intensity measured by accelerometry. In contrast, the calculation of PA intensity derived from questionnaires often involved the PA volume (33, 34). Hence, this study examined a more extensive range of PA, shedding additional light on the association between PA and depression symptoms.
Numerous studies have demonstrated that PA volume is negatively associated with depression (27, 29), but the benefits of depression prevention may vary with the intensity of PA (35, 36). In a randomized controlled trial during COVID-19 confinement, high intensity interval training demonstrated greater effectiveness in reducing depression symptoms compared to moderate-intensity training (37). Huang et al. (36) found that increased vigorous physical activity (VPA) was associated with lower depressive symptoms in US adults, with each additional hour or day per week of VPA reducing depression risk by 6 and 12%, respectively. Yang et al. (35) found that a higher proportion of VPA to MVPA might be correlated with a lower risk for depression. However, these studies assessed PA levels using the GPAQ. In contrast, our study used accelerometry data and found that each additional 1 unit increase in Peak-30MIMS was associated with a 2% reduction in depression risk, and identified a non-linear relationship between PA intensity and the risk of depression symptoms, as Peak-30MIMS increases, there is no significant change in the risk of depression symptoms. However, once Peak-30MIMS exceeds approximately 40 MIMS/min, a notable decrease in depression risk is observed. This threshold effect suggests that while moderate increases in PA intensity may not immediately impact depression symptoms, surpassing a certain intensity threshold can lead to significant mental health benefits. This finding underscores the importance of not only encouraging PA, but also considering the intensity at which individuals engage in these activities to maximize their potential antidepressant effects. Even after adjusting for Daily MIMS, those who participated in higher intensity activities during the day had a decreased risk of depression symptoms, indicated that PA intensity is a main driver in lowering the risk of depression symptoms.
The underlying mechanisms linking PA intensity to depression symptoms remain largely unexplored. From the physiological aspects, inflammation hypothesis has been proposed (38). Depression-related inflammatory cytokines encompass tumor necrosis factor alpha (TNF-α), interleukin-1 beta (IL-1β) (39–41), and interleukin-6 (IL-6), which is secreted by skeletal muscle (42). Elevated TNF-αlevels are potentially implicated in the etiology of depression (43, 44). Lowered IL-1β levels are correlated with a decrease in depressive symptoms in individuals with major depressive disorder (44). Several studies have shown that IL-6 levels rise following high-intensity PA (42, 45) and such acute elevations in IL-6 can inhibit TNF-α production (46, 47). A randomized controlled trial revealed that 6 weeks of high-intensity interval training can decrease levels of TNF-α and IL-1β (48).
Moreover, PA acts as a stressor that triggers neural and physiological adaptations specific to the type (49, 50), intensity (35, 36), and duration of PA (36). These adaptations include changes in endorphin levels (51), reduction of pro-inflammatory cytokines (39–41), and enhanced neuroplasticity (52), particularly through the modulation of neurotrophic factors such as brain-derived neurotrophic factor (BDNF) (53). For instance, BDNF has been shown to play a crucial role in promoting synaptic plasticity and neurogenesis, which are essential for mood regulation and cognitive function (53). Higher levels of PA can enhance cerebral blood flow, promote the proliferation of neurotrophic factors such as BDNF, and augment synaptic plasticity, thereby improving neural efficiency (53).
Psychological mechanisms involved in the relationship between PA intensity and depression prevention include self-efficacy theory (54) and the health belief model (55). A previous study has shown that the relationship between PA intensity and the prevention of depression in Chinese individuals is moderated by perceived susceptibility and self-efficacy (56). Consequently, while fatigue may follow high-intensity physical activity, there can be enhancements in an individual’s self-efficacy and self-perception, which in turn may lower the severity of depressive symptoms.
Despite our adjustment for demographic factors, such as sex, race/ethnicity, education, and age, the potential for residual confounding remains. It is crucial to recognize additional factors that could influence both PA levels and depressive symptoms. For instance, chronic illnesses (28) and disabilities (57, 58) can significantly affect an individual’s ability to engage in PA and concurrently elevate the risk of depression. Socioeconomic stressors, such as financial instability, and the use of green space have also been linked to depression risk (59). Nutritional status is another significant factor, a study by Huang et al. (60) using machine learning revealed that specific nutrients, including potassium and vitamin E, along with the diversity of food and beverage intake, are significantly related to depression risk. Sleep duration is independently associated with depression, with a U-shaped relationship indicating that both insufficient and excessive sleep can increase depression risk (61). Future research should conduct sensitivity analyses to further explore how these confounding factors might affect the observed associations. Future research should conduct sensitivity analyses to further explore how these confounding factors might affect the observed associations.
The use of MIMS-based accelerometry offers significant practical implications for public health interventions and clinical screening tools. MIMS metrics provide an objective and comprehensive assessment of PA, which can be particularly useful in large-scale public health initiatives. For example, incorporating MIMS data into community-based programs can help tailor interventions to individuals with varying PA levels and intensities, thereby enhancing the effectiveness of depression prevention strategies. In clinical settings, MIMS-based accelerometry can serve as a valuable screening tool to identify patients at risk for depression, allowing for early intervention and personalized treatment plans. Future research should explore the feasibility and effectiveness of integrating MIMS metrics into existing public health and clinical frameworks to improve mental health outcomes.
This study has several strengths. Accelerometers were utilized for a comprehensive evaluation of PA, replacing self-reported questionnaires. Moreover, the peak index was introduced to represent the PA intensity. Finally, our results represent the general US adult’s population, enhancing the generalizability of the study. This study also has several limitations. Only cross-sectional data was employed for the estimations in this study, and the causal relationship between PA and depression cannot be inferred. Although relevant variables were considered, the removal of confounding factors presents a considerable challenge. Future studies that are more relevant are anticipated to confirm our results and are encouraged to utilize the MIMS algorithm for analyzing wrist-worn physical activity monitor data.
5 Conclusion
Higher levels of PA, including both volume and intensity, correlate with lower risk of depression symptoms. There are no significant associations between PA volume and depression symptoms after adjusting for PA intensity. Our findings suggest that promoting higher-intensity physical activity may be a valuable strategy for depression prevention and management.
Data availability statement
The datasets presented in this study can be found in online repositories. The names of the repository/repositories and accession number(s) can be found at: https://www.cdc.gov/nchs/nhanes/.
Ethics statement
The studies involving humans were approved by the Institutional Review Board review as it used de-identified, publicly available data. The studies were conducted in accordance with the local legislation and institutional requirements. The participants provided their written informed consent to participate in this study.
Author contributions
JY: Data curation, Visualization, Writing – original draft, Formal analysis. JL: Writing – original draft, Formal analysis, Data curation. ZW: Writing – review & editing, Conceptualization, Supervision. YY: Writing – review & editing, Methodology, Funding acquisition.
Funding
The author(s) declare that financial support was received for the research and/or publication of this article. This study was funded by the Doctoral Startup Funding of Jiangxi Normal University (12021975).
Acknowledgments
We extend our gratitude to the team at the National Center for Health Statistics, part of the Centers for Disease Control and Prevention, for their efforts in orchestrating NHANES and for providing the NHANES datasets online.
Conflict of interest
The authors declare that the research was conducted in the absence of any commercial or financial relationships that could be construed as a potential conflict of interest.
Generative AI statement
The authors declare that no Gen AI was used in the creation of this manuscript.
Publisher’s note
All claims expressed in this article are solely those of the authors and do not necessarily represent those of their affiliated organizations, or those of the publisher, the editors and the reviewers. Any product that may be evaluated in this article, or claim that may be made by its manufacturer, is not guaranteed or endorsed by the publisher.
Abbreviations
PA, physical activity; MIMS, Monitor-Independent Movement Summary; Daily MIMS, daily accumulated MIMS; Peak-30MIMS, peak 30-min MIMS; OR, Odds ratio; 95% CI, 95% confidence interval; GPAQ, Global Physical Activity Questionnaire; MVPA, moderate to vigorous physical activity; NHANES, National Health and Nutrition Examination Survey; PHQ-9, Patient Health Questionnaire-9; BMI, body mass index; RCS, restricted cubic spline; VPA, vigorous physical activity; 4.4 mMET-h/week, 4.4 marginal metabolic equivalent task hours per week; TNF-α, tumor necrosis factor alpha; IL-1β, interleukin-1 beta; IL-6, interleukin-6; BDNF, brain-derived neurotrophic factor.
References
1. Collaborators. Global prevalence and burden of depressive and anxiety disorders in 204 countries and territories in 2020 due to the COVID-19 pandemic. Lancet. (2021) 398:1700–12. doi: 10.1016/s0140-6736(21)02143-7
2. Collaborators. Global burden of 369 diseases and injuries in 204 countries and territories, 1990-2019: a systematic analysis for the global burden of disease study 2019. Lancet. (2020) 396:1204–22. doi: 10.1016/s0140-6736(20)30925-9
3. Malhi, GS, and Mann, JJ. Depression. Lancet. (2018) 392:2299–312. doi: 10.1016/s0140-6736(18)31948-2
4. Kandola, A, Ashdown-Franks, G, Hendrikse, J, Sabiston, CM, and Stubbs, B. Physical activity and depression: towards understanding the antidepressant mechanisms of physical activity. Neurosci Biobehav Rev. (2019) 107:525–39. doi: 10.1016/j.neubiorev.2019.09.040
5. Dishman, RK, McDowell, CP, and Herring, MP. Customary physical activity and odds of depression: a systematic review and meta-analysis of 111 prospective cohort studies. Br J Sports Med. (2021) 55:926–34. doi: 10.1136/bjsports-2020-103140
6. Ashdown-Franks, G, Firth, J, Carney, R, Carvalho, AF, Hallgren, M, Koyanagi, A, et al. Exercise as medicine for mental and substance use disorders: a Meta-review of the benefits for neuropsychiatric and cognitive outcomes. Sports Med. (2020) 50:151–70. doi: 10.1007/s40279-019-01187-6
7. Liao, J, Hu, M, Imm, K, Holmes, CJ, Zhu, J, Cao, C, et al. Association of daily sitting time and leisure-time physical activity with body fat among U.S. adults. J Sport Health Sci. (2024) 13:195–203. doi: 10.1016/j.jshs.2022.10.001
8. Wei, X, Min, Y, Xiang, Z, Zeng, Y, Wang, J, and Liu, L. Joint association of physical activity and dietary quality with survival among US cancer survivors: a population-based cohort study. Int J Surg. (2024) 110:5585–94. doi: 10.1097/js9.0000000000001636
9. Hu, C, Zuo, H, and Li, Y. Effects of radiofrequency electromagnetic radiation on neurotransmitters in the brain. Front Public Health. (2021) 9:691880. doi: 10.3389/fpubh.2021.691880
10. Welk, GJ, Bai, Y, Lee, JM, Godino, J, Saint-Maurice, PF, and Carr, L. Standardizing analytic methods and reporting in activity monitor validation studies. Med Sci Sports Exerc. (2019) 51:1767–80. doi: 10.1249/mss.0000000000001966
11. Strain, T, Wijndaele, K, Dempsey, PC, Sharp, SJ, Pearce, M, Jeon, J, et al. Wearable-device-measured physical activity and future health risk. Nat Med. (2020) 26:1385–91. doi: 10.1038/s41591-020-1012-3
12. Ekelund, U, Tarp, J, Steene-Johannessen, J, Hansen, BH, Jefferis, B, Fagerland, MW, et al. Dose-response associations between accelerometry measured physical activity and sedentary time and all cause mortality: systematic review and harmonised meta-analysis. BMJ. (2019) 366:l4570. doi: 10.1136/bmj.l4570
13. John, D, Tang, Q, Albinali, F, and Intille, S. An open-source monitor-independent movement summary for accelerometer data processing. J Meas Phys Behav. (2019) 2:268–81. doi: 10.1123/jmpb.2018-0068
14. Belcher, BR, Wolff-Hughes, DL, Dooley, EE, Staudenmayer, J, Berrigan, D, Eberhardt, MS, et al. US population-referenced percentiles for wrist-worn accelerometer-derived activity. Med Sci Sports Exerc. (2021) 53:2455–64. doi: 10.1249/mss.0000000000002726
15. Adams, B, Fidler, K, Demoes, N, Aguiar, EJ, Ducharme, SW, McCullough, AK, et al. Cardiometabolic thresholds for peak 30-min cadence and steps/day. PLoS One. (2019) 14:e0219933. doi: 10.1371/journal.pone.0219933
16. Paluch, AE, Gabriel, KP, Fulton, JE, Lewis, CE, Schreiner, PJ, Sternfeld, B, et al. Steps per day and all-cause mortality in middle-aged adults in the coronary artery risk development in young adults study. JAMA Netw Open. (2021) 4:e2124516. doi: 10.1001/jamanetworkopen.2021.24516
17. Tudor-Locke, C, Schuna, JM Jr, Han, HO, Aguiar, EJ, Green, MA, Busa, MA, et al. Step-based physical activity metrics and Cardiometabolic risk: NHANES 2005-2006. Med Sci Sports Exerc. (2017) 49:283–91. doi: 10.1249/mss.0000000000001100
18. Vilar-Gomez, E, Vuppalanchi, R, Gawrieh, S, Pike, F, Samala, N, and Chalasani, N. Significant dose-response Association of Physical Activity and Diet Quality with Mortality in adults with suspected NAFLD in a population study. Am J Gastroenterol. (2023) 118:1576–91. doi: 10.14309/ajg.0000000000002222
19. Zheng, P, Pleuss, JD, Turner, DS, Ducharme, SW, and Aguiar, EJ. Dose-response association between physical activity (daily MIMS, peak 30-minute MIMS) and cognitive function among older adults: NHANES 2011-2014. J Gerontol A Biol Sci Med Sci. (2023) 78:286–91. doi: 10.1093/gerona/glac076
20. Gao, Y, Zhang, Q, Wang, Y, Gao, Y, and Xu, Y. Association between physical activity based on wearables and self-reported health status among adolescents: NHANES 2011-2014. BMC Public Health. (2024) 24:2876. doi: 10.1186/s12889-024-20363-6
21. Merilahti, J, Viramo, P, and Korhonen, I. Wearable monitoring of physical functioning and disability changes, circadian rhythms and sleep patterns in nursing home residents. IEEE J Biomed Health Inform. (2016) 20:856–64. doi: 10.1109/jbhi.2015.2420680
22. National Health and Nutrition Examination Survey-2011-2012 Data Documentation, Codebook, and Frequencies. (2011). Available online at: https://wwwn.cdc.gov.Nchs/Public/2011/DataFiles/PAXMIN_G (Assessed July 24, 2024).
23. Ba, DM, Gao, X, Al-Shaar, L, Muscat, JE, Chinchilli, VM, Beelman, RB, et al. Mushroom intake and depression: a population-based study using data from the US National Health and nutrition examination survey (NHANES), 2005-2016. J Affect Disord. (2021) 294:686–92. doi: 10.1016/j.jad.2021.07.080
24. Shi, YY, Zheng, R, Cai, JJ, and Qian, SZ. The association between triglyceride glucose index and depression: data from NHANES 2005-2018. BMC Psychiatry. (2021) 21:267. doi: 10.1186/s12888-021-03275-2
25. Kroenke, K, Spitzer, RL, and Williams, JB. The PHQ-9: validity of a brief depression severity measure. J Gen Intern Med. (2001) 16:606–13. doi: 10.1046/j.1525-1497.2001.016009606.x
26. Liang, J, Huang, S, Jiang, N, Kakaer, A, Chen, Y, Liu, M, et al. Association between joint physical activity and dietary quality and lower risk of depression symptoms in US adults: cross-sectional NHANES study. JMIR Public Health Surveill. (2023) 9:e45776. doi: 10.2196/45776
27. He, F, Li, Y, Hu, Z, and Zhang, H. Association of domain-specific physical activity with depressive symptoms: a population-based study. Eur Psychiatry. (2022) 66:e5. doi: 10.1192/j.eurpsy.2022.2350
28. Li, Y, Du, X, Shi, S, Chen, M, Wang, S, Huang, Y, et al. Trends in prevalence and multimorbidity of metabolic, cardiovascular, and chronic kidney diseases among US adults with depression from 2005 to 2020. J Affect Disord. (2025) 372:262–8. doi: 10.1016/j.jad.2024.12.021
29. Schuch, FB, Vancampfort, D, Firth, J, Rosenbaum, S, Ward, PB, Silva, ES, et al. Physical activity and incident depression: a Meta-analysis of prospective cohort studies. Am J Psychiatry. (2018) 175:631–48. doi: 10.1176/appi.ajp.2018.17111194
30. Pearce, M, Garcia, L, Abbas, A, Strain, T, Schuch, FB, Golubic, R, et al. Association between physical activity and risk of depression: a systematic review and Meta-analysis. JAMA Psychiatry. (2022) 79:550–9. doi: 10.1001/jamapsychiatry.2022.0609
31. Cao, C, Friedenreich, CM, and Yang, L. Association of Daily Sitting Time and Leisure-Time Physical Activity with Survival among US Cancer survivors. JAMA Oncol. (2022) 8:395–403. doi: 10.1001/jamaoncol.2021.6590
32. Rutherford, ER, Vandelanotte, C, and Chapman, JTo QG. Associations between depression, domain-specific physical activity, and BMI among US adults: NHANES 2011-2014 cross-sectional data. BMC Public Health. (2022) 22:1618. doi: 10.1186/s12889-022-14037-4
33. Lei, L, Li, J, Wang, W, Yu, Y, Pu, B, Peng, Y, et al. The associations of "weekend warrior" and regularly active physical activity with abdominal and general adiposity in US adults. Obesity. (2024) 32:822–33. doi: 10.1002/oby.23986
34. Wu, J, Qiu, P, and Li, Y. The association between 'weekend warrior', regular exercise, and cognitive function in elderly individuals with and without depressive symptoms: a cross-sectional analysis from NHANES 2011-2014. J Affect Disord. (2024) 367:1–7. doi: 10.1016/j.jad.2024.08.184
35. Yang, D, Yang, M, Bai, J, Ma, Y, and Yu, C. Association between physical activity intensity and the risk for depression among adults from the National Health and nutrition examination survey 2007-2018. Front Aging Neurosci. (2022) 14:844414. doi: 10.3389/fnagi.2022.844414
36. Huang, AA, and Huang, SY. Increased vigorous exercise and decreased sedentary activities are associated with decreased depressive symptoms in United States adults: analysis of the National Health and nutrition examination survey (NHANES) 2017-2020. Health Sci Rep. (2023) 6:e1473. doi: 10.1002/hsr2.1473
37. Borrega-Mouquinho, Y, Sánchez-Gómez, J, Fuentes-García, JP, Collado-Mateo, D, and Villafaina, S. Effects of high-intensity interval training and moderate-intensity training on stress, depression, anxiety, and resilience in healthy adults during coronavirus disease 2019 confinement: a randomized controlled trial. Front Psychol. (2021) 12:643069. doi: 10.3389/fpsyg.2021.643069
38. Gujral, S, Aizenstein, H, Reynolds, CF 3rd, Butters, MA, and Erickson, KI. Exercise effects on depression: Possible neural mechanisms. Gen Hosp Psychiatry. (2017) 49:2–10. doi: 10.1016/j.genhosppsych.2017.04.012
39. Bluthé, RM, Pawlowski, M, Suarez, S, Parnet, P, Pittman, Q, Kelley, KW, et al. Synergy between tumor necrosis factor alpha and interleukin-1 in the induction of sickness behavior in mice. Psychoneuroendocrinology. (1994) 19:197–207. doi: 10.1016/0306-4530(94)90009-4
40. Dantzer, R. Cytokine-induced sickness behavior: where do we stand? Brain Behav Immun. (2001) 15:7–24. doi: 10.1006/brbi.2000.0613
41. Dantzer, R, O'Connor, JC, Freund, GG, Johnson, RW, and Kelley, KW. From inflammation to sickness and depression: when the immune system subjugates the brain. Nat Rev Neurosci. (2008) 9:46–56. doi: 10.1038/nrn2297
42. Pedersen, BK, and Febbraio, MA. Muscle as an endocrine organ: focus on muscle-derived interleukin-6. Physiol Rev. (2008) 88:1379–406. doi: 10.1152/physrev.90100.2007
43. Tyring, S, Gottlieb, A, Papp, K, Gordon, K, Leonardi, C, Wang, A, et al. Etanercept and clinical outcomes, fatigue, and depression in psoriasis: double-blind placebo-controlled randomised phase III trial. Lancet. (2006) 367:29–35. doi: 10.1016/s0140-6736(05)67763-x
44. Rethorst, CD, Toups, MS, Greer, TL, Nakonezny, PA, Carmody, TJ, Grannemann, BD, et al. Pro-inflammatory cytokines as predictors of antidepressant effects of exercise in major depressive disorder. Mol Psychiatry. (2013) 18:1119–24. doi: 10.1038/mp.2012.125
45. Fischer, CP. Interleukin-6 in acute exercise and training: what is the biological relevance? Exerc Immunol Rev. (2006) 12:6–33.
46. Gleeson, M, Bishop, NC, Stensel, DJ, Lindley, MR, Mastana, SS, and Nimmo, MA. The anti-inflammatory effects of exercise: mechanisms and implications for the prevention and treatment of disease. Nat Rev Immunol. (2011) 11:607–15. doi: 10.1038/nri3041
47. Starkie, R, Ostrowski, SR, Jauffred, S, Febbraio, M, and Pedersen, BK. Exercise and IL-6 infusion inhibit endotoxin-induced TNF-alpha production in humans. FASEB J. (2003) 17:884–6. doi: 10.1096/fj.02-0670fje
48. Paolucci, EM, Loukov, D, Bowdish, DME, and Heisz, JJ. Exercise reduces depression and inflammation but intensity matters. Biol Psychol. (2018) 133:79–84. doi: 10.1016/j.biopsycho.2018.01.015
49. Aly, M, Alzahrani, T, Fakehy, M, Abass, M, and Mohamed, S. Motor skill experience modulates attentional processing regardless of open- or closed-skill types: an ERP study. Front Psychol. (2024) 15:1460684. doi: 10.3389/fpsyg.2024.1460684
50. AA, AMM, Hasan, A, and RA, KHA. Sport experience and physical activity: event-related brain potential and task performance indices of attention in young adults. J Funct Morphol Kinesiol. (2019) 4:33. doi: 10.3390/jfmk4020033
51. Alizadeh, PH. Possible role of exercise therapy on depression: effector neurotransmitters as key players. Behav Brain Res. (2024) 459:114791:114791. doi: 10.1016/j.bbr.2023.114791
52. Zhao, JL, Jiang, WT, Wang, X, Cai, ZD, Liu, ZH, and Liu, GR. Exercise, brain plasticity, and depression. CNS Neurosci Ther. (2020) 26:885–95. doi: 10.1111/cns.13385
53. Ross, RE, Saladin, ME, George, MS, and Gregory, CM. High-intensity aerobic exercise acutely increases brain-derived neurotrophic factor. Med Sci Sports Exerc. (2019) 51:1698–709. doi: 10.1249/mss.0000000000001969
54. Arent, SM, Walker, AJ, and Arent, MA. The effects of exercise on anxiety and depression. Handb Sport Psychol. (2020):872–90. doi: 10.1002/9781119568124.ch42
55. Castonguay, FC, and Pitts, MJ. Seeking help for depression: applying the health belief model to illness narratives. South Commun J. (2016) 81:289–303. doi: 10.1080/1041794X.2016.1165729
56. Hu, Y, Son, K, Yang, Z, and Mao, Y. Moderated by personal perception: the preventive relationship between home HIIT dance and depression during the COVID-19 pandemic in China. Front Public Health. (2023) 11:1117186. doi: 10.3389/fpubh.2023.1117186
57. Uhm, KE, Jung, H, Woo, MW, Kwon, HE, Oh-Park, M, Lee, BR, et al. Influence of preparedness on caregiver burden, depression, and quality of life in caregivers of people with disabilities. Front Public Health. (2023) 11:1153588. doi: 10.3389/fpubh.2023.1153588
58. Hao, H, and Kim, M. Moderating role of depression in the association between leisure activity and cognitive function among the disabled older people. Front Public Health. (2024) 12:1345699. doi: 10.3389/fpubh.2024.1345699
59. Dzhambov, AM, Hartig, T, Tilov, B, Atanasova, V, Makakova, DR, and Dimitrova, DD. Residential greenspace is associated with mental health via intertwined capacity-building and capacity-restoring pathways. Environ Res. (2019) 178:108708. doi: 10.1016/j.envres.2019.108708
60. Huang, AA, and Huang, SY. Exploring depression and nutritional covariates amongst US adults using shapely additive explanations. Health Sci Rep. (2023) 6:e1635. doi: 10.1002/hsr2.1635
Keywords: accelerometer, depression symptoms, physical activity, MIMS, adults
Citation: You J, Long J, Wang Z and Yang Y (2025) Associations of physical activity volume and intensity with depression symptoms among US adults. Front. Public Health. 13:1592961. doi: 10.3389/fpubh.2025.1592961
Edited by:
Mario R. Louzã, University of São Paulo, BrazilReviewed by:
Mohamed Aly, Assiut University, EgyptSamuel Huang, Virginia Commonwealth University, United States
Copyright © 2025 You, Long, Wang and Yang. This is an open-access article distributed under the terms of the Creative Commons Attribution License (CC BY). The use, distribution or reproduction in other forums is permitted, provided the original author(s) and the copyright owner(s) are credited and that the original publication in this journal is cited, in accordance with accepted academic practice. No use, distribution or reproduction is permitted which does not comply with these terms.
*Correspondence: Yanan Yang, eWFuZ3lhbmFuX3N1c0AxNjMuY29t