 Zihao Liu
 Youhui Lin
 Li Liang2
- 1School of Traditional Chinese Medicine, Beijing University of Chinese Medicine, Beijing, China
- 2School of Management, Beijing University of Chinese Medicine, Beijing, China
Background: Iodine deficiency remains a leading preventable cause of childhood developmental intellectual disability (DID), imposing a substantial and enduring global public health burden; despite decades of global efforts to combat iodine deficiency, persistent health inequalities and uneven progress highlight critical gaps. This study aimed to comprehensively analyze the global burden, temporal trends, and inequalities in childhood DID attributable to iodine deficiency from 1990 to 2021 and projected to 2040. Our results will inform evidence-based public health policies, especially in the most affected areas.
Methods: This observational study utilized secondary data from the Global Burden of Disease 2021 study, which covered 204 countries and territories. The burden of DID was stratified by age, sex, and region. Age-standardized prevalence rates (ASPR) and age-standardized years lived with disability (ASYR) were calculated. Trends were analyzed using joinpoint regression by estimated the annual percent change and average annual percent change (AAPC). Health inequalities were assessed using the slope index of inequality. Forecasts to 2040 were generated using the Bayesian age-period-cohort model.
Results: Global ASPR declined from 43.06 to 8.96/100,000 (AAPC = −4.95) and ASYR from 7.71 to 1.67/100,000 (AAPC = −4.81) between 1990 and 2021. Despite this progress, low socio-demographic index (SDI) regions, particularly Central Sub-Saharan Africa and South Asia, continue to bear the highest burden. Somalia had the highest 2021 rates (ASPR: 47.86; ASYR: 9.40/100,000). SDI correlated negatively with ASPR (R = −0.62, p < 0.001) and ASYR (R = −0.62, p < 0.001). The slope index showed reductions in decline rates for prevalence (−19.256 [95%CI: −26.992, −11.520] to −12.531 [−16.107, − 8.955]) and YLDs (−3.662 [−5.047, − 2.276] to −2.451 [−3.144, − 1.757]), though overlapping confidence intervals indicated non-significance. Projections suggest stable ASPR/ASYR by 2040 but rising absolute cases (489,983 prevalent cases; 85,491 YLDs).
Conclusion: While public health interventions have reduced the global burden of DID caused by iodine deficiency, persistent inequalities in vulnerable regions demand urgent policy action: scaling up universal salt iodization programs in high-burden areas, integrating maternal nutrition education into primary healthcare systems, and prioritizing resource allocation to regions with stagnating SDI indices.
1 Introduction
Developmental intellectual disability (DID) is a mental disorder characterized by below-average intelligence or cognitive ability during childhood (1). Children with developmental disabilities, particularly those in low- and middle-income countries, often face stigma and negative societal attitudes and beliefs from birth (2). These challenges heighten their vulnerability to neglect, exploitation, and violence, as well as increase the risk of premature death, including infanticide (3, 4).
The etiology of DID is believed to involve a complex interplay of factors, including genetic predispositions (5); parental health and behaviors, such as smoking and alcohol consumption during pregnancy (6); complications during childbirth; maternal or early-life infections; and exposure to high levels of environmental toxins, such as lead (7). Beyond these factors, many leading causes of disability are linked to the complications of infections and nutritional deficiencies (8), including iodine deficiency (9). Iodine deficiency, a significant global health issue, disrupts the synthesis of thyroid hormones, leading to numerous diseases related to metabolism and growth (10). Liang et al. (11) reported the global burden of iodine deficiency. There were 8.08 million incident cases of iodine deficiency in 2021. However, although severe iodine deficiency has been eliminated in virtually all countries, populations across numerous nations remain at risk of mild-to-moderate iodine insufficiency (12–14). Iodine deficiency exhibits a particularly high prevalence among children and adolescents. According to the most recent evidence, approximately 12.1 million children were influenced by iodine deficiency in 2019 (15). These conditions pose a serious threat to physical health and development. Thyroid hormones influence nearly all tissues in the body and play an essential role in regulating and sustaining growth, development, and metabolism at various life stages (16). In early childhood, thyroid hormone deficiency can result in irreversible intellectual developmental disabilities due to its critical role in neurodevelopment (17).
Previous studies have documented the burden of iodine deficiency among children and the associated disability attributable to DID in this population (8, 18). Yang et al. (19) analyzed the global burden of DID caused by iodine deficiency across all age groups from 1990 to 2019, identifying a disproportionately high burden in regions with low socio-demographic index (SDI). However, their study did not provide specific insights into the burden of DID among children under the age of 15. To address this gap, the present study analyzes the burden, trends, and health inequalities associated with childhood developmental intellectual disability caused by iodine deficiency from 1990 to 2021, based on the Global Burden of Disease (GBD) Study 2021. The findings aim to inform public health policymakers, guiding resource allocation and global efforts to promote child health.
2 Methods
2.1 Overview
The study design was an observational ecological time-trend study with forecasting components. Utilizing secondary data from the GBD 2021, which provides a comprehensive evaluation of health loss associated with 369 diseases, injuries, and impairments, as well as 88 risk factors, across 204 countries and territories, employing the latest epidemiological data and refined standardized methods.
2.2 Data extraction
Estimation of DID burden caused by Iodine deficiency was downloaded from the GBD result tool1 and stratified into three age groups: 0–4 years, 5–9 years, and 10–14 years for analysis. SDI is the geometric mean of the total fertility rate for individuals under age 25, the average age of 15 and above, and those with an education level of 15 and above, and per capita lagging distribution income. As a complex, a position with SDI 0 will have a theoretical minimum developmental level related to health, while a position with SDI 1 would have the highest level.
2.3 Burden description
This study recalculated the age-standardized rate (ASR) for the population aged 0–15 years. The calculation of the age-standardized rate was based on the standard population distribution of the World Health Organization (20), using the direct standardization method. The specific formula is as follows:
Where wi is the weight of the i-th age group in the standard population, and ri is the age-specific rate.
The count, age-standardized prevalence rate, and age-standardized years lived with disability (YLD) rate (ASPR, ASYR) of DID caused by Iodine deficiency were reported at the global, regional, and national levels. Additionally, the description examines the demographic influence by comparing the genders (female, male, and both genders), age groups (categorized in 5-year intervals), and socioeconomic levels (high SDI, middle-high SDI, middle SDI, middle-low SDI, and low SDI). Descriptions of burden were with 95% uncertainty intervals (95% UI).
2.4 Trends analysis
Trend analysis mainly adopts the connection point regression method, which is a statistical method used to analyze trend changes in time series data by identifying “connection points,” dividing the time series into multiple stages, and calculating the average annual percent change (AAPC) and annual percent change (APC) of each segment and its 95% confidence interval (CI).
2.5 Health inequality assessment
The slope index of inequality (SII) was used to evaluate cross-country health inequality. The SII is an absolute measure of health inequality provided by the WHO Health Equity Assessment Toolkit Plus.13 In this study, the slope index of inequality represents the difference in estimated ASR between the country or territory with the lowest and highest SDI, accounting for population size through a regression model. The slope index is calculated by ranking a weighted sample of the population from the lowest to highest SDI. Greater absolute values of the slope index indicate higher levels of inequality.
2.6 BAPC prediction
Future trends in burden (2022–2050) were projected using a Bayesian age-period-cohort (BAPC) model. This approach accounts for age-specific effects, temporal trends (period), and birth cohort influences. Non-informative priors were applied to age, period, and cohort parameters. The posterior distributions were estimated via Markov Chain Monte Carlo simulations.
The R Software (version 4.2.2) was used to perform all analysis and visualization.
3 Results
3.1 Burden of DID due to Iodine deficiency in 2021
In five SDI regions, the highest-burden occurred in regions with low and low-middle SDI, followed by high and middle SDI. In contrast, the lowest was found in high SDI (Table 1). ASPR and ASYR of DID due to Iodine deficiency in 2021 were 8.96 cases (95% CI: 5.31–12.69) per 100,000 and 1.67 YLDs (95% CI: 0.82–2.79) per 100,000 (Table 1). Further, among all age groups, people aged 10–14 had the highest prevalence and YLDs. In contrast, children under five always had the lowest figures of these estimates (Figure 1).
Table 1. Burden of developmental intellectual disorder caused by Iodine deficiency in 2021 and trends from 1990 to 2021.
Figure 1. Number and rate of developmental intellectual disorder caused by Iodine deficiency among regions in 2021. (A) Prevalence; (B) YLD. YLD: Years lived with disability.
In five SDI regions, the highest-burden occurred in regions with low SDI and low-middle SDI, followed by high-middle SDI and middle SDI, while the lowest was found in high SDI (Table 1). At the regional level, in 2021, the highest ASPR and ASYR of DID due to Iodine deficiency were in Central Sub-Saharan Africa, followed by South Asia (Table 1; Figure 1). However, East Asia showed the lowest ASPR and ASYR in 2021. Regarding the sex, the prevalence of DID due to Iodine deficiency was more considerable among females than males, so as the YLDs (Figure 1).
At the national level, the ASPR attributable to DID due to Iodine deficiency in 2021 varies among countries. The ASPR varied from 0.13/100,000 in Indonesia to 47.86/100,000 in Somalia (Figure 2; Table 1), of which five countries (Somalia, Yemen, the Democratic Republic of the Congo, Central African Republic, and Afghanistan) were over 30.00/100,000 and 16 countries were below 1.00/100,000. Similarly, Indonesia was also the lowest (0.03/100,000) about ASYR, while Somalia was the highest (9.40/100,000), followed by Yemen, Democratic Republic of the Congo, Central African Republic, Afghanistan, and Pakistan, where rates were estimated to exceed 5.00/100,000 (Figure 2; Table 1).
Figure 2. Age-standardized rates of developmental intellectual disorder caused by Iodine deficiency among countries/territories in 2021. (A) Prevalence; (B) YLD. YLD: Years lived with disability. ASPR: Age-standardized prevalence rate; ASYR: Age-standardized years lived with disability rate.
3.2 Trends of DID due to Iodine deficiency from 1990 to 2021
In the global analysis of 111 countries and regions, we evaluated the number of DID due to Iodine deficiency and ASR trends between 1990 and 2021. The annual cases number decreased from 741,573 in 1990 to 1868,825 in 2021, and the ASPR decreased from 43.06/100,000 in 1990 to 8.96/100,000 in 2021 (Table 1; Figures 3, 4), with an AAPC -4.95 (95% CI: −5.52 to −4.36). At the same time, the YLDs decreased from 132,831 in 1990 to 34,878 in 2021, and the ASYR generally showed a downward trend, from 7.71/100,000 in 1990 [95% UI 4.22–12.24] (Table 1) dropped to 1.67/100,000 in 2021 [95% UI 0.82–2.79] (Table 1), with an AAPC −4.81 (95% CI: −5.36 to −4.26). More specifically, as shown in Figure 3, ASPR and ASYR have significantly decreased from 1990 to 1999 (ASPR: APC = −8.78; ASYR: APC = −8.64); however ASPR and ASPR showed a slight upward trend from 1999 to 2007 (ASYR: APC = 2.84; ASYR = 2.75); from 2007 to 2017 (ASYR: APC = −7.81; ASPR: APC = −7.58) and from 2017 to 2021 (ASPR: APC = −3.83; ASYR: APC = −3.55), ASPR showed a significant downward trend.
Figure 3. Trends in global developmental intellectual disorder caused by Iodine deficiency from 1990 to 2021. (A) Prevalence; (B) YLD. YLD: Years lived with disability.
According to different age groups, the annual number of diseases and the annual YLDs accounted for the most significant proportion in the 10-14-year-old group and the smallest in the <5-year-old group. Generally, from 1990 to 2021, the annual number of diseases and annual YLDs in different age groups showed a downward trend (Figure 4).
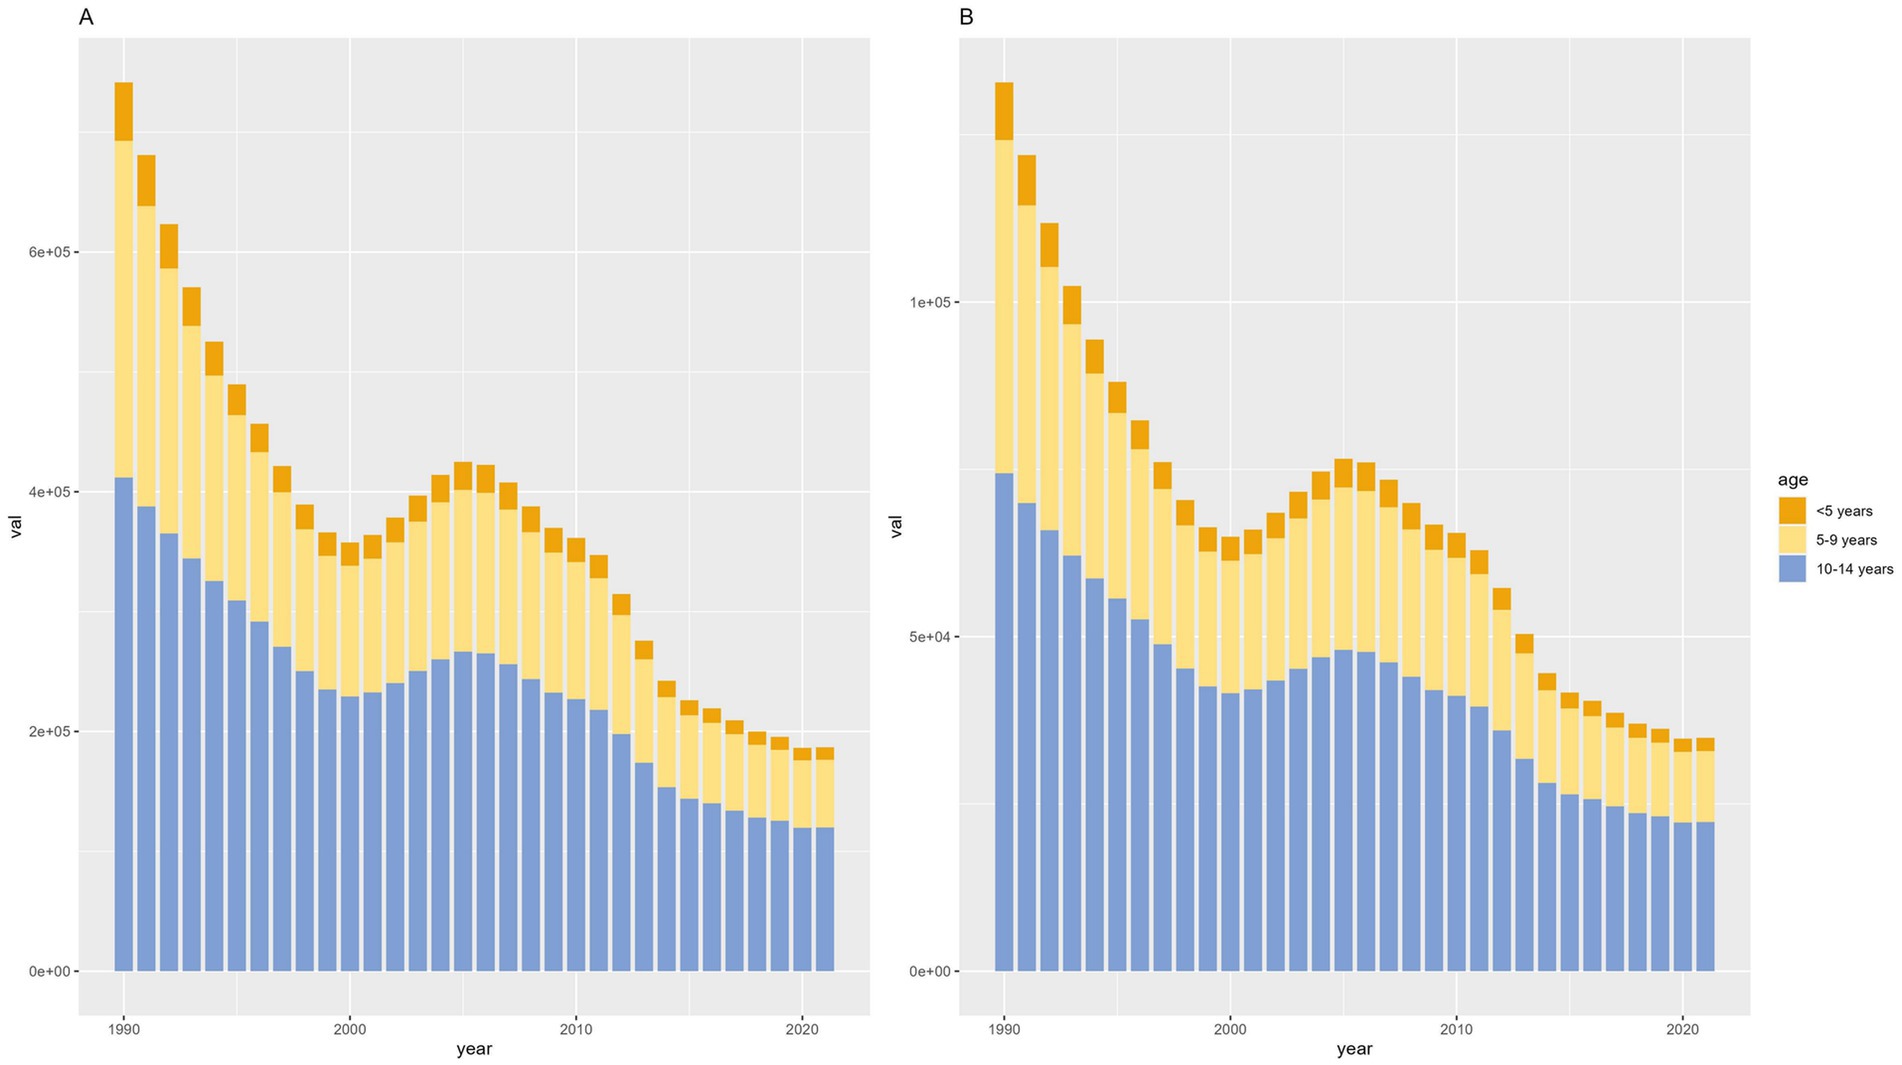
Figure 4. Counts of developmental intellectual disorder caused by Iodine deficiency between the ages of 1990 to 2021. (A) Prevalence; (B) YLD. YLD: Years lived with disability.
At the regional level, the ASPR and ASYR of DID caused by Iodine deficiency decreased in most regions over the three decades. Significantly, South Asia showed the most significant decline from 1990 to 2021, with an AAPC of −6.44 (95% CI: −7.19 to −5.68) in ASPR and an AAPC of −6.41 (95% CI: −7.17 to −5.65) in ASYR. However, the DID burden in Eastern Europe and Central Sub-Saharan Africa was observed to be increasing at an abnormally high rate. Regarding the SDI quintile, between 1990 and 2021, the ASPR and ASYR of DID due to Iodine deficiency observed a most notable decline in Middle SDI regions, with an AAPC -8.47 (95% CI: −9.77 to −7.14). The burden was slightly decreased in high SDI regions but remained at the lowest level compared with other SDI regions (Figure 5).
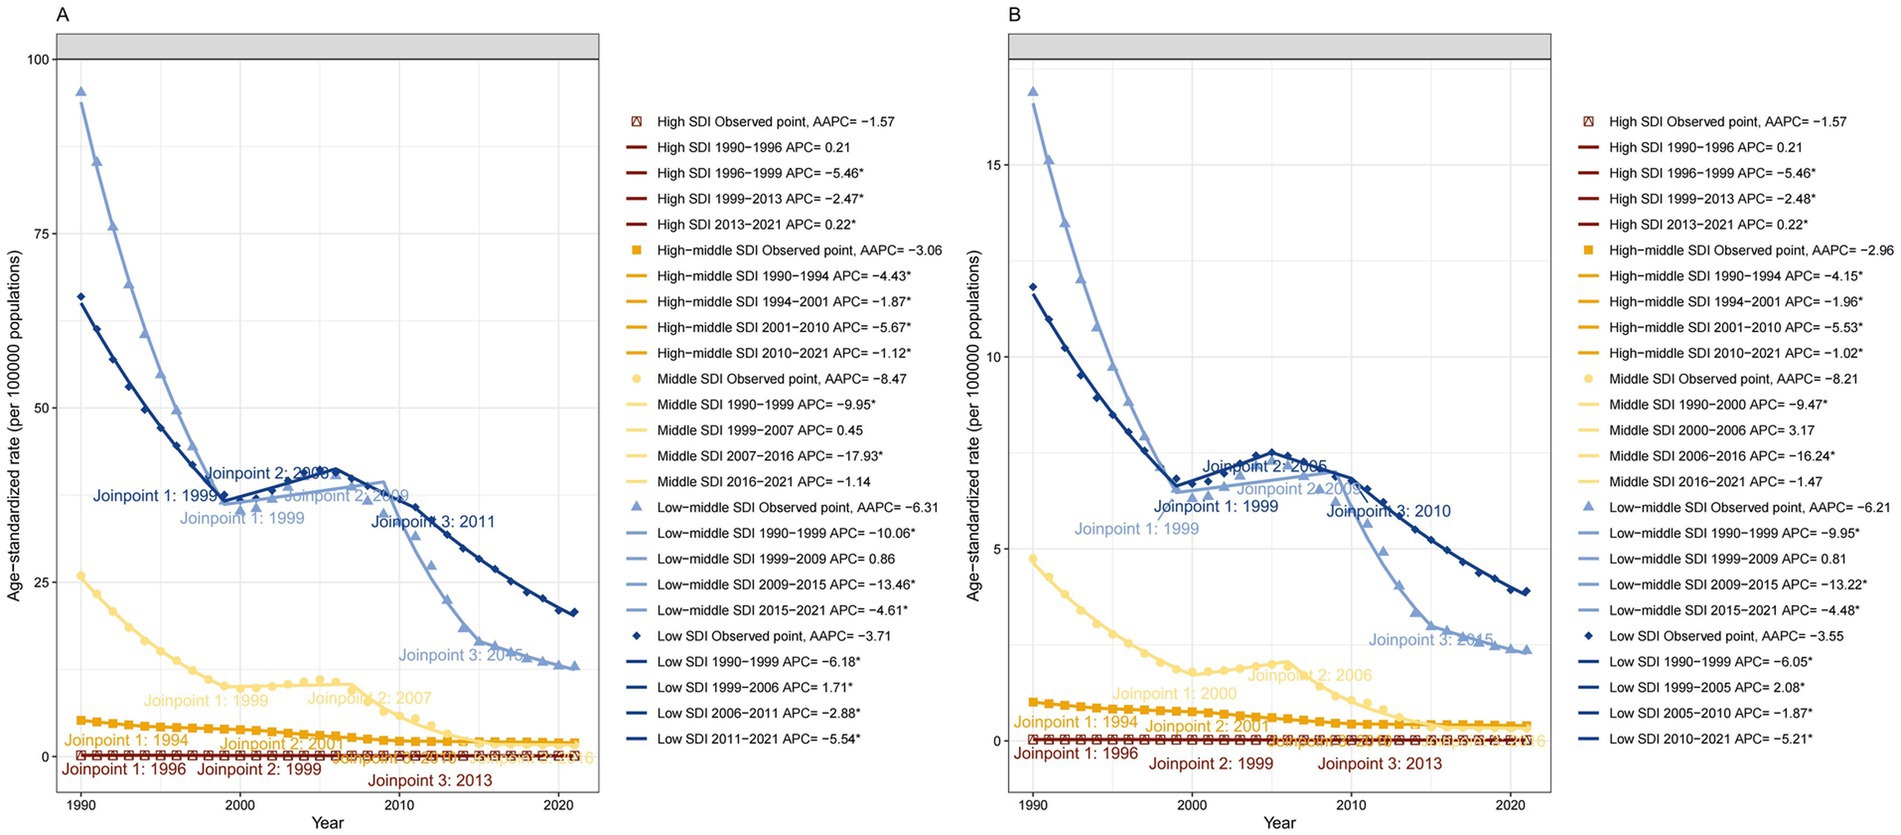
Figure 5. Trends in developmental intellectual disorder caused by Iodine deficiency among 5 SDI regions from 1990 to 2021. (A) Prevalence; (B) YLD. YLD: Years lived with disability.
At the national level, the most noticeable increase in the ASPR and ASDR of DID from 1990 to 2021 was observed in the Russian Federation, with an AAPC AAPCs of 0.97 (95% CI: 0.69 to 1.25) in ASPR and 0.96 (95% CI: 0.68 to 1.25) in ASDR The most apparent decrease of ASPR and ASDR in India, with an AAPC of −7.15 (95% CI: 0.69 to 1.25) in ASPR and −7.2 (95% CI: −8.09 to −6.3) in ASDR (Table 1).
3.3 Health inequality of DID due to iodine deficiency
Figure 6 reflected a distinct inverted U-shaped relationship between the SDI and ASPR of DID. ASPR exhibited a rapid rise, peaking at an SDI of 0.3, followed by a gradual decline with further increases in SDI. Notably, a strong inverse correlation emerged between SDI and both ASPR (R = −0.62, p < 0.001) and ASYR (R = −0.62, p < 0.001).
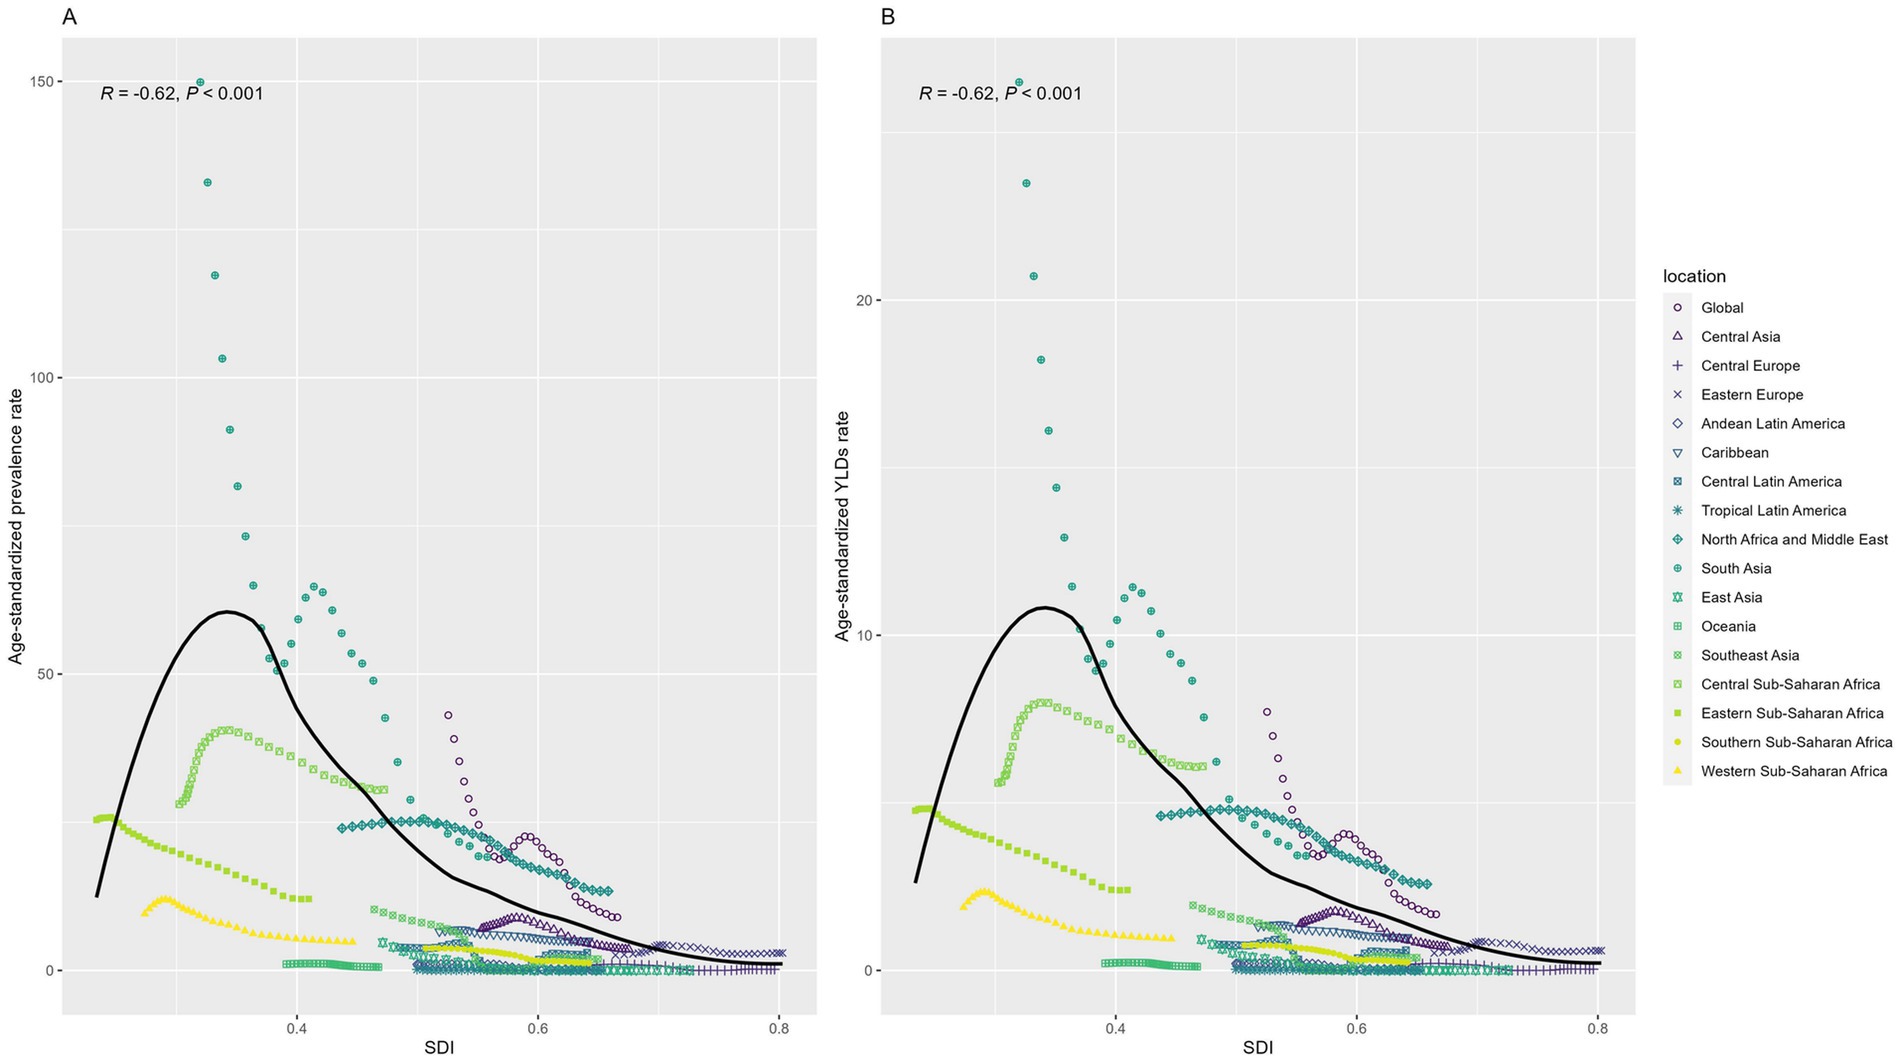
Figure 6. Relation between Age-standardized rates and SDI among regions from 1990 to 2021. (A) Prevalence; (B) YLD. YLD: Years lived with disability. SDI: socio-demographic index.
We further quantitatively evaluated the degree of health inequality of DID caused by Iodine deficiency regarding the SDI in 1990 and 2021 with the Slope index. In 1990 and 2021, the SII shows a decrease for both prevalence and YLDs from 1990 to 2021, with values shifting from −19.256 (95% CI -26.992 to −11.520) to −12.531 (95% CI -16.107 to −8.955) for prevalence and from −3.662 (95% CI −5.047 to −2.276) to −2.451 (95% CI -3.144 to −1.757) for YLDs, respectively (Figure 7). The decline suggests a reduction in the gap in the burden of DID between the highest and lowest SDI countries during this period. However, the difference is not statistically significant compared to the CI intervals.
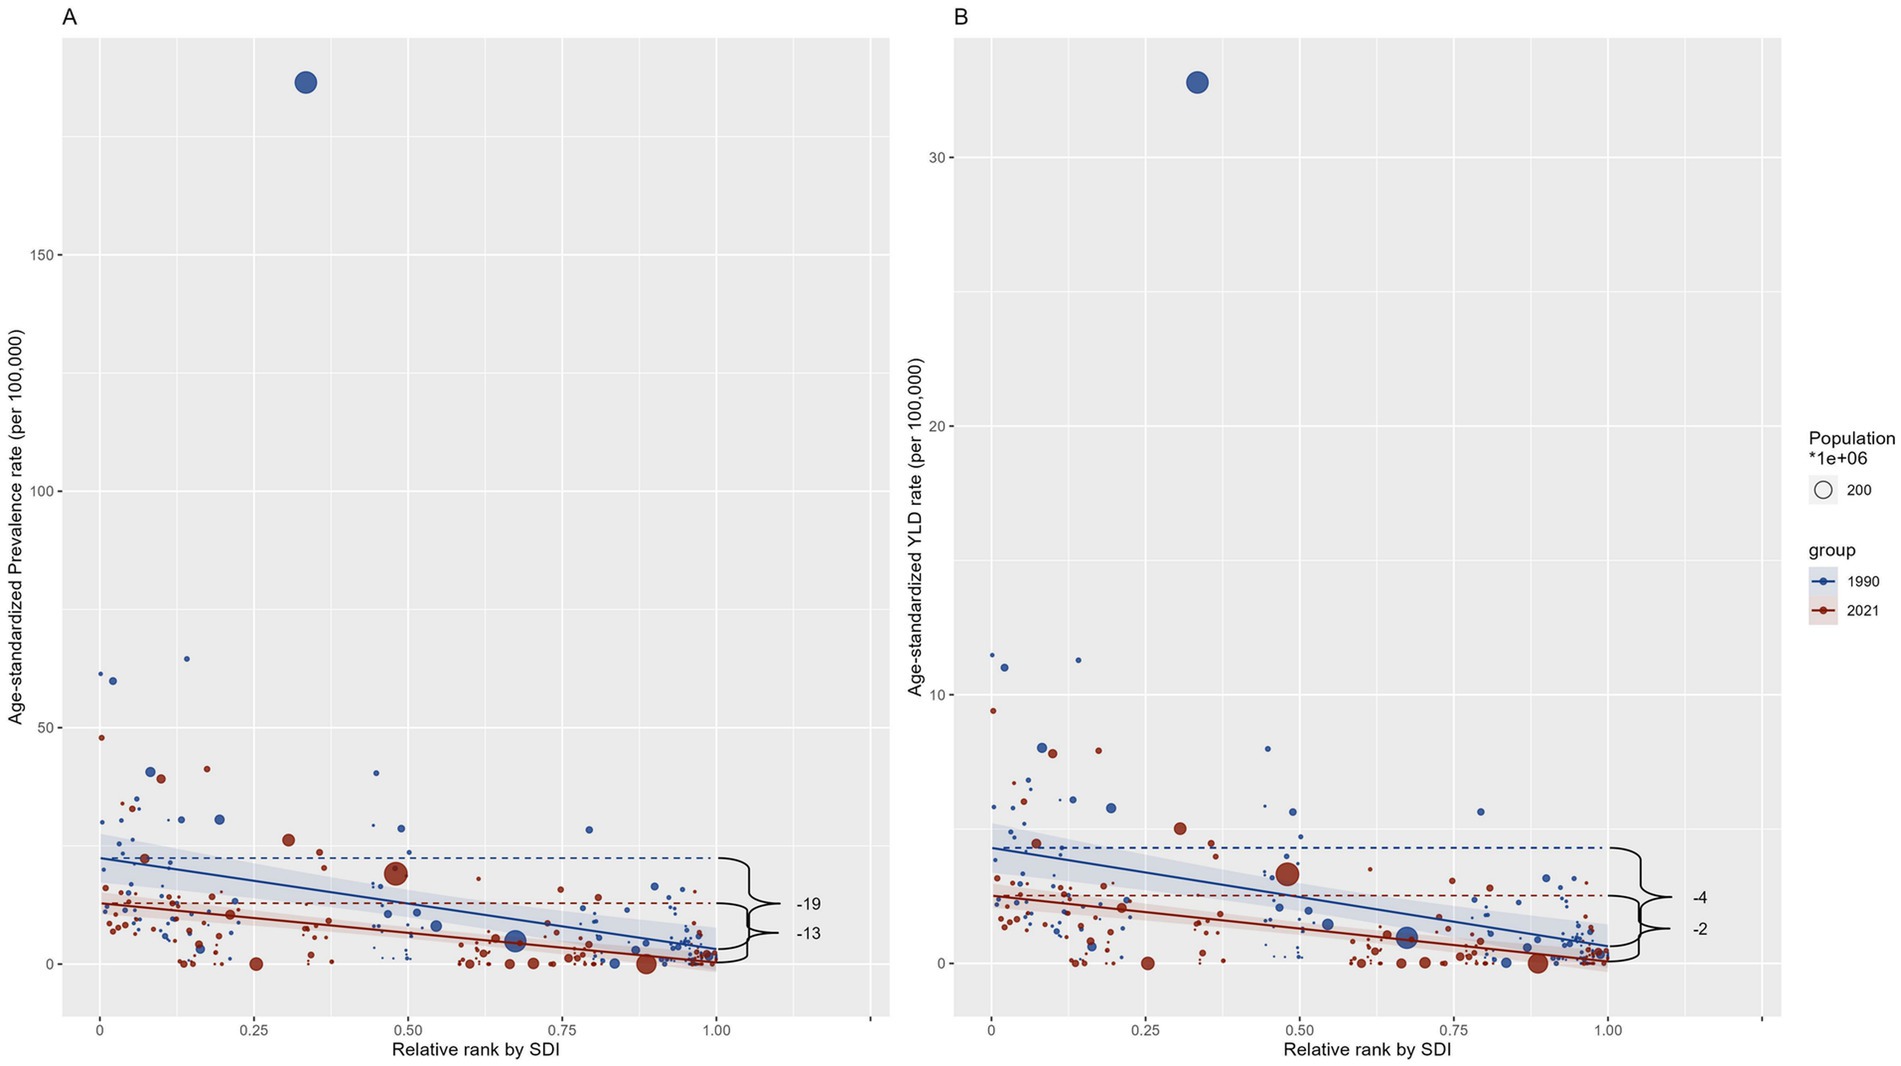
Figure 7. Slope index of ASRs among countries regarding the population and SDI in 1990 and 2021. (A) Prevalence; (B) YLD. YLD: Years lived with disability. SDI: socio-demographic index.
3.4 The predicted burden of DID due to Iodine deficiency, 2022–2040
Prediction analysis using the BAPC model indicated a global increase in DID due to Iodine deficiency from 2022 to 2040. The prevalence of DID due to Iodine deficiency, which decreased from 741,570 in 1990 to 18,184 in 2021, is expected to increase to 489,983 in 2040. The YLDs of DID due to Iodine deficiency, which decreased from 132,827 in 1990 to 33,866 in 2021, is expected to rise to 85,491 in 2040. The ASPR and ASYR of DID due to Iodine deficiency are expected to remain stable (Figure 8).
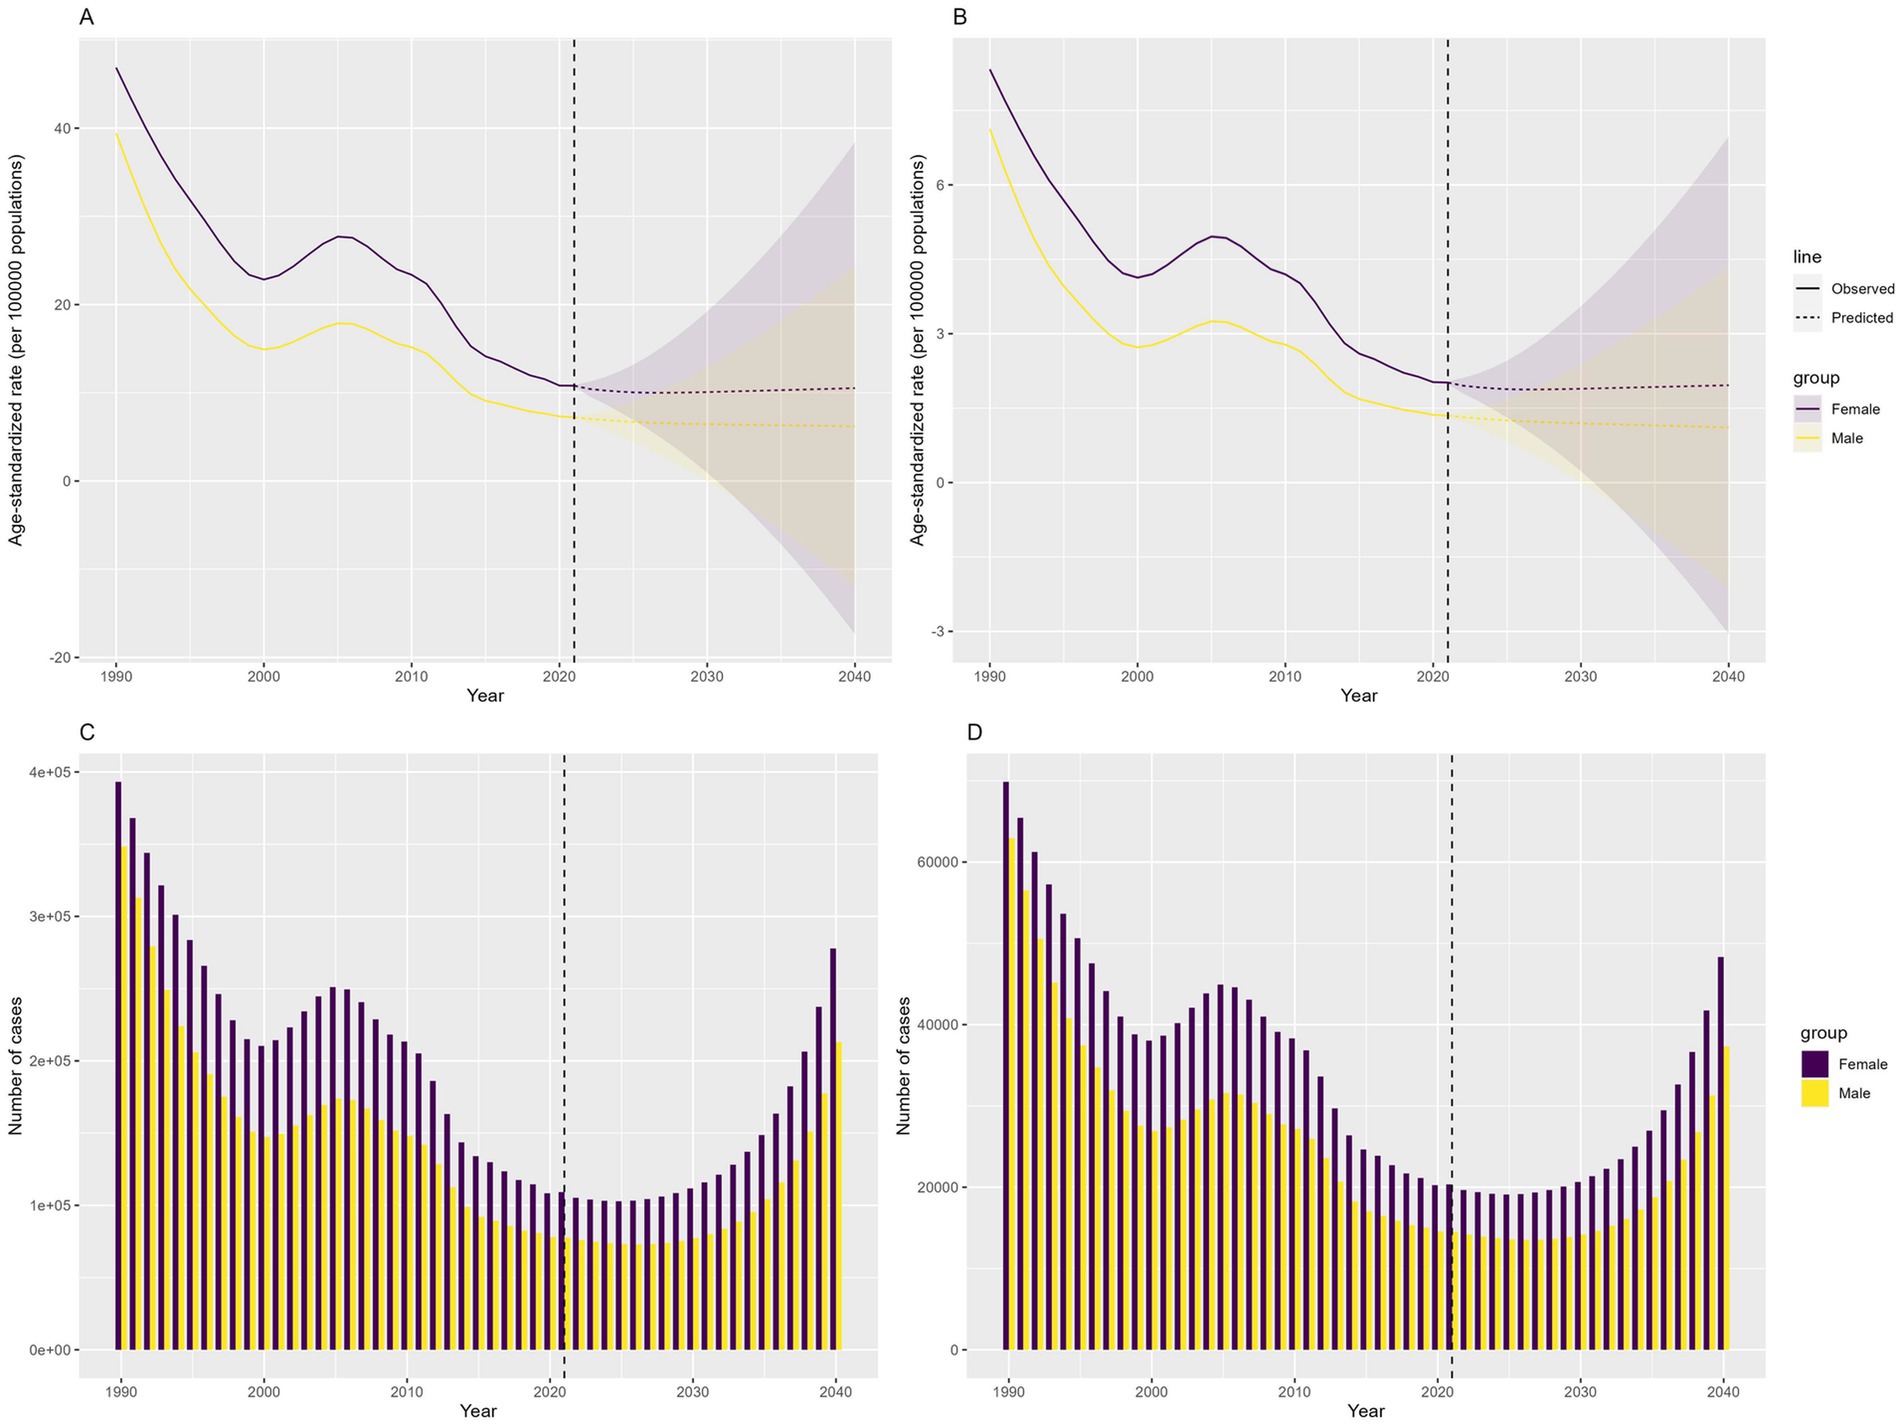
Figure 8. Predicted number and ASRs of the global burden of developmental intellectual disorder caused by Iodine deficiency from 2022 to 2040. (A) ASPR; (B) ASYR; (C) Prevalence number; (D) YLDs. YLD: Years lived with disability.
4 Discussion
This new research reveals a striking 62% reduction in childhood DID caused by iodine deficiency from 1990 to 2021. Global prevalence rates and YLDs demonstrate steady decreases, with lower SDI regions achieving the most dramatic progress—sub-Saharan Africa saw a 63% drop in cases. Despite progress, alarming inequities persist: Low-SDI areas still carry a 10 times higher DID burden than high-income regions, highlighting urgent unmet needs.
Iodine deficiency disrupts the synthesis of thyroid hormones, which is critical for childhood neurodevelopment (21, 22). Moreover, insufficient iodine supply during pregnancy can lead to fetal brain damage (23, 24). Observational studies have shown that both low and high maternal iodine intake during pregnancy are associated with poorer neurodevelopmental outcomes in children (23, 25–27). A cohort study of 800 mother-infant pairs in Australia found that mean iodine intake during pregnancy below ~185 μg/day was associated with poorer cognitive and language scores in children at 18 months of age (28, 29). Therefore, the Declaration on the Survival, Protection, and Development of Children was formulated after the 1989 World Summit for Children held by the United Nations in New York, which states that every mother has the right to adequate iodine nutrition to ensure the normal brain development of newborns (30, 31).
However, in 2020, the diets of 21 countries worldwide were still deficient in iodine (32) particularly in developing countries. According to the WHO, 42.6% of the African population had low iodine intake (33). The negative correlation between SDI and the burden of iodine deficiency-related DID demonstrates a transparent socioeconomic gradient. The decline in the SII over the study period indicates progress in reducing global health disparities. Iodine exists in nature as iodide, which is present in seawater and evaporates into the atmosphere and returns to the soil. However, in inland areas, this cycle is incomplete, and the iodide in the soil has already been depleted (34). In central and eastern sub-Saharan Africa, insufficient access to iodized salt and limited dietary diversity have contributed to the increase in iodine deficiency. This is particularly true for rural populations, who rely on non-iodized salt, and where infrastructure to support sustained salt iodization remains weak (10). Previous studies have also observed the heavy burden of iodine deficiency in Africa (11, 35–37).
Liang et al. (11) employed extreme gradient boosting to predict the future trend of iodine deficiency and reported that the prevalence of iodine deficiency peaks at around 20–45 years. Similarly, our study, through BAPC prediction, also observed that the global DID caused by iodine deficiency will reach its peak in 2040. Wang and Feng (38) pointed out that malnutrition caused severe mental disability among children in underdeveloped regions. Our analysis aligns with established evidence confirming the outsized impact of iodine deficiency on childhood cognition across developing economies (7, 39).
Iodine supplementation programs have been initiated globally, including direct iodine supplementation and iodine fortification of foods. For example, as one of the countries severely affected by iodine deficiency disorders, China implemented the Universal Salt Iodization (USI) program in 1995, successfully eliminating iodine deficiency as a public health problem (40, 41). USI has reduced the incidence of iodine deficiency in most regions and has also contributed to reducing the burden of DID caused by iodine deficiency (12). Meanwhile, over the past three decades, the WHO, the UN, and other international organizations have prioritized efforts to eliminate hunger and malnutrition. The Food and Agriculture Organization of the United Nations (FAO) and the United Nations Children’s Fund have set global goals to reduce hunger and malnutrition (42). The Sustainable Development Goals (SDG) 2.2, which aim to end all forms of malnutrition and hunger, have also promoted the improvement of iodine deficiency in low-income regions (43).
However, the improvements remain modest and require further action. These stark contrasts highlight the critical role of socioeconomic development and health infrastructure in mitigating iodine deficiency-related health outcomes. Our study also reveals the implementation effect of USI in lower SDI regions, with the ASPR and ASYR showing a significant decline in low-SDI and low-middle SDI regions. Although the burden of DID caused by iodine deficiency has increased in Russia and Ukraine over the past 30 years, the study indicates that this may be attributed to the impact of the Chernobyl disaster (44, 45). Overall, it cannot be ignored that the negative slope index indicates that health inequalities still exist.
Thus, these results underscore the importance of targeted public health interventions to address iodine deficiency, particularly in regions with low SDI. Policymakers should take these findings into account to prioritize resource allocation and devise interventions aimed at promoting iodine supplementation and nutrition education, particularly in Central Sub-Saharan Africa and South Asia. This entails strengthening the implementation and monitoring of iodized salt distribution, especially in low SDI regions. Additionally, it is crucial to enhance public health campaigns by launching education programs targeting pregnant women and caregivers to raise awareness about the significance of iodine in early childhood development. Integrating iodine supplementation into maternal and child healthcare services in high-risk regions is also essential. Moreover, addressing broader socioeconomic factors through the promotion of development policies that improve education, healthcare access, and poverty reduction is necessary to foster an enabling environment for better health outcomes.
5 Strengths and Limitations
The present study offers significant strengths. First, to our knowledge, this study is the first comprehensive global analysis of childhood DID burden attributable to iodine deficiency. Second, our findings derive credibility from the use of standardized methodologies and open-access data from the GBD study, ensuring reproducibility while minimizing the ethical concerns associated with primary data collection. Additionally, the integration of projections to 2040, coupled with explicit quantification of disparities across SDI regions, delivers actionable evidence for prioritizing interventions in high-burden regions.
Despite these strengths, several limitations warrant consideration. First, as an observational ecological study, our design precludes causal inferences between iodine deficiency and DID outcomes, reflecting inherent constraints in secondary data analysis. Second, while GBD data provides global coverage, potential misestimation may arise from heterogeneous diagnostic criteria across regions, unmeasured confounders (e.g., genetic predispositions, environmental toxins, or sociocultural factors influencing iodine uptake), and aggregated reporting that precludes individual-level analysis. Finally, our 2040 projections rely on current epidemiological patterns; unexpected shifts in interventions such as salt iodization policies, socioeconomic disruptions, or emergent comorbidities could alter burden trajectories not captured by the Bayesian model.
6 Conclusion
The findings underscore the significant decline in the global burden of childhood DID attributable to iodine deficiency from 1990 to 2021, driven by improved public health interventions, such as USI and SDG 2.2. However, substantial disparities persist, with low SDI regions, particularly Central Sub-Saharan Africa and South Asia, continuing to bear a disproportionately high burden. Policymakers should prioritize expanding USI, enhancing nutrition education, and addressing broader socioeconomic determinants to mitigate health inequalities further.
To strengthen the evidence base, future research should investigate how local contextual factors influence intervention effectiveness across different regions, incorporate individual-level biomarker assessments, such as urinary iodine concentration, to obtain more precise estimates of deficiency impact, and prioritize prospective cohort studies that track individuals from prenatal stages through childhood.
Data availability statement
The original contributions presented in the study are included in the article/Supplementary material, further inquiries can be directed to the corresponding author.
Author contributions
ZL: Writing – original draft, Conceptualization, Visualization. YL: Visualization, Writing – original draft. LL: Data curation, Writing – original draft. XL: Writing – original draft. ZW: Writing – original draft. WC: Writing – review & editing, Conceptualization, Funding acquisition.
Funding
The author(s) declare that financial support was received for the research and/or publication of this article. This work was supported by Beijing Municipal Health Commission (90020672420066 and 90020672420067).
Conflict of interest
The authors declare that the research was conducted in the absence of any commercial or financial relationships that could be construed as a potential conflict of interest.
Generative AI statement
The authors declare that no Gen AI was used in the creation of this manuscript.
Publisher’s note
All claims expressed in this article are solely those of the authors and do not necessarily represent those of their affiliated organizations, or those of the publisher, the editors and the reviewers. Any product that may be evaluated in this article, or claim that may be made by its manufacturer, is not guaranteed or endorsed by the publisher.
Supplementary material
The Supplementary material for this article can be found online at: https://www.frontiersin.org/articles/10.3389/fpubh.2025.1598949/full#supplementary-material
Footnotes
References
1. Liao, P, Vajdic, C, Trollor, J, and Reppermund, S. Prevalence and Incidence of Physical Health Conditions in People with Intellectual Disability - a Systematic Review. PLoS One. (2021) 16:e0256294. doi: 10.1371/journal.pone.0256294
2. Emerson, E, and Llewellyn, G. The Prevalence of Significant Cognitive Delay among 3- to 4-Year-Old Children Growing up in Low- and Middle-Income Countries: Results from 126 Nationally Representative Surveys Undertaken in 73 Countries. J Intellect Disabil Res. (2023) 67:1200–15. doi: 10.1111/jir.12976
3. Liu, Z, Duan, Y, Yang, L, Du, J, and Liu, H. Global Burden of Childhood Nutritional Deficiencies, 1990-2019. Public Health. (2024) 235:26–32. doi: 10.1016/j.puhe.2024.06.027
4. Boulet, SL, Boyle, CA, and Schieve, LA. Health Care Use and Health and Functional Impact of Developmental Disabilities among Us Children, 1997-2005. Arch Pediatr Adolesc Med. (2009) 163:19–26. doi: 10.1001/archpediatrics.2008.506
5. Bowling, KM, Thompson, ML, Amaral, MD, Finnila, CR, Hiatt, SM, Engel, KL, et al. Genomic Diagnosis for Children with Intellectual Disability and/or Developmental Delay. Genome Med. (2017) 9:43. doi: 10.1186/s13073-017-0433-1
6. Eisenbaum, E. Tobacco Product Use and Smoking Frequency among Us Adults with Intellectual and Developmental Disabilities. J Intellect Disabil Res. (2018) 62:709–18. doi: 10.1111/jir.12507
7. Zhang, T, Yin, X, Chen, H, Li, Y, Chen, J, and Yang, X. Global Magnitude and Temporal Trends of Idiopathic Developmental Intellectual Disability Attributable to Lead Exposure from 1990 to 2019: Results from Global Burden of Disease Study. Sci Total Environ. (2022) 834:155366. doi: 10.1016/j.scitotenv.2022.155366
8. Kassebaum, N, Kyu, HH, Zoeckler, L, Olsen, HE, Thomas, K, Pinho, C, et al. Child and adolescent health from 1990 to 2015: findings from the Global Burden of Diseases, Injuries, and Risk Factors 2015 study. JAMA Pediatr. (2017) 171:573–92. doi: 10.1001/jamapediatrics.2017.0250
9. Dong, J, Song, H, Wang, Y, Li, M, Yu, Y, Wang, Y, et al. Maternal Different Degrees of Iodine Deficiency during Pregnant and Lactation Impair the Development of Cerebellar Pinceau in Offspring. Front Neurosci. (2017) 11:298. doi: 10.3389/fnins.2017.00298
10. Zimmermann, MB, Jooste, PL, and Pandav, CS. Iodine-Deficiency Disorders. Lancet. (2008) 372:1251–62. doi: 10.1016/s0140-6736(08)61005-3
11. Liang, D, Wang, L, Zhong, P, Lin, J, Chen, L, Chen, Q, et al. Perspective: Global Burden of Iodine Deficiency: Insights and Projections to 2050 Using Xgboost and Shap. Adv Nutr. (2025) 16:100384. doi: 10.1016/j.advnut.2025.100384
12. Andersson, M, Karumbunathan, V, and Zimmermann, MB. Global Iodine Status in 2011 and Trends over the Past Decade. J Nutr. (2012) 142:744–50. doi: 10.3945/jn.111.149393
13. Kim, BK, Jeong, JY, Seok, KH, Lee, AS, Oak, CH, Kim, GC, et al. Current iodine nutrition status and awareness of iodine deficiency in Tuguegarao, Philippines. Int J Endocrinol. (2014) 2014:210528. doi: 10.1155/2014/210528
14. Wu, Z, Liu, Y, and Wang, W. The Burden of Iodine Deficiency. Arch Med Sci. (2024) 20:1484–94. doi: 10.5114/aoms/178012
15. Jiang, W, Li, X, Wang, R, Du, Y, and Zhou, W. Cross-country health inequalities of four common nutritional deficiencies among children, 1990 to 2019: data from the Global Burden of Disease Study 2019. BMC Public Health. (2024) 24:486. doi: 10.1186/s12889-024-17942-y
16. Brent, GA. Mechanisms of Thyroid Hormone Action. J Clin Invest. (2012) 122:3035–43. doi: 10.1172/jci60047
17. Delange, F. Iodine Deficiency as a Cause of Brain Damage. Postgrad Med J. (2001) 77:217–20. doi: 10.1136/pmj.77.906.217
18. Gong, B, Wang, C, Yang, W, and Shan, Z. Changing Trends in the Global, Regional, and National Burden of Iodine Deficiency among Adolescents and Young Adults: Population-Based Study. Eur J Pediatr. (2024) 183:2855–63. doi: 10.1007/s00431-024-05545-z
19. Yang, X, Liu, C, Liu, Y, He, Z, Li, J, Li, Y, et al. The Global Burden, Trends, and Inequalities of Individuals with Developmental and Intellectual Disabilities Attributable to Iodine Deficiency from 1990 to 2019 and Its Prediction up to 2030. Front Nutr. (2024) 11:1366525. doi: 10.3389/fnut.2024.1366525
20. World Health Organization. World standard population 2000–2025 World Health Organization (2001). Geneva, Switzerland.
21. Sethi, V, and Kapil, U. Iodine Deficiency and Development of Brain. Indian J Pediatr. (2004) 71:325–9. doi: 10.1007/bf02724099
22. Morreale de Escobar, G, Obregón, MJ, Calvo, R, and Escobar del Rey, F. Effects of Iodine Deficiency on Thyroid Hormone Metabolism and the Brain in Fetal Rats: The Role of the Maternal Transfer of Thyroxin. Am J Clin Nutr. (1993) 57:280s–5s. doi: 10.1093/ajcn/57.2.280S
23. de Escobar, GM, Obregón, MJ, and del Rey, FE. Iodine Deficiency and Brain Development in the First Half of Pregnancy. Public Health Nutr. (2007) 10:1554–70. doi: 10.1017/s1368980007360928
24. Morreale de Escobar, G, Obregon, MJ, and del Escobar Rey, F. Role of thyroid hormone during early brain development. Eur J Endocrinol. (2004) 151:U25–37. doi: 10.1530/eje.0.151u025
25. Sullivan, TR, Green, TJ, Gould, JF, Makrides, MM, and Best, KP. Statistical Analysis Plan for the Prenatal Iodine Supplementation and Early Childhood Neurodevelopment (Poppie) Randomised Controlled Trial. Trials. (2025) 26:162. doi: 10.1186/s13063-025-08863-1
26. Choudhury, N, and Gorman, KS. Subclinical Prenatal Iodine Deficiency Negatively Affects Infant Development in Northern China. J Nutr. (2003) 133:3162–5. doi: 10.1093/jn/133.10.3162
27. Aghini Lombardi, FA, Pinchera, A, Antonangeli, L, Rago, T, Chiovato, L, Bargagna, S, et al. Mild iodine deficiency during fetal/neonatal life and neuropsychological impairment in Tuscany. J Endocrinol Investig. (1995) 18:57–62. doi: 10.1007/bf03349700
28. Zhou, SJ, Condo, D, Ryan, P, Skeaff, SA, Howell, S, Anderson, PJ, et al. Association between Maternal Iodine Intake in Pregnancy and Childhood Neurodevelopment at Age 18 Months. Am J Epidemiol. (2019) 188:332–8. doi: 10.1093/aje/kwy225
29. Sullivan, TR, Best, KP, Gould, J, Zhou, SJ, Makrides, M, and Green, TJ. Too Much Too Little: Clarifying the Relationship between Maternal Iodine Intake and Neurodevelopmental Outcomes. J Nutr. (2024) 154:185–90. doi: 10.1016/j.tjnut.2023.09.008
30. Jonsson, U. Nutrition and the convention on the rights of the child. Food Policy. (1996) 21:41–55. doi: 10.1016/0306-9192(95)00071-2
31. Zimmermann, MB, and Boelaert, K. Iodine Deficiency and Thyroid Disorders. Lancet Diabetes Endocrinol. (2015) 3:286–95. doi: 10.1016/s2213-8587(14)70225-6
32. Zimmermann, MB, and Andersson, M. Global Endocrinology: Global Perspectives in Endocrinology: Coverage of Iodized Salt Programs and Iodine Status in 2020. Eur J Endocrinol. (2021) 185:R13–r21. doi: 10.1530/eje-21-0171
33. Tuke, G, Mengistu, W, Kuratu, K, Elias, S, and Gelchu, M. Prevalence of goitre and associated factors among school-aged children in Guraferda district, Southwest Ethiopia. Front Public Health. (2025) 13:1546149. doi: 10.3389/fpubh.2025.1546149
34. Wei, R, Wang, Z, Zhang, X, Wang, X, Xu, Y, and Li, Q. Burden and Trends of Iodine Deficiency in Asia from 1990 to 2019. Public Health. (2023) 222:75–84. doi: 10.1016/j.puhe.2023.06.034
35. Malan, L, Zandberg, L, Visser, MV, Wicks, M, Kruger, HS, and Faber, M. Biochemical Assessment of the Nutritional Status of Infants, Children and Adolescents in South Africa (1997-2022): A Systematic Review. Public Health Nutr. (2024) 27:e210. doi: 10.1017/s136898002400137x
36. Kabthymer, RH, Shaka, MF, Ayele, GM, and Malako, BG. Systematic Review and Meta-Analysis of Iodine Deficiency and Its Associated Factors among Pregnant Women in Ethiopia. BMC Pregnancy Childbirth. (2021) 21:106. doi: 10.1186/s12884-021-03584-0
37. Petry, N, Jallow, B, Sawo, Y, Darboe, MK, Barrow, S, Sarr, A, et al. Micronutrient Deficiencies, Nutritional Status and the Determinants of Anemia in Children 0-59 Months of Age and Non-Pregnant Women of Reproductive Age in the Gambia. Nutrients. (2019) 11:2275. doi: 10.3390/nu11102275
38. Wang, F, and Feng, K. Worldwide Prevalence and Disability from Preterm-Associated Developmental Intellectual Disability during Childhood and Adolescence. Early Hum Dev. (2025) 202:106218. doi: 10.1016/j.earlhumdev.2025.106218
39. GBD 2019 Mental Disorders Collaborators. Global, regional, and national burden of 12 mental disorders in 204 countries and territories, 1990-2019: a systematic analysis for the Global Burden of Disease Study 2019. Lancet Psychiatry. (2022) 9:137–50. doi: 10.1016/s2215-0366(21)00395-3
40. Li, X, Tu, P, Gu, S, Mo, Z, Wu, L, Xing, M, et al. Serum Iodine as a Potential Individual Iodine Status Biomarker: A Cohort Study of Mild Iodine Deficient Pregnant Women in China. Nutrients. (2023) 15:3555. doi: 10.3390/nu15163555
41. Li, X, Zhang, J, Ding, H, Tu, P, Wu, L, Xing, M, et al. Iodine Nutritional Status and Thyroid Autoimmunity in Chinese Children and Adolescents Aged 6-17 Years. Nutrients. (2024) 16:3720. doi: 10.3390/nu16213720
42. Deng, Z, Hu, Y, Wang, X, Li, C, Wang, J, He, P, et al. Transitioning to Healthy and Sustainable Diets Has Higher Environmental and Affordability Trade-Offs for Emerging and Developing Economies. Nat Commun. (2025) 16:3948. doi: 10.1038/s41467-025-59275-3
43. Hailu, BA, Daba, C, Tsega, Y, Asaminew, A, Miheretu, BA, and Endawkie, A. Geospatial Distribution and Multilevel Determinants of Inadequate Minimum Dietary Diversity and Its Consequences for Children Aged 6-23 Months in Sub-Saharan Africa. PLoS One. (2025) 20:e0321254. doi: 10.1371/journal.pone.0321254
44. Jackson, RJ, DeLozier, DM, Gerasimov, G, Borisova, O, Garbe, PL, Goultchenko, L, et al. Chernobyl and iodine deficiency in the Russian Federation: an environmental disaster leading to a public health opportunity. J Public Health Policy. (2002) 23:453–70. doi: 10.2307/3343242
Keywords: iodine deficiency, developmental intellectual disorder, Global Burden of Diseases, childhood, Bayesian age-period-cohort model
Citation: Liu Z, Lin Y, Liang L, Li X, Wang Z and Cheng W (2025) Global burden of childhood developmental intellectual disability caused by iodine deficiency from 1990 to 2021 and projection to 2040. Front. Public Health. 13:1598949. doi: 10.3389/fpubh.2025.1598949
Edited by:
Qi Zhang, Old Dominion University, United StatesReviewed by:
Emmanuel Biracyaza, Université de Montréal, CanadaYajun Wang, Inner Mongolia University, China
Copyright © 2025 Liu, Lin, Liang, Li, Wang and Cheng. This is an open-access article distributed under the terms of the Creative Commons Attribution License (CC BY). The use, distribution or reproduction in other forums is permitted, provided the original author(s) and the copyright owner(s) are credited and that the original publication in this journal is cited, in accordance with accepted academic practice. No use, distribution or reproduction is permitted which does not comply with these terms.
*Correspondence: Wei Cheng, Y2hlbmd3ZWlAYnVjbS5lZHUuY24=