 Peihua Li
 Jia Rui
 Kangguo Li2
 Tianmu Chen
- 1Department of Science and Education, Beijing University of Chinese Medicine Shenzhen Hospital, Shenzhen, China
- 2State Key Laboratory of Molecular Vaccinology and Molecular Diagnostics, School of Public Health, Xiamen University, Xiamen, China
- 3Guizhou Center for Disease Control and Prevention, Guiyang, China
Objectives: This study aimed to investigate the impact of meteorological factors on the incidence and multi-route transmission dynamics of hepatitis E virus (HEV) in Jiangsu Province, China, during the pre-COVID-19 era (2005–2018), and to develop predictive models for informing public health interventions.
Study design: A dual-model study integrating the Multi-Host and Multi-Route Transmission Dynamic Model (MHMRTDM) and Generalized Additive Model (GAM) was employed to quantify meteorological impacts on multi-route HEV transmission.
Methods: HEV incidence data (2005–2018) and meteorological variables from provincial and national agencies were analyzed. The MHMRTDM quantified transmission rate coefficients (β, βw and βp′). GAMs linked the transmission coefficients and incidence to meteorological factors, validated using 2017–2018 data.
Results: The optimal GAM integrated with the MHMRTDM was established (lowest GCV = 1.705 × 10⁻²¹, R2 = 0.980, lowest RMSE = 3.682 × 10⁻¹¹, lowest MAE = 2.987 × 10⁻¹¹). Analysis of four dependent variables (incidence, β, βw and βp′) revealed distinct climate-driven patterns: (1) Incidence exhibited dual seasonal peaks linked to atmospheric pressure, sunshine duration, and humidity; (2) Host-to-person transmission (βp′) was most sensitive to climatic conditions, peaking at 1013 hPa and declining sharply above 75% humidity, while susceptible person-to-infected person (β) and environment-to-person (βw) transmission were primarily modulated by humidity and wind speed; (3) The GAM validation confirmed robust performance for transmission coefficients (p < 0.001). Predictions for 2019–2021 highlighted persistent seasonal bimodality, reinforcing the model’s utility for outbreak forecasting.
Conclusion: Meteorological factors drive HEV transmission through distinct pathways, with host-to-person interactions being particularly climate-sensitive. While the GAM provided valuable insights, future research incorporating behavioral and land-use factors, as well as causal inference models, will be critical for improving the understanding and predictive accuracy of HEV transmission dynamics.
1 Introduction
It is estimated that there are approximately 20 million Hepatitis E virus (HEV) infections worldwide annually, resulting in about 3.3 million symptomatic cases of hepatitis E. According to the World Health Organization, hepatitis E caused approximately 44,000 deaths in 2015, accounting for 3.3% of viral hepatitis-related mortality. China, located in the eastern region of Asia, is an area where hepatitis E is highly endemic.
HEV transmission, primarily occurring via the fecal-oral route through contaminated water and food, is climate-sensitive, with meteorological factors playing a significant role (1–3). While sporadic cases in developed countries arise from zoonotic foodborne transmission (undercooked meat/offal) (4–7), developing countries face waterborne epidemics where seasonal rainfall/monsoons (8, 9) intensify sewage contamination and drought elevates HEV concentrations in domestic water (10, 11). Poor sanitation, limited access to safe water, and insufficient health education further amplify infection risks (12). However, in developed countries, recent travel to endemic regions and consumption of unsafe water have emerged as significant factors contributing to infection (13).
Since the early 20th century, compartmental models have been a cornerstone in infectious disease modeling. Transmission dynamics models can simulate the spread of viral hepatitis by incorporating its transmission characteristics (14–16). Current research models for hepatitis E primarily rely on experimental animal models and basic statistical models. In our previous studies, we developed a Multi-Host and Multi-Route Transmission Dynamic Model (MHMRTDM) to explore the transmission characteristics of HEV (17, 18), which effectively fitted incidence data and analyzed the impact of various intervention measures in the region. Additionally, many research teams have employed spatial autocorrelation analysis or spatial regression analysis to investigate the influence of climate on hepatitis E (19–22). Other studies have designed methods such as Spearman correlation or ensemble learning (23, 24). Especially, generalized additive models (GAMs) have become increasingly pivotal in infectious disease modeling, particularly for characterizing nonlinear relationships between environmental drivers and transmission dynamics (25, 26). However, no studies have yet developed a Generalized Additive Model (GAM) to investigate the impact of meteorological factors on hepatitis E.
Therefore, this study employs a GAM to explore the relationship between meteorological conditions and the incidence and transmission of HEV in Jiangsu Province from 2005 to 2018. The aim is to identify an appropriate model for quantifying meteorological impacts on multi-route HEV transmission and to provide a scientific basis for intervention strategies.
2 Materials and methods
2.1 Study area
Jiangsu Province is located in the eastern coastal region of mainland China, spanning latitudes 30°45′ to 35°08′N and longitudes 116°21′ to 121°56′E. The province experiences a transitional climate from temperate to subtropical zones, characterized by mild temperatures, moderate precipitation, and distinct seasons. The Huai River and the Northern Jiangsu Irrigation Canal serve as a boundary, dividing the province into two climatic zones: the northern region features a warm temperate humid and semi-humid monsoon climate, while the southern region exhibits a subtropical humid monsoon climate.
2.2 Data collection
The incidence data of hepatitis E in Jiangsu Province from 2005 to 2018 were provided by the Jiangsu Provincial Center for Disease Control and Prevention (CDC). This pre-COVID-19 dataset ensures that our analysis reflects baseline transmission patterns independent of pandemic-related disruptions. Meteorological data from January 2005 to March 2017 were collected from the Jiangsu Provincial Meteorological Bureau, including average atmospheric pressure (1 hPa), precipitation (1 mm), relative humidity (1%), sunshine duration (1 h), average temperature (1°C), and average wind speed (1 m/s). These data were aggregated on a monthly basis for fitting the GAM.
From April 2017 to December 2021, meteorological data were obtained from the China Meteorological Administration, including average atmospheric pressure (1 hPa), precipitation (1 mm), relative humidity (1%), sunshine duration (1 h), average temperature (1°C), and average wind speed (1 m/s). To ensure consistency with the monthly time step used in both the MHMRTDM and GAM models, the meteorological data for the period, which were initially recorded on a daily basis, were aggregated to monthly averages. These monthly-averaged meteorological data were then used for the validation and prediction of the model. This adjustment ensures compatibility between the model’s temporal resolution and the input data, improving the robustness of the validation process.
2.3 Multi-host and multi-route transmission dynamic model (MHMRTDM)
This study utilized the established MHMRTDM for hepatitis E to calculate the transmission rate coefficients in Jiangsu Province from 2005 to 2018 (18). These coefficients included the susceptible person-to-infected person contact rate coefficient (β), the reservoir-to-person contact rate coefficient (βw), and the host-to-person contact rate coefficient (βp′). Individual transmission rate coefficients were used to represent different transmission pathways of hepatitis E (Supplementary Figure S1), and their temporal trends were analyzed to reflect the dynamic infection process.
2.4 Study design
The MHMRTDM was used to calculate the transmission rate coefficients (β, βw, and βp′) for hepatitis E transmission across various routes (person-to-person, reservoir-to-person, and host-to-person). These transmission rate coefficients and reported incidence were then treated as dependent variables in the GAM, which was used to quantify the relationship between meteorological factors and the transmission dynamics of hepatitis E. The study design is illustrated in Figure 1.
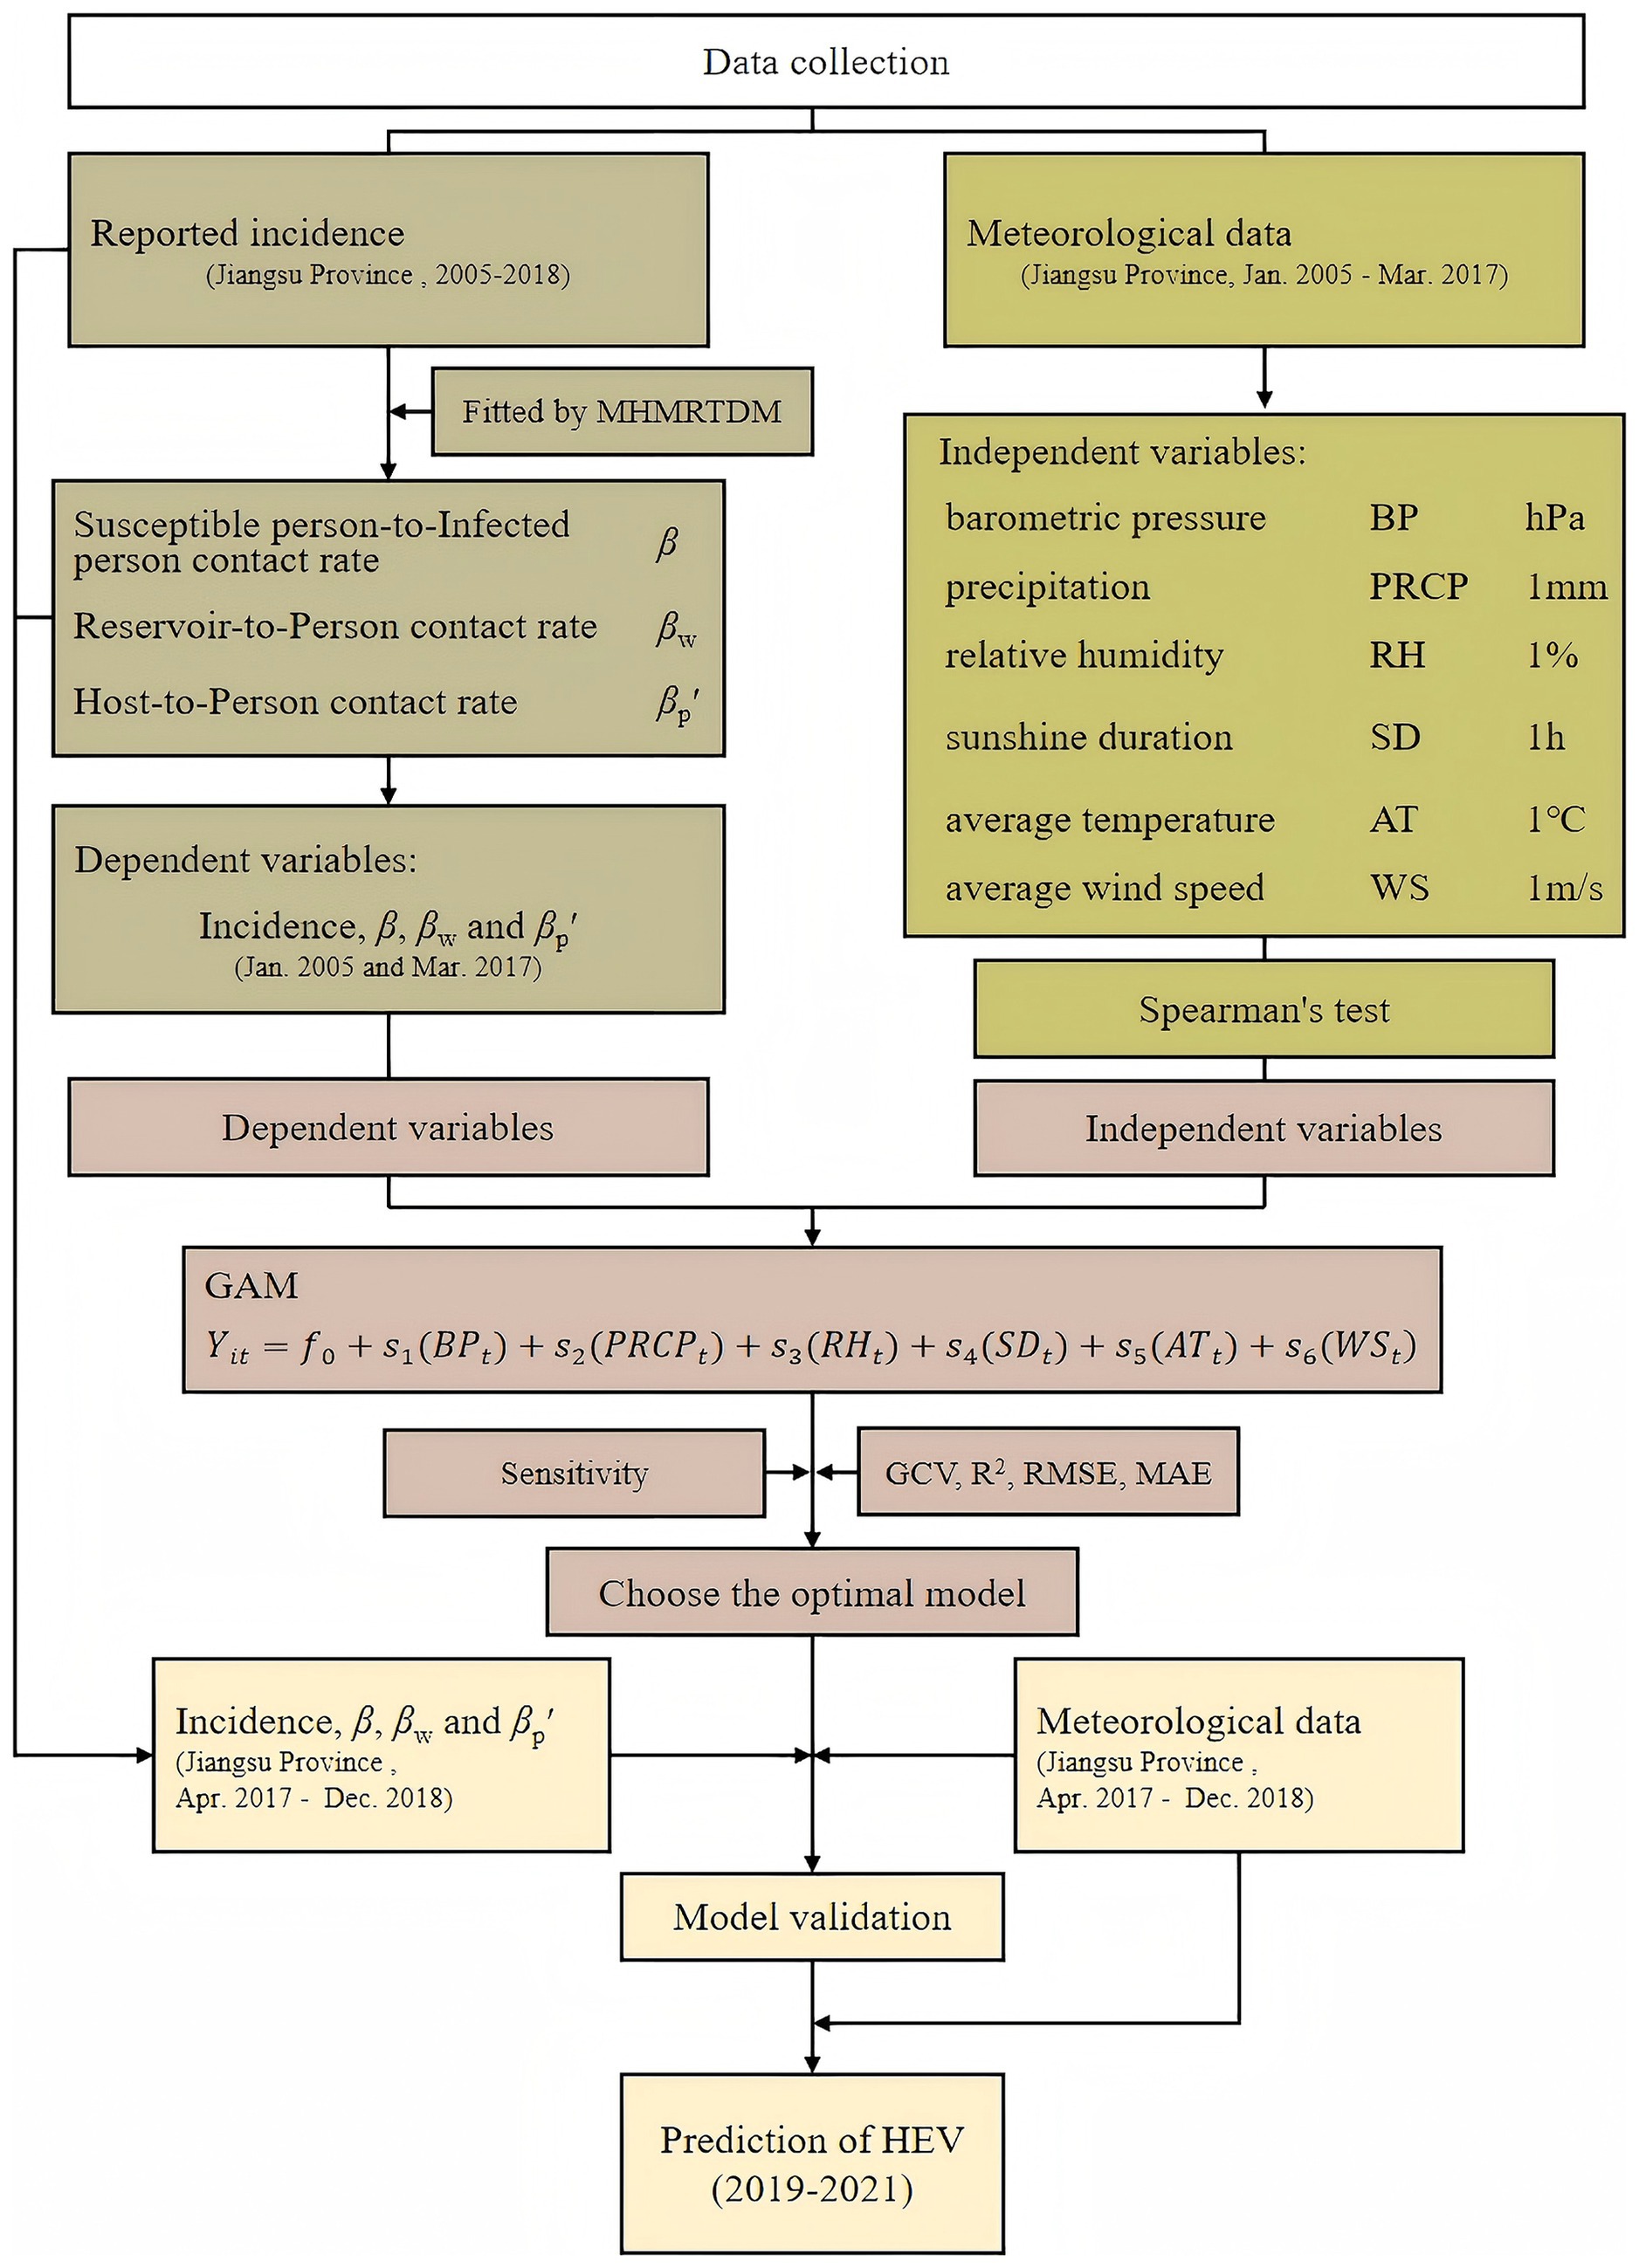
Figure 1. Study design of meteorological factors affect the HEV transmission.
2.5 Construction of the generalized additive model (GAM)
Previous studies have demonstrated that the relationship between meteorological factors and infectious diseases is complex. Therefore, this study employed GAM, using the raw incidence data, β, βw, and βp′ as dependent variables, and average atmospheric pressure (BP, hPa), precipitation (PRCP, mm), relative humidity (RH, %), sunshine duration (SD, h), average temperature (AT, °C), and average wind speed (WS, m/s) as independent variables. The complete model is as follows:
Here, Yit represents the value of different dependent variables (reported incidence, β, βw, or βp′) on day t, and t denotes the time point of the independent variables. The GAM was employed to model the non-linear relationship between the meteorological factors and the transmission rate coefficients (β, βw, and βp′), as well as the incidence of hepatitis E. The smoothing function effectively dealt with the non-linearity of the relationships between independent and dependent variables.
We standardized the β parameters to z-scores and assessed their sensitivity to six climate variables (temperature, precipitation, humidity, pressure, wind speed, sunshine hours) through Pearson correlation, linear regression slopes, and generalized additive models (GAMs) (Supplementary Table S1). Sensitivity was visualized using scatter plots with GAM-fitted smooth curves, arranged in a 2×3 grid (Supplementary Figure S2).
2.6 GAM validation and prediction
The GAM model was validated using incidence data, the transmission rate coefficients and corresponding meteorological data from April 2017 to December 2018 in Jiangsu Province to prevent overfitting. Subsequently, the established and validated GAM was used to predict the incidence and the transmission rate coefficients of hepatitis E in Jiangsu Province from 2019 to 2021.
2.7 Data analysis
Berkeley Madonna 8.3.18 was used to calculate transmission rate coefficients and conduct intervention simulations. Spearman’s correlation test was employed to assess correlations among independent variables, with caution exercised for correlation coefficients greater than 0.7. The “MGCV” package in R 3.2.3 was utilized to construct the GAM and perform predictions. The GAM was estimated using maximum likelihood, and different GAMs were selected based on R2, generalized cross-validation (GCV) score, root mean square error (RMSE) score and mean absolute error (MAE) score. Figures were generated using the “ggplot2” package in R 3.2.3, and tables were created using Excel 2019.
3 Results
3.1 Descriptive characteristics of the data
From 2005 to 2018, a total of 44,923 hepatitis E cases were reported in Jiangsu Province, China, with an average annual incidence rate of 4.12 per 100,000 population. The annual incidence of hepatitis E in Jiangsu Province peaked in 2007 (4.35 per 100,000), 2011 (5.21 per 100,000), and 2013 (4.94 per 100,000), while the lowest incidence was recorded in 2005 at 2.96 per 100,000 (Figure 2). Seasonal patterns in the distribution of meteorological factors over time are also evident in Figure 2, with line graphs for average atmospheric pressure, precipitation, and temperature showing distinct seasonal trends.
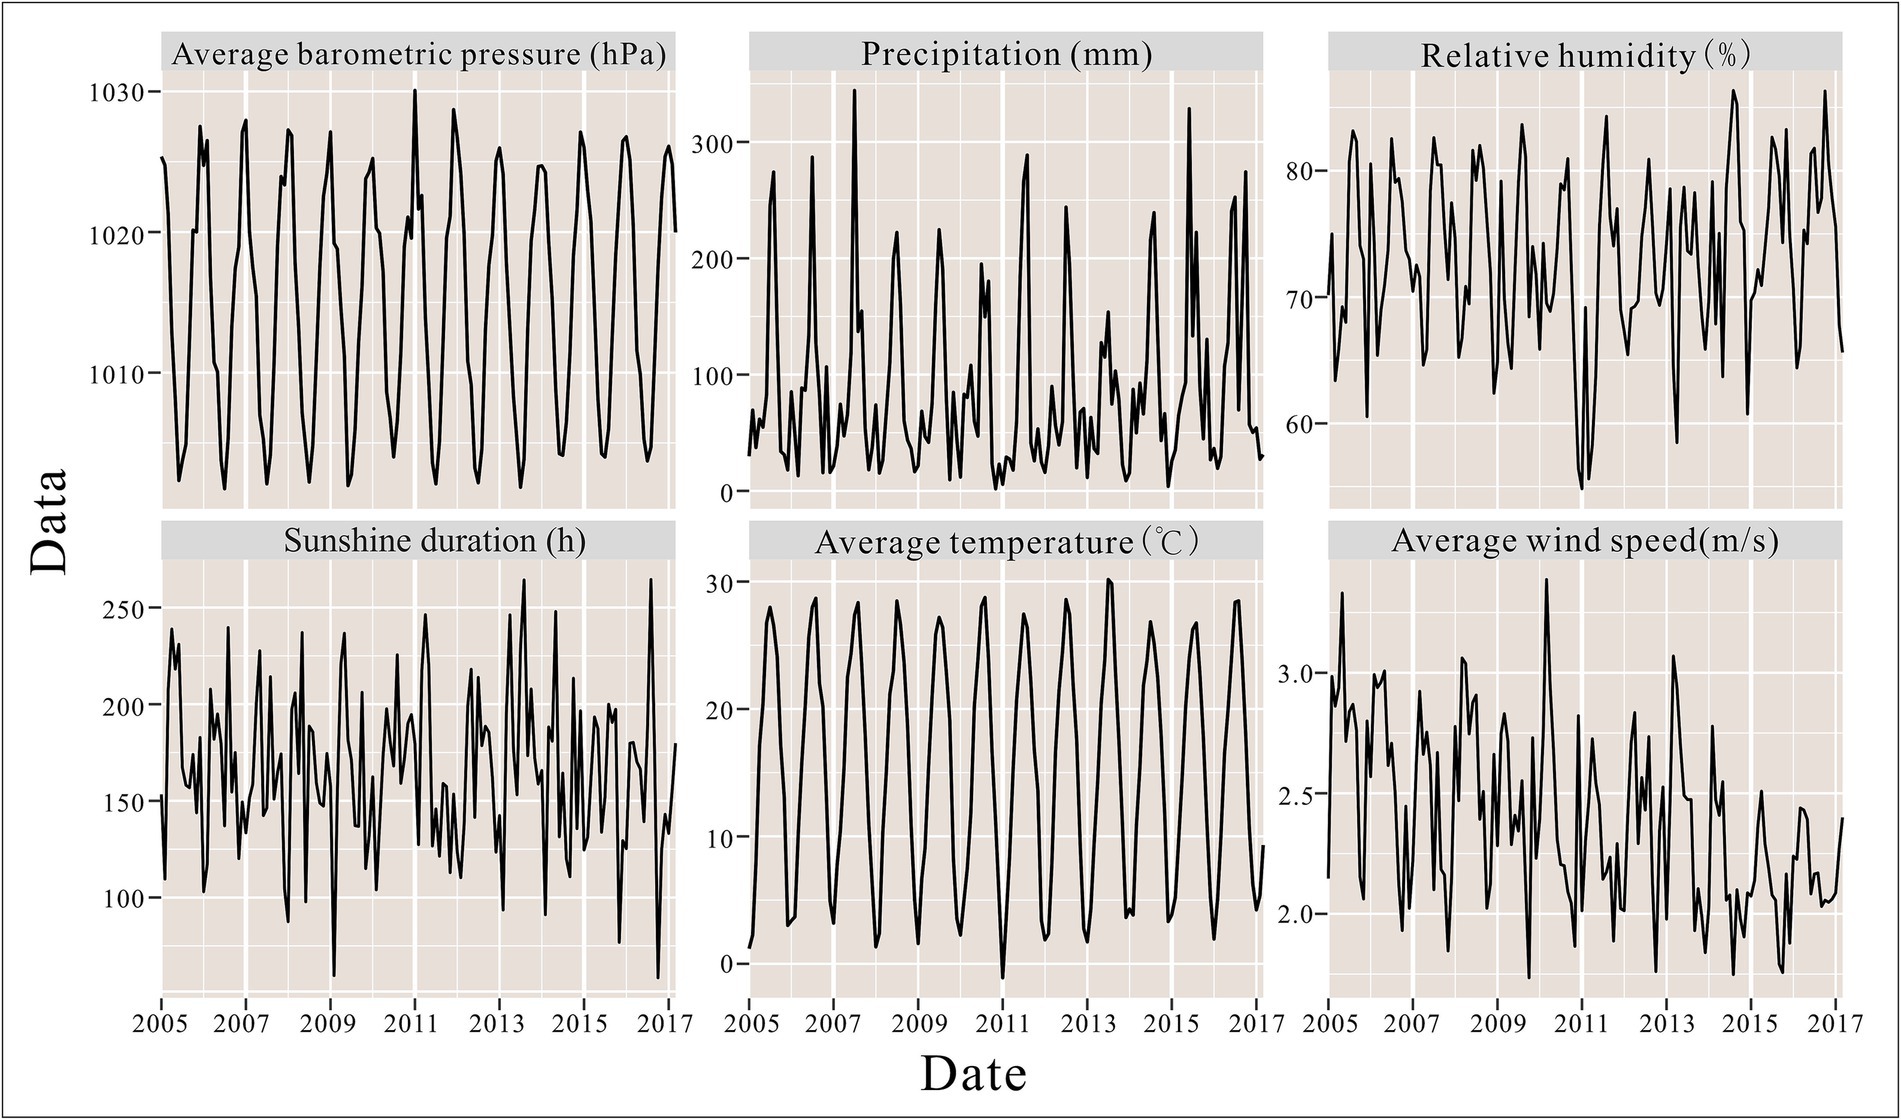
Figure 2. Seasonal patterns in the distribution of meteorological factors.
During the study period, the highest average temperature in Jiangsu Province was 30.16°C, with average atmospheric pressure ranging from 1001.74 to 1030.07 hPa, sunshine duration from 58.50 to 264.48 h, relative humidity from 54.83 to 86.35%, precipitation from 1.84 to 344.22 mm, and wind speed from 1.73 to 3.39 m/s. Detailed summaries of meteorological factors in Jiangsu Province are presented in Table 1.
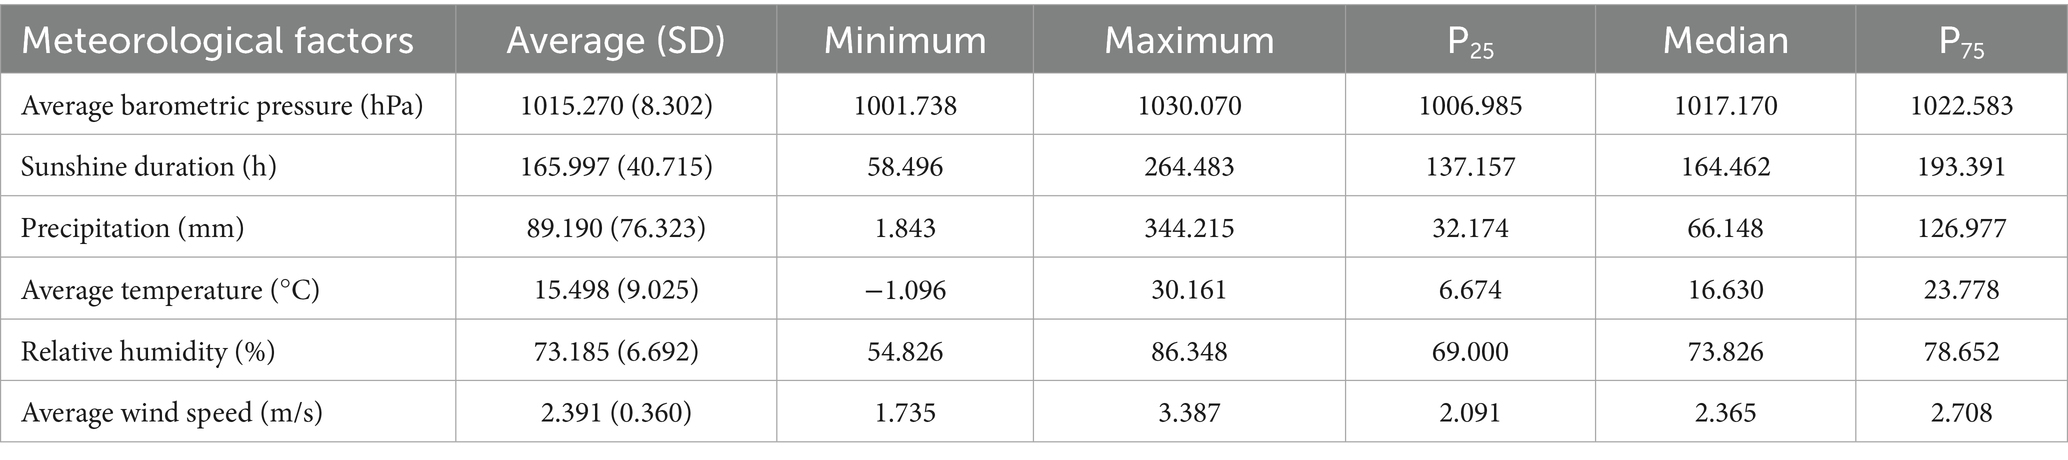
Table 1. Description of meteorological factors in Jiangsu Province, China.
3.2 MHMRTDM fitting results
Figure 3 displays the monthly actual incidence rates and the fitted incidence rates, revealing that hepatitis E in Jiangsu Province exhibits seasonal variations with an initial upward trend followed by a decline. Overall, the simulated monthly reported cases align well with the actual trends (R2 = 0.655; p < 0.001).
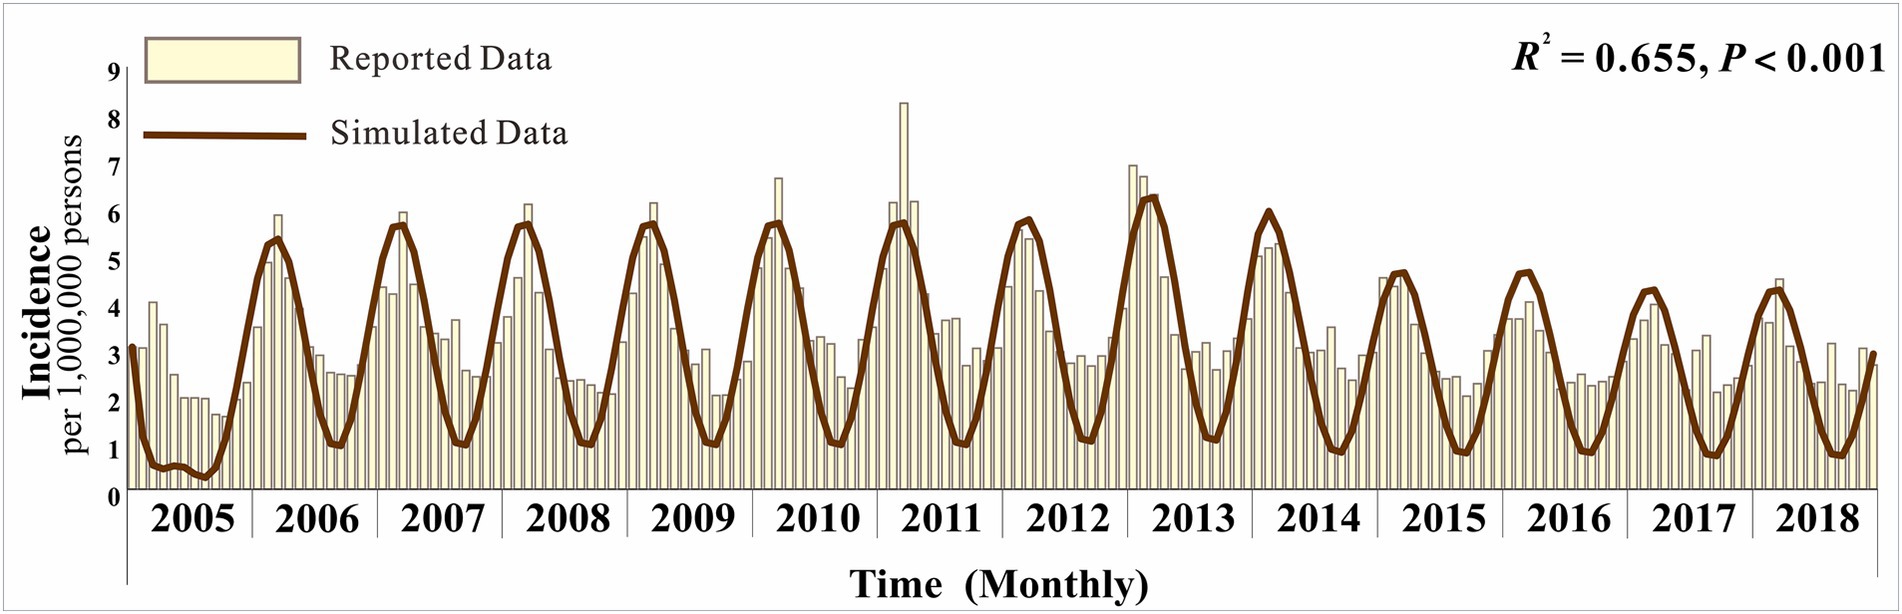
Figure 3. Simulated situation of hepatitis E incidence in Jiangsu Province.
3.3 Correlation analysis of meteorological factors
Based on Spearman’s correlation analysis of meteorological factors, we found that atmospheric pressure was negatively correlated with other factors, showing a strong correlation with temperature (r = −0.946). Additionally, sunshine duration was positively correlated with temperature but negatively correlated with atmospheric pressure and relative humidity. Relative humidity was positively correlated with temperature, precipitation, and month, but negatively correlated with atmospheric pressure and sunshine duration. Temperature showed no correlation with wind speed but was positively correlated with precipitation and relative humidity. Precipitation was not correlated with sunshine duration but was positively correlated with relative humidity and temperature. Wind speed was positively correlated with month but negatively correlated with relative humidity, as shown in Figure 4. Spearman’s correlation analysis revealed that average atmospheric pressure was highly correlated with average temperature (r = −0.946, p < 0.01) and precipitation (r = −0.716, p < 0.01). Therefore, atmospheric pressure was not included simultaneously with these two factors in the same GAM during modeling.
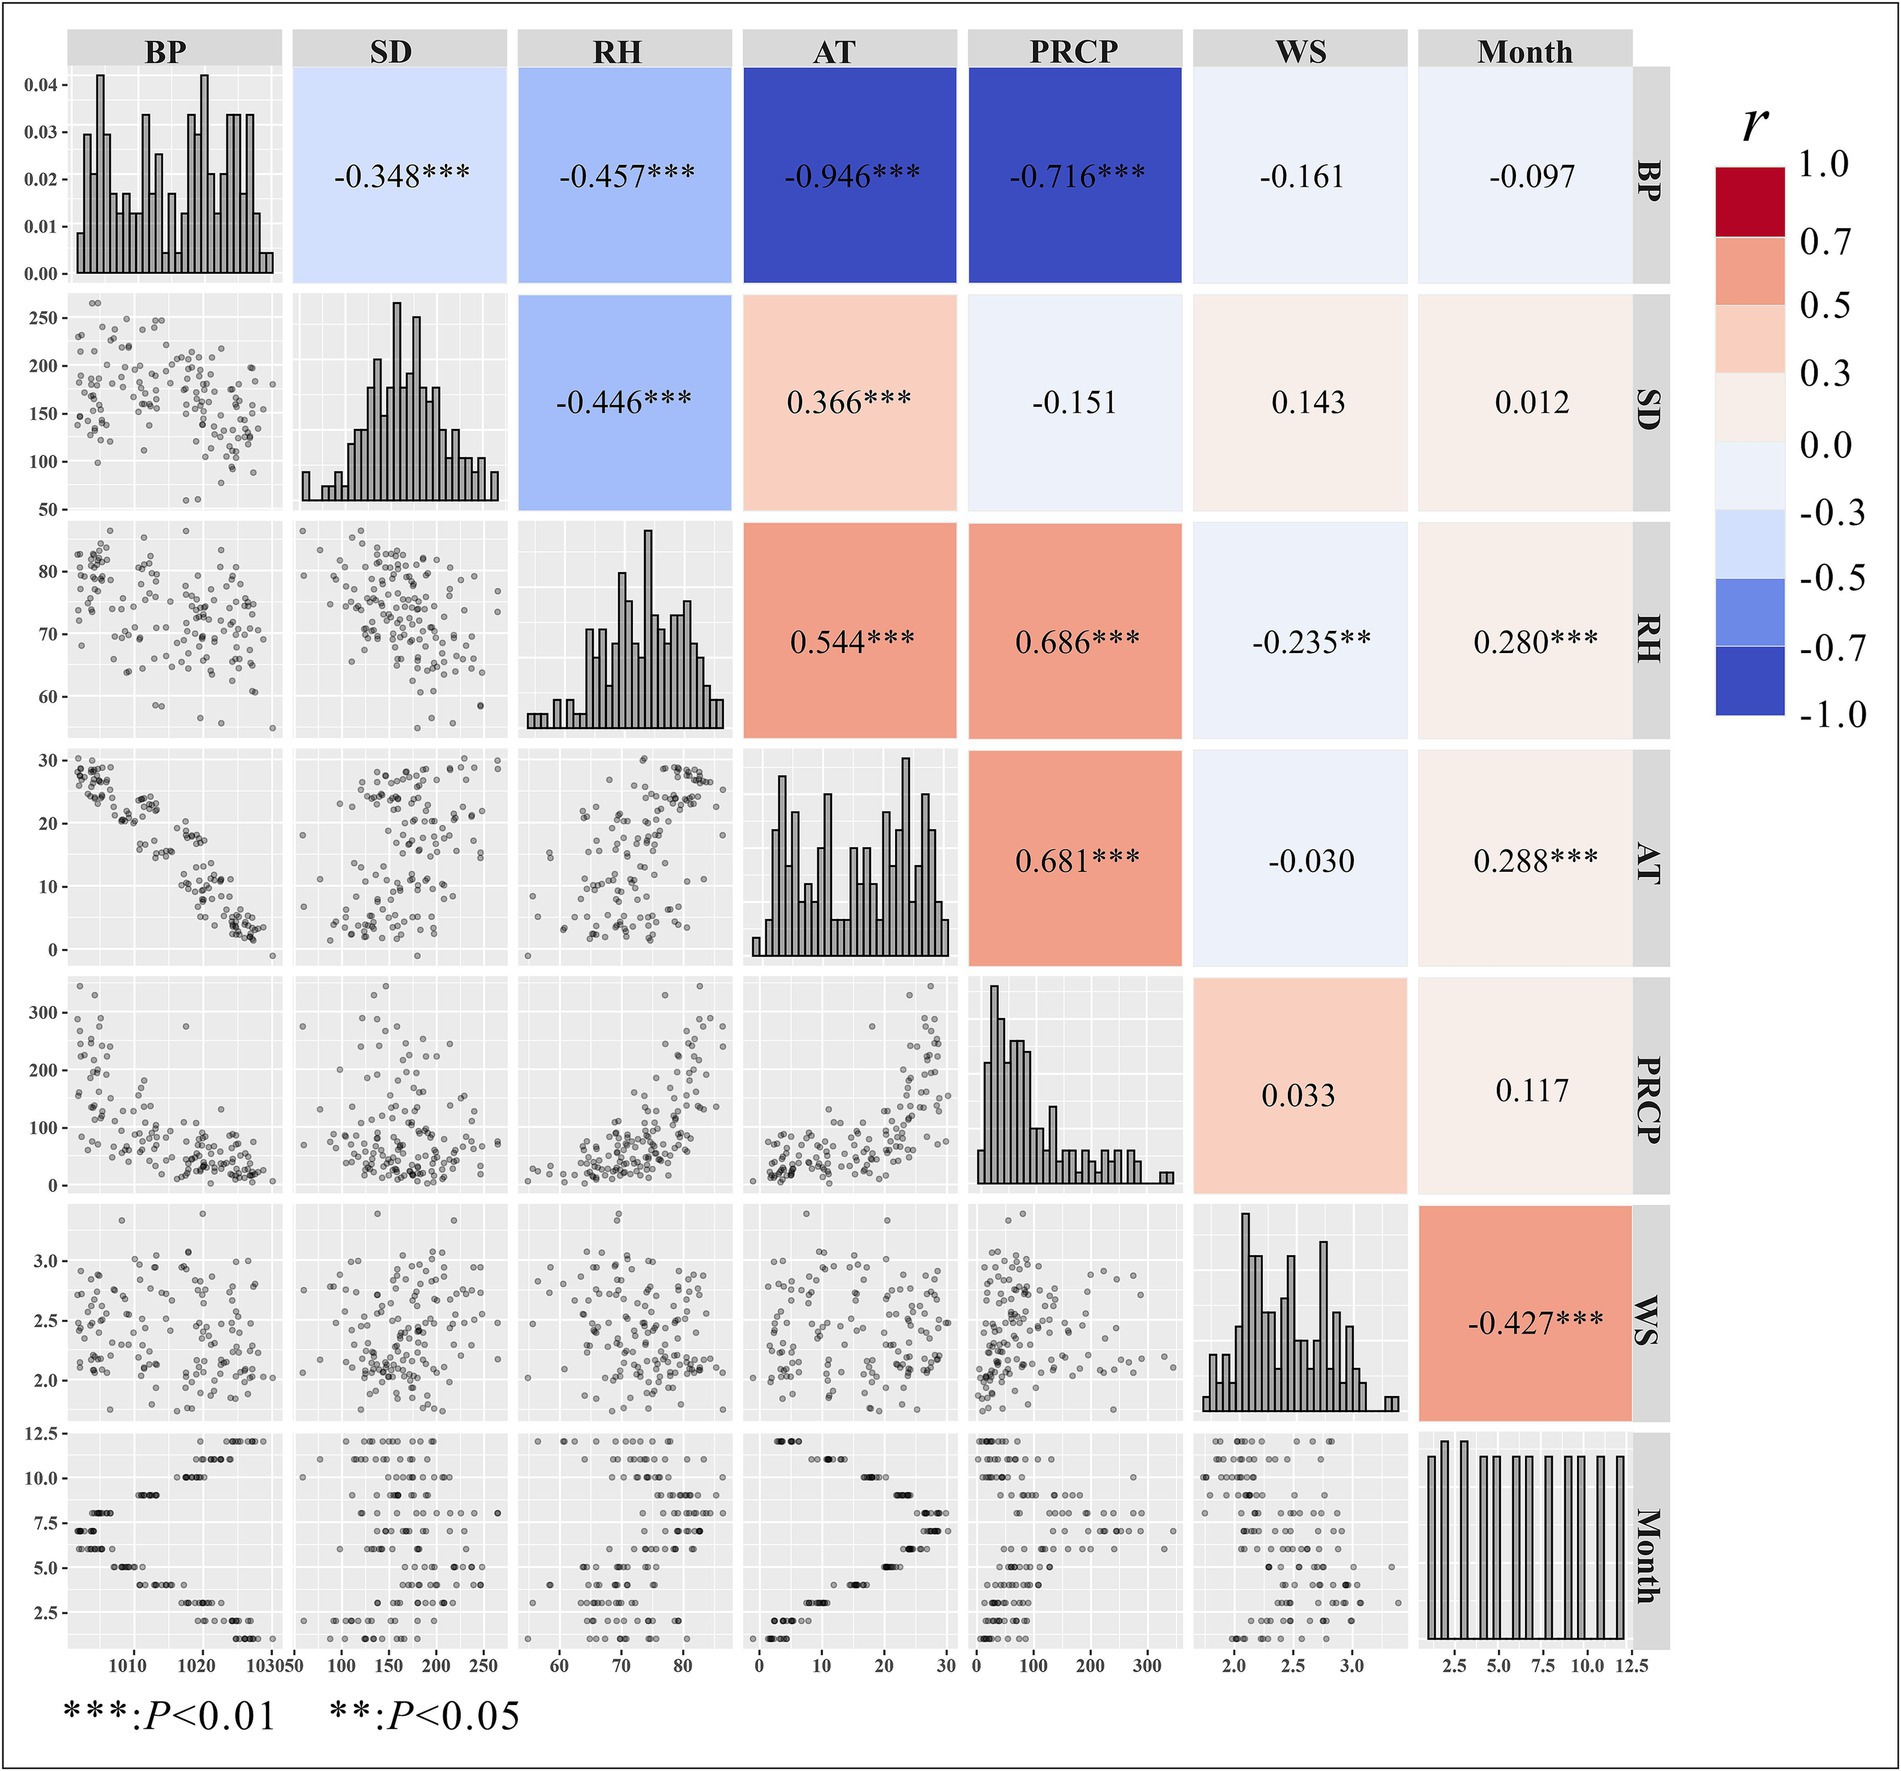
Figure 4. Spearman’s correlation analysis of meteorological factors. BP, barometric pressure; PRCP, precipitation; RH, relative humidity; SD, sunshine duration; AT, average temperature; WS, average wind speed.
3.4 Construction of the GAM model
The GAM was constructed using average temperature, relative humidity, sunshine duration, precipitation, month, and other variables as predictors. Based on the generalized cross-validation (GCV) score and R2, the optimal GAM for each dependent variable with the lowest GCV score is presented in Table 2. The results in Table 2 indicate that the most suitable dependent variable for meteorological factors was the susceptible person-to-infected person contact rate coefficient, which had the lowest GCV score (GCV = 1.705 × 10⁻²¹, R2 = 0.980, RMSE = 3.682 × 10⁻¹¹, MAE = 2.987 × 10⁻¹¹).
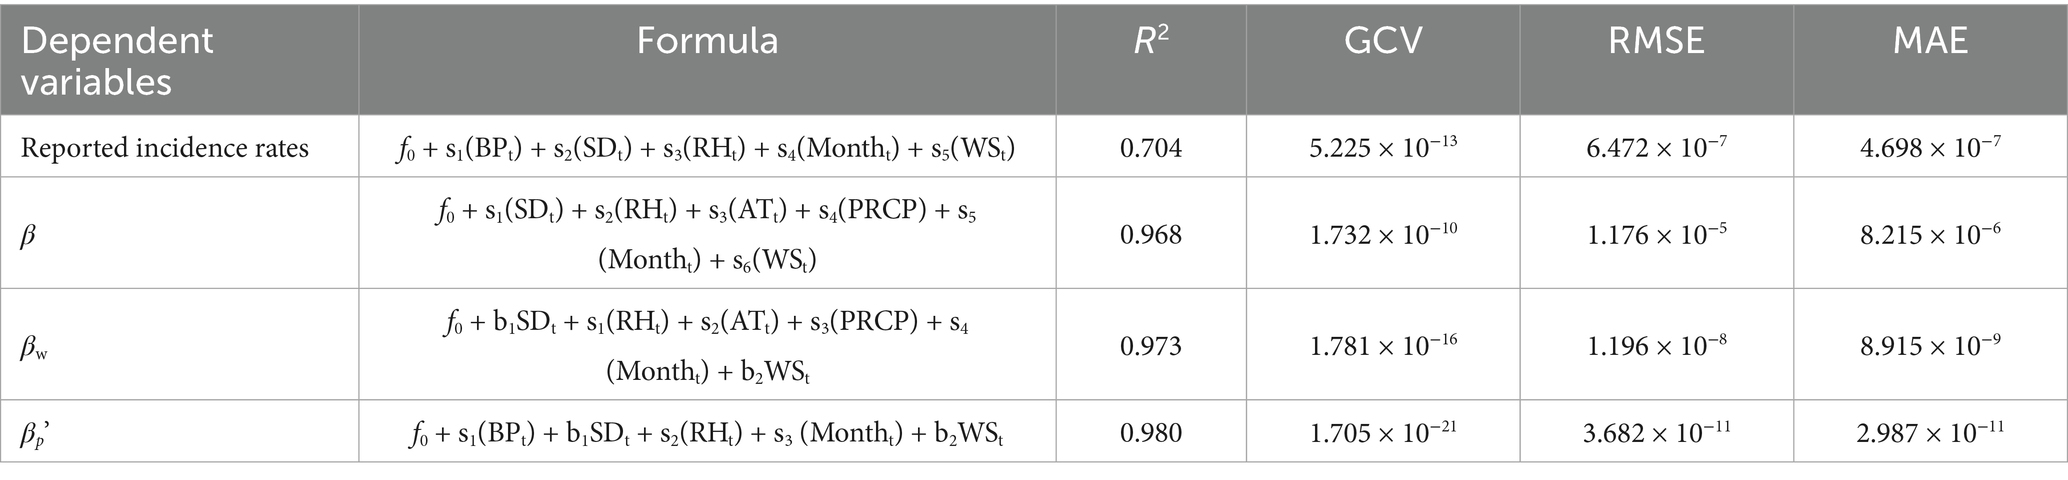
Table 2. Optimal generalized additive models and performance metrics.
3.5 Relationship between incidence, transmission rate coefficients, and meteorological factors
In the GAM for reported incidence rates, all included factors exhibited nonlinear relationships (Figure 5).
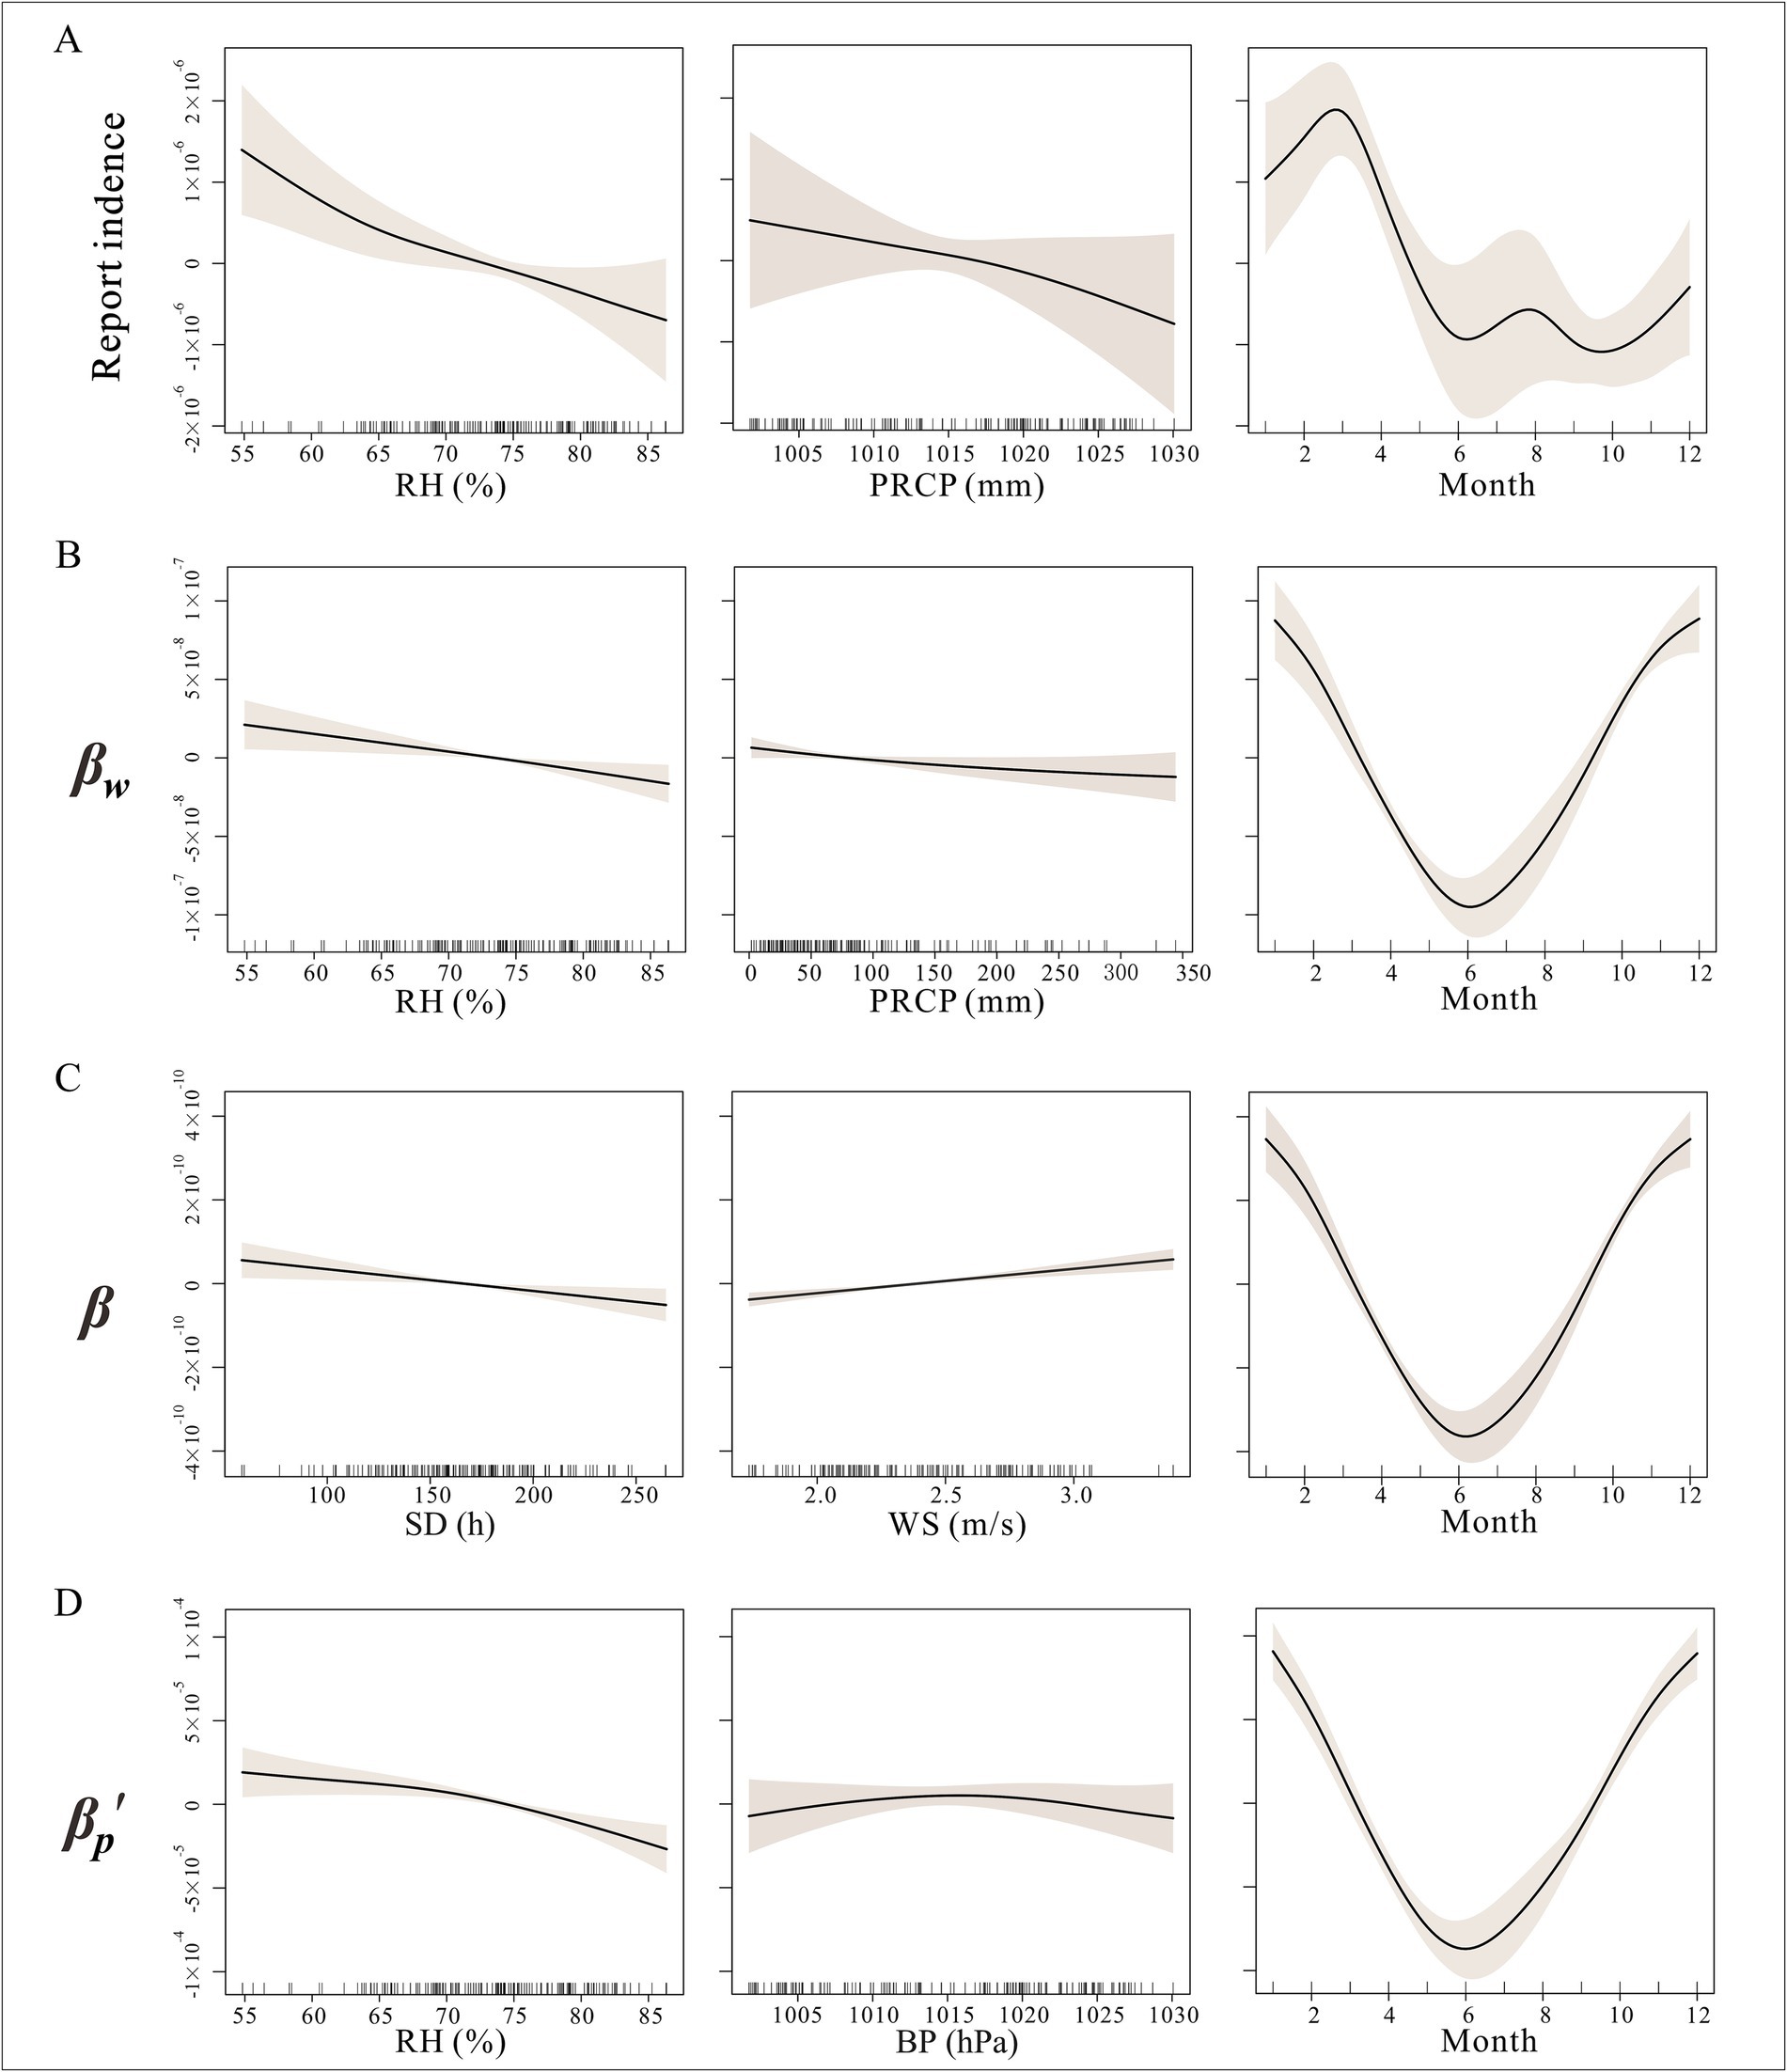
Figure 5. Non-linear relationship between incidence and different transmission with meteorological factors in Jiangsu Province BP, barometric pressure; PRCP, precipitation; RH, relative humidity; SD, sunshine duration; AT, average temperature; WS, average wind speed. (A) Relationship between incidence and meteorological factors; (B) Relationship between reservoir-to-person transmission and meteorological factors; (C) Relationship between susceptible person-to-infected person transmission and meteorological factors; (D) Relationship between host-to-person transmission and meteorological factors.
3.5.1 Relationship between incidence and meteorological factors
As shown in Figure 5A, the relationships between incidence and average atmospheric pressure, sunshine duration, and relative humidity were nonlinear. Specifically, these three meteorological factors showed a trend where incidence decreased as their values increased. In terms of monthly patterns, hepatitis E incidence exhibited dual peaks in March and August.
3.5.2 Relationship between susceptible person-to-infected person transmission and meteorological factors
As illustrated in Figure 5C, for the susceptible person-to-infected person contact rate coefficient, the GAM simulated the effects of sunshine duration, relative humidity, temperature, and precipitation as nonlinear. The effects of temperature and precipitation were not significant (p > 0.05). Relative humidity and sunshine duration showed a trend where the transmission rate decreased as their values increased, while the transmission rate coefficient increased with higher wind speeds.
3.5.3 Relationship between reservoir-to-person transmission and meteorological factors
For the reservoir-to-person contact rate coefficient, all factors except sunshine duration exhibited nonlinear effects, with average temperature and precipitation showing no significant impact (p > 0.05). The transmission rate coefficient decreased with increasing relative humidity, temperature, and precipitation. The monthly pattern for reservoir-to-person transmission was consistent with susceptible person-to-infected person transmission, with only a single trough in June (Figure 5B).
3.5.4 Relationship between host-to-person transmission and meteorological factors
In the GAM for the host-to-person contact rate coefficient, sunshine duration and wind speed had linear effects, while atmospheric pressure and relative humidity exhibited nonlinear effects. Relative humidity showed a trend where host-to-human transmission initially decreased and then increased with higher humidity. Atmospheric pressure demonstrated a trend where host-to-person transmission initially increased and then decreased with rising pressure, with the strongest transmission occurring between 1,013 and 1,017 hPa. The monthly pattern for reservoir-to-person transmission was consistent with susceptible person-to-infected person transmission, with only a single trough in June (Figure 5C).
3.6 Validation and prediction of the GAM model
We applied the GAM to predict changes in incidence rates and transmission rate coefficients across different pathways from April 2017 to December 2022 used for model validation. As shown in the figure, the fitted trends for incidence rates and transmission rate coefficients across different pathways were generally consistent, and the validation results for all four models were statistically significant (p < 0.001). GAM predictions for incidence and all three transmission rate coefficients exhibited clear seasonal patterns, with incidence showing a bimodal trend within a year (Figure 6).
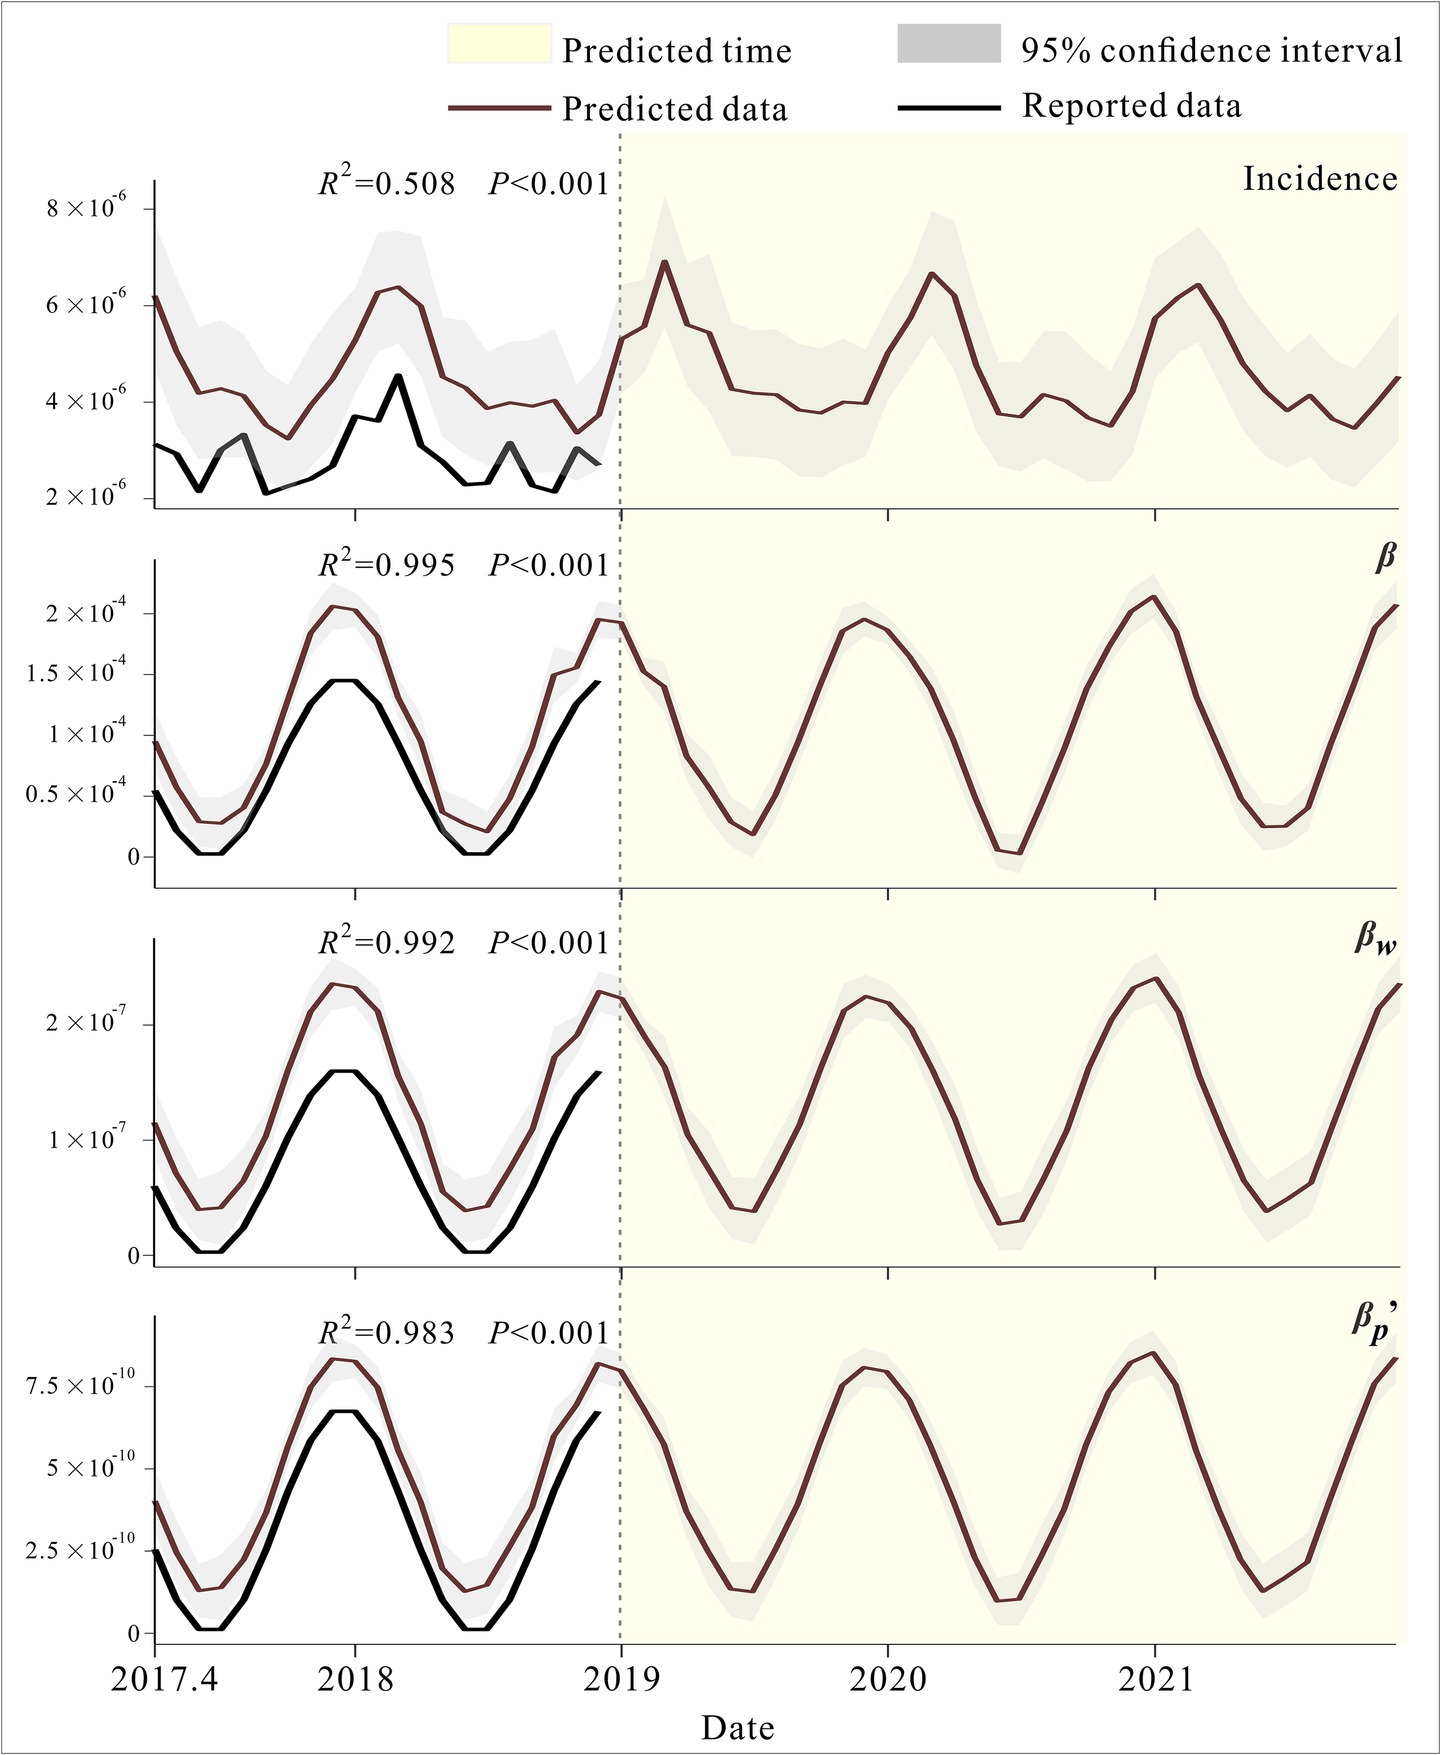
Figure 6. Validation and prediction of the GAM model.
4 Discussion
Hepatitis E is often regarded as an infectious disease primarily confined to regions with poor sanitation and contaminated drinking water supplies. However, as it is also a zoonotic disease with certain transmission routes still not fully understood, an increasing number of cases have been reported in non-endemic areas, including Jiangsu Province, China. Therefore, investigating the factors influencing hepatitis E transmission is particularly important.
Numerous studies have demonstrated that infectious diseases are sensitive to climate (27–29). In recent years, the impact of meteorological factors such as humidity, temperature, and precipitation on the epidemiology of hepatitis E has garnered significant attention (20, 30, 31). This study combined the Generalized Additive Model (GAM) with a transmission dynamics model to explore the relationships between meteorological factors and the incidence of hepatitis E, as well as the transmission rate coefficients (β, βw, and βp′) across three pathways. The results indicate that the influence of meteorological factors on three pathways followed similar trends. In the optimal model’s predictions for incidence, a clear bimodal trend was observed, suggesting that the seasonal dual-peak fluctuations in Jiangsu Province are primarily associated with average atmospheric pressure, sunshine duration, wind speed, and relative humidity (32). However, the validation results of the GAM model showed that the model’s performance in predicting incidence was relatively weaker compared to its fit for transmission rate coefficients. This discrepancy may be attributed to changes in data units or may indicate that meteorological factors influence incidence through mechanisms beyond discussed transmission.
Furthermore, precipitation showed a non-significant impact on hepatitis E incidence (p > 0.05), and its effect on the reservoir-to-person transmission rate coefficient remained marginal, contrasting with previous reports (24). Four potential reasons may explain this discrepancy: First, HEV genotypes 3/4 (dominant in China) exhibit weaker environmental linkages compared to waterborne genotypes 1/2 prevalent in developing countries (7, 33, 34). Second, as a socioeconomically advanced region, Jiangsu Province has minimized large-scale water contamination risks (35). Third, the MHMRTDM model may inadequately capture minor August incidence peaks coinciding with monsoon rainfall. Finally, unaddressed lag effects of precipitation could attenuate its observed influence.
In contrast, relative humidity significantly affected all dependent variables. Higher humidity consistently reduced transmission rate coefficients across pathways, likely by limiting human exposure opportunities. The steeper decline in host-to-person transmission above 75% humidity, which may be due to the fact that increased humidity and precipitation limit human production activities (36), reducing contact between humans and hosts.
The lack of a significant association between temperature and host-to-person transmission may result from opposing mechanisms operating at different ends of the temperature spectrum: higher temperatures may reduce HEV environmental viability and persistence (37), while lower temperatures may suppress human outdoor activity and inter-host contact (38). These counteracting effects could balance each other out across the observed temperature range, leading to a net null effect in the model. Peak transmission at 1013 hPa (near optimal human comfort pressure) suggests active host interactions under favorable conditions. Previous studies have shown that the host-to-person transmission rate coefficient contributes the most to the spread of hepatitis E. The results of this study indicate that βp′ is more sensitive to meteorological factors compared to the other two transmission pathways, highlighting the importance of focusing on meteorological factors for controlling host-to-human transmission, which is crucial for hepatitis E prevention and control.
This study has several limitations. As noted, the lack of consideration of lag effects stems from using monthly data for both the variables and the MHMRTDM model. Additionally, the omission of external factors may limit the model’s ability to replicate observed trends. Future research will address these issues by using higher-frequency data (e.g., daily or weekly) and incorporating external factors to improve predictive accuracy. The relationships identified by the GAM between climate variables and transmission dynamics are correlative and do not imply causality. Future studies should incorporate causal inference methods, such as instrumental variable approaches or mechanistic models, to further explore these associations.
Data availability statement
The data analyzed in this study is subject to the following licenses/restrictions: the incidence data of hepatitis E were provided by the Jiangsu Provincial Center for Disease Control and Prevention (CDC). Meteorological data were collected from the Jiangsu Provincial Meteorological Bureau. Although both data sources have undergone sensitive information scrubbing, they still remain unsuitable for public disclosure. The effort towards disease control is part of the CDC’s routine responsibility in Jiangsu Province, China. Therefore, institutional review and informed consent were not required for this study. All data analysed were anonymised. Requests to access these datasets should be directed to MjU3ODEyMzk1MUBxcS5jb20=.
Author contributions
PL: Conceptualization, Data curation, Formal analysis, Methodology, Visualization, Writing – original draft, Writing – review & editing. JR: Conceptualization, Data curation, Methodology, Project administration, Supervision, Writing – original draft, Writing – review & editing. KL: Formal analysis, Methodology, Software, Visualization, Writing – original draft. DB: Conceptualization, Formal analysis, Methodology, Visualization, Writing – review & editing. HW: Data curation, Formal analysis, Validation, Visualization, Writing – original draft. XT: Formal analysis, Supervision, Validation, Writing – review & editing. TC: Conceptualization, Data curation, Methodology, Project administration, Resources, Writing – original draft.
Funding
The author(s) declare that no financial support was received for the research and/or publication of this article.
Acknowledgments
We express our sincere appreciation to all authors for their assistance. The authors thank all study participants for providing the data and field investigators for collecting the data.
Conflict of interest
The authors declare that the research was conducted in the absence of any commercial or financial relationships that could be construed as a potential conflict of interest.
Generative AI statement
The authors declare that no Gen AI was used in the creation of this manuscript.
Publisher’s note
All claims expressed in this article are solely those of the authors and do not necessarily represent those of their affiliated organizations, or those of the publisher, the editors and the reviewers. Any product that may be evaluated in this article, or claim that may be made by its manufacturer, is not guaranteed or endorsed by the publisher.
Supplementary material
The Supplementary material for this article can be found online at: https://www.frontiersin.org/articles/10.3389/fpubh.2025.1604579/full#supplementary-material
SUPPLEMENTARY FIGURE S1 | Established the transmission dynamics of the MHMRTDM model of hepatitis E. Si, Susceptible individual density; Ei, Exposed individual density; Ii, Infectious individual density; Ai, Asymptomatic individual density; Ri, Recovered/removed individual density; W, Pathogen concentration in water reservoir; Ni, Total population density; Np, Total host herd density; Sp, Susceptible host density; Ep, Exposed host density; Ip, Infectious host density; Dp, Slaughtered host density. Reprinted with permission from (18), licensed under CC BY 4.0.
SUPPLEMENTARY TABLE S1 | Sensitivity analysis of β parameters to climate variables using Pearson correlation, linear regression, and GAM.
SUPPLEMENTARY FIGURE S2 | Visualization of sensitivity analysis with GAM-fitted smooth curves.
References
1. Chen, YJ, Cao, NX, Xie, RH, Ding, CX, Chen, EF, Zhu, HP, et al. Epidemiological investigation of a tap water-mediated hepatitis E virus genotype 4 outbreak in Zhejiang Province, China. Epidemiol Infect. (2016) 144:3387–99. doi: 10.1017/S0950268816001898
2. Lake, IR. Food-borne disease and climate change in the United Kingdom. Environ Health. (2017) 16:117. doi: 10.1186/s12940-017-0327-0
3. Wenjing, YE, Zhang, C, and Chen, C. Analysis of the association between intestinal infectious diseases and climate factors of Fujian Province in 2006—2015. J Med Theory Pract. (2018) 31:3333–3337. doi: 10.19381/j.issn.1001-7585.2018.22.007
4. Chan, MCW, Kwok, K, Hung, TN, and Chan, PKS. Molecular epidemiology and strain comparison between hepatitis E viruses in human sera and pig livers during 2014 to 2016 in Hong Kong. J Clin Microbiol. (2017) 55:1408–15. doi: 10.1128/JCM.02020-16
5. Miyamura, T. Hepatitis E virus infection in developed countries. Virus Res. (2011) 161:40–6. doi: 10.1016/j.virusres.2011.03.006
6. Song, YJ, Jeong, HJ, Kim, YJ, Lee, SW, Lee, JB, Park, SY, et al. Analysis of complete genome sequences of swine hepatitis E virus and possible risk factors for transmission of HEV to humans in Korea. J Med Virol. (2010) 82:583–91. doi: 10.1002/jmv.21730
7. Yugo, DM, and Meng, XJ. Hepatitis E virus: foodborne, waterborne and zoonotic transmission. Int J Environ Res Public Health. (2013) 10:4507–33. doi: 10.3390/ijerph10104507
8. Drabick, JJ, Gambel, JM, Gouvea, VS, Caudill, JD, Sun, W, Hoke, CH Jr, et al. A cluster of acute hepatitis E infection in United Nations Bangladeshi peacekeepers in Haiti. Am J Trop Med Hyg. (1997) 57:449–54. doi: 10.4269/ajtmh.1997.57.449
9. Labrique, AB, Thomas, DL, Stoszek, SK, and Nelson, KE. Hepatitis E: an emerging infectious disease. Epidemiol Rev. (1999) 21:162–79. doi: 10.1093/oxfordjournals.epirev.a017994
10. Isaacson, M, Frean, J, He, J, Seriwatana, J, and Innis, BL. An outbreak of hepatitis E in northern Namibia, 1983. Am J Trop Med Hyg. (2000) 62:619–25. doi: 10.4269/ajtmh.2000.62.619
11. Skidmore, SJ. Factors in spread of hepatitis E. Lancet. (1999) 354:1049–50. doi: 10.1016/S0140-6736(99)00241-X
12. WHO. (2014). Waterbone outbreaks of hepatitis E: recognition, investigation and control: technical report. Available online at: https://www.who.int/publications/i/item/waterborne-outbreaks-of-hepatitis-e-recognition-investigation-and-control
13. Piper-Jenks, N, Horowitz, HW, and Schwartz, E. Risk of hepatitis E infection to travelers. J Travel Med. (2000) 7:194–9. doi: 10.2310/7060.2000.00059
14. Ayouni, K, Naffeti, B, Ben Aribi, W, Bettaieb, J, Hammami, W, Ben Salah, A, et al. Hepatitis a virus infection in central-West Tunisia: an age structured model of transmission and vaccination impact. BMC Infect Dis. (2020) 20:627. doi: 10.1186/s12879-020-05318-7
15. Bao, KB, Zhang, QM, and Li, XN. A model of Hbv infection with intervention strategies: dynamics analysis and numerical simulations. Math Biosci Eng. (2019) 16:2562–86. doi: 10.3934/mbe.2019129
16. Jayasundara, D, Hui, BB, Regan, DG, Heywood, AE, Macintyre, CR, and Wood, JG. Modelling the decline and future of hepatitis a transmission in Australia. J Viral Hepat. (2019) 26:199–207. doi: 10.1111/jvh.13018
17. Chen, T, He, Q, and Tan, A. Development of a multiple transmission pathways dynamic model of hepatitis E and its application dynamics in Changsha. Chin J Health Stat. (2014) 31:257–62.
18. Yang, M, Cheng, XQ, Zhao, ZY, Li, PH, Rui, J, Lin, SN, et al. Feasibility of controlling hepatitis E in Jiangsu Province, China: a modelling study. Infect Dis Poverty. (2021) 10:91. doi: 10.1186/s40249-021-00873-w
19. Chen, XX, Shi, Y, Lu, YH, Chen, YH, Chen, KY, and Ren, H. Spatial-temporal distribution characteristics of hepatitis E in Shanghai, 2006-2016. Zhonghua Liu Xing Bing Xue Za Zhi. (2018) 39:971–6. doi: 10.3760/cma.j.issn.0254-6450.2018.07.020
20. Guo, Y, Feng, Y, Qu, F, Zhang, L, Yan, B, and Lv, J. Prediction of hepatitis E using machine learning models. PLoS One. (2020) 15:e0237750. doi: 10.1371/journal.pone.0237750
21. Liu, Y, Liang, W, Li, J, Liu, F, Zhou, G, Zha, W, et al. Characteristic of spatial-temporal distribution of hepatitis E in Hunan province, 2006-2014. Zhonghua Liu Xing Bing Xue Za Zhi. (2016) 37:543–7. doi: 10.3760/cma.j.issn.0254-6450.2016.04.021
22. Liu, ZQ, Zuo, JL, Yan, Q, Fang, QW, and Zhang, TJ. Epidemiologic and spatio-temporal characteristics of hepatitis E in China, 2004-2014. Zhonghua Liu Xing Bing Xue Za Zhi. (2017) 38:1380–5. doi: 10.3760/cma.j.issn.0254-6450.2017.10.017
23. Peng, T, Chen, X, Wan, M, Jin, L, Wang, X, Du, X, et al. The prediction of hepatitis E through ensemble learning. Int J Environ Res Public Health. (2020) 18:159. doi: 10.3390/ijerph18010159
24. Tricou, V, Bouscaillou, J, Laghoe-Nguembe, GL, Bere, A, Konamna, X, Selekon, B, et al. Hepatitis E virus outbreak associated with rainfall in the Central African Republic in 2008-2009. BMC Infect Dis. (2020) 20:260. doi: 10.1186/s12879-020-04961-4
25. Imai, C, and Hashizume, M. A systematic review of methodology: time series regression analysis for environmental factors and infectious diseases. Trop Med Health. (2015) 43:1–9. doi: 10.2149/tmh.2014-21
26. Shackleton, D, Economou, T, Memon, FA, Chen, A, Dutta, S, Kanungo, S, et al. Seasonality of cholera in Kolkata and the influence of climate. BMC Infect Dis. (2023) 23:572. doi: 10.1186/s12879-023-08532-1
27. Semenza, JC, and Menne, B. Climate change and infectious diseases in Europe. Lancet Infect Dis. (2009) 9:365–75. doi: 10.1016/S1473-3099(09)70104-5
28. Semenza, JC, Suk, JE, Estevez, V, Ebi, KL, and Lindgren, E. Mapping climate change vulnerabilities to infectious diseases in Europe. Environ Health Perspect. (2012) 120:385–92. doi: 10.1289/ehp.1103805
29. Xiang, J, Hansen, A, Liu, Q, Liu, X, Tong, MX, Sun, Y, et al. Association between dengue fever incidence and meteorological factors in Guangzhou, China, 2005-2014. Environ Res. (2017) 153:17–26. doi: 10.1016/j.envres.2016.11.009
30. Johne, R, Wolff, A, Gadicherla, AK, Filter, M, and Schluter, O. Stability of hepatitis E virus at high hydrostatic pressure processing. Int J Food Microbiol. (2021) 339:109013. doi: 10.1016/j.ijfoodmicro.2020.109013
31. Ren, H, Li, J, Yuan, ZA, Hu, JY, Yu, Y, and Lu, YH. The development of a combined mathematical model to forecast the incidence of hepatitis E in Shanghai, China. BMC Infect Dis. (2013) 13:421. doi: 10.1186/1471-2334-13-421
32. Carratala, A, and Joost, S. Population density and water balance influence the global occurrence of hepatitis E epidemics. Sci Rep. (2019) 9:10042. doi: 10.1038/s41598-019-46475-3
33. Khuroo, MS, Khuroo, MS, and Khuroo, NS. Transmission of hepatitis E virus in developing countries. Viruses. (2016) 8:253. doi: 10.3390/v8090253
34. Kmush, BL, Nelson, KE, and Labrique, AB. Risk factors for hepatitis E virus infection and disease. Expert Rev Anti-Infect Ther. (2015) 13:41–53. doi: 10.1586/14787210.2015.981158
35. WHO. (2010). The global prevalence of hepatitis E virus infection and susceptibility. Available online at: https://www.who.int/publications/i/item/Who-Ivb-10.14
36. Wang, J, Tang, K, Feng, K, Lin, X, Lv, W, Chen, K, et al. Impact of temperature and relative humidity on the transmission of COVID-19: a modelling study in China and the United States. BMJ Open. (2021) 11:e043863. doi: 10.1136/bmjopen-2020-043863
37. Emerson, SU, Arankalle, VA, and Purcell, RH. Thermal stability of hepatitis E virus. J Infect Dis. (2005) 192:930–3. doi: 10.1086/432488
Keywords: hepatitis E, meteorological determinants, generalized additive model, multi-host and multi-route transmission dynamic model, climate-sensitive dynamics
Citation: Li P, Rui J, Li K, Bin D, Wei H, Tan X and Chen T (2025) Meteorological determinants of hepatitis E dynamics in Jiangsu Province, China: a pre-COVID-19 era study focusing on multi-route transmission (2005–2018). Front. Public Health. 13:1604579. doi: 10.3389/fpubh.2025.1604579
Edited by:
Khalid Hattaf, Centre Régional des Métiers de l’Education et de la Formation (CRMEF), MoroccoCopyright © 2025 Li, Rui, Li, Bin, Wei, Tan and Chen. This is an open-access article distributed under the terms of the Creative Commons Attribution License (CC BY). The use, distribution or reproduction in other forums is permitted, provided the original author(s) and the copyright owner(s) are credited and that the original publication in this journal is cited, in accordance with accepted academic practice. No use, distribution or reproduction is permitted which does not comply with these terms.
*Correspondence: Peihua Li, MjU3ODEyMzk1MUBxcS5jb20=; Xi Tan, dGFueGlAYnVjbS5lZHUuY24=; Tianmu Chen, MTM2OTg2NjVAcXEuY29t; Y2hlbnRpYW5tdUB4bXUuZWR1LmNu
†These authors have contributed equally to this work