 Gang Cheng†
 Jianghong Xu
- Department of Endocrinology, Dongfang Hospital, Beijing University of Chinese Medicine, Qinhuangdao Hospital (Qinhuangdao Hospital of Traditional Chinese Medicine), Qinhuangdao, Hebei, China
Objective: This study aimed to explore the relationship between early adulthood obesity and sarcopenic obesity (SO) among middle-aged and older adults in the United States.
Methods: This retrospective study was conducted involving adults aged 50–69 years in the United States. Data were extracted from the National Health and Nutrition Examination Survey (NHANES) during the periods 1999–2006 and 2011–2018. Height and weight at the age of 25 years were measured. Body mass index (BMI) at the age of 25 years (BMI25) was calculated. Healthy weight, overweight, and obesity at the age of 25 years (healthy weight25, overweight25, and obesity25) were defined as BMI25 18.5 to less than 25 kg/m2, 25 to less than 30 kg/m2, and 30 kg/m2 or greater, respectively. SO was determined by dividing appendicular skeletal muscle mass by weight (ASM/Wt) and percentage of fat mass [FM (%)].
Results: The prevalence of SO was 5.4, 8.5, and 16.5% in healthy weight25, overweight25, and obesity25 groups, respectively. After adjusting for confounding factors, the prevalence of SO in the overweight25 group and the obesity25 group was 1.161 times (95%CI: 0.898–1.500, p = 0.254) and 2.286 times (95%CI: 1.651–3.165, p < 0.001) higher, respectively, compared to the healthy weight25 group.
Conclusion: This study demonstrates that obesity in early adulthood is closely associated with an increased risk of sarcopenic obesity among middle-aged and older adults.
Introduction
Sarcopenic obesity (SO) is defined as the simultaneous presence of excessive fat mass and reduced muscle mass in an individual. While sarcopenia and obesity are independently associated with an increased risk of multimorbidity, their coexistence in the form of SO results in an even higher risk (1). Individuals with SO are more susceptible to frailty and exhibit a greater likelihood of falls and elevated rates of non-vertebral fractures in older adults (2, 3). Compared to non-SO individuals, those with SO also show a higher prevalence of cognitive impairment, coronary artery disease, and dyslipidemia (4). A meta-analysis of prospective cohort studies reported that SO was associated with a 24% increased risk of all-cause mortality (5). An updated meta-analysis further confirmed that SO is a significant predictor of all-cause mortality in middle-aged and older adults, regardless of whether they are community-dwelling or hospitalized (6). SO presents a substantially higher risk of multimorbidity than either sarcopenia or obesity alone. This increased risk is due to synergistic biological mechanisms that intensify inflammation, insulin resistance, and physical dysfunction (1, 7, 8).
Body mass index (BMI) is a widely used clinical indicator for assessing obesity. Multi-cohort studies have demonstrated that BMI-defined obesity is closely associated with 21 non-overlapping cardiometabolic, digestive, respiratory, neurological, musculoskeletal, and infectious diseases in adults (9). Early-life exposure to obesity also influences health outcomes in later life. Previous studies consistently indicate that individuals who are overweight or obese in early adulthood are at an increased risk of remaining overweight or obese in later life (10). Obesity, in conjunction with aging, may exacerbate the decline in muscle mass and function (11). Early-onset obesity has been linked to an increased risk of mobility limitations and cognitive decline in old age (12–15). Moreover, obesity during early adulthood is associated with a higher risk of mortality in later life (16).
However, the relationship between early adulthood obesity and the subsequent development of SO remains underexplored. Non-pharmacological interventions have been shown to effectively alleviate the clinical symptoms and signs associated with SO (17). Thus, early identification of individuals at risk for SO is essential to prevent disease progression and reduce the burden of comorbidities. Investigating the association between early adulthood obesity and SO in middle-aged and older populations may facilitate the early identification of high-risk individuals and provide a critical window for timely intervention.
The National Health and Nutrition Examination Survey (NHANES), conducted by the National Center for Health Statistics (NCHS), is a comprehensive program designed to assess the health and nutritional status of adults and children in the United States. The NHANES dataset includes information on body weight and height at age 25, along with body composition measurements in middle-aged and older adults. In the present study, we utilized the NHANES database to analyze the relationship between early adulthood obesity and SO in middle-aged and older adults in the United States, with the aim of identifying high-risk populations at an earlier stage.
Methods
Study design
This is a retrospective cohort study that analyzed data obtained from the NHANES. All NHANES data collection protocols were approved by the National Center for Health Statistics Research Ethics Review Board. Eight cycles (1999–2006 and 2011–2018) of data were included in the analysis for this study. Body composition was measured among subjects aged 8–69 years. Information about height and weight at age 25 years was collected among subjects aged over 50 years. Therefore, this study included middle-aged adults aged 50–69 years. The exclusion criteria were as follows: (1) missing data on body composition, such as appendicular skeletal muscle mass and percentage of fat mass; (2) missing data on height and weight at age 25 years; (3) body mass index (BMI) at age 25 years < 18.5 kg/m2; and (4) missing covariate data. The NHANES protocol received approval from the NCHS Research Ethics Review Board (Protocol #98-12, Protocol #2005-06, Protocol #2011-17, and Protocol #2018-01)1 and was performed in accordance with the Declaration of Helsinki. To ensure the protection of the participants’ rights, NHANES has obtained informed written consent from all the individuals involved in the study.
Definition of overweight and obesity at age 25 years
The levels of height (inches) and weight (pounds) at age 25 years were obtained. They were then converted to height (meters = inches * 0.0254) and weight (kilograms = pounds * 0.4536). BMI at age 25 years (BMI25) is calculated as weight at age 25 years (weight25 in kilograms) divided by the square of height at age 25 years (height25 in meters). Healthy weight, overweight, and obesity at age 25 years (healthy weight25, overweight25, and obesity25) were defined as BMI25 of 18.5 to less than 25 kg/m2, 25 to less than 30 kg/m2, and 30 kg/m2 or greater, respectively.2
Definition of sarcopenic obesity
Skeletal muscle mass was measured by dual-energy x-ray absorptiometry (DXA). Whole-body scans were acquired using Hologic QDR-4500A fan-beam and Hologic Discovery model A densitometers (Hologic, Inc., Bedford, MA, USA), using software versions 8.26:a3*, v12.4, and Apex 3.2, respectively. Appendicular skeletal muscle mass (ASM) was assessed as the sum of the muscle mass of the upper and lower limbs. ASM divided by weight (ASM/Wt) was used to calculate: ASM/Wt (%) = ASM (kg)/weight (kg)*100. Percentage of fat mass (FM (%)) was calculated as the ratio of DXA whole-body fat mass (g) to DXA whole-body total mass (g) *100.
SO was defined using the European Society for Clinical Nutrition and Metabolism (ESPEN) and the European Association for the Study of Obesity (EASO) criteria (18). Sarcopenia was defined as ASM/Wt < 25.7% for men and < 19.4% for women (19). The relationship between percent body fat and BMI differs among ethnic groups (20); therefore, ethnicity-specific cutoffs are applied for fat mass in this study. Obesity was defined as FM% > 27% (Non-Hispanic Black) and > 29% (Other Race) for men and > 39% (Non-Hispanic Black) and > 41% (Other Race) for women in adults aged < 60 years and FM% > 29% (Non-Hispanic Black) and > 31% (Other Race) for men and > 41% (Non-Hispanic Black) and > 43% (Other Race) for women in adults aged ≥ 60 years (21). SO was defined as having sarcopenia and obesity simultaneously.
Muscle function
An observed timed 20-foot walk was used to assess functional limitations in the 1999–2000 and 2001–2002 cycles. The 20-foot walk was timed using a handheld stopwatch. The examinee was asked to walk at their usual pace. The muscle strength test component measured grip strength using a handgrip dynamometer in the 2011–2012 and 2013–2014 cycles. The combined grip strength was calculated as the sum of the largest reading from each hand and expressed in kilograms. Muscle quality index (MQI, kg/kg) was defined as the ratio of combined grip strength (kg) to ASM (kg) (22).
Covariates
Sociodemographic covariates included age, gender, race, and family poverty income ratio (PIR). Smoking history was defined as follows: never (smoked fewer than 100 cigarettes in a lifetime), former smoker (smoked ≥ 100 cigarettes in a lifetime but does not currently smoke), or current smoker (smoked ≥ 100 cigarettes in a lifetime and currently smokes). Dietary energy and protein intake were assessed using the 24-h dietary recall method. Physical activity was defined as participating in moderate or vigorous activities. Height (meters) and weight (kilograms) measurements were collected, and BMI (kg/m2) was calculated at the time of the survey. Chronic disease status and medication use were also evaluated. Diabetes was defined based on the following criteria: fasting glucose levels of ≥126 mg/dL, a hemoglobin A1c level of ≥6.5%, a history of diabetes, or the current use of diabetes medications. Hypertension was defined as having systolic blood pressure (SBP) of ≥140 mmHg, diastolic blood pressure (DBP) of ≥90 mmHg, or currently taking medications for hypertension. Cardiovascular disease was determined based on the affirmative responses to the following question: “Has a doctor ever told you that you had congestive heart failure, coronary heart disease, angina/angina pectoris, a heart attack, or a stroke?” Cancer was determined based on an affirmative response to the question: “Has a doctor ever told you that you had cancer or malignancy?” The total number of prescription medications was also recorded.
Statistical analyses
Analyses were performed using Stata software (version 16.0) (STATA Corporation, TX, USA). Quantitative data were expressed as means with standard deviations. The three groups were compared using analysis of variance (ANOVA). Categorical data were compared using the chi-squared test. Logistic regression models were used for modeling relationships between obesity status at age 25 and SO among middle-aged and older adults. Model 1: This was a univariate logistic regression analysis. Model 2: This model was further adjusted for age, gender (Men = 1, Women = 2), ethnicity (Non-Hispanic White = 0, Non-Hispanic Black = 1, and Other Race = 2), Family poverty income ratio (PIR), smoking history (Never = 0, Former smoker = 1, and Current smoker = 2), energy intake, protein intake, physical activity (No = 0 and Yes = 1), diabetes (No = 0 and Yes = 1), hypertension (No = 0 and Yes = 1), cardiovascular disease (No = 0 and Yes = 1), cancer (No = 0 and Yes = 1), and number of prescription medicines as covariates. Model 3: This model is further adjusted for BMI at the time of survey (BMI < 25 kg/m2 = 0 and BMI ≥ 25 kg/m2 = 1) as covariates. Variance inflation factors (VIFs) were calculated, and VIFs above 10 indicated multicollinearity. Survey weights, strata, and primary sampling units were also applied to the analyses to account for the NHANES complex and multi-stage survey design. The analysis was also stratified by gender, age, race, and BMI at the time of the survey. p < 0.05 was considered statistically significant.
Results
Figure 1 shows the selection process of the study. Eventually, a total of 5,926 subjects (3,031 men and 2,895 women), aged 57.7 ± 5.5 years, were enrolled in this study. Of these subjects, 411 (6.9%) had sarcopenia, 3,171 (53.5%) had obesity, and 407 (6.9%) had SO.
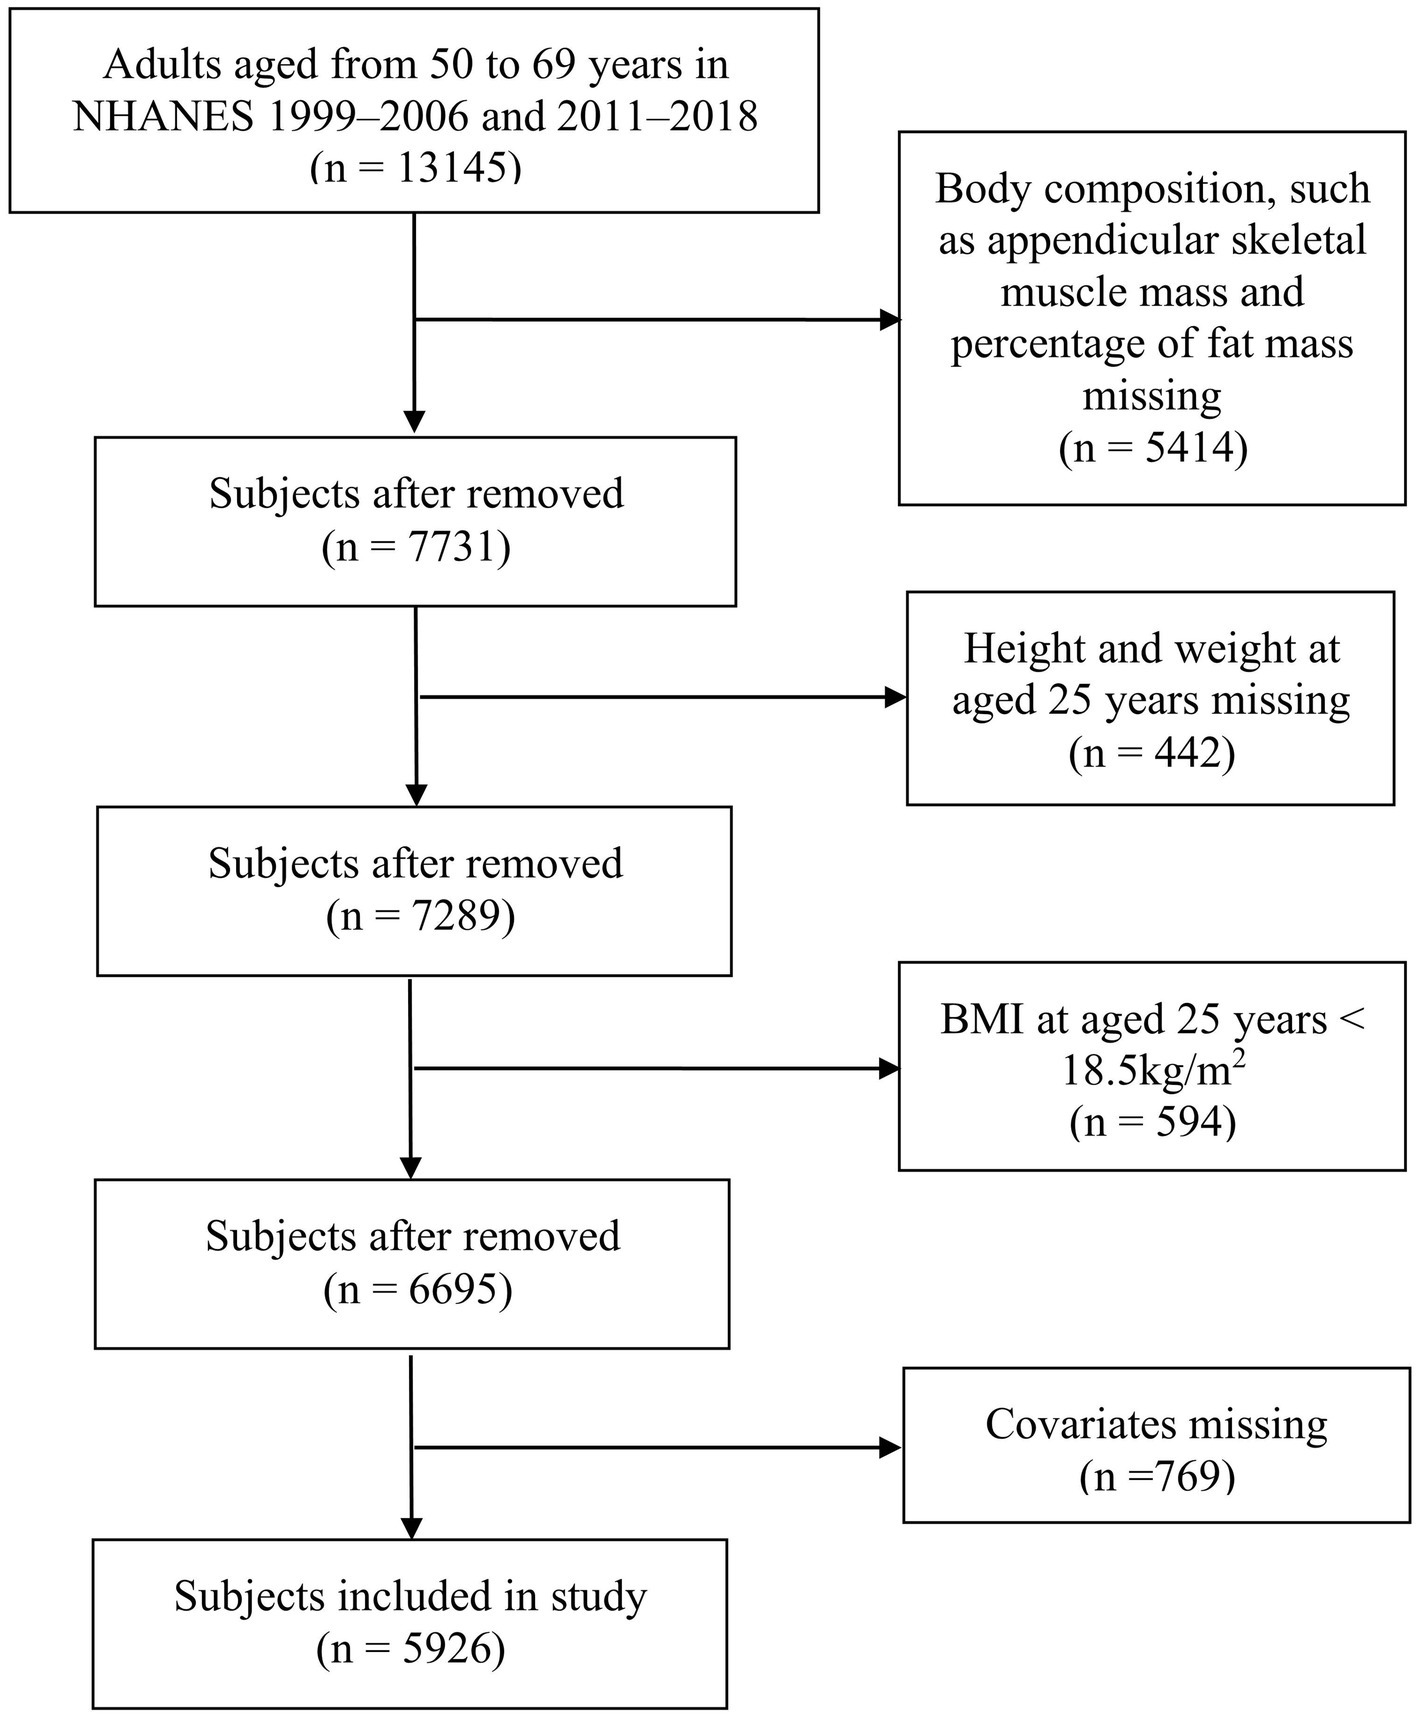
Figure 1. Flowchart of participant selection.
In men, the levels of BMI25, BMI, ASM, and FM (%) were higher in the overweight25 group and the obesity25 group compared to the healthy weight25 group (p < 0.05). The levels of BMI25, BMI, ASM, and FM (%) were higher in the obesity25 group compared to the overweight25 group (p < 0.05). The levels of ASM/Wt were lower in the overweight25 group and obesity25 group compared to the healthy weight25 group (p < 0.05). The levels of ASM/Wt were lower in the obesity25 group compared to the overweight25 group (p < 0.05) (Table 1). In women, the levels of BMI25, BMI, ASM, and FM (%) were higher in the overweight25 group and obesity25 group compared to the healthy weight25 group (p < 0.05). The levels of BMI25, BMI, and ASM were higher in the obesity25 group compared to the overweight25 group (p < 0.05). The levels of ASM/Wt were lower in the overweight25 group and obesity25 group compared to the healthy weight25 group (p < 0.05) (Table 2).
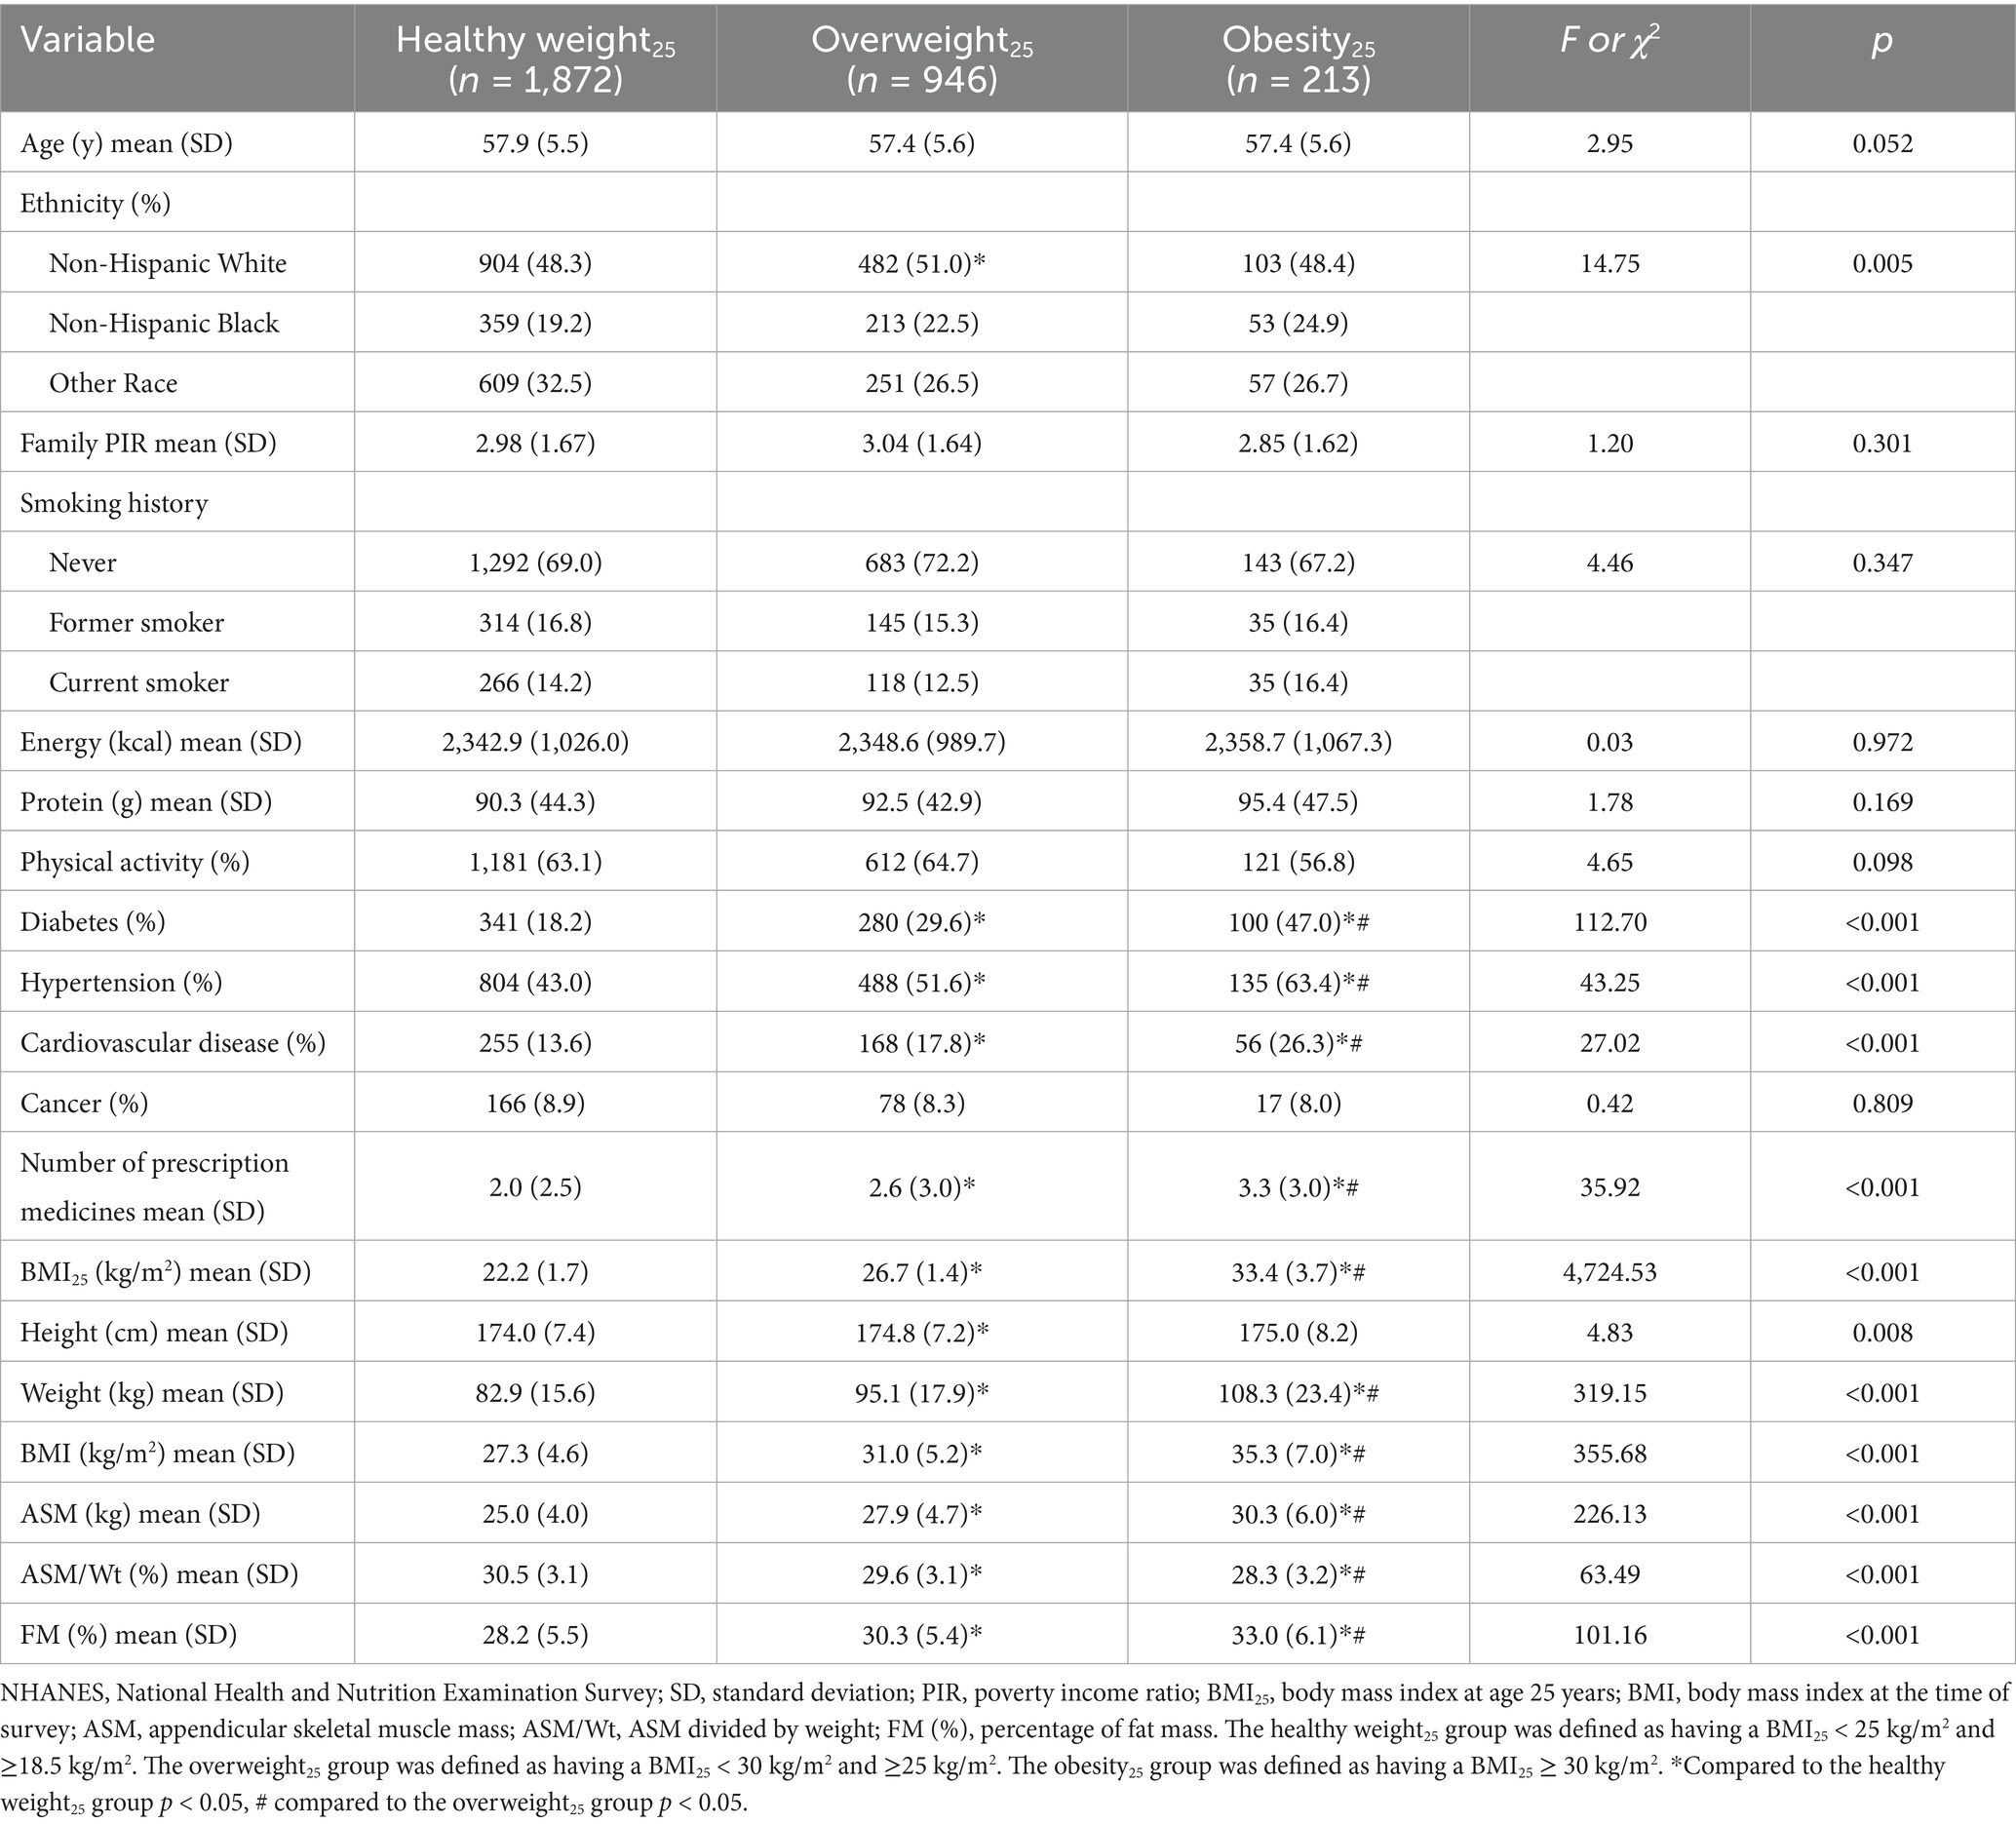
Table 1. Characteristics of men by the status of obesity at age 25 in the NHANES.
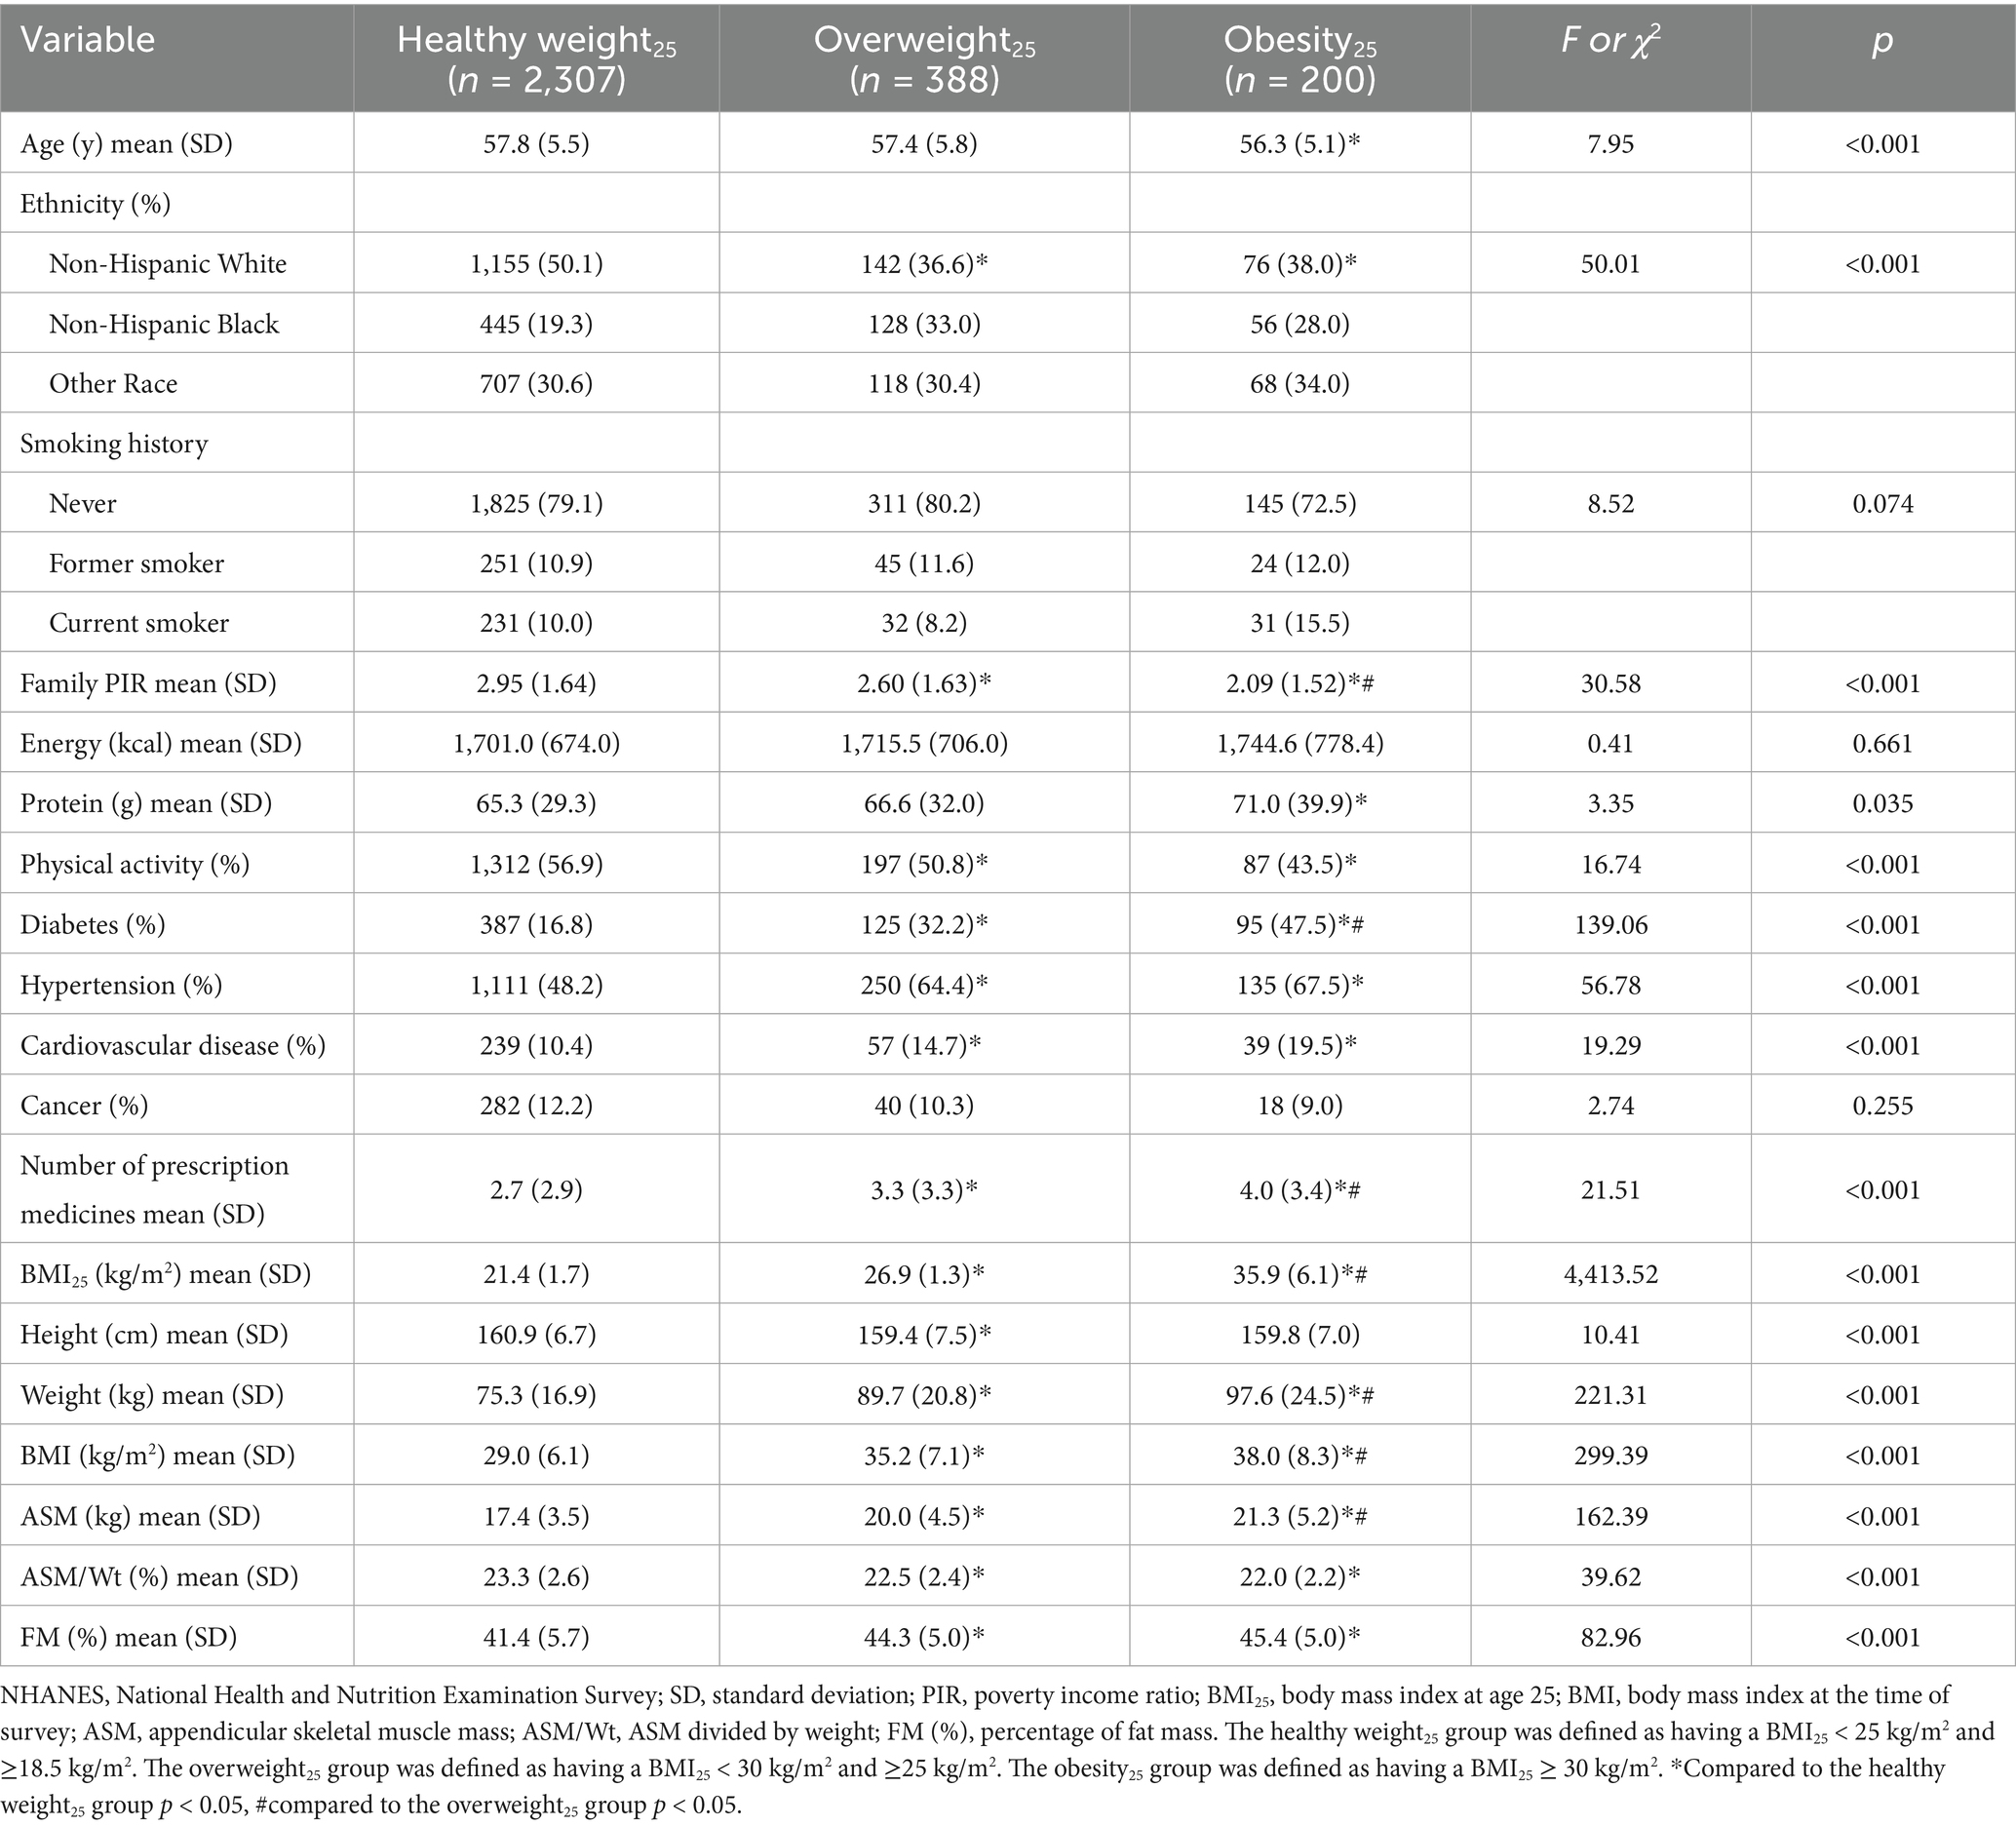
Table 2. Characteristics of women by the status of obesity at age 25 in the NHANES.
The prevalence of SO was 5.4, 8.5, and 16.5% in the healthy weight25, overweight25, and obesity25 groups, respectively. The univariate logistic regression analysis (Model 1) revealed that the prevalence of SO in the overweight25 group and obesity25 group was 1.619 (95%CI: 1.280–2.047, p < 0.001) times and 3.448 (95%CI: 2.573–4.619, p < 0.001) times higher than those in the healthy weight25 group. After adjusting for age, gender (Men = 1, Women = 2), ethnicity (Non-Hispanic White = 0, Non-Hispanic Black = 1, and Other Race = 2), Family PIR, smoking history (Never = 0, Former smoker = 1, and Current smoker = 2), energy intake, protein intake, physical activity (No = 0 and Yes = 1), diabetes (No = 0 and Yes = 1), hypertension (No = 0 and Yes = 1), cardiovascular disease (No = 0 and Yes = 1), cancer (No = 0 and Yes = 1), and number of prescription medicines (Model 2), the prevalence of SO in the overweight25 and obesity25 groups was 1.382 (95%CI: 1.071–1.783, p = 0.013) times and 2.746 (95%CI: 1.987–3.795, p < 0.001) times higher than those in adults with the healthy weight25 group. After further adjusting for BMI at the time of survey (Model 3), the prevalence of SO in the overweight25 group and obesity25 group was 1.161 (95%CI: 0.898–1.500, p = 0.254) times and 2.286 (95%CI: 1.651–3.165, p < 0.001) times higher than those in the healthy weight25 group (all VIFs < 10, Table 3). After weighted analysis, the results were similar (Supplementary Table 1).
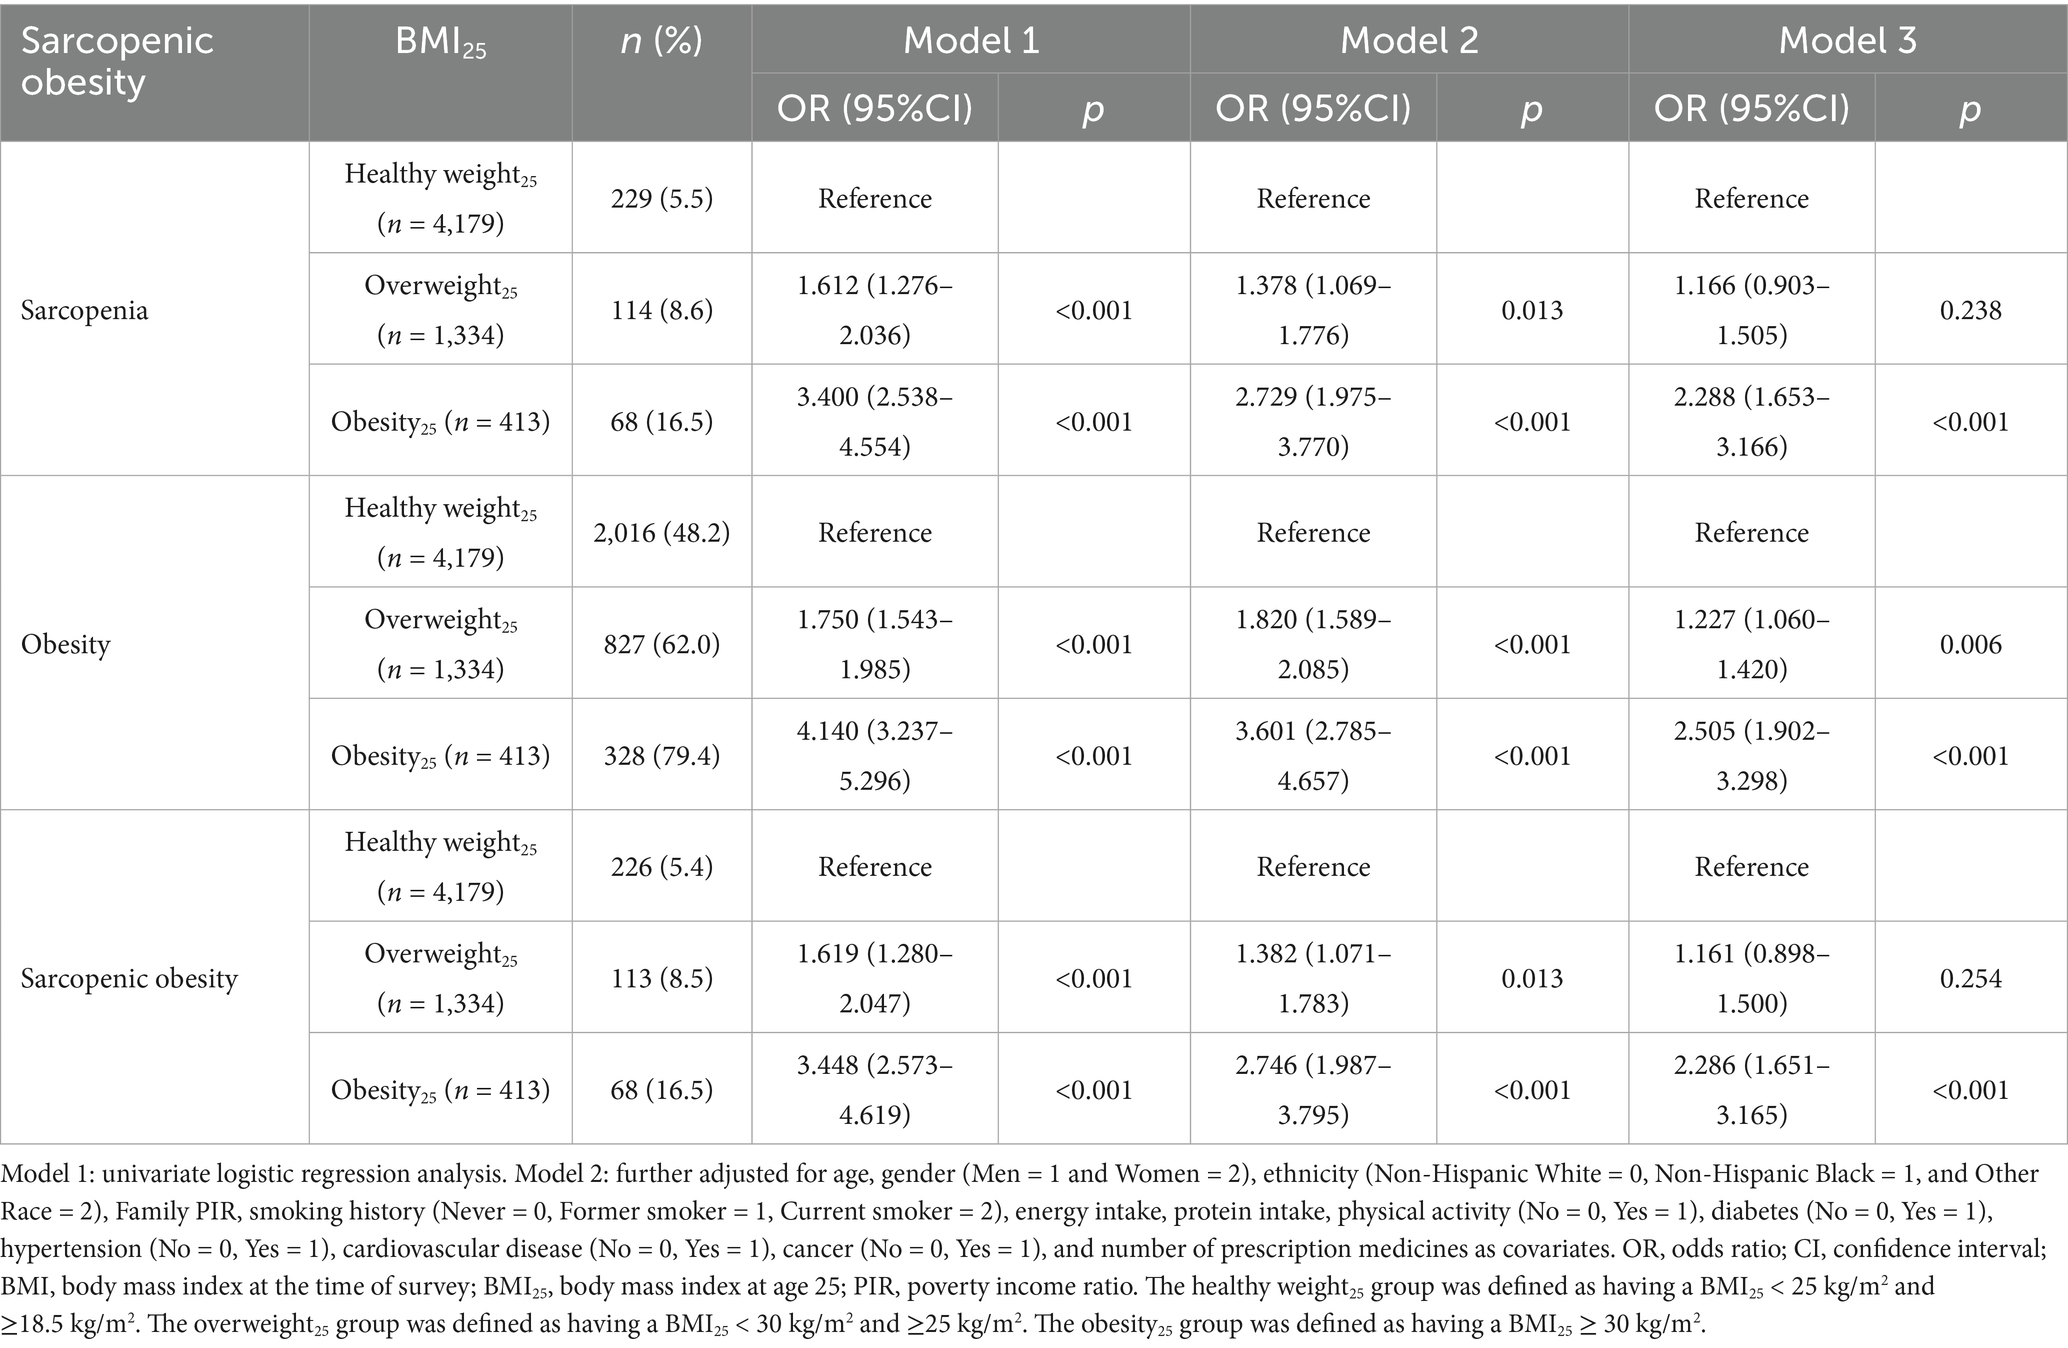
Table 3. The relationship between the status of obesity at age 25 and sarcopenic obesity among middle-aged and older adults in the United States.
The analysis was stratified by the level of BMI at the time of survey. In adults with BMI < 25 kg/m2, the prevalence of SO was 0.7, 1.9, and 0.0% in the healthy weight25, overweight25, and obesity25 groups, respectively. In adults with BMI ≥ 25 kg/m2, the prevalence of SO was 7.3, 9.1, and 17.4% in the healthy weight25, overweight25, and obesity25 groups, respectively. After adjusting for confounding factors, the prevalence of SO in the overweight25 and obesity25 groups was 1.149 times (95%CI: 0.886–1.489, p = 0.296) and 2.317 times (95%CI: 1.670–3.216, p < 0.001) higher than those in the healthy weight25 group with BMI ≥ 25 kg/m2 (All VIFs < 10, Table 4). After weighted analysis, the results were similar (Supplementary Table 2).
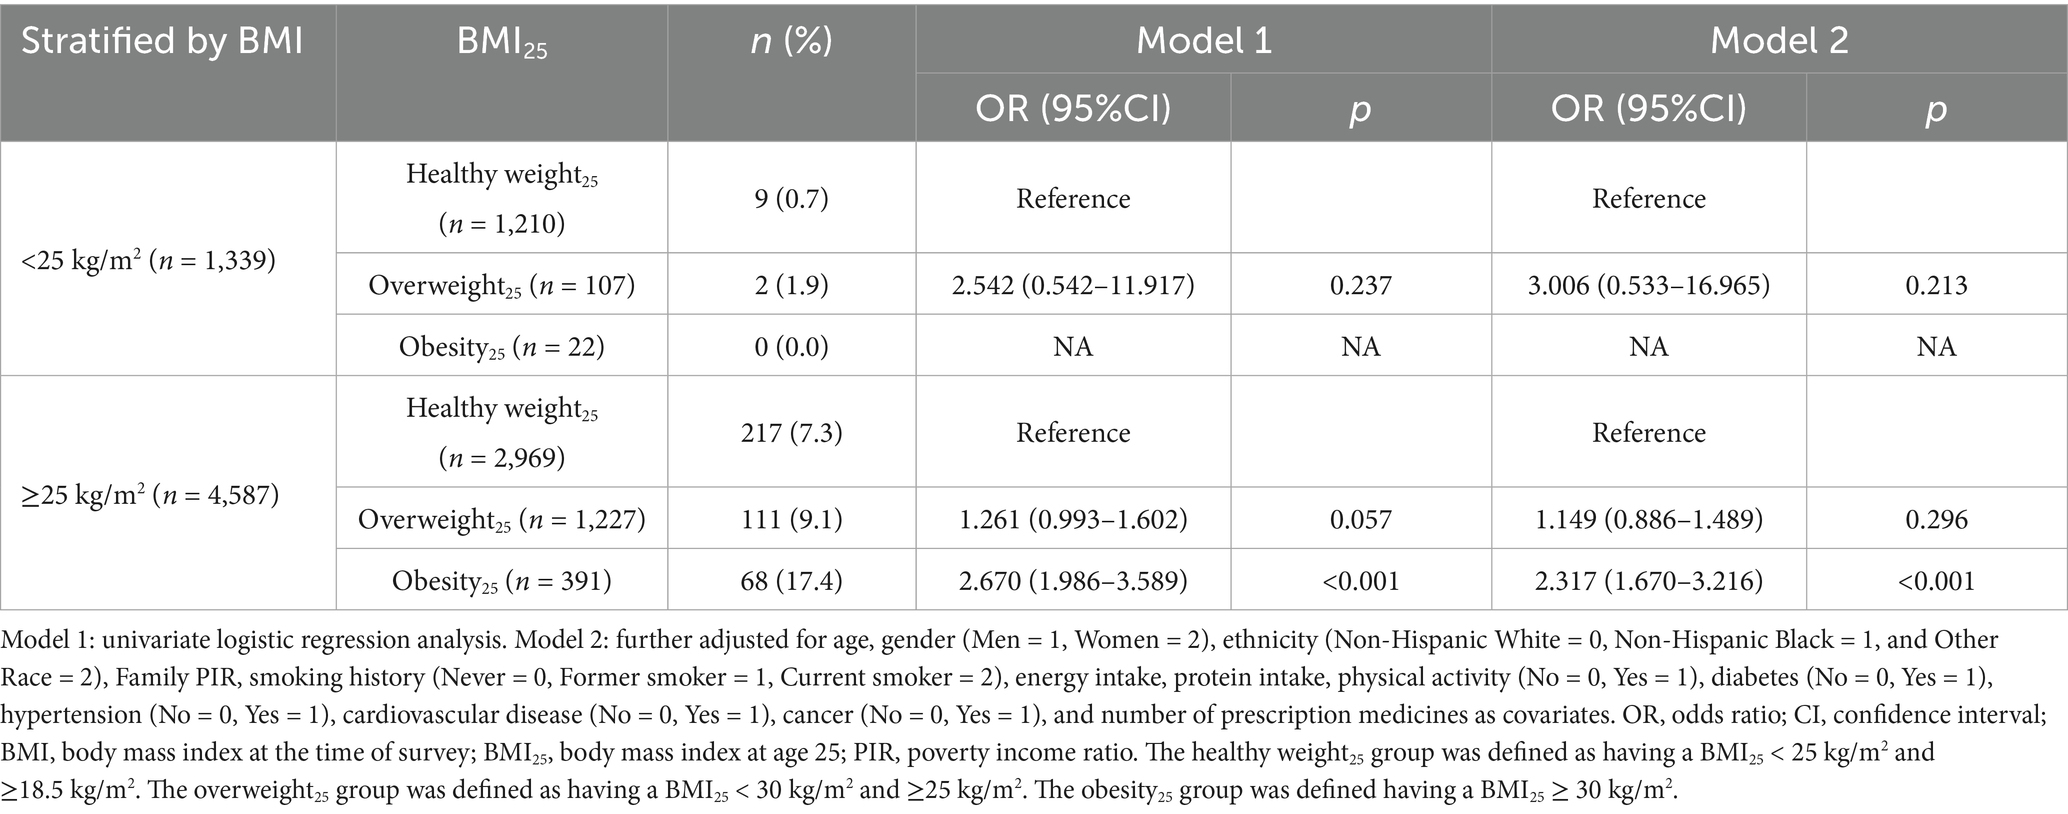
Table 4. The relationship between obesity status at age 25 and sarcopenic obesity among middle-aged and older adults in the United States (stratified by BMI).
The gender-, age-, and ethnicity-specific analyses were also conducted (Supplementary Table 3). The prevalence of SO was higher in men compared to women (8.1% vs. 5.6%, χ2 = 14.32, p < 0.001). Both the overweight25 group and the obesity25 group were correlated with SO in both men and women. The prevalence of SO was higher in adults aged 60–69 years compared to those aged 50–59 years (9.7% vs. 5.3%, χ2 = 41.64, p < 0.001). The overweight25 group and the obesity25 group were found to be correlated with SO in adults across both age ranges, 50–59 years and 60–69 years. The prevalence of SO was lower in Non-Hispanic Black adults compared to Non-Hispanic White and Other Race adults (2.2% vs. 8.0% vs. 8.3%, χ2 = 55.39, p < 0.001). The obesity25 group was found to be correlated with SO in both ethnicities. However, the overweight25 group was found to be correlated with SO only in Non-Hispanic White adults and Other Race adults.
The time required to complete a 20-foot walk was higher in the obesity25 group compared to the healthy weight25 group in the 1999–2002 cycles (p < 0.05). In the 2011–2014 cycles, the levels of combined grip strength were higher in the overweight25 group compared to the healthy weight25 group and obesity25 group (p < 0.05). The levels of MQI were lower in the overweight25 group and obesity25 group compared to the healthy weight25 group (p < 0.05). The levels of MQI were lower in the obesity25 group compared to the overweight25 group (p < 0.05) (Table 5).
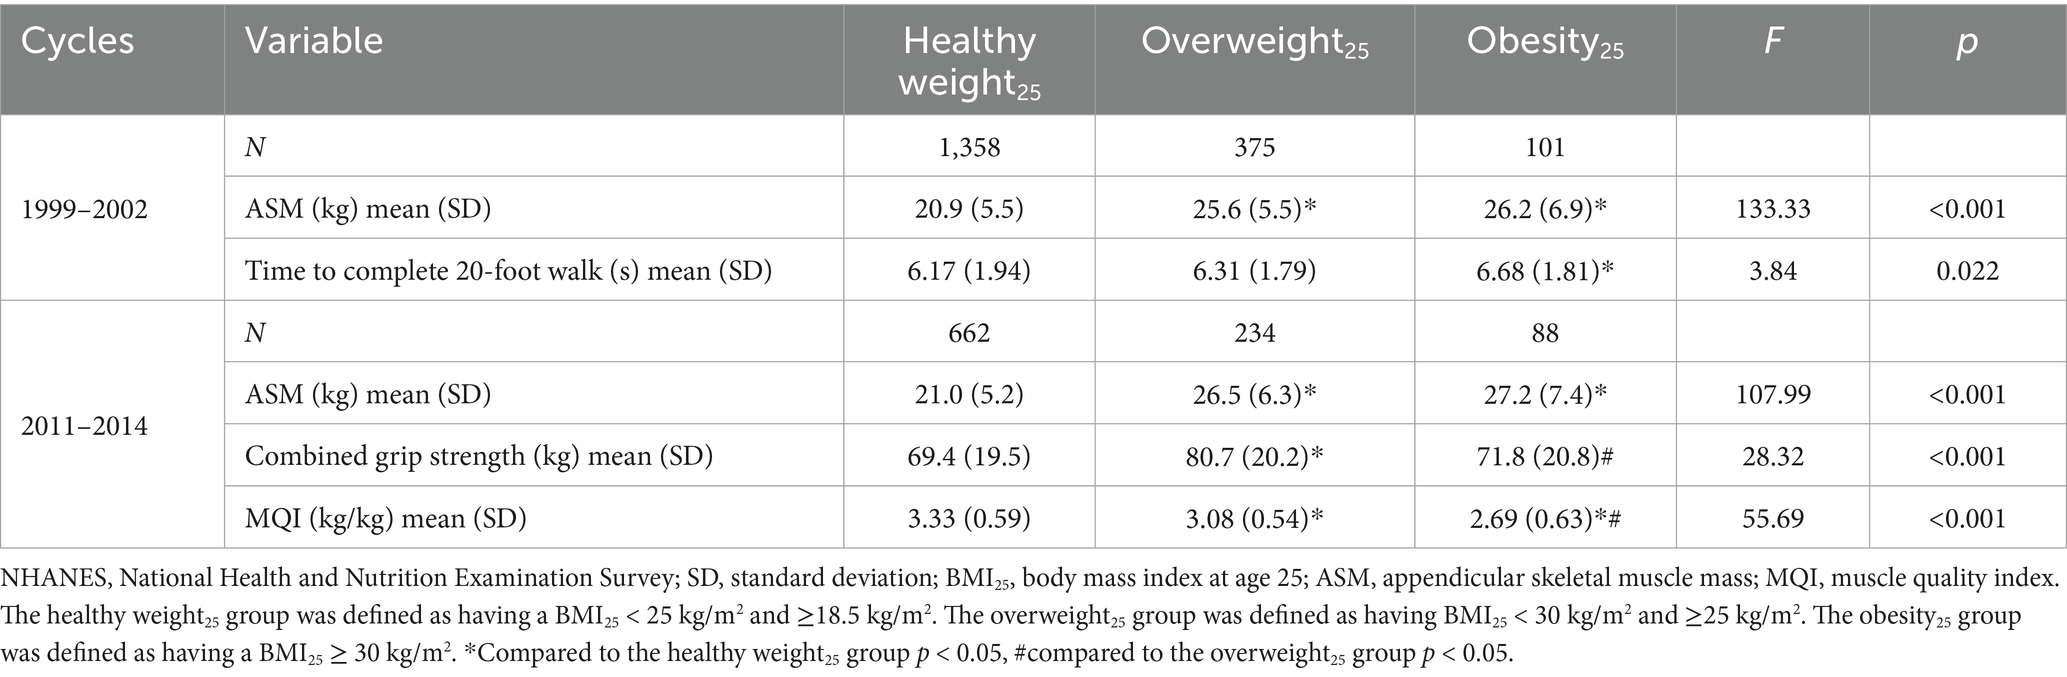
Table 5. Muscle function based on obesity status at age 25 in the NHANES.
Discussion
The present study found that the prevalence of SO among middle-aged and older adults in the United States was 6.9%. This estimate is comparable to a previously published meta-analysis, which reported a global prevalence of 11% in older adults (23). Notably, there is considerable variability in the reported prevalence of SO, largely due to the absence of universally accepted diagnostic criteria. In this study, the diagnostic criteria were based on the joint guidelines of the European Society for Clinical Nutrition and Metabolism (ESPEN) and the European Association for the Study of Obesity (EASO) (18), and it also incorporated age-, gender-, and ethnicity-specific cutoffs (19, 21).
Our findings indicate that the prevalence of SO increased with higher obesity status in early adulthood. Previous epidemiological studies have demonstrated a significant trajectory effect of obesity over the life course (10, 24). Consistent with these findings, our results indicate that individuals who were overweight or obese at age 25 had higher BMI levels during middle and old age. After adjusting for overweight and obesity status at the time of survey, early adulthood obesity remained significantly associated with SO in later life, indicating an independent effect of early obesity on the development of SO.
Obesity in early adulthood has also been strongly associated with reduced muscle mass in young adults (25). In our analysis of SO components, early adulthood obesity remained independently associated with both sarcopenia and obesity in middle-aged and older adults, even after controlling for concurrent obesity status. Although individuals who were obese in early adulthood may have higher absolute muscle mass in middle and old age compared to those with normal weight, their relative muscle mass remains lower.
Furthermore, early adulthood obesity was associated with reduced muscle function in middle-aged and older individuals. Despite higher absolute muscle mass, individuals with early adulthood obesity exhibited slower walking speeds and comparable grip strength to those with a healthy weight in early adulthood. Muscle quality index (MQI), defined as the ratio of muscle strength to muscle mass, is used to evaluate muscle quality (22). Our findings indicate that MQI decreased with increasing early adulthood obesity status. These results align with prior findings indicating that prolonged exposure to obesity is linked to poorer muscle strength in later life (26).
Aging is associated with significant alterations in body composition. Body fat tends to increase until approximately the seventh decade of life and subsequently declines. In contrast, muscle mass begins to decrease after peaking in the fourth decade, leading to weight gain predominantly in the form of fat rather than lean mass (27). Obesity may exacerbate these changes through several mechanisms.
Inflammatory pathways: Obesity activates macrophages, thereby inducing low-grade chronic inflammation that contributes to insulin resistance. This cascade promotes a decline in both muscle mass and function (26, 27).
Ectopic fat deposition: Obesity facilitates the deposition of fat in ectopic locations, including skeletal muscle. An increased level of intramyocellular lipids has been associated with impaired muscle function in obese older adults (28).
Adipocytokine dysregulation: Adipose tissue functions as an endocrine organ, secreting various adipokines such as leptin and adiponectin. Obesity disrupts the normal secretion patterns of these adipokines. Elevated levels of leptin, indicative of leptin resistance, are closely associated with decreased muscle mass in middle-aged and older adults (29, 30).
Changes in obesity status may influence the risk of developing sarcopenic obesity in middle-aged and older adults. Among individuals who were overweight or obese in early adulthood, those whose BMI decreased to below 25 kg/m2 in later life had a significantly lower prevalence of SO compared to those whose BMI remained above 25 kg/m2. Moreover, individuals with persistently high BMI values throughout life had a higher prevalence of SO than those who became overweight or obese at a later stage.
Two large-scale prospective cohort studies have also reported a strong association between age and obesity-related outcomes. Compared to individuals with normal weight, obesity in younger adults is linked to a higher risk of all-cause mortality, whereas obesity in older adults does not appear to increase mortality risk (31). These findings suggest that implementing weight management strategies among overweight and obese young adults may have potential clinical benefits in reducing the risk of SO in later life. However, these implications should be validated through prospective cohort studies or randomized clinical trials.
This study has several strengths. It included a large sample size and conducted stratified analyses based on gender, age, and ethnicity. Across all gender and age categories, overweight and obesity in early adulthood were associated with an elevated risk of SO in middle-aged and older individuals. However, ethnic differences were observed in the association between early adulthood overweight status and SO among Non-Hispanic Black individuals and other racial groups. The prevalence of SO was lower among Non-Hispanic Black participants. Specifically, in this population, the prevalence of SO among those who were overweight in early adulthood was comparable to that observed in those with a healthy weight at the same age. Although residual confounding may be present, these findings may be partially explained by ethnic differences in body composition observed in the NHANES population. When BMI is held constant, Non-Hispanic Black individuals tend to have greater muscle mass and lower fat mass compared to other ethnicities (32).
Nevertheless, several limitations should be acknowledged. First, sarcopenia in this study was assessed solely based on skeletal muscle mass, as measurements of muscle strength and function—such as grip strength and walking speed—were only available in a subset of the NHANES cycles. Recent consensus definitions emphasize muscle strength and physical function as core components of sarcopenia (33). Although walking speed, grip strength, and the muscle quality index were analyzed in a subsample, the exclusion of functional metrics from the core SO definition may have led to misclassification. Hence, future research is warranted to confirm the association between early adulthood obesity and sarcopenic obesity—defined simultaneously by muscle mass, strength, and function—in middle-aged and older adults.
Second, early adulthood overweight and obesity were determined using self-reported height and weight at age 25. Although self-reported anthropometric data are widely used in epidemiological studies (16, 34), the accuracy of recalled weight over extended periods may be affected by recall bias (35, 36). While this approach is more economical and convenient than prospective tracking, the long recall interval could compromise the precision of the data. Recall accuracy is known to differ by age, with older adults (≥60 years) generally having lower accuracy compared to younger individuals (<60 years) (37). However, subgroup analyses stratified by age group (50–59 years and 60–69 years) showed similar results, supporting the robustness of the findings.
Third, the retrospective design of this study limits causal inference. The relationship between early adulthood obesity and subsequent SO should be further investigated through well-designed prospective cohort studies. Moreover, potential residual confounding factors—particularly those related to physical activity, comorbidities, or early-life dietary patterns—were not controlled for in this study.
In conclusion, this study demonstrates that obesity in early adulthood is strongly associated with an increased risk of sarcopenic obesity in middle-aged and older individuals. Weight changes in early adulthood exert a potential influence on the likelihood of developing SO later in life. Restoration of body weight to a normal range may reduce the risk of SO, whereas persistent overweight or obesity may elevate this risk. These findings underscore the importance of early life weight management as a potential strategy for preventing SO in old age.
Data availability statement
The raw data supporting the conclusions of this article will be made available by the authors without undue reservation.
Ethics statement
Ethical review and approval was not required for the study on human participants in accordance with the local legislation and institutional requirements. Written informed consent from the patients/participants OR patients/participants legal guardian/next of kin was not required to participate in this study in accordance with the national legislation and the institutional requirements.
Author contributions
GC: Writing – original draft. YZ: Writing – original draft. YW: Writing – review & editing. CW: Writing – review & editing. JX: Conceptualization, Writing – review & editing.
Funding
The author(s) declare that financial support was received for the research and/or publication of this article. Qinhuangdao S&T Plan Program (No. 202501A055).
Conflict of interest
The authors declare that the research was conducted in the absence of any commercial or financial relationships that could be construed as a potential conflict of interest.
Generative AI statement
The authors declare that no Gen AI was used in the creation of this manuscript.
Publisher’s note
All claims expressed in this article are solely those of the authors and do not necessarily represent those of their affiliated organizations, or those of the publisher, the editors and the reviewers. Any product that may be evaluated in this article, or claim that may be made by its manufacturer, is not guaranteed or endorsed by the publisher.
Supplementary material
The Supplementary material for this article can be found online at: https://www.frontiersin.org/articles/10.3389/fpubh.2025.1609325/full#supplementary-material
Footnotes
1. ^https://www.cdc.gov/nchs/nhanes/about/erb.html?CDC_AAref_Val=; https://www.cdc.gov/nchs/nhanes/irba98.htm
2. ^https://www.cdc.gov/bmi/adult-calculator/bmi-categories.html
References
1. An, KO, and Kim, J. Association of sarcopenia and obesity with multimorbidity in Korean adults: a nationwide cross-sectional study. J Am Med Dir Assoc. (2016) 17:960.e1–7. doi: 10.1016/j.jamda.2016.07.005
2. Gengxin, Y, Xuehan, M, Xinyu, W, Yali, Y, Yiran, X, Lishuang, Z, et al. Association between sarcopenic obesity and risk of frailty in older adults: a systematic review and meta-analysis. Age Ageing. (2025) 54:afae286. doi: 10.1093/ageing/afae286
3. Gandham, A, Mesinovic, J, Jansons, P, Zengin, A, Bonham, MP, Ebeling, PR, et al. Falls, fractures, and areal bone mineral density in older adults with sarcopenic obesity: a systematic review and meta-analysis. Obes Rev. (2021) 22:e13187. doi: 10.1111/obr.13187
4. Veronese, N, Ragusa, FS, Pegreffi, F, Dominguez, LJ, Barbagallo, M, Zanetti, M, et al. Sarcopenic obesity and health outcomes: an umbrella review of systematic reviews with meta-analysis. J Cachexia Sarcopenia Muscle. (2024) 15:1264–74. doi: 10.1002/jcsm.13502
5. Tian, S, and Xu, Y. Association of sarcopenic obesity with the risk of all-cause mortality: a meta-analysis of prospective cohort studies. Geriatr Gerontol Int. (2016) 16:155–66. doi: 10.1111/ggi.12579
6. Zhang, X, Xie, X, Dou, Q, Liu, C, Zhang, W, Yang, Y, et al. Association of sarcopenic obesity with the risk of all-cause mortality among adults over a broad range of different settings: a updated meta-analysis. BMC Geriatr. (2019) 19:183. doi: 10.1186/s12877-019-1195-y
7. Zou, Y, Ye, H, Xu, Z, Yang, Q, Zhu, J, Li, T, et al. Obesity, sarcopenia, sarcopenic obesity, and hypertension: mediating role of inflammation and insulin resistance. J Gerontol A Biol Sci Med Sci. (2025) 80:glae284. doi: 10.1093/gerona/glae284
8. Batsis, JA, Mackenzie, TA, Jones, JD, Lopez-Jimenez, F, and Bartels, SJ. Sarcopenia, sarcopenic obesity and inflammation: results from the 1999-2004 national health and nutrition examination survey. Clin Nutr. (2016) 35:1472–83. doi: 10.1016/j.clnu.2016.03.028
9. Kivimäki, M, Strandberg, T, Pentti, J, Nyberg, ST, Frank, P, Jokela, M, et al. Body-mass index and risk of obesity-related complex multimorbidity: an observational multicohort study. Lancet Diabetes Endocrinol. (2022) 10:253–63. doi: 10.1016/S2213-8587(22)00033-X
10. Singh, AS, Mulder, C, Twisk, JWR, van Mechelen, W, and Chinapaw, MJM. Tracking of childhood overweight into adulthood: a systematic review of the literature. Obes Rev. (2008) 9:474–88. doi: 10.1111/j.1467-789X.2008.00475.x
11. Tallis, J, Shelley, S, Degens, H, and Hill, C. Age-related skeletal muscle dysfunction is aggravated by obesity: an investigation of contractile function, implications and treatment. Biomolecules. (2021) 11:372. doi: 10.3390/biom11030372
12. Stenholm, S, Rantanen, T, Alanen, E, Reunanen, A, Sainio, P, and Koskinen, S. Obesity history as a predictor of walking limitation at old age. Obesity (Silver Spring). (2007) 15:929–38. doi: 10.1038/oby.2007.583
13. Houston, DK, Ding, J, Nicklas, BJ, Harris, TB, Lee, JS, Nevitt, MC, et al. Overweight and obesity over the adult life course and incident mobility limitation in older adults: the health, aging and body composition study. Am J Epidemiol. (2009) 169:927–36. doi: 10.1093/aje/kwp007
14. Houston, DK, Ding, J, Nicklas, BJ, Harris, TB, Lee, JS, Nevitt, MC, et al. The association between weight history and physical performance in the health, aging and body composition study. Int J Obes. (2007) 31:1680–7. doi: 10.1038/sj.ijo.0803652
15. Alharbi, TA, Owen, AJ, Ryan, J, Gasevic, D, McNeil, JJ, Woods, RL, et al. Socio-demographic, lifestyle, and clinical characteristics of early and later weight status in older adults: secondary analysis of the ASPREE trial and ALSOP sub-study. Geriatrics (Basel). (2023) 8:71. doi: 10.3390/geriatrics8040071
16. Alharbi, TA, Ryan, J, Freak-Poli, R, Gasevic, D, McNeil, J, Woods, RL, et al. Self-reported early and later life weight and the risk of all-cause mortality in older adults. J Nutr Health Aging. (2023) 27:301–8. doi: 10.1007/s12603-023-1907-1
17. Xu, J, Hu, Q, Li, J, Zhou, Y, and Chu, T. Effects of non-pharmacological interventions on patients with sarcopenic obesity: a meta-analysis. PLoS One. (2023) 18:e0290085. doi: 10.1371/journal.pone.0290085
18. Donini, LM, Busetto, L, Bischoff, SC, Cederholm, T, Ballesteros-Pomar, MD, Batsis, JA, et al. Definition and diagnostic criteria for sarcopenic obesity: ESPEN and EASO consensus statement. Obes Facts. (2022) 15:321–35. doi: 10.1159/000521241
19. Batsis, JA, Barre, LK, Mackenzie, TA, Pratt, SI, Lopez-Jimenez, F, and Bartels, SJ. Variation in the prevalence of sarcopenia and sarcopenic obesity in older adults associated with different research definitions: dual-energy X-ray absorptiometry data from the national health and nutrition examination survey 1999-2004. J Am Geriatr Soc. (2013) 61:974–80. doi: 10.1111/jgs.12260
20. Deurenberg, P, Yap, M, and van Staveren, WA. Body mass index and percent body fat: a meta analysis among different ethnic groups. Int J Obes Relat Metab Disord. (1998) 22:1164–71. doi: 10.1038/sj.ijo.0800741
21. Gallagher, D, Heymsfield, SB, Heo, M, Jebb, SA, Murgatroyd, PR, and Sakamoto, Y. Healthy percentage body fat ranges: an approach for developing guidelines based on body mass index. Am J Clin Nutr. (2000) 72:694–701. doi: 10.1093/ajcn/72.3.694
22. Lopes, LCC, Vaz-Gonçalves, L, Schincaglia, RM, Gonzalez, MC, Prado, CM, de Oliveira, EP, et al. Sex and population-specific cutoff values of muscle quality index: results from NHANES 2011-2014. Clin Nutr. (2022) 41:1328–34. doi: 10.1016/j.clnu.2022.04.026
23. Gao, Q, Mei, F, Shang, Y, Hu, K, Chen, F, Zhao, L, et al. Global prevalence of sarcopenic obesity in older adults: a systematic review and meta-analysis. Clin Nutr. (2021) 40:4633–41. doi: 10.1016/j.clnu.2021.06.009
24. Serdula, MK, Ivery, D, Coates, RJ, Freedman, DS, Williamson, DF, and Byers, T. Do obese children become obese adults? A review of the literature. Prev Med. (1993) 22:167–77. doi: 10.1006/pmed.1993.1014
25. Stefanaki, C, Peppa, M, Boschiero, D, and Chrousos, GP. Healthy overweight/obese youth: early osteosarcopenic obesity features. Eur J Clin Investig. (2016) 46:767–78. doi: 10.1111/eci.12659
26. Stenholm, S, Sallinen, J, Koster, A, Rantanen, T, Sainio, P, Heliovaara, M, et al. Association between obesity history and hand grip strength in older adults--exploring the roles of inflammation and insulin resistance as mediating factors. J Gerontol A Biol Sci Med Sci. (2011) 66A:341–8. doi: 10.1093/gerona/glq226
27. Batsis, JA, and Villareal, DT. Sarcopenic obesity in older adults: aetiology, epidemiology and treatment strategies. Nat Rev Endocrinol. (2018) 14:513–37. doi: 10.1038/s41574-018-0062-9
28. Choi, SJ, Files, DC, Zhang, T, Wang, ZM, Messi, ML, Gregory, H, et al. Intramyocellular lipid and impaired Myofiber contraction in normal weight and obese older adults. J Gerontol A Biol Sci Med Sci. (2016) 71:557–64. doi: 10.1093/gerona/glv169
29. Tabara, Y, Okada, Y, Ochi, M, Ohyagi, Y, and Igase, M. Associations between adiponectin and leptin levels and skeletal muscle mass and myosteatosis in older adults: the Shimanami health promoting program study. Geriatr Gerontol Int. (2023) 23:444–9. doi: 10.1111/ggi.14582
30. Kohara, K, Ochi, M, Tabara, Y, Nagai, T, Igase, M, and Miki, T. Leptin in sarcopenic visceral obesity: possible link between adipocytes and myocytes. PLoS One. (2011) 6:e24633. doi: 10.1371/journal.pone.0024633
31. Ge, YZ, Liu, T, Deng, L, Zhang, Q, Liu, CA, Ruan, GT, et al. The age-related obesity paradigm: results from two large prospective cohort studies. J Cachexia Sarcopenia Muscle. (2024) 15:442–52. doi: 10.1002/jcsm.13415
32. Heymsfield, SB, Peterson, CM, Thomas, DM, Heo, M, and Schuna, JM Jr. Why are there race/ethnic differences in adult body mass index-adiposity relationships? A quantitative critical review. Obes Rev. (2016) 17:262–75. doi: 10.1111/obr.12358
33. Cruz-Jentoft, AJ, Bahat, G, Bauer, J, Boirie, Y, Bruyère, O, Cederholm, T, et al. Sarcopenia: revised European consensus on definition and diagnosis. Age Ageing. (2019) 48:16–31. doi: 10.1093/ageing/afy169
34. Alharbi, TA, Ryan, J, Freak-Poli, R, Gasevic, D, Scali, J, Ritchie, K, et al. The association of weight loss, weight status, and abdominal obesity with all-cause mortality in older adults. Gerontology. (2022) 68:1366–74. doi: 10.1159/000522040
35. Perry, GS, Byers, TE, Mokdad, AH, Serdula, MK, and Williamson, DF. The validity of self-reports of past body weights by U.S. adults. Epidemiology. (1995) 6:61–6. doi: 10.1097/00001648-199501000-00012
36. Tamakoshi, K, Yatsuya, H, Kondo, T, Hirano, T, Hori, Y, Yoshida, T, et al. The accuracy of long-term recall of past body weight in Japanese adult men. Int J Obes Relat Metab Disord. (2003) 27:247–52. doi: 10.1038/sj.ijo.802195
Keywords: sarcopenic obesity, early adulthood obesity, middle-aged and older adult, United States, NHANES
Citation: Cheng G, Zhou Y, Wang Y, Wang C and Xu J (2025) The relationship between early adulthood obesity and sarcopenic obesity among middle-aged and older adults in the United States. Front. Public Health. 13:1609325. doi: 10.3389/fpubh.2025.1609325
Edited by:
Carlos Seiça Cardoso, University of Coimbra, PortugalReviewed by:
Anabela Mota-Pinto, University of Coimbra, PortugalKei Shing Ng, The University of Hong Kong, Hong Kong SAR, China
Jovica Jovanovic, University of Niš, Serbia
Copyright © 2025 Cheng, Zhou, Wang, Wang and Xu. This is an open-access article distributed under the terms of the Creative Commons Attribution License (CC BY). The use, distribution or reproduction in other forums is permitted, provided the original author(s) and the copyright owner(s) are credited and that the original publication in this journal is cited, in accordance with accepted academic practice. No use, distribution or reproduction is permitted which does not comply with these terms.
*Correspondence: Jianghong Xu, eHVqaWFuZ2hvbmd6eXlAMTYzLmNvbQ==
†These authors share first authorship