 Haoneng Hu1†Quan Zhou2†
 Kang Cao1†
 Yu Jiang1
 Jianjun Xiang1
 Jing Wu1Jin Li1
 Zhiwei Chen2
 Shuling Kang2Dandan Zhu3Huaying Lin2*
 Chuancheng Wu1*
- 1Department of Preventive Medicine, School of Public Health, Fujian Medical University, Fuzhou, China
- 2Fujian Medical University Affiliated Center for Disease Control and Prevention, Fuzhou, China
- 3Quanzhou Medical College, Quanzhou, China
Background: Emerging evidence links fine particulate matter (PM2.5) and its polycyclic aromatic hydrocarbon (PAH) components to adverse health outcomes. However, the biological mechanisms driving these associations remain unclear. This study innovatively integrates personal exposure monitoring and untargeted metabolomics in an older adult population to investigate the differential impacts of individual PM2.5-bound PAHs on metabolic pathways and elucidate their roles in health risks.
Methods: In this study, we enlisted the participation of 112 healthy older adults. We employed personal samplers to monitor the concentrations of pollutants throughout the study period. Furthermore, we conducted an untargeted metabolomic analysis of plasma samples using a liquid chromatograph mass spectrometer (LC–MS). A general linear regression model was utilized to investigate the significant relationships between metabolites and pollutants. Metabolic pathway enrichment analysis was performed to reveal the disturbed metabolic pathways related to PM2.5-bound PAHs.
Results: Our study demonstrated that short-term exposure to PM2.5-bound PAHs may induce acute perturbations in plasma metabolites among the older adult population. We found that exposure to LMW PAHs in PM2.5 were correlated with amino acid metabolic pathways, while HMW-PAHs are associated with fatty acid and cholesterol metabolism pathways. While PM2.5 mass was higher in summer, the toxic PAHs component of PM2.5 was substantially higher in winter, contributing to greater observed toxicity.
Conclusion: The plasma metabolome presents a promising resource for biomarkers and pathways, elucidating the biological mechanisms of PM2.5-bound PAHs. Our findings suggest that the cholesterol and citric acid metabolites, as well as the cholesterol biosynthesis and citric acid cycle pathways they affect, may play important roles in the health damage caused by PAHs, providing potential insights into the pathogenic processes underlying the impact of PM2.5-bound PAHs.
1 Introduction
Air pollution is widely acknowledged as a significant global environmental and public health threat, with particulate matter playing a pivotal role in the deterioration of air quality (1, 2). The WHO estimated that 4.2 million deaths annually could be attributed to PM2.5, with half of the world’s population exposed to increasing air pollution (3). The harmful effects of PM2.5 are attributed to its complex chemical composition (4). A multicenter longitudinal study indicated that even exposure to PM2.5 below established limits is associated with non-accidental mortality. The most significant effects were observed at lower concentrations, suggesting a concentration-response curve without an identifiable threshold (5). Another study demonstrated consistent increases in daily mortality with increasing PM concentration, with steeper slopes observed at lower PM concentrations (6).
Polycyclic aromatic hydrocarbons (PAHs) adsorbed on PM2.5, characterized by their multiple benzene rings, are persistent organic pollutants and primary atmospheric contaminants. They are known for their carcinogenic, teratogenic, and endocrine-disrupting properties, and were among the initial atmospheric pollutants identified as suspected carcinogens (7). The distribution, transformation, and bioaccumulation effects of these compounds in the atmospheric environment represent a significant threat to the environment and human health (8, 9). Several studies have linked exposure to PM2.5-borne PAHs to altered lipid profiles (10, 11), inflammatory reactions, and oxidative stress (12–15). Some research also suggests a correlation between exposure to these compounds and adverse health effects such as lung cancer, cardiovascular disease, respiratory non-malignant diseases like asthma and chronic obstructive pulmonary disease, diabetes, and obesity (16–19). PAHs typically exist as a group, with different components exhibiting varying levels of toxicity. Based on their molecular weight, they can be classified into low molecular weight PAHs and high molecular weight PAHs. Studies have demonstrated that as the molecular weight increases, the carcinogenicity of PAHs rises while acute toxicity declines. Consequently, understanding the distinctive characteristics that may exist within PAH mixtures can facilitate the accurate assessment of their hazards and the implementation of risk control measures (20).
Despite numerous studies investigating the adverse health effects of PM2.5 and its chemical constituents, further understanding is required regarding the potential health risks of PM2.5 concentrations below established threshold limits, as well as the detrimental health effects of its individual components (4). Additionally, the mechanisms underlying these effects and the extent to which PAHs contribute to PM2.5’s health impacts remain unclear. The composition and concentration of particulate matter are fundamental characteristics that determine its toxicity and health effects. The exposure-effect relationship resulting from particulate matter exposure is complex, making it crucial to study the health impacts of its various components.
Air pollution epidemiology studies frequently use outdoor concentrations of ambient fine particulate matter as exposure surrogates, which can lead to exposure misclassification errors (21). This approach may overlook several factors, resulting in inaccurate pollutant exposure assessments. For example, it fails to account for individual exposure to air pollutants in various indoor and outdoor environments and daily activity patterns. Numerous studies have emphasized the importance of personal monitoring for a more comprehensive assessment of exposure and health risks, as personal monitoring can provide more precise measurements of individual exposure, especially for subjects with similar economic, environmental, and behavioral characteristics (22–24).
Metabolites in body fluids, which often reflect the ultimate outcomes of biological processes, offer insights into functional changes induced by external exposures (25–27). Metabolomics is a valuable platform that provides a global profiling of complex metabolic alterations in biological fluids or tissue samples after various perturbations, such as pathological states or exposure to external stimuli (28, 29). While air pollution affects individuals across all regions, ages, and social classes, certain subgroups—such as the older adult, children, and patients with cardiovascular or respiratory diseases—are considered more susceptible to its adverse health effects (30). There is substantial evidence indicating that individuals aged 65 and older are more vulnerable to the health impacts of air pollution compared to younger people, due to diminished physiological, metabolic, and compensatory processes, which increase their sensitivity to pollutants and elevate the incidence of related diseases (31). As the global population continues to age, addressing how to protect the older adult from pollution exposure and promote healthier living has become a matter of urgent international concern.
In this study, we employed an untargeted metabolomics approach to measure plasma metabolites in the older adult population and estimated exposure more accurately based on individual monitoring. Our objectives were to comprehensively investigate the relationships between personal PM2.5-bound PAH exposure and plasma metabolites in older adults, and to identify crucial biomarkers and potential metabolic pathways. This may shed light on the mechanisms by which PM2.5-bound PAHs lead to adverse health effects.
2 Materials and methods
2.1 Study participants and sample collection
This study is based on the ‘Air Pollution (Haze) Impact on Population Health and Surveillance and Protection’ project conducted by the Fuzhou Center for Disease Control and Prevention. Fuzhou serves as a clean air control site representing the exposure conditions of relatively low PM2.5 pollution areas. Study volunteers were enrolled from a community located at the urban–rural intersection in Fuzhou, located approximately 2 km away from the national air monitoring station, with no nearby industrial emission sources. We established an observational study in December 2020 and conducted follow-ups every summer (July–September) and winter (December–February). The study participants met the following criteria (1): healthy senior individuals aged ≥60 years residing in the community (2), having lived at the current residential address for more than 3 years and having no travel plans during the study period (3), voluntary participation and ability to complete the questionnaire (4), absence of chronic metabolic diseases or major diseases (e.g., diabetes mellitus, respiratory disease, cardiovascular or cerebrovascular diseases, hyperglycemia, hyperlipidemia, hypertension, cancers, or tumors), and (5) no occupational exposure to PAHs. For the present study, we only analyzed data from the period of 2020–2021.
Basic information of the participants is collected through questionnaire surveys and physical examination data collection, and fasting blood samples of the subjects are collected after a three-day (72 h) sampling period. The whole blood samples were centrifuged at 3,000 rpm for 10 min immediately after collection and the plasma samples were kept at −80°C until laboratory analysis. All blood samples were collected by professional medical staff. After excluding subjects with invalid personal PM2.5 samples or missing information, a total of 112 subjects were included in the final analysis. The current research was approved by the Ethics Committee of Fuzhou Center for Disease Control and Prevention (no.2021004). All participants provided informed consent before the survey.
2.2 Personal 24-h PM2.5 and PM2.5-bound PAHs monitoring
All participants wore Ultrasonic Personal Air Sample (UPAS V2, Access Sensor Technologies, CO, USA) at a flow rate of 1 L/min for a 72-h period to assess individual PM2.5 concentrations. The 24-h personal PM2.5 and PM2.5-bound PAHs mass concentrations were determined following standard operation procedures. The details of these procedures can be found in previous studies (10, 11, 14). In brief, we collected the filters from the samplers after sampling, and measure the mass concentration of PM2.5 by gravimetric method, and one half of each filter was used to measure PAH concentrations using high performance liquid chromatograph. In this study, we measured 16 PAHs designated as high-priority pollutants by the United States Environmental Protection Agency and two were excluded because more than 90% of the samples did not reach the detection limit. Specifically, 14 PAHs including Naphthalene (Nap), Acenaphthene (Ace), Fluorene (Flu), Phenanthrene (Phe), Fluoranthene (Flt), Pyrene (Pyr), Chrysene (Chr), Benz[a]anthracene (BaA), Benzo[b]fluoranthene (BbF), Benzo[k]fluoranthene (BkF), Benzo[a]pyrene (Bap), Dibenz[a,h]anthracene (Daha), Benzo[g,h,i]perylene (Bghip) and Indeno[1,2,3-cd]pyrene (Icdp).
The 14 included PAHs were divided according to their rings and molecular weight (1): 2rings (Nap); 3rings (Ace, Flu, Phe); 4rings (Flt, Pyr, Chr, BaA,); 5rings (BbF, BkF, Bap, Daha); 6rings (Bghip, Icdp) (2); low-molecular-weight PAHs (LMW-PAHs), including those with fewer than four rings, (Nap, Ace, Flu, Phe); high-molecular-weight PAHs (HMW-PAHs), including those with four or more rings.
2.3 Non-target metabolite detection and identification
Each sample was processed using Agilent 1,260 Infinity II coupled with a single quadrupole LC/MSD system. Plasma samples were separated on an Agilent SB-C18 column (2.1 × 50 mm, 1.8 μm, Agilent Technologies, Santa Clara, CA, USA) with an injection volume of 20 μL at a flow rate of 0.25 mL/min and a column temperature of 37°. These analytical methods for plasma untargeted metabolomics were commonly used in our previous studies.
Data files were converted to the mzXML format using Agilent MassHunter qualitative analysis software (version B.01.00, Agilent Technologies, Santa Clara, CA, USA) and processed using XCMS online (https://xcmsonline.scripps.edu, accessed on 29 September 2022), which performed feature detection, retention time correction, alignment, annotation, etc. We aligned the detected peaks across all samples with a retention time tolerance of 30 s and MS tolerance of 0.025 Da, and aligned peaks with a detection rate exceeding 80% were picked as potential metabolite features. Identification of metabolites was carried out by matching m/z (Da) values against the Human Metabolome Database (www.hmdb.ca, accessed on 10 October 2022), Kyoto Encyclopedia of Genes and Genomes (www.genome.jp/kegg/, accessed on 15 October 2022) and Metabolite Link (metlin.scripps.edu, accessed on 20 October 2022). Before statistical analysis, each metabolic peak in all subject samples was normalized based on QC samples.
2.4 Statistical analysis
LC–MS raw data, exported from XCMS Online, underwent preprocessing including baseline filtering, peak identification, peak integration, retention time (RT) correction, peak alignment, and normalization. The data was processed to generate a data matrix containing retention time, mass-to-charge ratio (m/z), peak intensity, and sample information. The peak intensity of metabolites in each sample was corrected using quality control (QC) sample peak intensities and subsequently normalized, we add one injection of QC at the beginning and end of each batch, and then normalize each batch based on the QC values from that batch to reduce batch effects. Metabolic features were matched against public databases (HMDB: www.hmdb.ca; KEGG: www.genome.jp/kegg/) using their exact mass, isotopic pattern, and MS/MS spectra. Matching criteria included an exact mass tolerance of 25 ppm and a retention time (RT) tolerance of ±30 s. When a metabolic feature matched multiple MS/MS spectra, all matching spectra were utilized for identification. Metabolite identification required meeting three stringent criteria (1): a defined RT window tolerance (2), an exact mass error tolerance of less than 10 ppm, and (3) a matching MS/MS spectrum based on comparison of ions present in the experimental spectrum with those in the database library entry.
We firstly examined the normality of data by Shapiro–Wilk test. Inhaled doses of PM2.5 and PM2.5-bound PAHs were log-transformed before further analyzing. We used a general linear regression model to estimate the association between the 14 PM2.5-bound PAHs and the log transformed peak areas of the metabolite features measured in plasma. Similar to some other metabolomics researches in air pollution, we adjusted all analyses for age, BMI, gender, season, smoking and drinking status (32, 33). Metabolite pathway enrichment analysis was performed by MetaboAnalyst (www.metaboanalyst.ca, accessed on 25 December 2022) according to the KEGG pathway database. Enrichment factor (EF) refers to a quantitative indicator that evaluates the effectiveness of enrichment. It reflects the ratio between the proportion of metabolites in a specific pathway within a selected group and their proportion in the background metabolites. Generally, a higher enrichment factor indicates stronger enrichment efficacy and greater importance of the metabolic pathway. The calculation formula is as follows:
Where:
m: Number of metabolites in the target pathway within the selected group.
M: Number of metabolites in the same pathway within the background reference.
n: Total number of metabolites in the selected group.
N: Total number of background metabolites.
R 4.2.0 was used to complete the above analysis. All p values were based on the bilateral test, and the statistical test level was α = 0.05. Draw volcano maps of differential metabolites.
3 Results
3.1 Study sample characteristics
The demographic characteristics of the participants in baseline are presented in Table 1. Of the 112 participants, 69 (61.6%) were women. The average age and BMI of the subjects were 67.43 ± 5.98 years old and 23.17 ± 2.84 kg/m3, respectively. Other general information, such as the education and cooking information of the old people, are shown in Table 1.
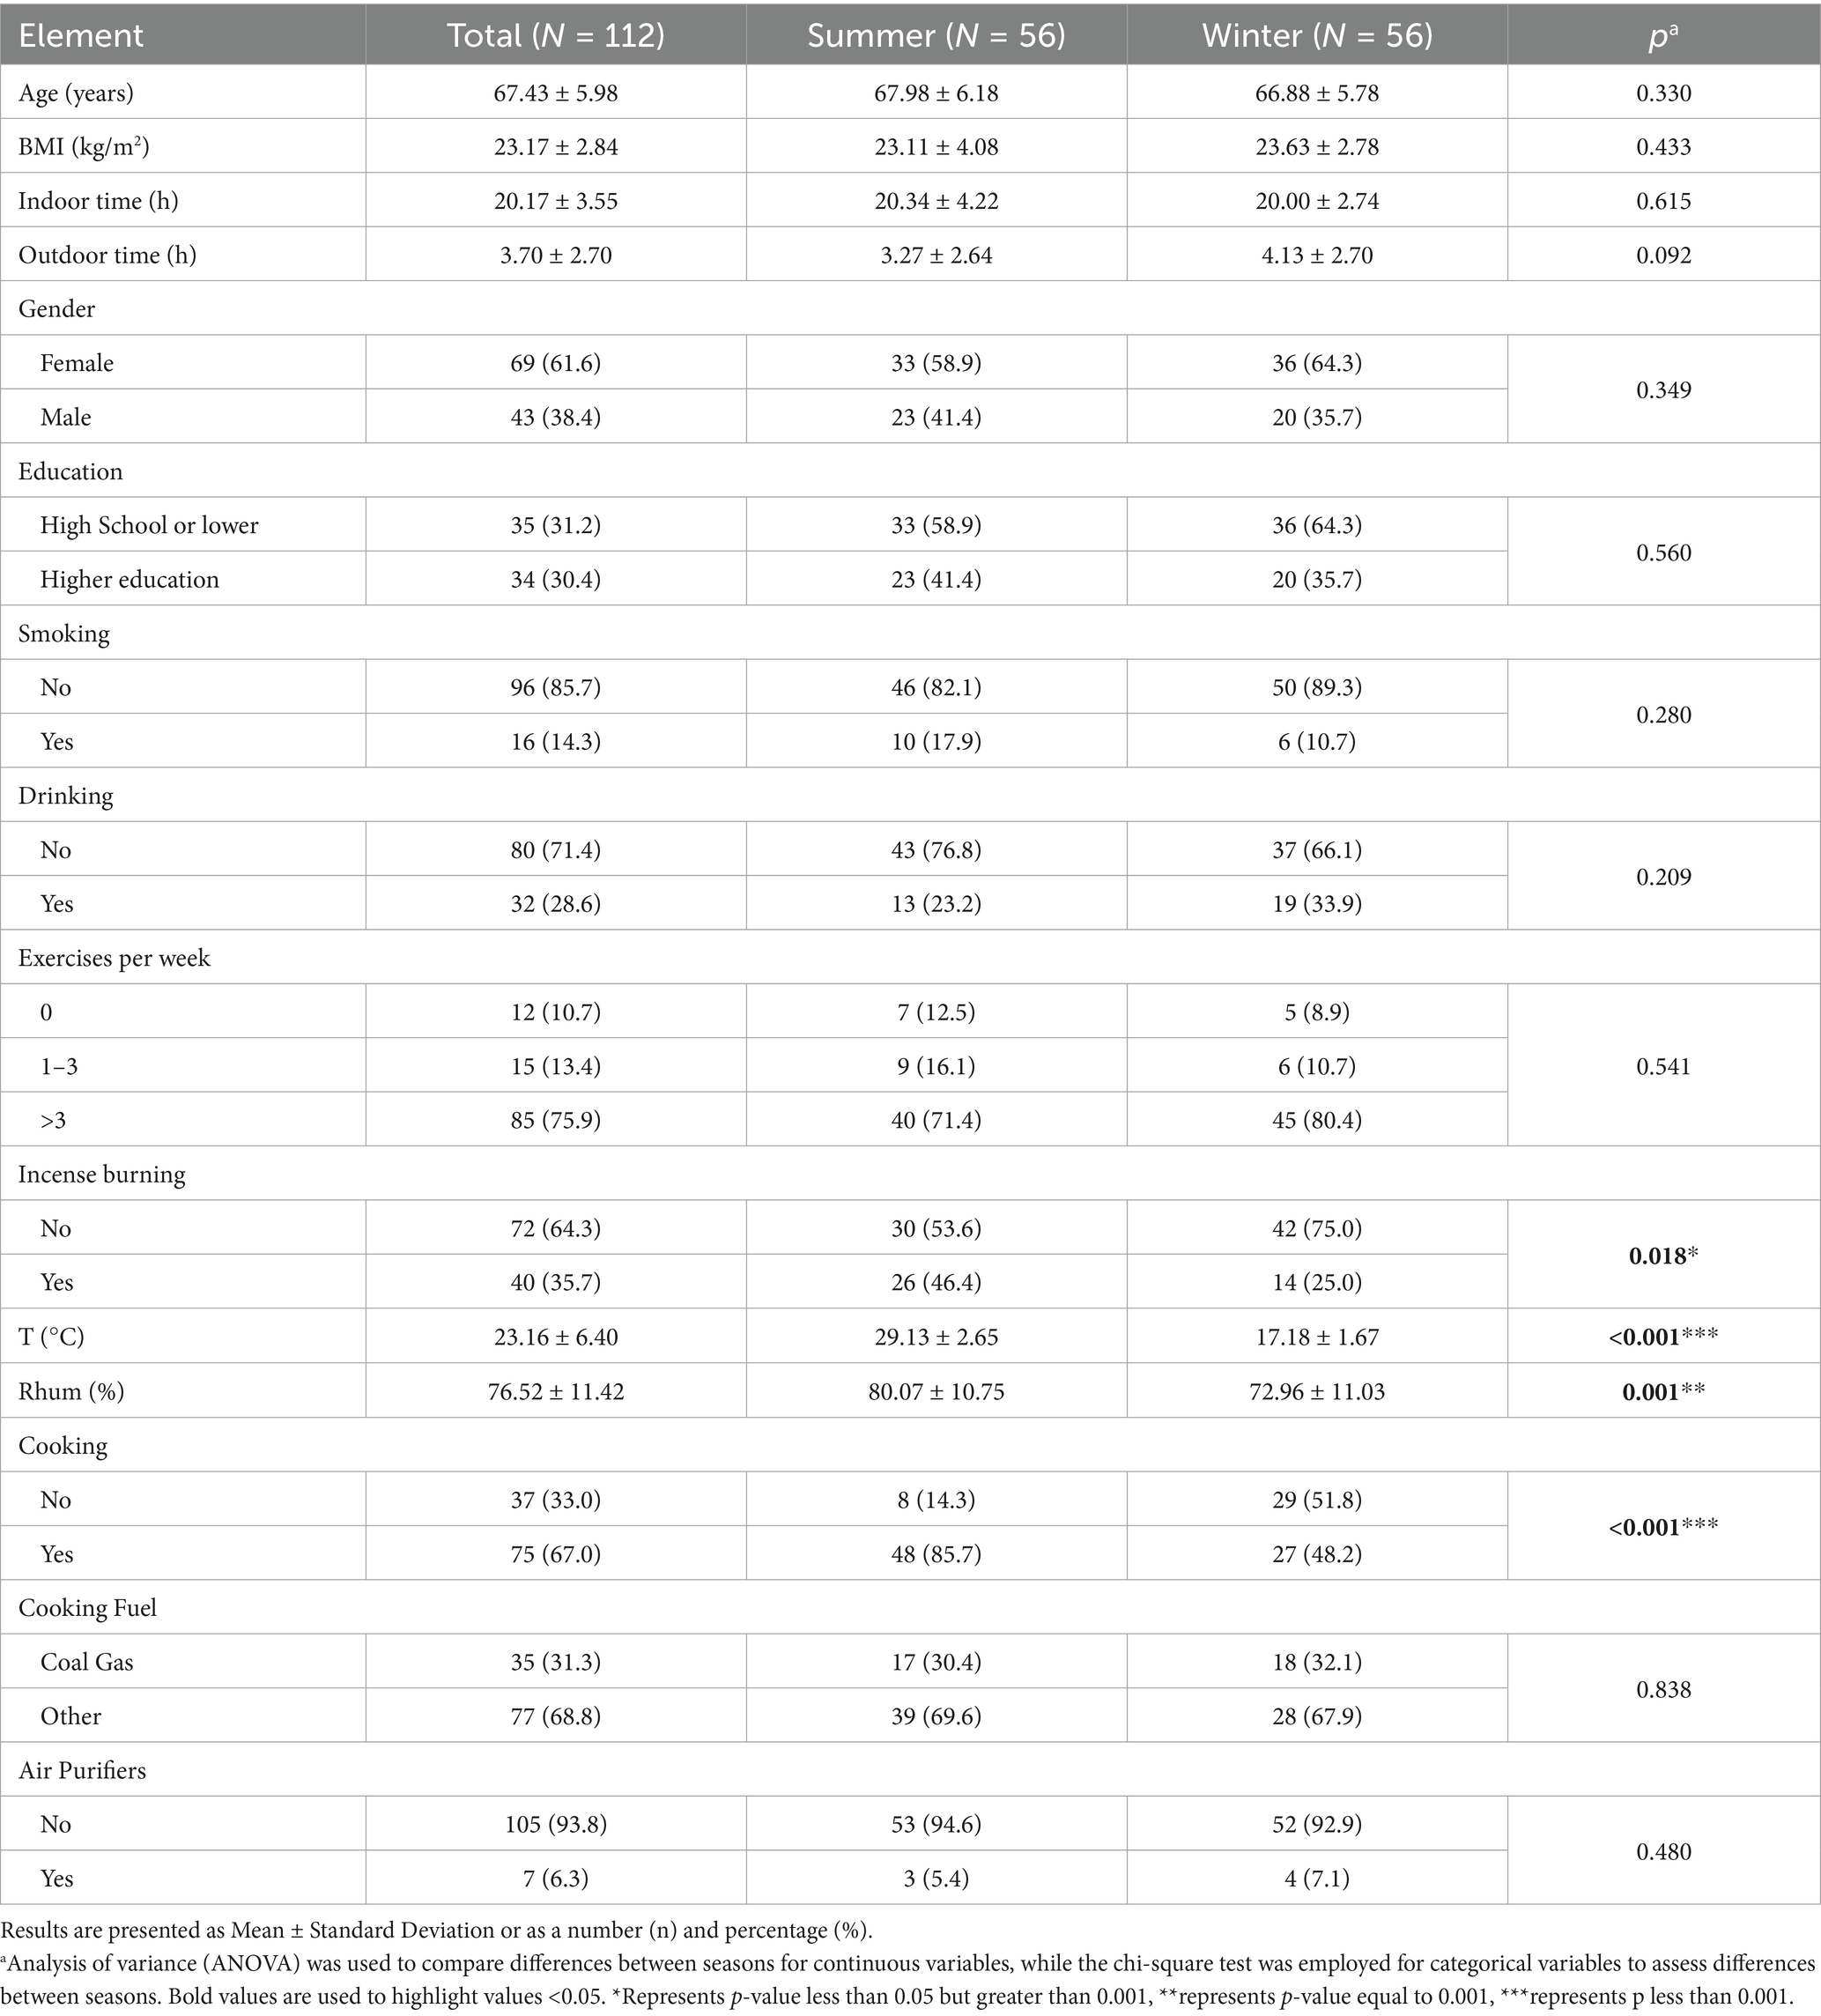
Table 1. Demographic characteristics of 112 participants.
3.2 The distributions of personal PM2.5 and PM2.5-bound PAHs
The median PM2.5 concentration across all observations was recorded at 69.4 ± 29.4 μg/m3. Summer and winter concentrations measuring at 75.1 ± 26.8 μg/m3 and 63.7 ± 30.9 μg/m3, respectively (Figure 1a). The distribution of the 14 PAHs is depicted in Figure 1b, and we have observed that the low molecular weight PAHs consisting of two and three rings account for the majority of PAHs at 14.215 ng/m3 (61%), and 5.581 ng/m3 (24%), respectively, while the high molecular weight PAHs with four to six rings only constitute 3.344 ng/m3 (15%). We also found significant differences in the concentration and composition of PM2.5-bound PAHs to which individuals were exposed in summer and winter (Table 2). From Figures 1c,d, we can see that there are significant differences in the composition of PAHs in different seasons. HMW PAHs show a more pronounced accumulation in winter, while low molecular weight PAHs account for a larger proportion in both summer and winter. This may be associated with the inherent temperature and humidity differences of the seasons, changes in behavior patterns brought about by the seasons, and the cooking conditions and energy sources of the subjects under study.
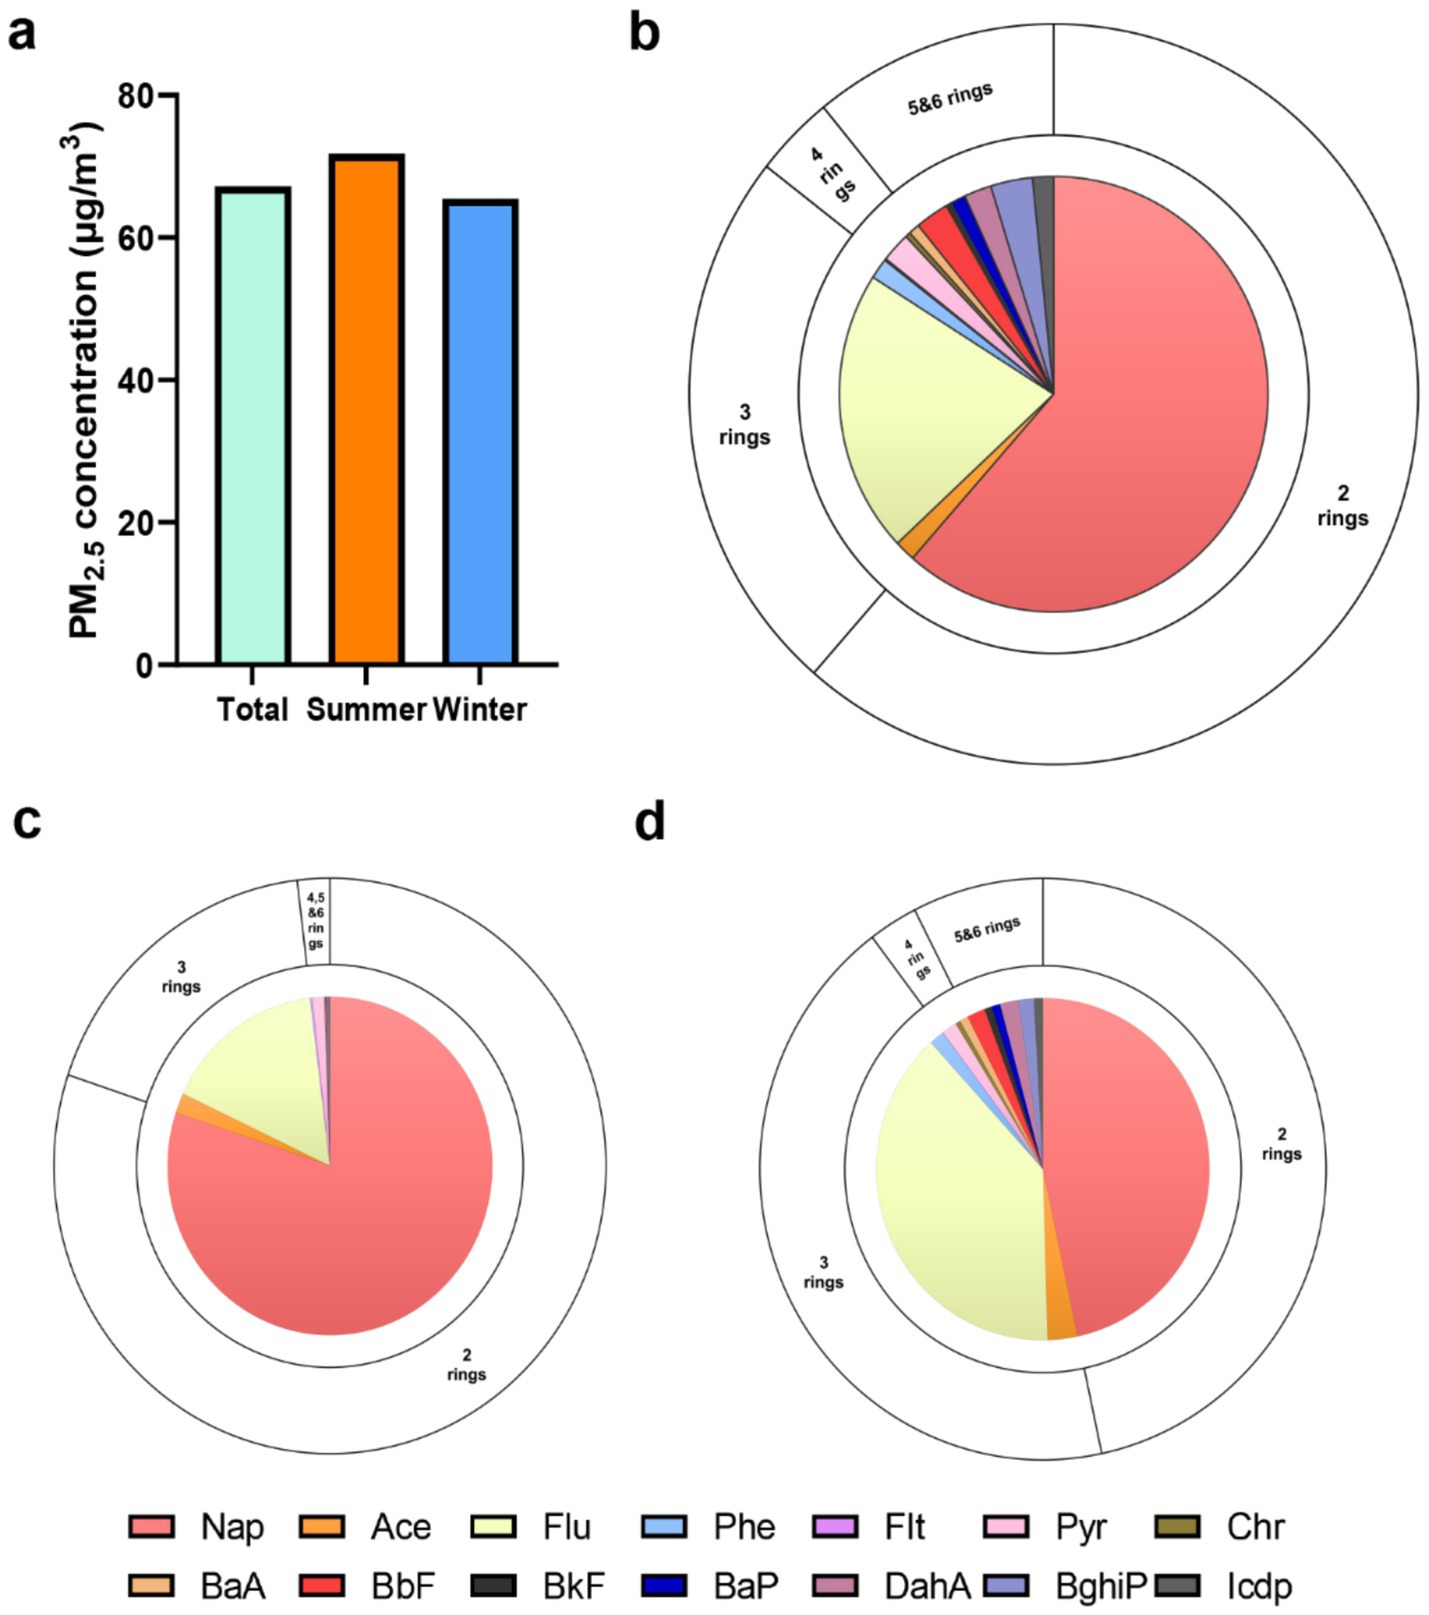
Figure 1. Descriptive distribution of the personal PM2.5 and PM2.5-bound PAHs. (a) The concentrations of personal PM2.5 in total visit, summer and winter. The concentrations and compositional distribution of PM2.5-bound PAHs in total visit (b), summer (c) and winter (d).
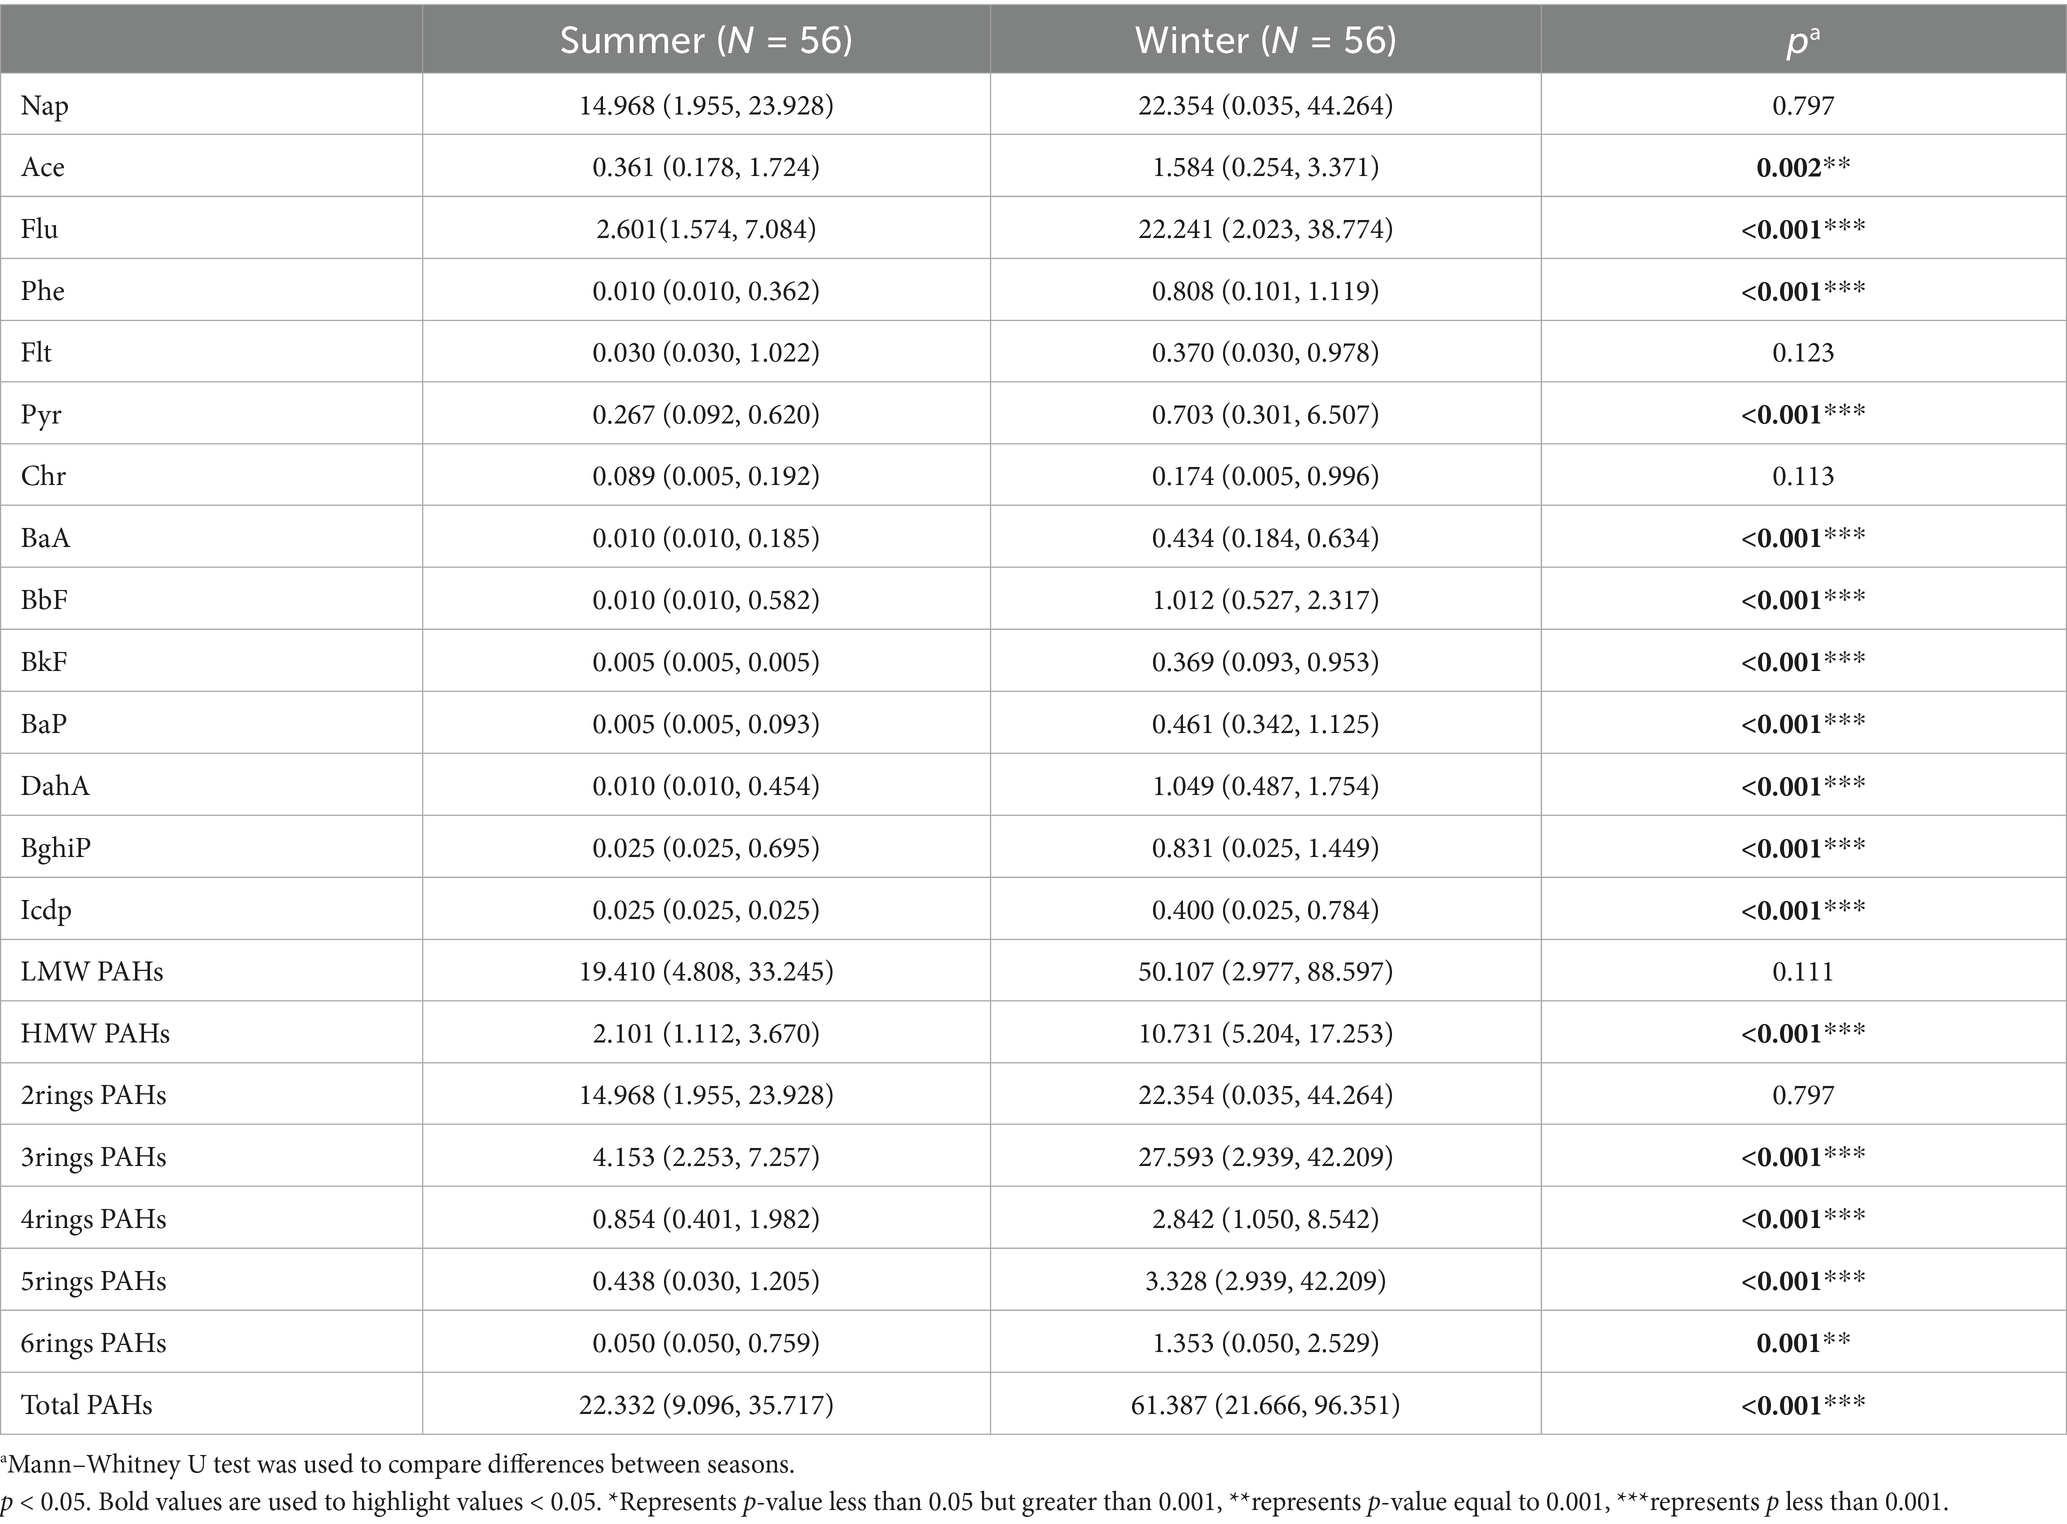
Table 2. Seasonal stratification results of individual PM2.5 bound PAHs.
3.3 Analysis of factors influencing personal PM2.5 and PM2.5-bound PAHs
Multiple linear regression modeling was conducted to investigate factors influencing individual-level PM2.5 and its bound PAHs. Using a stepwise method, variables with statistically significant differences (p < 0.05) were included in the model. The variables encompassed age, gender, BMI, daily time spent at home, ambient temperature and humidity, smoking status (yes vs. no), alcohol consumption (yes vs. no), cooking activity (yes vs. no), coal use (yes vs. no), air purifier usage (yes vs. no), indoor incense burning (yes vs. no), education level (above high school vs. high school or below), and dry cleaning frequency (more than twice weekly vs. twice or fewer weekly). All categorical variables were coded with the latter category as the reference group (Table 3). The study revealed that seasons significantly influence the composition of PM2.5-bound PAHs. Concentrations of all PAH types were higher in winter compared to summer, with particularly pronounced seasonal differences observed for 2–3 ring PAHs, which were elevated by 13.833 and 31.554 units, respectively. For 4–6 ring PAHs, the increases were 1.699, 3.347, and 1.797 units, respectively. These findings highlight seasonality as a critical factor affecting PAH levels in individual PM2.5 exposure. Additionally, individual PM2.5 exposure levels showed positive and significant associations with temperature, summer season, and cleaning frequency (more than twice weekly). Specifically, higher PM2.5 levels were observed in summer than in winter, and individuals performing dry cleaning more than twice weekly exhibited elevated PM2.5 exposure. Notably, older adults engaged in kitchen cooking demonstrated increased concentrations of 2–3 ring PAHs (β = 21.662 and 24.986, respectively), while their exposure to 4–5 ring PAHs decreased (β = −3.397 and −1.328). No significant association was found with 6-ring PAHs.
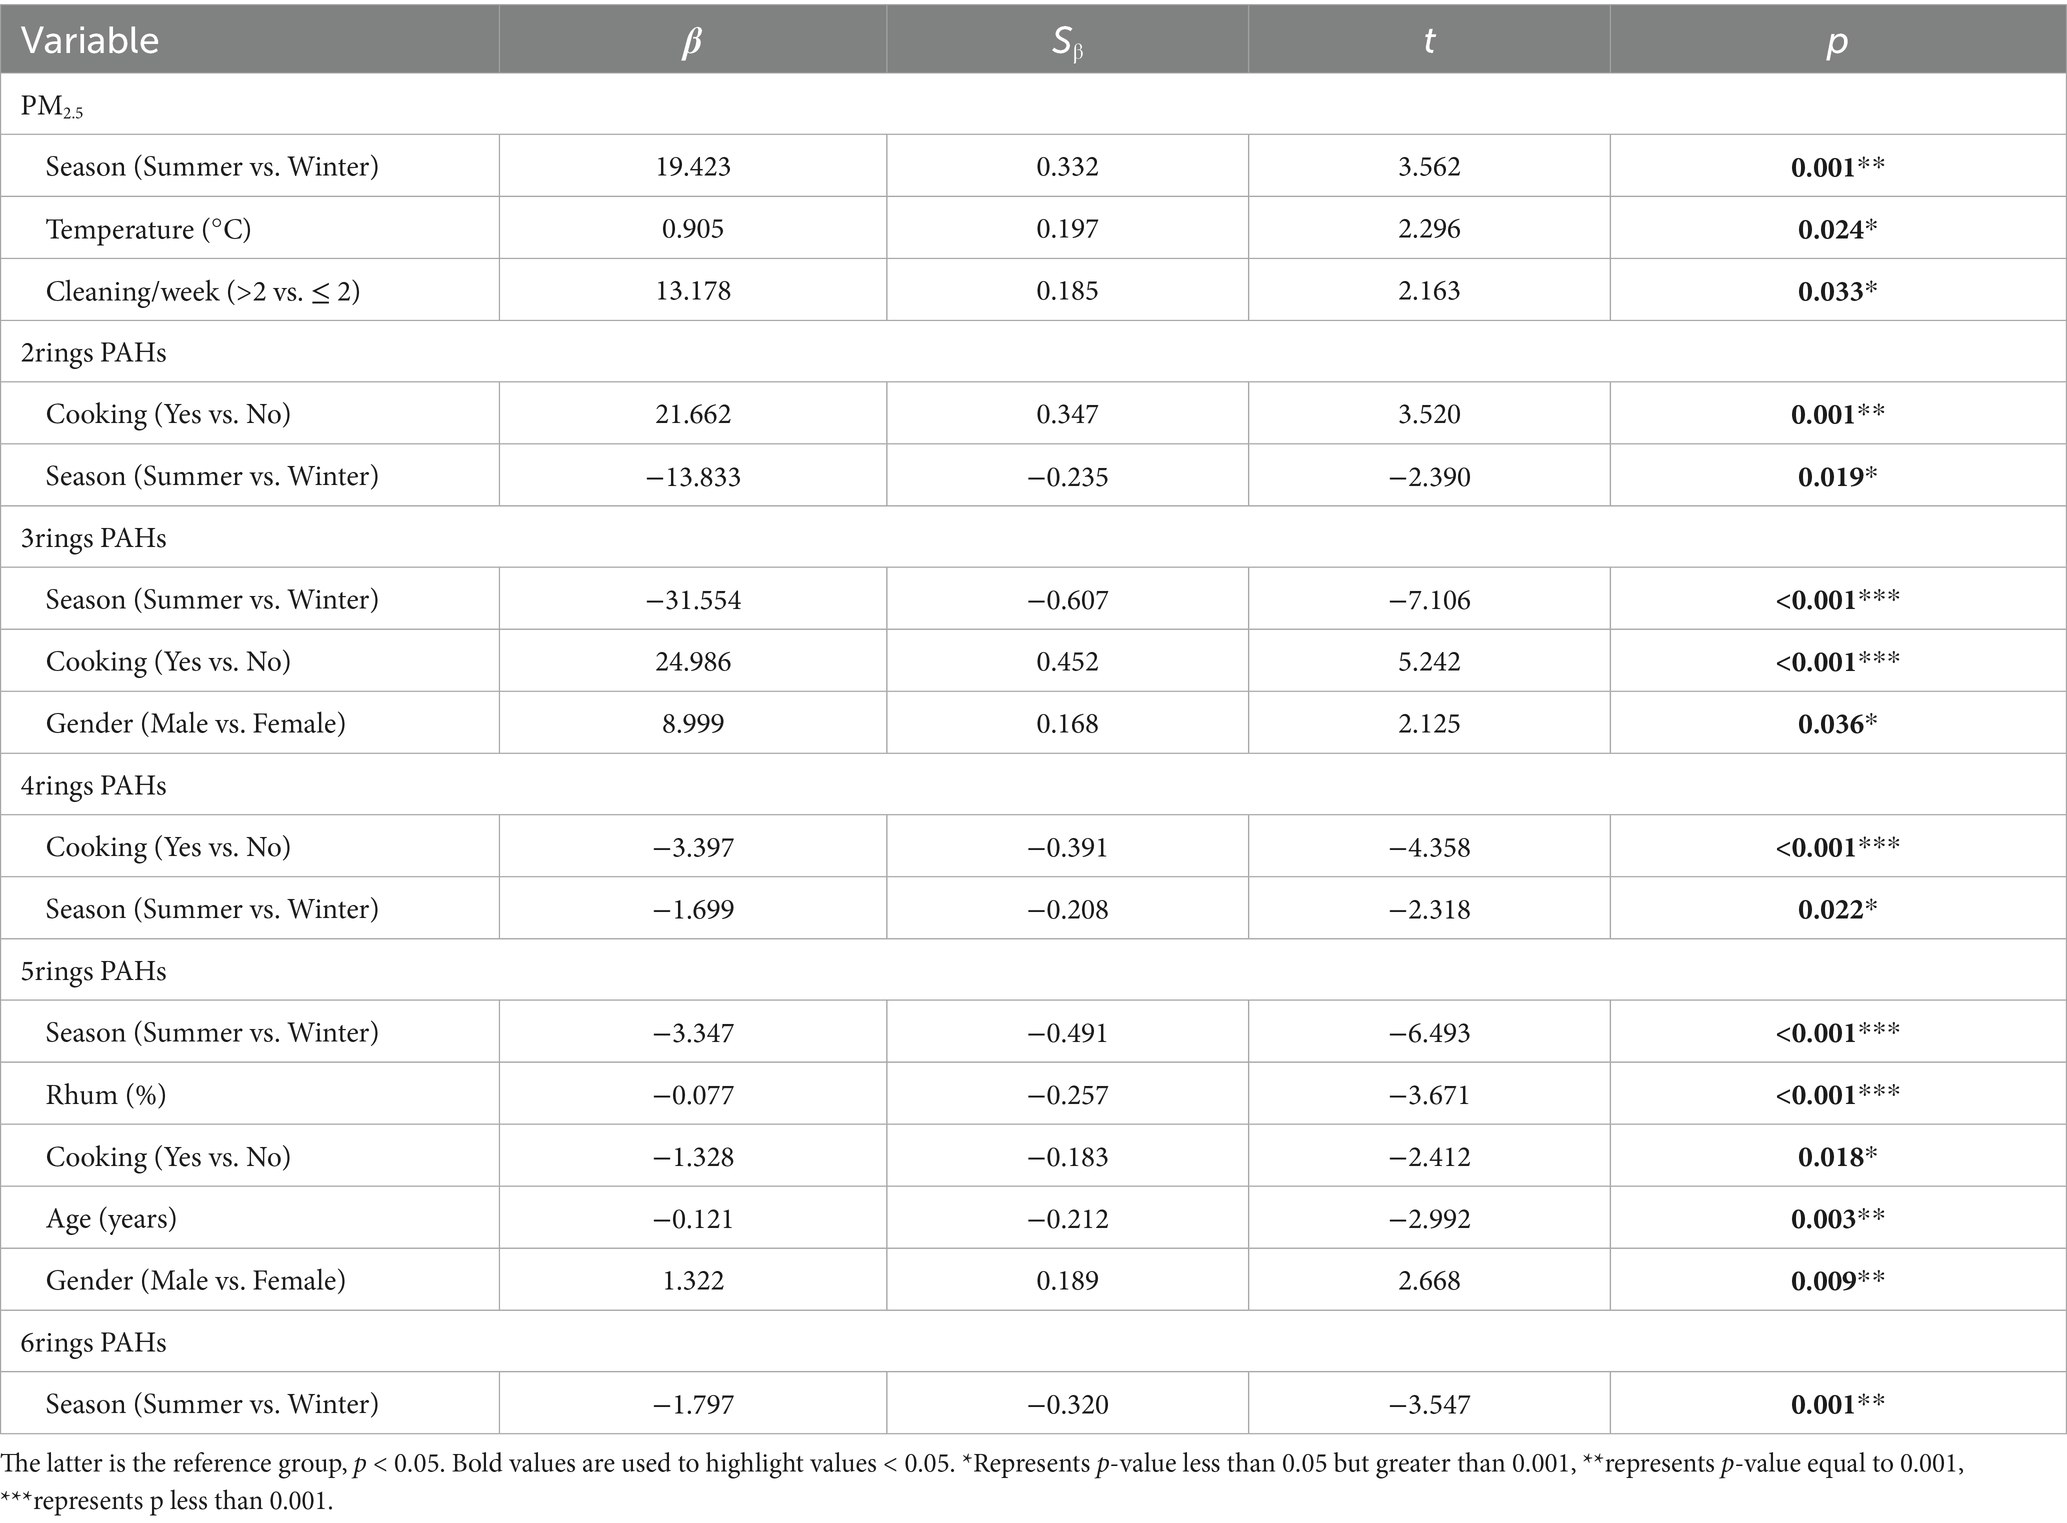
Table 3. The multivariate regression analysis of the impact on individual PM2.5 and PAHs component exposure levels.
3.4 Metabolic dysfunction in older adults identifies molecular signatures and pathways linked to PM2.5-bound PAHs
3.4.1 Differential metabolite screening
As a first step, we examined the association between plasma metabolites and concentration of 14 PAHs in 112 samples. The numbers and directions of the associations between the PAHs are presented in Figure 2 (Red dots indicate positively correlated metabolites, blue indicates negatively correlated metabolites, and gray indicates no significant metabolites). This study found that the number of metabolites associated with different PAHs varies, with 4-5-ring PAHs generally affecting the most metabolites, especially chr; while 2–3 ring and 6-ring PAHs have fewer plasma metabolites affected. The specific list of metabolites and statistical data for the 14 PAHs can be found in the attached table.
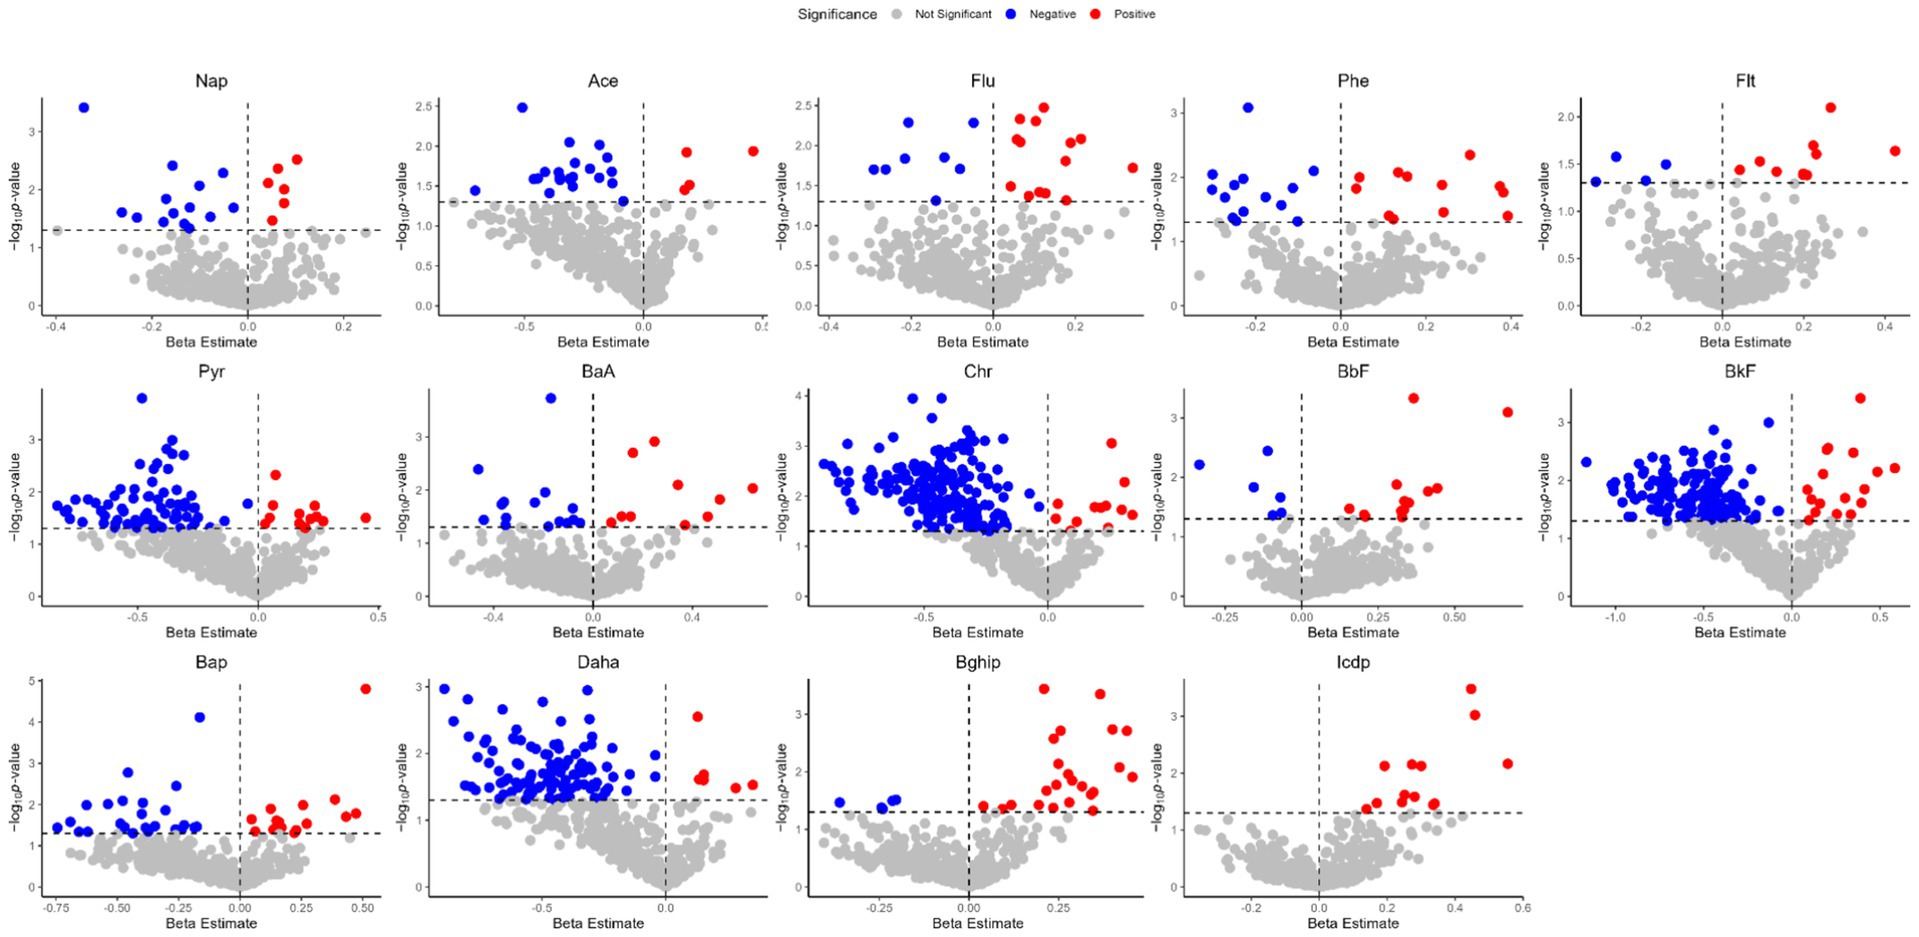
Figure 2. Volcano plots of the beta estimates of the PM2.5-bound PAHs vs. the p values in the associations of the exposure–plasma metabolome in total visit (p < 0.05).
3.4.2 Metabolite pathway enrichment analysis
We next searched for the most significant metabolic pathways affected by PM2.5-bound PAHs through pathways enrichment analysis. The enrichment method is used by hypergeometric test while the topology analysis is used by relative-betweenness centrality. Enrichment analysis exhibited that the disturbed metabolites in plasma take part in kinds of biological pathways. Generally, a higher enrichment factor indicates stronger enrichment efficacy and greater importance of the metabolic pathway (Figure 3). We found impacts on metabolic pathways in 9 types of PAHs, including but not limited to amino acid metabolism, energy metabolism, carbohydrate metabolism and lipid metabolism. However, no enriched metabolic pathways were found for Daha, Nap, BaA, Flu and Flt PAHs. Our study further revealed that metabolites associated with PM₂.₅-bound PAH exposure were significantly enriched in bile acid metabolism and glutathione metabolism pathways. These findings indicate that PAH components may contribute to PM₂.₅-induced hepatic injury by disrupting amino acid metabolism and interfering with bile acid synthesis (Table 4). We generated heatmaps of the metabolic pathways of PAHs with different ring numbers, and the results suggest that the cholesterol and citric acid metabolites, as well as the cholesterol biosynthesis and citric acid cycle pathways they affect, may play important roles in the health damage caused by PAHs. The pathways with upstream-downstream relationships can be mainly divided into two parts: one includes cholesterol biosynthesis, cholesteryl hormone biosynthesis, and primary bile acid biosynthesis pathways; the other consists of pyrimidine metabolism, citric acid cycle, and unsaturated fatty acid biosynthesis pathways (Figure 4). To further clarify the effects of different PAHs on metabolites and metabolic pathways, differences in metabolic pathways affected by high molecular weight and low molecular weight PAHs were explored, and we found that exposure to LMW PAHs in PM2.5 were correlated with amino acid metabolic pathways, while HMW-PAHs are associated with fatty acid and cholesterol metabolism pathways (Figure 5a).
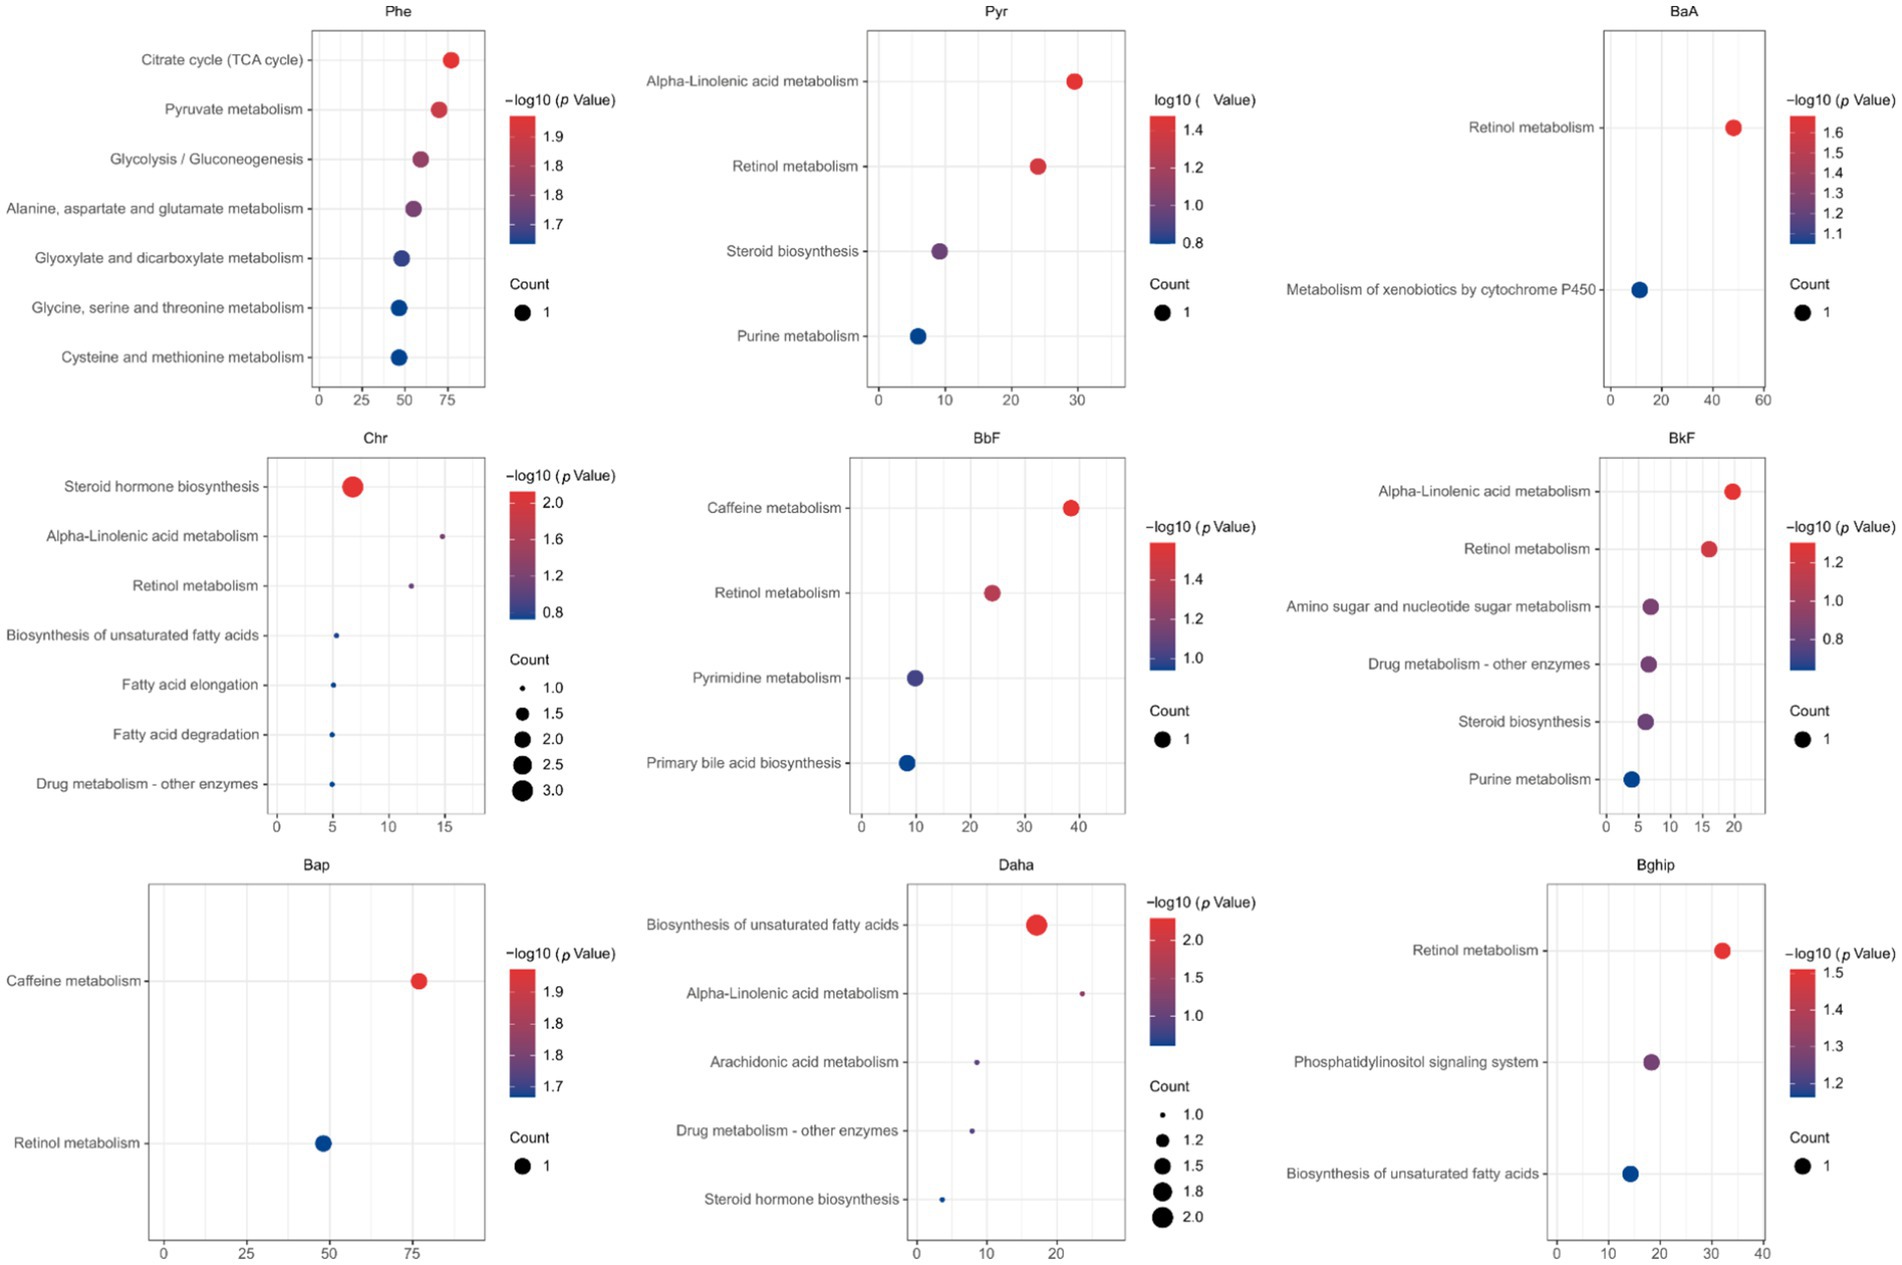
Figure 3. The bubble chart shows the results of the matched pathways enriched by the KEGG library according to p-values from pathway enrichment analysis and pathway impact values (x-axis) from pathway topology analysis (p < 0.05).

Table 4. Metabolic enrichment pathways related to PAHs exposure.
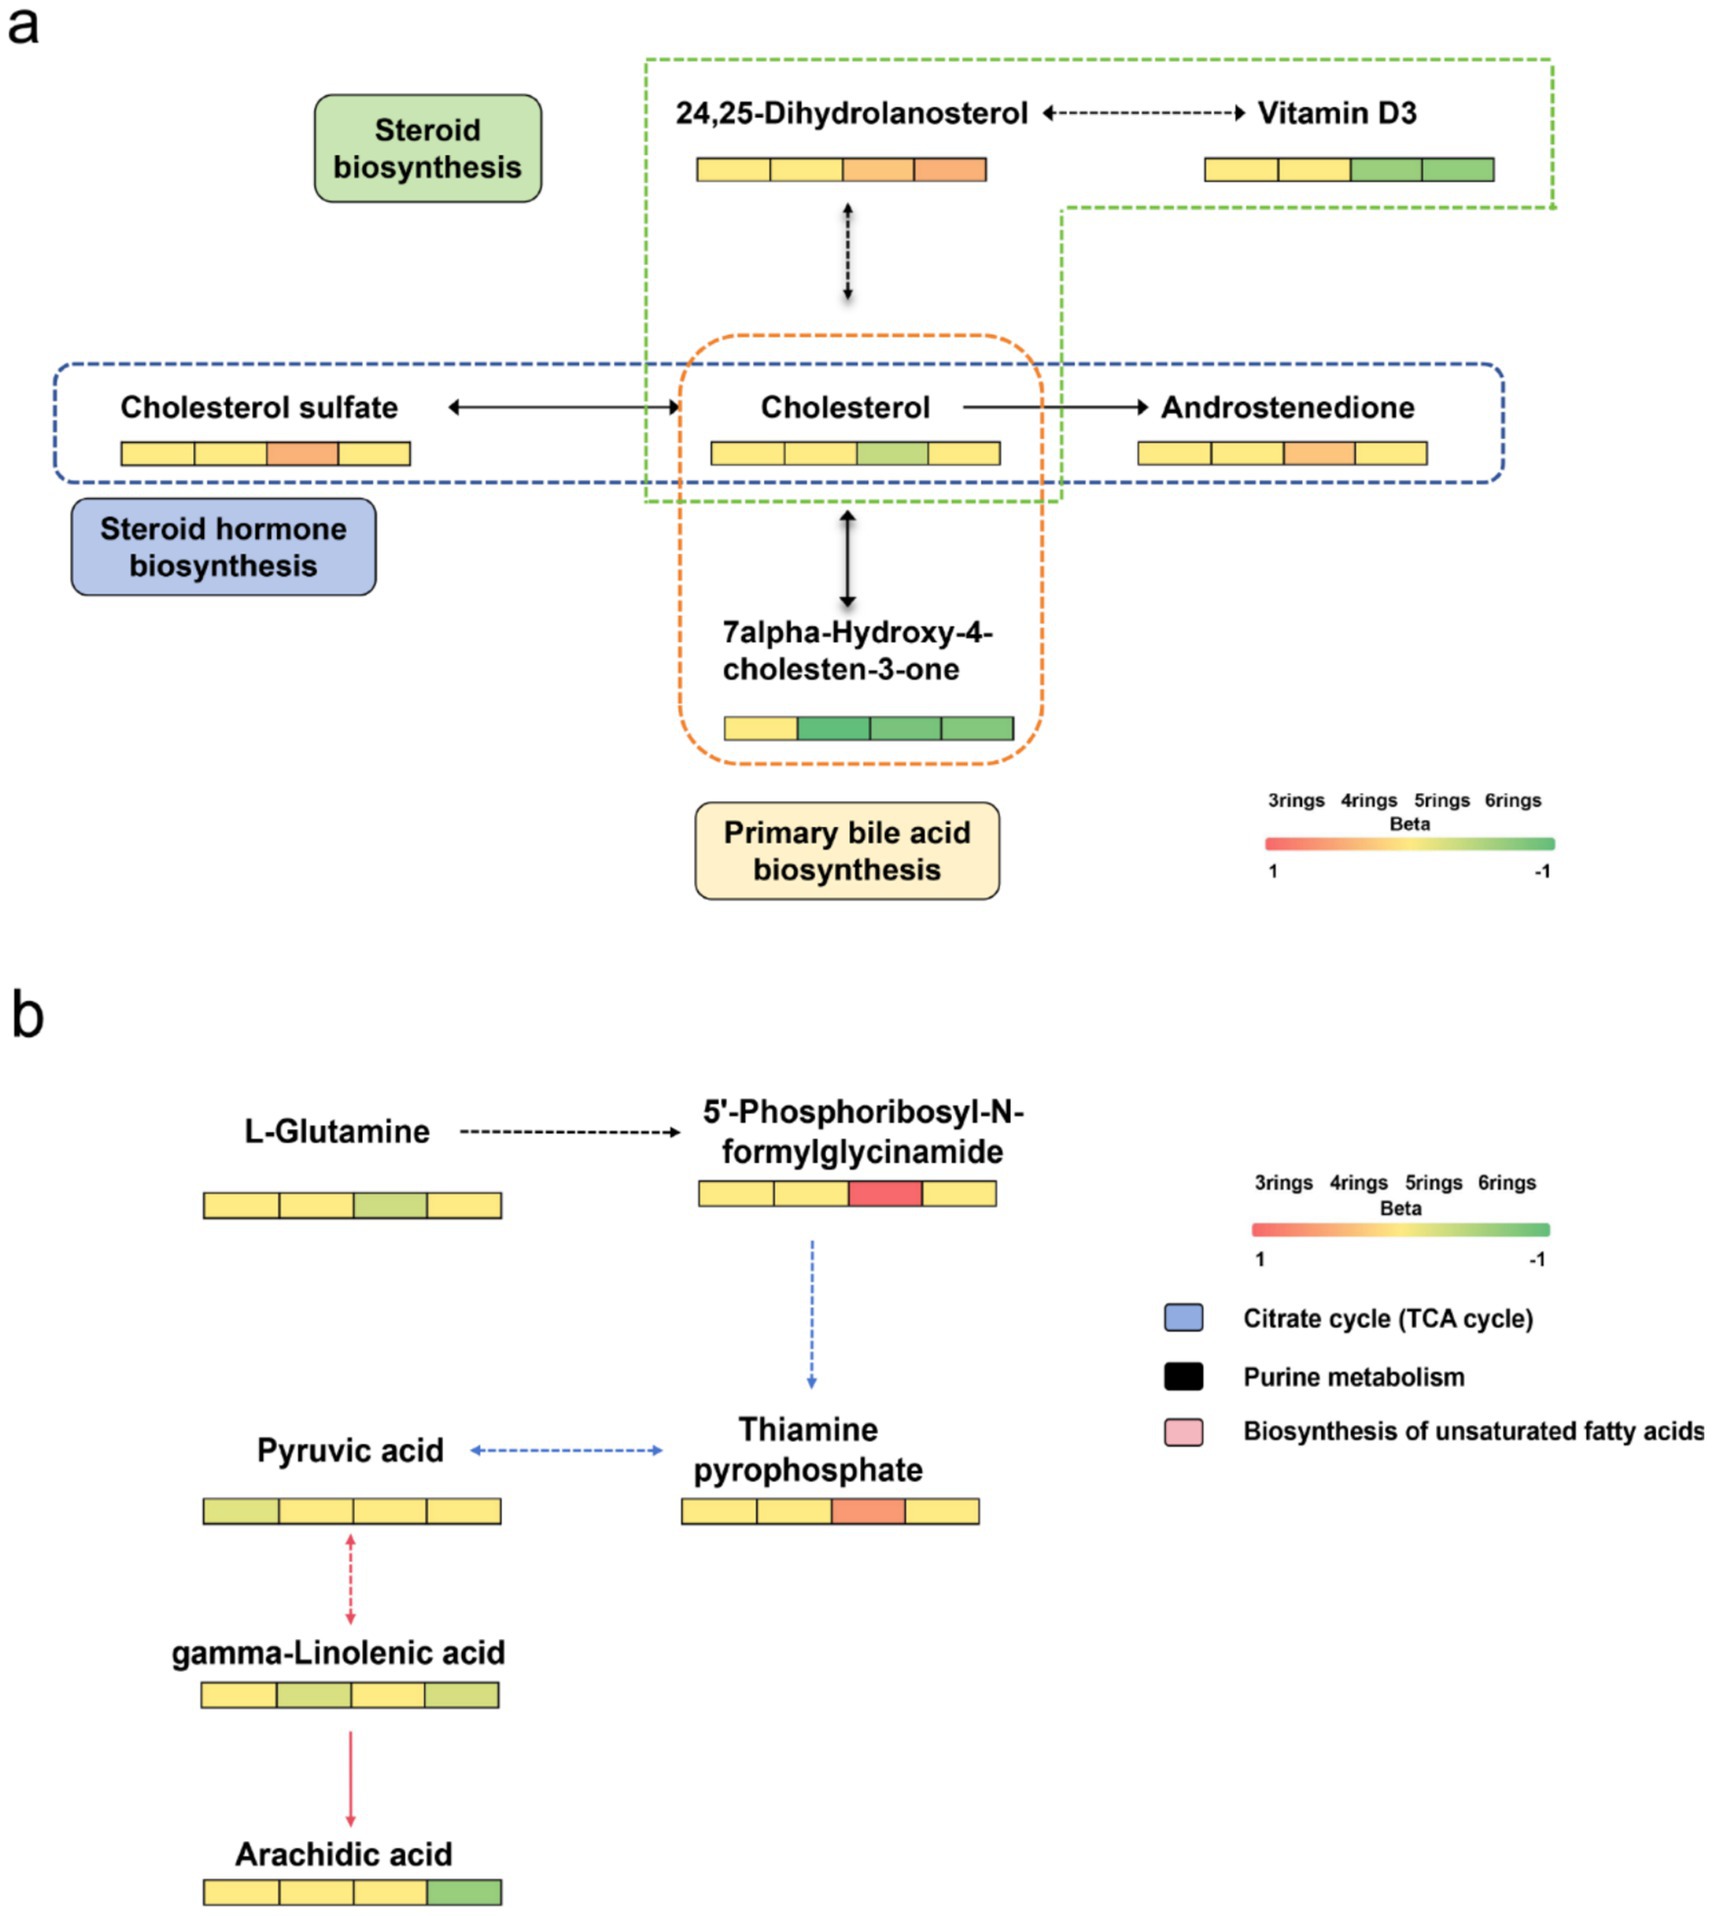
Figure 4. Heatmap of differential metabolic pathways for PAHs carried by PM2.5. (a) Metabolites involved in pathways of cholesterol biosynthesis, cholesterol hormone biosynthesis, and primary bile acid synthesis. (b) Metabolites involved in pathways of pyrimidine metabolism, citrate cycle, and unsaturated fatty acid biosynthesis.
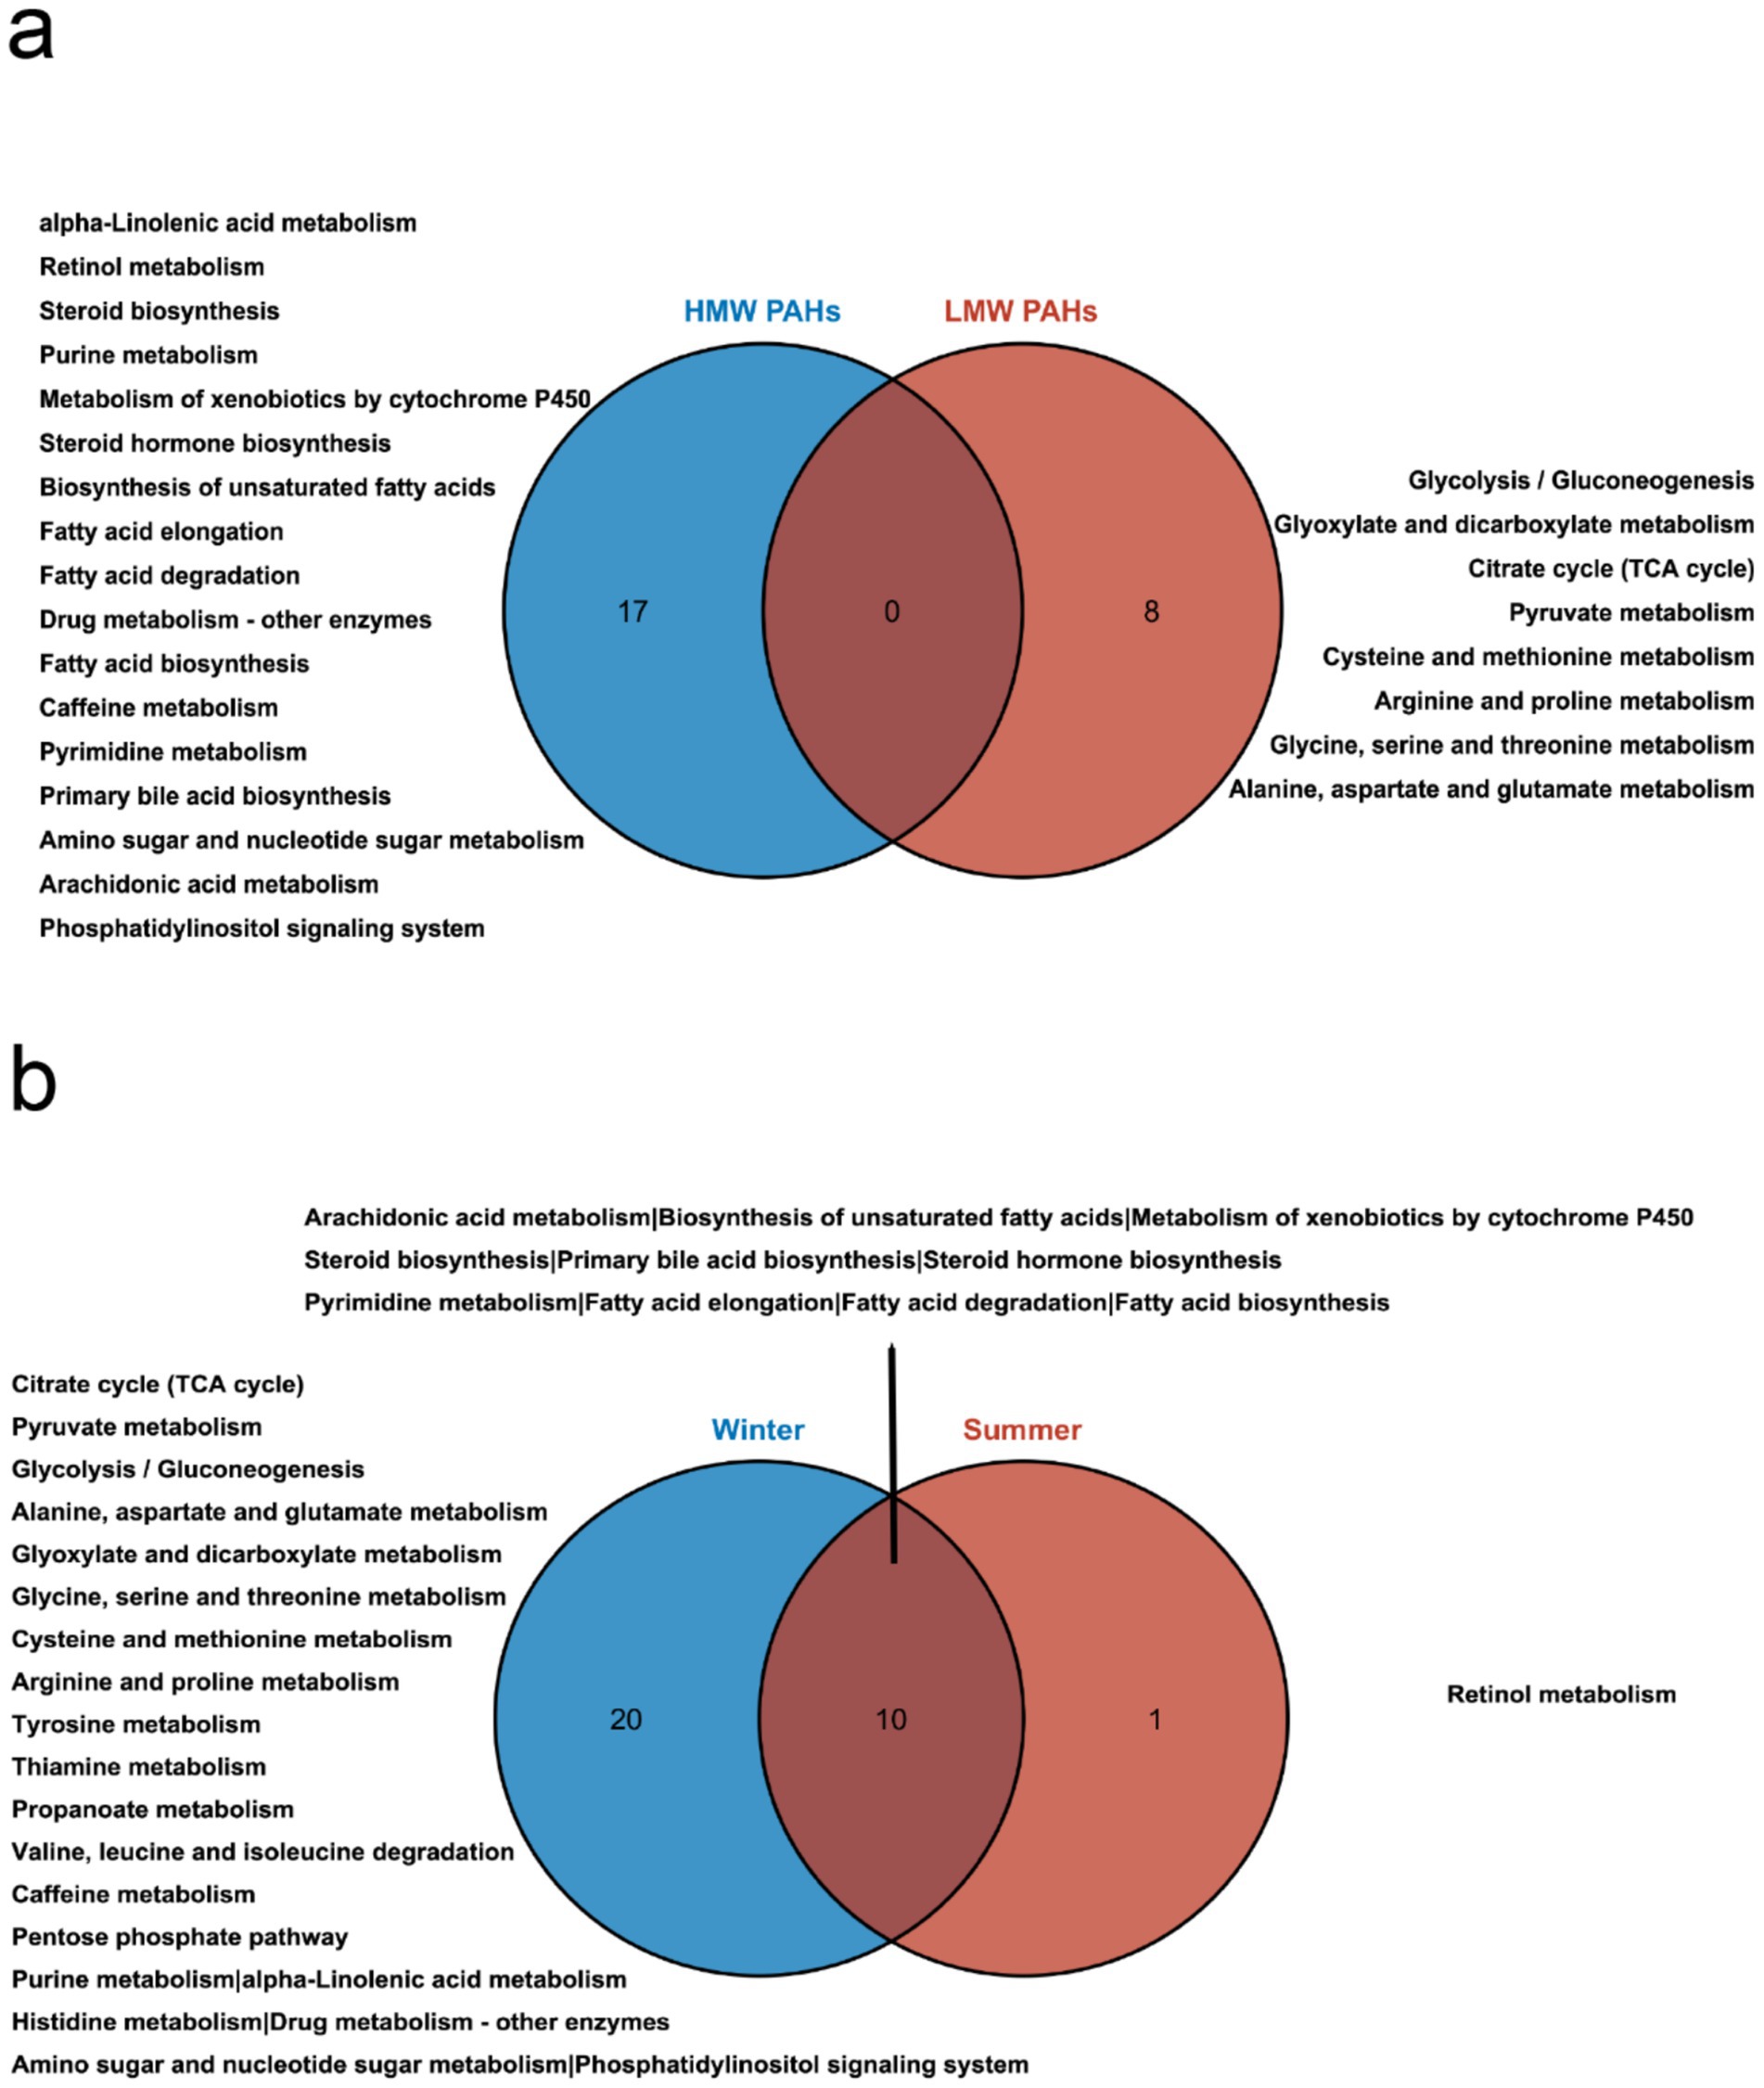
Figure 5. Comparative analysis of metabolic pathways influenced by PAHs in PM2.5. (a) Venn diagram illustrating the differential pathways influenced by high molecular weight and low molecular weight PAHs. (b) Venn diagram depicting the differences in pathways influenced by PAHs in summer and winter.
Due to significant variations in the composition and concentration of PAHs across different seasons, we further conducted a subgroup analysis based on seasons to uncover differences in the effects of PAHs on metabolites across different seasons. To further explore the type of biological responses induced by PM2.5 samples collected in different seasons, we compared the metabolic pathways in summer and winter (Figure 5b). The results revealed that PAHs had a broader and stronger impact on pathways during the winter season. Both seasons exhibited effects on cholesterol and fatty acid metabolism pathways. Unique metabolic pathways during the summer season included retinol metabolism. In contrast, the winter season predominantly featured pathways related to carbohydrate metabolism, amino acid metabolism, and energy metabolism.
4 Discussion
In this study conducted among older adults in Fuzhou, significant differences in plasma metabolic profiles over short-term exposure to PM2.5-bound PAHs were observed. The significantly altered metabolites were involved in metabolic pathways such as amino acid metabolism, energy metabolism, carbohydrate metabolism and lipid metabolism. To the best of our knowledge, this study firstly clarified the metabolic changes in plasma of individuals exposed to PAHs based on untargeted metabolomic approach in conjunction with the older adult study.
It has been well-recognized that different emission resources result in different types of atmospheric PAHs. Considering the differential health effects of various types of PAHs, we investigated their unique mechanisms of action based on molecular weight. LMW-PAHs most often come from natural resources (petrogenic) and HMW-PAHs often originate from combustion (pyrolytic), such as vehicle exhausts, wood combustion, oil burning (10, 11). This study elucidates that distinct categories of PAH mixtures induce significant, yet differential alterations in metabolic pathways. We observed that Nap and Flu were the most abundant compounds in the total PAHs. Despite their higher concentrations, compared to other high molecular weight PAHs, their impact on metabolic pathways is relatively minor. Among the LMW PAHs, only Phe was identified to be enriched in metabolic pathways implicated in glutathione metabolism, energy metabolism, and carbohydrate metabolism. This observation aligns with the findings of Jiang et al. (34). Glutathione, known for its role in regulating the oxidative-reductive state, is considered integral to the biological effects of Phe exposure due to its impact on antioxidant status. The citric acid cycle, the final common oxidative pathway for carbohydrates, fats, and amino acids, is pivotal for energy supply to the body. The Tricarboxylic Acid (TCA) cycle serves as a central pathway, connecting nearly all individual metabolic pathways (35). Citrate, an endogenous metabolite generated from glucose metabolism and fatty acid, is regulated by glucose levels and insulin (36). The TCA cycle and pyruvate metabolism are implicated in the pathogenesis of diabetes (37, 38), and citrate has been associated with kidney injury (39). Thus, PAHs may exacerbate kidney injury and diabetes by influencing energy and carbohydrate metabolism. Intriguingly, exposure to HMW PAHs significantly altered lipid metabolism, including fatty acid, alpha-linolenic acid metabolism, arachidonic acid metabolism, and cholesterol metabolism pathways. Several studies have demonstrated that lipid peroxidation and lipid-related dysfunctions are induced by PAH exposure in humans (40–42). Certain unsaturated fatty acids, such as linoleic acid, are reported to regulate host metabolism and possess anticarcinogenic properties (43). Moreover, the metabolism of arachidonic acid is believed to significantly influence the onset and progression of liver cancer (44). Schulze et al. (45) reported that free fatty acids are involved in energy generation, and up-regulation of cardiac lipid metabolism occurs during heart failure. Bile acids, critical signaling molecules that control hepatocellular function, and glutathione, an important antioxidant that protects the liver against oxidative injury, are also implicated (46, 47). Some research suggests that LysoPCs and LysoPEs play critical roles in PM exposure, potentially leading to vascular endothelial dysfunction. LysoPC (48) and LysoPE (49) are considered potential biomarkers for cardiovascular diseases (50, 51). However, the specific mechanism of lipid metabolism disturbance following PM2.5 exposure remains to be explored. PM2.5 can damage the cardiovascular system through mechanisms such as oxidative stress and inflammatory responses, and impair glucose homeostasis by affecting insulin response in the liver and adipose tissue (52). This subsequently leads to dysfunction in lipid metabolism (53, 54). Therefore, adverse lipid metabolism and lipid oxidation induced by inflammation may represent a potential mechanistic link between air pollution and dysregulated lipid levels (55, 56). This study hypothesizes that PM2.5 pollutants may influence the onset and progression of diabetes and cardiovascular diseases through the aforementioned metabolic pathways. This study also found that the metabolic pathways affected by PM2.5-bound PAHs encompass amino acid metabolism, carbohydrate metabolism, energy metabolism, and lipid-related metabolic processes. Specifically, they impact unsaturated fatty acid metabolism, cholesterol-related metabolic pathways, and upstream/downstream metabolites of the citrate cycle. Two longitudinal studies have identified a significant association between PAHs in PM2.5 and blood lipid profiles (10, 11). PAHs may contribute to PM2.5-induced liver damage by affecting amino acid metabolism and bile acid synthesis. In this study, we discovered that PM2.5-bound HMW PAHs interfere with lipid metabolism by mediating biosynthetic pathways related to fatty acids, steroids, bile acids, linoleic acid, and arachidonic acid. This further implicates their involvement in the alteration of lipid profiles and pathogenic processes associated with PM2.5 exposure. A metabolomic study on mice (50) exposure to PM2.5 and another study on rats (57) both observed the significant alterations of amino acid metabolism, lipid metabolism and glucose metabolism, consistent with the current research. These findings underscore the complex dynamics of PM2.5-bound PAHs and their potential health implications.
In this study, we further stratified the data by season to investigate the effects of seasonal pollutants on plasma metabolites and potential biological mechanisms. A total of 21 metabolic pathways were identified to exhibit differential expression between summer and winter. Notably, PAHs in winter induced a greater number of metabolic pathways, leading to more potent biological effects. Our results revealed that PM2.5 pollution in winter was more toxic than in summer, consistent with the levels of air pollution. A pivotal finding from our analyses was the identification of several biological pathways associated with elevated air pollution. Many of these identified pathways could precipitate subsequent consequences such as oxidative stress and inflammation, and are also implicated in coronary artery disease and atherosclerosis, as well as major adverse cardiovascular events, including myocardial infarction, stroke, and even death. These findings underscore the complex dynamics of seasonal air pollution and its potential health implications.
The strength of this study lies in its use of a community-based air pollution monitoring project involving older adults. This approach allowed for an exploration and correlation analysis of short-term exposure to PM2.5-bound PAHs with plasma metabolites. Another notable strength is the accurate assessment of an individual’s actual exposure using a personal exposure sampler. In epidemiological studies on air pollution, personal monitoring is deemed the gold standard for measuring actual individual exposure. However, there are some shortcomings: due to high costs and significant participant burden, personal monitoring is less frequently employed; emphasizes the limited sample scope (single community, small older adult cohort) and its potential geographical bias; Highlights the diverse pollution sources of PAHs bound to PM2.5 and their impact on exposure assessment accuracy. This study allows for a more accurate understanding of exposure through individual air monitoring in the older adult sensitive population, and enables a more meticulous establishment of biological connections.
Looking ahead, further validation of these results can be achieved by increasing the sample size and extending the study duration. Future investigations will necessitate the assessment of the toxicological significance of these pathways by establishing their specific associations with injury. Given that many oxidation and nitration products of polycyclic aromatic hydrocarbons are considered harmful to the human body, additional research could explore the health effects of other byproducts, apart from the parent compounds. These considerations provide a roadmap for future research, underscoring the importance of continued exploration in this critical area of public health.
5 Conclusion
The metabolomic signatures discerned in this study could potentially elucidate the effects of PM2.5-bound PAHs on energy metabolism, carbohydrate metabolism, and lipid metabolism disruption. The findings of this investigation indicate that different components of PAHs influence health outcomes in varying ways and provide potential mechanisms underlying the pathogenic processes of PAHs in PM2.5. The identified biomarker panels and metabolic pathways could serve as preventive targets for addressing diseases associated with PM2.5-bound PAHs exposure. These insights offer a novel perspective on understanding the health implications of PM2.5 pollution on susceptible older adult populations, providing potential biological underpinnings. This not only enriches our knowledge in this field but also paves the way for future research.
Data availability statement
The original contributions presented in the study are included in the article/Supplementary material, further inquiries can be directed to the corresponding authors.
Ethics statement
The studies involving humans and animals were approved by Ethics Committee of Fuzhou Center for Disease Control and Prevention (no. 2021004). The studies were conducted in accordance with the local legislation and institutional requirements. The participants provided their written informed consent to participate in this study.
Author contributions
HH: Writing – original draft. QZ: Data curation, Methodology, Writing – review & editing. KC: Investigation, Writing – review & editing. YJ: Project administration, Writing – review & editing. JX: Visualization, Writing – review & editing. JW: Project administration, Writing – review & editing. JL: Supervision, Writing – review & editing. ZC: Funding acquisition, Writing – review & editing. SK: Funding acquisition, Writing – review & editing. DZ: Funding acquisition, Writing – review & editing. HL: Supervision, Writing – review & editing. CW: Writing – review & editing.
Funding
The author(s) declare that financial support was received for the research and/or publication of this article. This work was supported by the Major Scientific Research Project of Fujian Provincial Health Commission (grant number 2022ZD01001), the Major Scientific Research Project of Fujian Provincial Health Commission (grant number 2021ZD01001), Fujian Provincial Health Commission Science and Technology Program Project (grant number 2023QNA083), Fuzhou City Science and Technology Program Project (grant number2023-S-030), Undergraduate Innovation and Entrepreneurship Training Program Project at the College of Public Health, Fujian Medical University (grant number xy202410002) and Quanzhou Science and Technology Plan Project (grant number 2024NY095).
Conflict of interest
The authors declare that the research was conducted in the absence of any commercial or financial relationships that could be construed as a potential conflict of interest.
Generative AI statement
The authors declare that no Gen AI was used in the creation of this manuscript.
Publisher’s note
All claims expressed in this article are solely those of the authors and do not necessarily represent those of their affiliated organizations, or those of the publisher, the editors and the reviewers. Any product that may be evaluated in this article, or claim that may be made by its manufacturer, is not guaranteed or endorsed by the publisher.
Supplementary material
The Supplementary material for this article can be found online at: https://www.frontiersin.org/articles/10.3389/fpubh.2025.1609724/full#supplementary-material
References
1. Zhang, Q, Meng, X, Shi, S, Kan, L, Chen, R, and Kan, H. Overview of particulate air pollution and human health in China: evidence, challenges, and opportunities. Innovation. (2022) 3:100312. doi: 10.1016/j.xinn.2022.100312
2. Liu, Y, Tong, D, Cheng, J, Davis, SJ, Yu, S, Yarlagadda, B, et al. Role of climate goals and clean-air policies on reducing future air pollution deaths in China: a modelling study. Lancet Planet Health. (2022) 6:e92–9. doi: 10.1016/S2542-5196(21)00326-0
3. Shaddick, G, Thomas, ML, Mudu, P, Ruggeri, G, and Gumy, S. Half the world’s population are exposed to increasing air pollution. npj Clim Atmos Sci. (2020) 3:23. doi: 10.1038/s41612-020-0124-2
4. Song, Y, Zhang, Y, Li, R, Chen, W, Chung, CKA, and Cai, Z. The cellular effects of pm(2.5) collected in Chinese Taiyuan and Guangzhou and their associations with polycyclic aromatic hydrocarbons (Pahs), nitro-Pahs and hydroxy-Pahs. Ecotoxicol Environ Saf. (2020) 191:110225. doi: 10.1016/j.ecoenv.2020.110225
5. Stafoggia, M, Oftedal, B, Chen, J, Rodopoulou, S, Renzi, M, Atkinson, RW, et al. Long-term exposure to low ambient air pollution concentrations and mor tality among 28 million people: results from seven large European coho rts within the elapse project. Lancet Planet Health. (2022) 6:e9–e18. doi: 10.1016/S2542-5196(21)00277-1
6. Liu, C, Chen, R, Sera, F, Vicedo-Cabrera, AM, Guo, Y, Tong, S, et al. Ambient particulate air pollution and daily mortality in 652 cities. N Engl J Med. (2019) 381:705–15. doi: 10.1056/NEJMoa1817364
7. Kim, K-H, Jahan, SA, Kabir, E, and Brown, RJC. A review of airborne polycyclic aromatic hydrocarbons (Pahs) and their human health effects. Environ Int. (2013) 60:71–80. doi: 10.1016/j.envint.2013.07.019
8. IARC Working Group on the Evaluation of Carcinogenic Risks to Humans. Some traditional herbal medicines, some mycotoxins, naphthalene and styrene. IARC Monogr Eval Carcinog Risks Hum. (2002) 82:1–556.
9. IARC Working Group on the Evaluation of Carcinogenic Risks to Humans. Some non-heterocyclic polycyclic aromatic hydrocarbons and some related exposures. IARC Monogr Eval Carcinog Risks Hum. (2010) 92:1–853.
10. Ma, J, Xie, Y, Wang, B, Yang, S, Zhou, M, Wang, D, et al. Associations of personal Pm2.5 and Pm2.5-bound polycyclic aromatic hyd rocarbons exposure with blood lipid profiles: a panel study from middl e-aged Chinese adults. Atmos Environ. (2023) 293:119433. doi: 10.1016/j.atmosenv.2022.119433
11. Wang, X, Li, A, Zhao, M, Xu, J, Mei, Y, and Xu, Q. Multiple categories of polycyclic aromatic hydrocarbons in atmospheric Pm2.5 associated with changes in lipid profiles: a longitudinal study in Beijing. Atmos Environ. (2022) 275:119005. doi: 10.1016/j.atmosenv.2022.119005
12. Hu, W, Wang, Y, Wang, T, Ji, Q, Jia, Q, Meng, T, et al. Ambient particulate matter compositions and increased oxidative stress: exposure-response analysis among high-level exposed population. Environ Int. (2021) 147:106341. doi: 10.1016/j.envint.2020.106341
13. Jin, L, Xie, J, Wong, CKC, Chan, SKY, Abbaszade, G, Schnelle-Kreis, J, et al. Contributions of city-specific fine particulate matter (pm(2.5)) to differential in vitro oxidative stress and toxicity implications between Beijing and Guangzhou of China. Environ Sci Technol. (2019) 53:2881–91. doi: 10.1021/acs.est.9b00449
14. Xu, F, Shi, X, Qiu, X, Jiang, X, Fang, Y, Wang, J, et al. Investigation of the chemical components of ambient fine particulate matter (PM(2.5)) associated with in vitro cellular responses to oxidative stress and inflammation. Environ Int. (2020) 136:105475. doi: 10.1016/j.envint.2020.105475
15. Pei, L, Zhao, M, Xu, J, Li, A, Luo, K, Li, R, et al. Associations of ambient fine particulate matter and its constituents with serum complement C3 in a panel study of older adults in China. Environ Pollut. (2019) 252:1019–25. doi: 10.1016/j.envpol.2019.05.096
16. Mallah, MA, L, C, Mallah, MA, Noreen, S, Liu, Y, Saeed, M, et al. Polycyclic aromatic hydrocarbon and its effects on human health: an overeview. Chemosphere. (2022) 296:133948. doi: 10.1016/j.chemosphere.2022.133948
17. Låg, M, Øvrevik, J, Refsnes, M, and Holme, JA. Potential role of polycyclic aromatic hydrocarbons in air pollution-induced non-malignant respiratory diseases. Respir Res. (2020) 21:299. doi: 10.1186/s12931-020-01563-1
18. Stallings-Smith, S, Mease, A, Johnson, TM, and Arikawa, AY. Exploring the association between polycyclic aromatic hydrocarbons and diabetes among adults in the United States. Environ Res. (2018) 166:588–94. doi: 10.1016/j.envres.2018.06.041
19. Oliveira, M, Slezakova, K, Delerue-Matos, C, Pereira, MC, and Morais, S. Children environmental exposure to particulate matter and polycyclic aromatic hydrocarbons and biomonitoring in school environments: a review on indoor and outdoor exposure levels, major sources and health impacts. Environ Int. (2019) 124:180–204. doi: 10.1016/j.envint.2018.12.052
20. Armstrong, B, Hutchinson, E, Unwin, J, and Fletcher, T. Lung cancer risk after exposure to polycyclic aromatic hydrocarbons: a review and meta-analysis. Environ Health Perspect. (2004) 112:970–8. doi: 10.1289/ehp.6895
21. Breen, M, Xu, Y, Schneider, A, Williams, R, and Devlin, R. Modeling individual exposures to ambient pm(2.5) in the diabetes and the environment panel study (deps). Sci Total Environ. (2018) 626:807–16. doi: 10.1016/j.scitotenv.2018.01.139
22. Chen, XC, Ward, TJ, Ho, KF, Sarkar, C, and Webster, C. Characteristics and health risks of personal exposure to particle-bound Pahs for Hong Kong adult residents: from ambient pollution to indoor exposure. Indoor Air. (2022) 32:e12956. doi: 10.1111/ina.12956
23. Caplin, A, Ghandehari, M, Lim, C, Glimcher, P, and Thurston, G. Advancing environmental exposure assessment science to benefit society. Nat Commun. (2019) 10:1236. doi: 10.1038/s41467-019-09155-4
24. Lei, X, Chen, R, Wang, C, Shi, J, Zhao, Z, Li, W, et al. Necessity of personal sampling for exposure assessment on specific constituents of pm(2.5): results of a panel study in Shanghai, China. Environ Int. (2020) 141:105786. doi: 10.1016/j.envint.2020.105786
25. Kwok, WH, Leung, GN, Wan, TS, Curl, P, and Schiff, PJ. Metabolic study of androsta-1,4,6-triene-3,17-dione in horses using liquid chromatography/high resolution mass spectrometry. J Steroid Biochem Mol Biol. (2015) 152:142–54. doi: 10.1016/j.jsbmb.2015.05.011
26. Tian, Y, Nie, X, Xu, S, Li, Y, Huang, T, Tang, H, et al. Integrative metabonomics as potential method for diagnosis of thyroid malignancy. Sci Rep. (2015) 5:14869. doi: 10.1038/srep14869
27. Nicholson, JK, Connelly, J, Lindon, JC, and Holmes, E. Metabonomics: a platform for studying drug toxicity and gene function. Nat Rev Drug Discov. (2002) 1:153–61. doi: 10.1038/nrd728
28. Clish, CB. Metabolomics: an emerging but powerful tool for precision medicine. Cold Spring Harb Mol Case Stud. (2015) 1:a000588. doi: 10.1101/mcs.a000588
29. Johnson, CH, Ivanisevic, J, and Siuzdak, G. Metabolomics: beyond biomarkers and towards mechanisms. Nat Rev Mol Cell Biol. (2016) 17:451–9. doi: 10.1038/nrm.2016.25
30. Woodward, N, and Levine, M. Minimizing air pollution exposure: a practical policy to protect vulnerable older adults from death and disability. Environ Sci Pol. (2016) 56:49–55. doi: 10.1016/j.envsci.2015.10.018
31. Shumake, KL, Sacks, JD, Lee, JS, and Johns, DO. Susceptibility of older adults to health effects induced by ambient air pollutants regulated by the European Union and the United States. Aging Clin Exp Res. (2013) 25:3–8. doi: 10.1007/s40520-013-0001-5
32. Du, X, Zhang, Q, Jiang, Y, Li, H, Zhu, X, Zhang, Y, et al. Dynamic molecular choreography induced by traffic exposure: A randomized, crossover trial using multi-omics profiling. J Hazard Mater. (2022) 424:127359. doi: 10.1016/j.jhazmat.2021.127359
33. Liang, D, Li, Z, Vlaanderen, J, Tang, Z, Jones, DP, Vermeulen, R, et al. A state-of-the-science review on high-resolution metabolomics application in air pollution health research: current progress, analytical challenges, and recommendations for future direction. Environ Health Perspect. (2023) 131:56002. doi: 10.1289/EHP11851
34. Jiang, G, Kang, H, and Yu, Y. Cross-platform metabolomics investigating the intracellular metabolic alterations of HaCaT cells exposed to phenanthrene. J Chromatogr B Analyt Technol Biomed Life Sci. (2017) 1060:15–21. doi: 10.1016/j.jchromb.2017.05.023
35. Akram, M. Citric acid cycle and role of its intermediates in metabolism. Cell Biochem Biophys. (2014) 68:475–8.
36. Piloquet, H, Ferchaud-Roucher, V, Duengler, F, Zair, Y, Maugere, P, and Krempf, M. Insulin effects on acetate metabolism. Am J Physiol Endocrinol Metab. (2003) 285:E561–5. doi: 10.1007/s12013-013-9750-1
37. Kwon, S, Hyeon, JS, Jung, Y, Li, L, An, JN, Kim, YC, et al. Urine myo-inositol as a novel prognostic biomarker for diabetic kidney disease: a targeted metabolomics study using nuclear magnetic resonance. Kidney Res Clin Pract. (2023) 42:445–59. doi: 10.23876/j.krcp.22.152
38. Zolkeflee, NKZ, Wong, PL, Maulidiani, M, Ramli, NS, Azlan, A, Abas, F, et al. Metabolic alterations in streptozotocin-nicotinamide-induced diabetic rats treated with Muntingia calabura extract via 1H-nmr-based metabolomics. Planta Med. (2023) 89:916–34. doi: 10.1055/a-2053-0950
39. Jimenez-Uribe, AP, Hernandez-Cruz, EY, Ramirez-Magana, KJ, and Pedraza-Chaverri, J. Involvement of tricarboxylic acid cycle metabolites in kidney diseases. Biomol Ther. (2021) 11:1259. doi: 10.3390/biom11091259
40. Fu, PP, Xia, Q, Sun, X, and Yu, H. Phototoxicity and environmental transformation of polycyclic aromatic hydrocarbons (PAHs)-light-induced reactive oxygen species, lipid peroxidation, and DNA damage. J Environ Sci Health C Environ Carcinog Ecotoxicol Rev. (2012) 30:1–41. doi: 10.1080/10590501.2012.653887
41. Lin, Y, Qiu, X, Yu, N, Yang, Q, Araujo, JA, and Zhu, Y. Urinary metabolites of polycyclic aromatic hydrocarbons and the association with lipid peroxidation: a biomarker-based study between Los Angeles and Beijing. Environ Sci Technol. (2016) 50:3738–45. doi: 10.1021/acs.est.5b04629
42. Gao, P, Da Silva, E, Hou, L, Denslow, ND, Xiang, P, Ma, LQ, et al. Human exposure to polycyclic aromatic hydrocarbons: metabolomics perspective. Environ Int. (2018) 119:466–77. doi: 10.1016/j.envint.2018.07.017
43. Song, X, Zhang, H, Zhang, Y, Goh, B, Bao, B, Mello, SS, et al. Gut microbial fatty acid isomerization modulates intraepithelial T cells. Nature. (2023) 619:837–43. doi: 10.1038/s41586-023-06265-4
44. Sun, L, Suo, C, Zhang, T, Shen, S, Gu, X, Qiu, S, et al. Eno1 promotes liver carcinogenesis through Yap1-dependent arachidonic acid metabolism. Nat Chem Biol. (2023) 19:1492–503. doi: 10.1038/s41589-023-01391-6
45. Schulze, PC, Drosatos, K, and Goldberg, IJ. Lipid use and misuse by the heart [J]. Circ Res. (2016) 118:1736–51. doi: 10.1161/CIRCRESAHA.116.306842
46. Wang, Y, Li, J, Matye, D, Zhang, Y, Dennis, K, Ding, W-X, et al. Bile acids regulate cysteine catabolism and glutathione regeneration to modulate hepatic sensitivity to oxidative injury. JCI Insight. (2018) 3:e99676. doi: 10.1172/jci.insight.99676
47. Yuan, Y, Wu, X, Ou, Q, Gao, J, Tennant, BC, Han, W, et al. Differential expression of the genes involved in amino acids and nitrogen metabolisms during liver regeneration of mice. Hepatol Res. (2009) 39:301–12. doi: 10.1111/j.1872-034X.2008.00456.x
48. Stegemann, C, Pechlaner, R, Willeit, P, Langley, SR, Mangino, M, Mayr, U, et al. Lipidomics profiling and risk of cardiovascular disease in the prospective population-based Bruneck study. Circulation. (2014) 129:1821–31. doi: 10.1161/CIRCULATIONAHA.113.002500
49. Losito, I, Patruno, R, Conte, E, Cataldi, TR, Megli, FM, and Palmisano, F. Phospholipidomics of human blood microparticles. Anal Chem. (2013) 85:6405–13. doi: 10.1021/ac400829r
50. Xia, Y, Niu, Y, Cai, J, Lin, Z, Liu, C, Li, H, et al. Effects of personal short-term exposure to ambient ozone on blood pressure and vascular endothelial function: a mechanistic study based on DNA methylation and metabolomics. Environ Sci Technol. (2018) 52:12774–82. doi: 10.1021/acs.est.8b03044
51. Du, X, Zeng, X, Pan, K, Zhang, J, Song, L, Zhou, J, et al. Metabolomics analysis of urine from healthy wild type mice exposed to ambient pm(2.5) [J]. Sci Total Environ. (2020) 714:136790. doi: 10.1016/j.scitotenv.2020.136790
52. Münzel, T, Sørensen, M, Gori, T, Schmidt, FP, Rao, X, Brook, FR, et al. Environmental stressors and cardio-metabolic disease: part II–mechanistic insights. Eur Heart J. (2016) 38:557–64. doi: 10.1093/eurheartj/ehw294
53. Gaio, V, Roquette, R, Dias, CM, and Nunes, B. Ambient air pollution and lipid profile: systematic review and meta-analysis. Environ Pollut. (2019) 254:113036. doi: 10.1016/j.envpol.2019.113036
54. Li, R, Navab, M, Pakbin, P, Ning, Z, Navab, K, Hough, G, et al. Ambient ultrafine particles alter lipid metabolism and HDL anti-oxidant capacity in Ldlr-null mice. J Lipid Res. (2013) 54:1608–15. doi: 10.1194/jlr.M035014
55. Lippmann, M. Toxicological and epidemiological studies of cardiovascular effects of ambient air fine particulate matter (Pm2.5) and its chemical components: coherence and public health implications. Crit Rev Toxicol. (2014) 44:299–347. doi: 10.3109/10408444.2013.861796
56. Balti, EV, Echouffo-Tcheugui, JB, Yako, YY, and Kengne, AP. Air pollution and risk of type 2 diabetes mellitus: a systematic review and meta-analysis. Diabetes Res Clin Pract. (2014) 106:161–72. doi: 10.1016/j.diabres.2014.08.010
Keywords: PM2.5, PAHs, metabolomics, metabolic pathway, older adults
Citation: Hu H, Zhou Q, Cao K, Jiang Y, Xiang J, Wu J, Li J, Chen Z, Kang S, Zhu D, Lin H and Wu C (2025) Metabolome-wide associations with short-term exposure to PM2.5-bound polycyclic aromatic hydrocarbons: a study in older adults. Front. Public Health. 13:1609724. doi: 10.3389/fpubh.2025.1609724
Edited by:
Alica Pizent, Institute for Medical Research and Occupational Health, CroatiaReviewed by:
Ersin Tutsak, Qatar University, QatarXiaoxiao Wang, University of California, Davis, United States
Copyright © 2025 Hu, Zhou, Cao, Jiang, Xiang, Wu, Li, Chen, Kang, Zhu, Lin and Wu. This is an open-access article distributed under the terms of the Creative Commons Attribution License (CC BY). The use, distribution or reproduction in other forums is permitted, provided the original author(s) and the copyright owner(s) are credited and that the original publication in this journal is cited, in accordance with accepted academic practice. No use, distribution or reproduction is permitted which does not comply with these terms.
*Correspondence: Huaying Lin, MTMxMDc2MDkxNjNAMTYzLmNvbQ==; Chuancheng Wu, d2NjQGZqbXUuZWR1LmNu
†These authors have contributed equally to this work