 Xuan Zou1
 Yao He
 Haoyang Lu
- 1School of Economics and Trade, Hunan University, Changsha, Hunan, China
- 2Department of Economics, University of Bath, Bath, United Kingdom
Objective: Depressive disorders are increasingly recognized as a major public health challenge, especially in aging societies. This study aims to explore the impact of air pollution on the mental health of middle-aged and older adults, with a particular focus on identifying the vulnerable subgroups and underlying mechanisms.
Methods: We employ micro-level data to empirically examine how exposure to fine particulate matter (PM2.5) affects short-term mental health outcomes, as measured by the Centers for Epidemiologic Studies Depression Scale (CES-D). We also explore the potential mediating channels through which air pollution may influence psychological well-being, including sleep quality, life satisfaction, physical health, and cognitive functioning.
Results: Our findings show that the increment in fine particulate matter (PM2.5) increases the scores of Centers for Epidemiologic Studies Depression Scale (CES-D), indicating a deterioration in mental health. The negative effects of air pollution are particularly pronounced among older adults, females, and widowed individuals. Mechanism analysis reveals that air pollution significantly worsens sleep quality, reduces life satisfaction, impairs cardiopulmonary health, and diminishes cognitive competence.
Conclusions: This study highlights the substantial mental health burden of air pollution, especially for vulnerable populations. We find suggestive evidence that improving access to pollution information and urban greening can help mitigate these adverse effects. Our findings underscore the urgent need for targeted public health interventions and environmental policies to address the mental health consequences of air pollution, particularly in the context of climate change and population aging.
1 Introduction
A large body of literature documents that mental disorders have become the major global burden of disease (1). The adverse effects of depressive disorders are likely to have a substantial impact on economic activities. Untreated mental disorders can lead to profound unhappiness, a marked decrease in the enjoyment of life, and the deterioration of essential social bonds (2–4). It can further give rise to troubles in the socio-economic domain, resulting in absenteeism, reduced productivity, or even job loss (5–7). Moreover, middle-aged and older adults are more likely to suffer from a wide range of mental and psychosocial adjustment disorders, and only about 10% of them seek medical attention (8, 9). At the same time, ambient air pollution is considered a global public health issue in developed and developing countries (10). Air pollution can impair human physical condition, including respiratory illness, stroke, pulmonary disease, and so on (11–13). However, the mitigating behaviors that can reduce the negative impact of air pollution on mental illness are not yet clear. Exploring the mitigating behaviors of the negative impact of air pollution on mental illness is unclear. Addressing this gap is crucial to comprehending how air pollution influences mental states, particularly for middle-aged and older adults, who represent a significant portion of the population.
This study provides empirical evidence on how air pollution affects short-run mental health outcomes among the middle-aged and older adults. We examine how air pollution has an impact on mental health by employing panel data at the individual level from the China Health and Retirement Longitudinal Study (CHARLS) and corresponding city-level air pollution statistical data. Specifically, we construct a ten-item version of the Center for Epidemiologic Studies Depression Scale (CES-D), which serves as a composite indicator reflecting the level of mental health. The higher scores of CES-D indicate more severe depressive symptoms. Meanwhile, the PM2.5 concentration and air quality index (AQI) data are used as a proxy for air pollution. AQI data are derived from real-time monitoring data published on the official website of the China National Environmental Monitoring Center.1 The PM2.5 concentration data are estimated using satellite information, ensuring that the measurements are accurate and not subject to human manipulation (14). Our methodology relies on two sources of data processing. First, we assign a monthly average PM2.5 concentration to each participant using the interview data and participants' locations provided by CHARLS. Second, in practice, the dissemination of air pollution exhibits evident spatial spillover effects, and meteorological conditions significantly influence the dispersion and transportation of air pollutants. Therefore, we control for all meteorological variables that may affect the dispersion and transportation of air pollutants, including sunshine hours, relative humidity, wind speed, and precipitation. This ensures that our empirical results are accurate through rigorous data processing.
This study makes contributions on three fronts. First, we relate to the literature between air pollution and mental illness. Many researchers have explored the direct negative impact of air pollution (15). Different air contaminants, including fine airborne particulate matter (PM2.5, PM5, and PM10), sulfur dioxide, carbon monoxide (CO), benzene, and ozone, have been shown to be toxic to the central nervous system (CNS) (16, 17). Long-term exposure to air pollution has adverse effects on health, including an increased risk of lung cancer (18). Of note, the detrimental impact of air pollution on individual performance and economic outcomes has been documented (19, 20). In particular, air pollution reduces reading and math outcomes for schoolchildren due to lower school attendance and inattentiveness (21), and it further undermines human capital as a potential consequence of poor performance in innovation activities (22). Emerging research has tried to investigate the association between air pollution and health outcomes (23). Air pollutants are negatively associated with cognitive development (24). Also, the association between exposure to air pollution and anxiety has been suggested (25). However, the results are inconsistent (26, 27). Our paper highlights the importance of emphasizing heterogeneous effects in different subgroups when measuring the mental health consequences of air pollution using a large-scale longitudinal dataset. This allows us to provide novel insights into how air pollution exposure can affect the mental health status of older people.
Second, this study examines the factors that influence mental health outcomes. Previous studies have investigated factors such as sex (28), education (29), ethnicity (30), smoking and drinking frequency (31), and social participation (32). Additionally, environmental factors such as living conditions (town vs. village living) (33), crime rate (34), unemployment rate (35), and household income inequality (36) significantly influence mental health over time. We provide empirical estimations to explore the underlying mechanisms through which air pollution affects mental illness from the individual perspective. We point out that poor sleep quality, decreased life satisfaction, reduced physical fitness, and declining cognitive ability are major drivers of deteriorating mental health among the middle-aged and older adults. Furthermore, we distinguish the differences in impacts on the middle-aged and older adults and propose that late-life depression should be a senior issue that the public and researchers should pay more attention to.
Third, it is unrealistic to eliminate air pollution thoroughly, as human activities and natural processes contribute to some extent to pollutant emissions. Based on these considerations, our study provides empirical evidence on how people might respond to air pollution exposure, focusing on two mitigation measures: private access to pollution information and the filtering effect of urban forests. These responses are still largely unknown to researchers. We first document the private access to pollution information to increase people's awareness about pollution issues. These changes trigger people's avoidance behaviors in response to air pollution, alleviating psychological problems. We propose another human intervention to mitigate pollution exposure: urban forests, which are among the most prevalent urban afforestation policies. Urban forests will absorb hazardous chemical pollutants and effectively cut off diffusion pathways for particulate pollution. The findings could help design more effective public health campaigns and policies addressing environmental and mental health challenges.
The remainder of the paper is structured as follows: Section 2 provides an overview of the background. Section 3 outlines the data. Section 4 details the empirical strategy and baseline findings. Section 5 explores the robustness checks. Section 6 examines the heterogeneity analyses. Section 7 delves into the potential mechanisms. Section 8 demonstrates further analyses. Section 9 concludes the paper.
2 Background
2.1 Air pollution
During the past decades, China has experienced unprecedented economic growth, but it has also brought with it the byproduct of severe air pollution (37). PM2.5, as the main component of air pollution, has caused substantial welfare losses to individuals and society (38). The comparison of PM2.5 concentration maps for China in 2000 and 2020 reveals a substantial improvement in air quality over the two decades in Figure 1. The 2020 map shows a significant reduction in severe and heavy pollution areas, especially along the southeastern coast. This trend indicates the effectiveness of environmental policies and measures in reducing pollution, although some regions still require further attention to achieve better air quality standards. Furthermore, Figure 2 illustrates the difference in the annual average PM2.5 concentration level across cities of China in 2000 and 2020. In general, air pollution concentrations have significantly increased over the period. Moreover, there is a striking spatial disparity in the PM2.5 level.
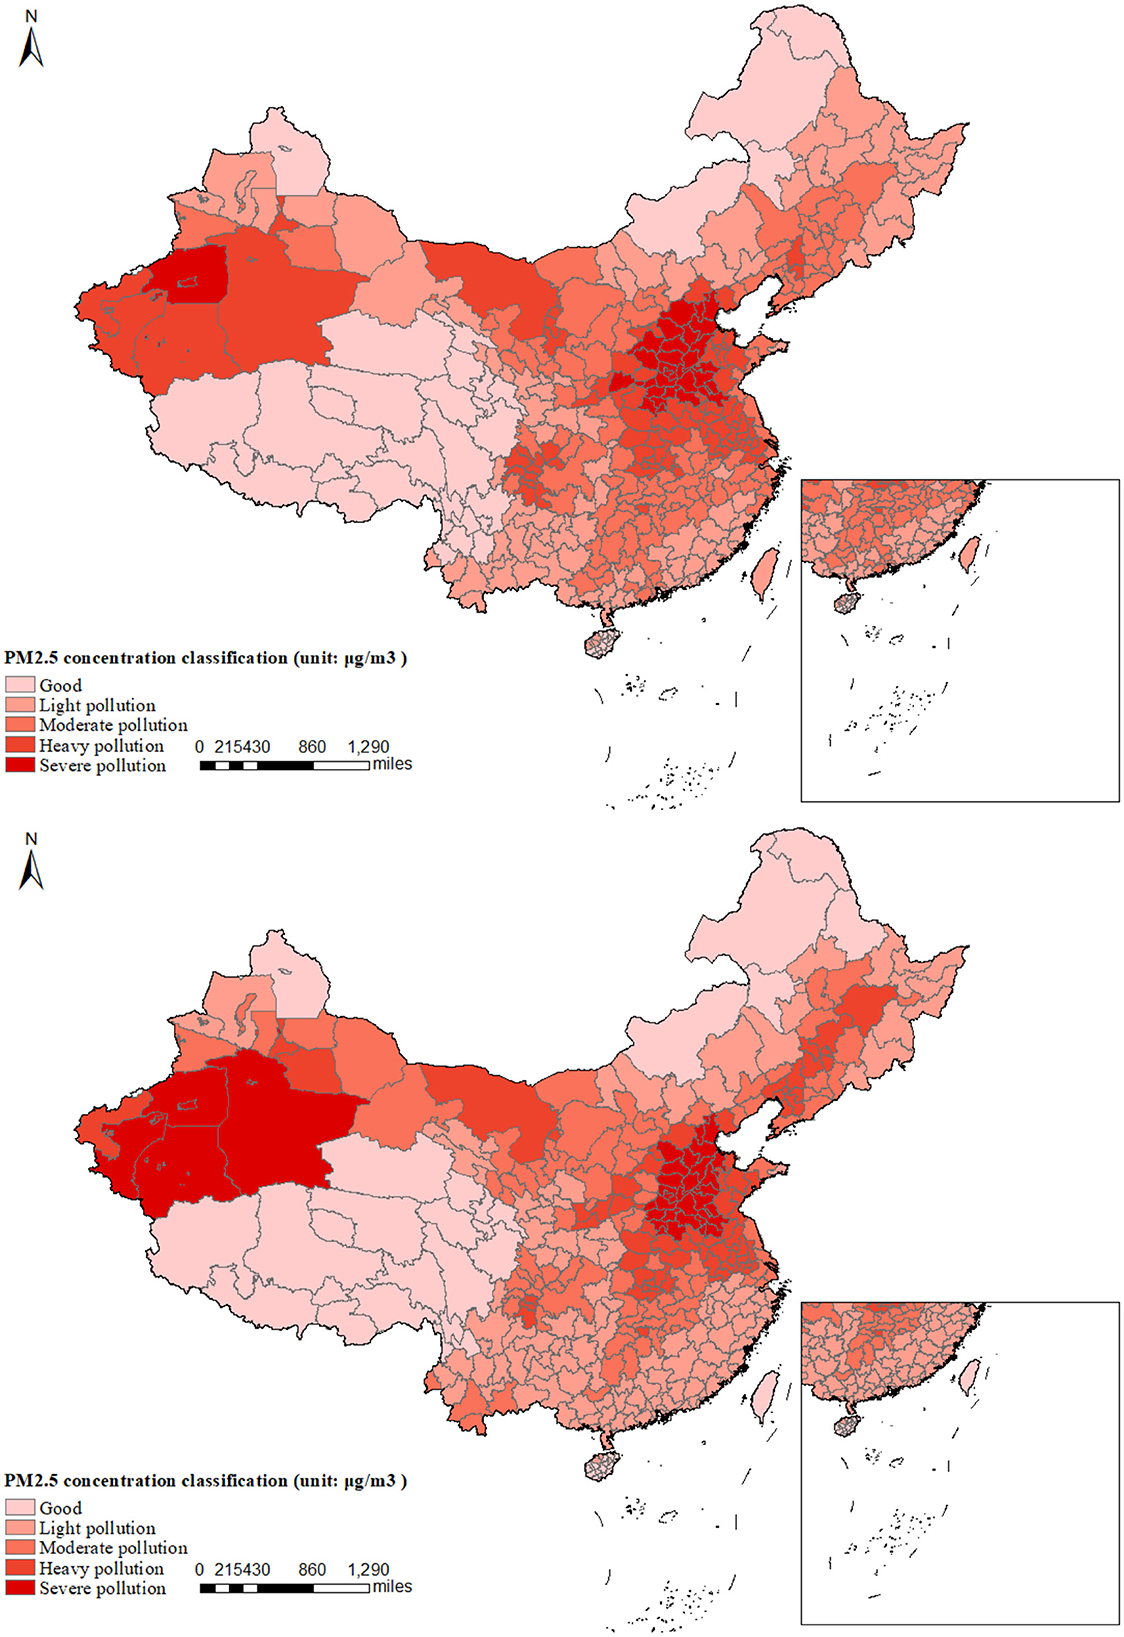
Figure 1. Comparison of average PM2.5 concentrations: upper panel (2000) vs. lower panel (2020). This figure presents a comparative analysis of the annual average PM2.5 concentrations across prefecture-level cities in China for the years 2000 and 2020. The comparison indicates that there has been an improvement in PM2.5 concentrations in the northern and eastern regions of China in 2020 compared to the year 2000. Conversely, the western regions have experienced an expansion in areas of severe pollution over the past two decades.
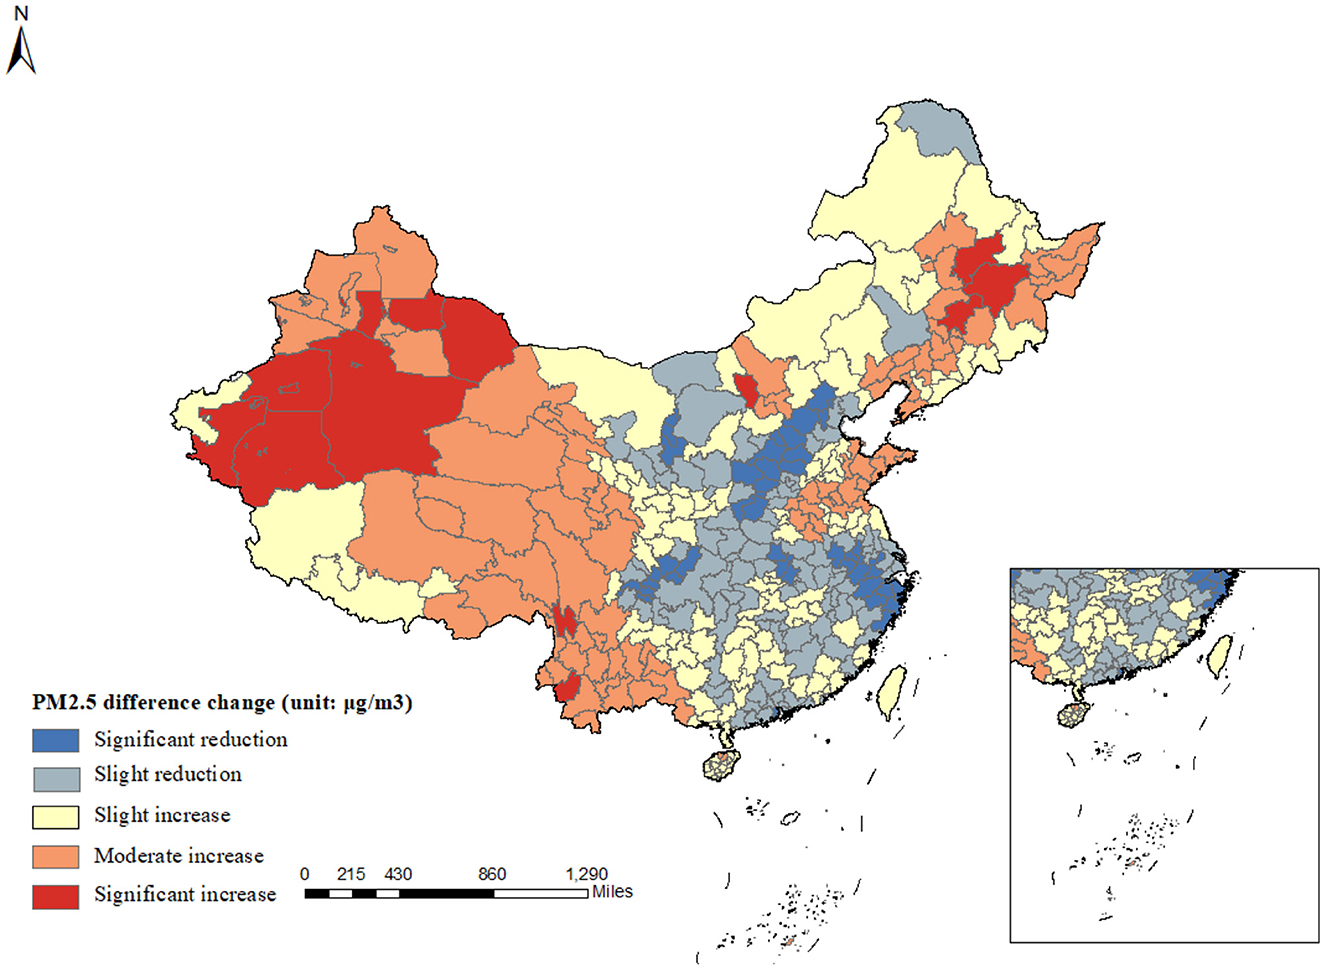
Figure 2. Average PM2.5 difference change in 2000 and 2020. This figure displays the spatial distribution of PM2.5 concentration changes in China from 2000 to 2020. Pollution has intensified in the western region, whereas the central and eastern areas have shown initial success in pollution control efforts, with a reduction in PM2.5 concentrations. However, regions of North China continue to experience severe pollution.
To address this problem, China has implemented several policies to solve the issue of air pollution. For example, the Two Control Zone (TCZ) policy was launched in 1998, designating certain geographic areas where strict measures are applied to control pollutants, including PM2.5, sulfur dioxide (SO2), and nitrogen oxides (NOx). China has continuously implemented various air quality action plans, including the National Air Pollution Control Action Plan (2013–2017), which set targets for reducing PM2.5 levels in critical regions, such as Beijing-Tianjin-Hebei, the Yangtze River Delta, and the Pearl River Delta. China has implemented stricter vehicle emission standards and promoted the use of electric vehicles (EVs) to address its significant air quality challenges.
2.2 Aging problem
China is experiencing significant demographic aging, with its population structure undergoing a dramatic transformation. Figure 3 displays the proportion of China's older adults population to the total population from 2013 to 2022. There are an increasing number of older adults. The working-age population is expected to decline by 23% from 925 million in 2011 to 800 million in 2050 (39). This demographic shift is primarily driven by two factors. First, the one-child policy, implemented from 1979 to 2015 to control population growth, significantly reduced birth rates. Second, advancements in healthcare have improved life expectancy, contributing to the rise in the older adults. Additionally, declining mortality rates further accelerate this trend. According to the Seventh National Population Census published in 2021, China's total fertility rate (TFR) dropped from 5.6 in 1970 to an estimated 1.3 in recent years. This demographic transition presents both challenges and opportunities. It calls for comprehensive reforms in social care, healthcare systems, and economic strategies to support the aging population. At the same time, advancements in technology and healthcare offer opportunities to enhance the quality of life for older adults.
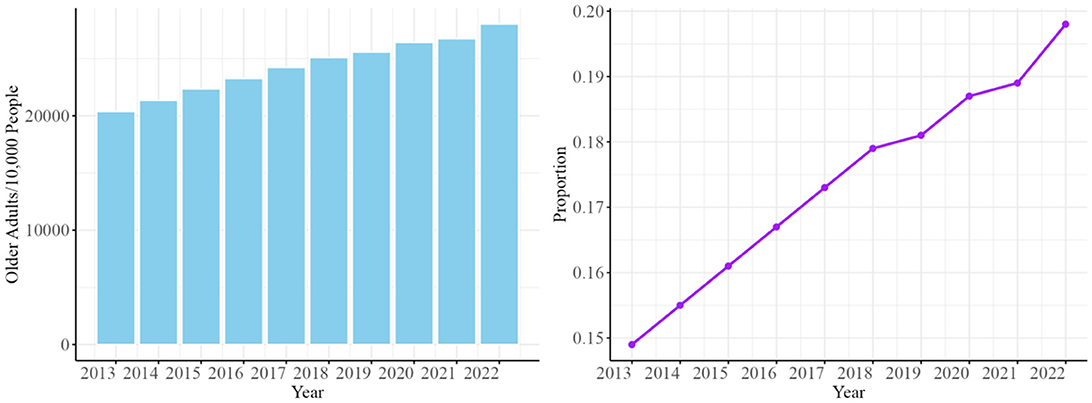
Figure 3. The proportion of China's older adults population from 2013 to 2022. Data Source: National Bureau of Statistics of China. Data Source: National Bureau of Statistics of China. This figure presents the interannual changes in the total number of older adults (left panel) and their proportion within the total population (right panel) in China from 2013 to 2022. It reflects the ongoing acceleration of the aging population in China. The left panel illustrates the growth in the absolute number of older adults. The right panel demonstrates the increasing proportion of older adults within the overall population.
2.3 Mental health status of the middle-aged and older adults
The prevalence of depression among the middle-aged and older adults in China is a significant concern. The pooled overall prevalence of depressive symptoms among older adults in China was ~20.0%, indicating a considerable burden of depression in this demographic (40). The incidence of depressive symptoms has shown a slow increase since the 1990s. Especially, the evolution of depression among the Chinese older adults from 2011 to 2018 revealed a significant upward trend in the detection rates of depression, reaching 44.5% by 2018 (41). The prevalence of depression in the middle-aged and older adults population is of even greater concern. There is a clear need for policies and programs that consider the specific needs of vulnerable older adults, focusing on improving social participation and access to mental health services to mitigate the risk of depression. We provide new perspectives to explore how air pollution, as a potential causative factor, affects the mental health status of the middle-aged and older adults.
3 Data analysis
Data on mental health and individual characteristics of the middle-aged and older adults are obtained from CHARLS. Initiated in 2011, CHARLS, a nationally bi-annual longitudinal survey, collects a representative sample of persons in China 45 years of age or older and their spouses, including a series of assessments of social, economic, and health conditions. The CHARLS involves about 10,000 households and 17,500 individuals in 150 counties (districts) and 450 villages (resident committees). Overall, CHARLS is a nationally comprehensive longitudinal social survey that is intended to provide a high-quality public micro-database to meet the needs of scientific and policy research about aging-related issues (42). Figure 4 depicts the cities in China that were involved in CHARLS.
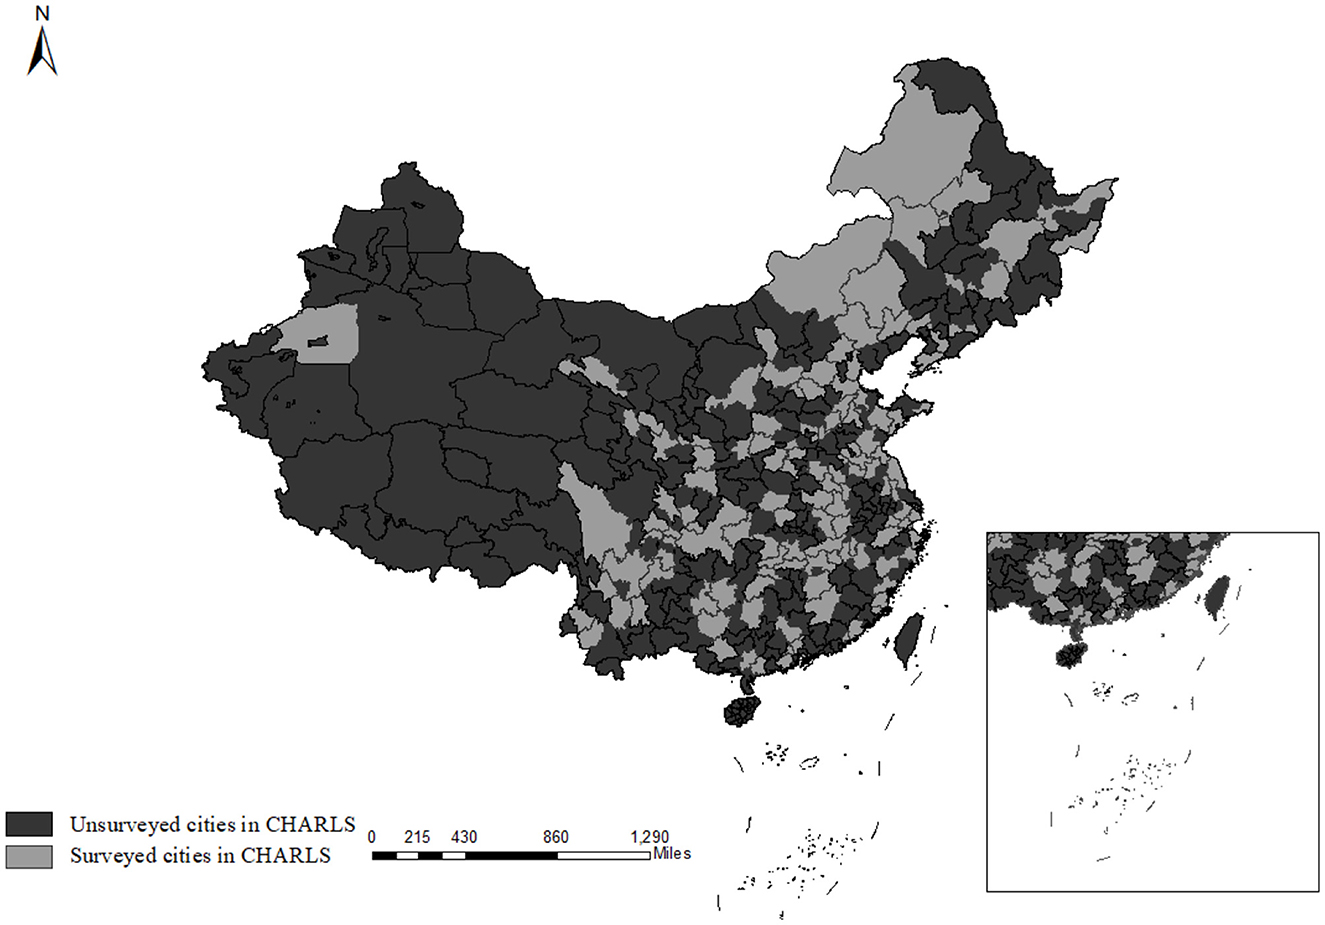
Figure 4. Distribution of Chinese cities surveyed by CHARLS. This figure illustrates the spatial distribution of cities covered by the China Health and Retirement Longitudinal Study (CHARLS). Light gray areas denote cities that CHARLS has surveyed, while dark gray areas represent cities that have not been included in the survey. CHARLS encompasses 28 provinces, indicating a broad coverage across China.
We use survey data from the 2013, 2015, 2018, and 2020 waves of CHARLS. To maintain sample coherence, we restrict our sample to individuals who participated in all four survey waves. These waves consistently feature the same ten questions that enable the construction of the CES-D (Center for Epidemiologic Studies Depression) scale, which is also recognized as the K10 instrument—a 10-question screening scale for psychological distress (43). Drawing on the findings of Chen and Mui (44), we argue that the CES-D 10 scale is a reliable and valid measure of mental health status among middle-aged and older adults in China. The ten questions in CHARLS applied to measure the mental health status are as follows: in the last 30 days, how often did you feel (a) bothered by things, (b) trouble keeping mind, (c) depressed, (d) effortless, (e) that everything I did was an effort, (f) hopeless about the future, (g) fearful, (h) restless, (i) unhappy, (j) lonely and that I cannot go on with my life. Each question takes the value of 1 if the participant matched such a feature for each question most or all the time. Each question takes the value of 0.5 if the participant occasionally or a little of the time matched such a characterization for the question. If the participant is rare or does not have such a characteristic, the question takes the value 0. Based on the participants' answers, we construct the CES-D score as the sum of the answers to the ten questions. A higher score CES-D score indicates a higher risk of mental health.
The core explanatory variable is the air pollution level. It is measured by the monthly average surface concentration of PM2.5. Specifically, the PM2.5 concentrations in each city were extracted according to the vector map of urban administrative regions in China, which comes from the 0.01°* 0.01° grid data of ground-level PM2.5 obtained from the University of Washington ACAG website.2 We adopt the satellite monitoring data, which can more accurately reflect the PM2.5 concentration level and urban trend and solve the problem of the lack of historical data on PM2.5 concentration.
The demographic characteristics include the hukou type (rural or urban), whether individuals receive (or expect to receive) or contribute to the pension3, and medical insurance4. Precisely, whether to receive a pension reflects an individual's post-retirement financial stability and income security. Individuals with adequate pension income may also experience a greater sense of autonomy, life satisfaction, and reduced psychological distress. Whether to receive medicare variables represents access to health insurance coverage for individuals. It is a key proxy for healthcare access, influencing the affordability and utilization of medical services. Coverage can reduce out-of-pocket expenses and make treatments such as counseling, psychiatric care, or medication more accessible.
The monthly urban meteorological characteristics are attained from the China Meteorological Data Sharing Service System (CMDSSS). They include (a) average sunshine hours (sunshine duration): longer sunshine hours result in less weakening of solar radiation, inhibiting ozone generation and improving air quality. (b) Average relative humidity (Avg. humidity): the lower relative humidity can promote the settlement and diffusion of inhalable particles in the air, thus improving air quality. (c) Wind speed (Avg. wind speed): wind speeds create air movement and cause pollutants to spread. (d) Average precipitation (precipitation): sufficient precipitation leads to lower surface air temperatures and the obvious effect of wet deposition, which is conducive to reducing the concentration of particulate matter in the air. Furthermore, we performed a multicollinearity test on the weather-related variables, with all VIFs falling below 3, indicating that the intercorrelations among these variables are sufficiently low to not introduce substantial uncertainty into our empirical strategy.
We compile multiple data sets to allow for a comprehensive study of the impact of air pollution on mental health among middle-aged and older adult groups. Table 1 presents the summary statistics of the data used in our baseline empirical regression.
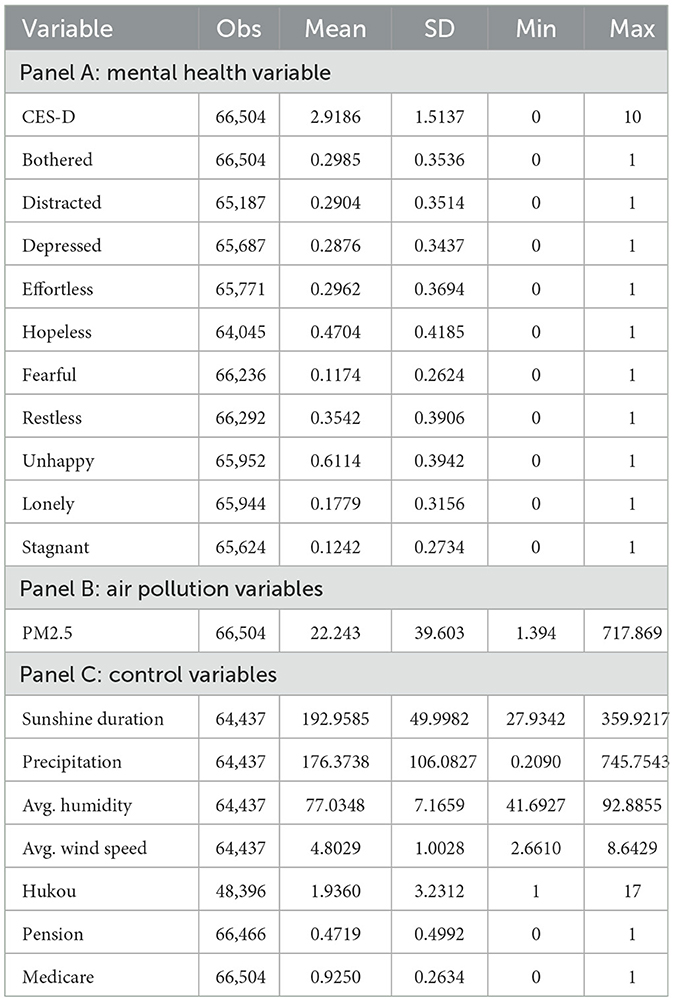
Table 1. Summary statistics.
4 Methods
4.1 Empirical strategy
Our empirical objective is to examine the mental health effects of air pollution. It is typically measured using “pollution gradients,” i.e., for pollution's mental health damage (45). We focus on this marginal approach and estimate how air pollution on mental health.
Taking advantage of the regional and temporal variations in air quality, this paper seeks to identify the impacts of air pollution on the mental health of middle-aged and older adults. Our empirical strategy anchors on a fixed-effect model. The model is given as follows:
In this specification, the outcome variable MHicym denotes the mental health of middle-aged and older adults i from city c in month m year y. pollutioncym represents the monthly mean fine particulate matter (PM2.5). The coefficient, β1, captures the depression effect of air pollution. The vector Xicmy refers to individual controls. The vector Wcmy refers to weather characteristics, including the average humidity, sunshine hours, wind speed, and precipitation. We further control for individual fixed effects (μi) to account for unobservable factors that are constant over time at the individual level, city fixed effects (σc) to account for unobservable factors that are constant over time at the city level, and year (πy) and month fixed effects (ωm) to control for external factors that are common to all units of observation in specific years and months. Tt refers to the monthly time trend that the interview date falls. εicmy is the error term. We cluster standard errors at the city level.
4.2 Baseline results
First, we investigate the baseline results of how air pollution affects the mental health of middle-aged and older adults. Table 2 presents the corresponding estimated coefficients for CES-D scores. Column (1) presents a parsimonious model that controls for the PM2.5 variables, individual FE, city FE, month FE, and year FE. Column (2) additionally controls the meteorological characteristics. Column (3) adds individual characteristics. Column (4) further controls for the linear monthly time trends. The increase in PM2.5 concentration leads to the CES-D score rising by 0.0168, 0.0176, 0.0313, and 0.0313 in columns (1) to (4), respectively. In conclusion, the model with tighter controls leads to a higher CES-D score. This implies that PM2.5 increases CES-D scores, which is statistically significant. From a mental health perspective, the magnitude of this effect is substantial. For example, according to the findings of Zhang et al. (46), the proportion of China's population living in areas with high PM2.5 concentrations (annual average PM2.5 concentration exceeding 75 μg/m3, compared to the WHO-recommended annual average of ≤ 5 μg/m3) accounted for ~5% of the total population after 2015. This exposure level suggests that elevated PM2.5 concentrations could significantly exacerbate depressive symptoms. It further verifies that air pollution exposure poses a potential threat to the mental health of the middle-aged and older adults.
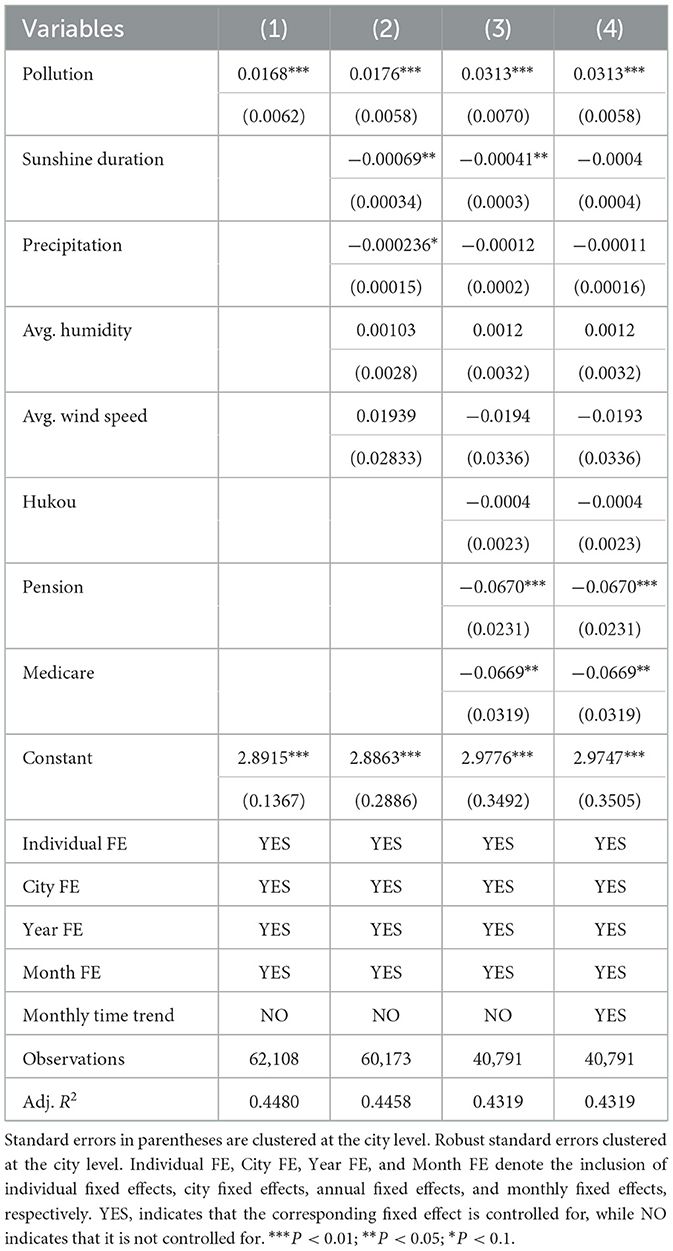
Table 2. Average effect of air pollution exposure on CES-D scores.
5 Robustness checks
To test the stability of the baseline estimates, we perform a series of robustness checks, including distinguishing air pollution levels, alternative measures, alternative model specifications, and falsification tests.
5.1 Distinguishing symptoms of depression
The major components of depression include depressed mood, feelings of guilt and hopelessness, feelings of meaninglessness, and loneliness, which were identified from the clinical literature and factor analytic studies (47). The K-10 questions contain an inquiry about the frequency of these depressive symptoms. We next explore the effects of air pollution on the degree of each depression symptom separately. Table 3 displays the results, where the larger coefficients indicate more severe symptoms of depression. We find that air pollution significantly increases the occurrences of depressive symptoms of bothered, lonely, depressed, and meaningless.
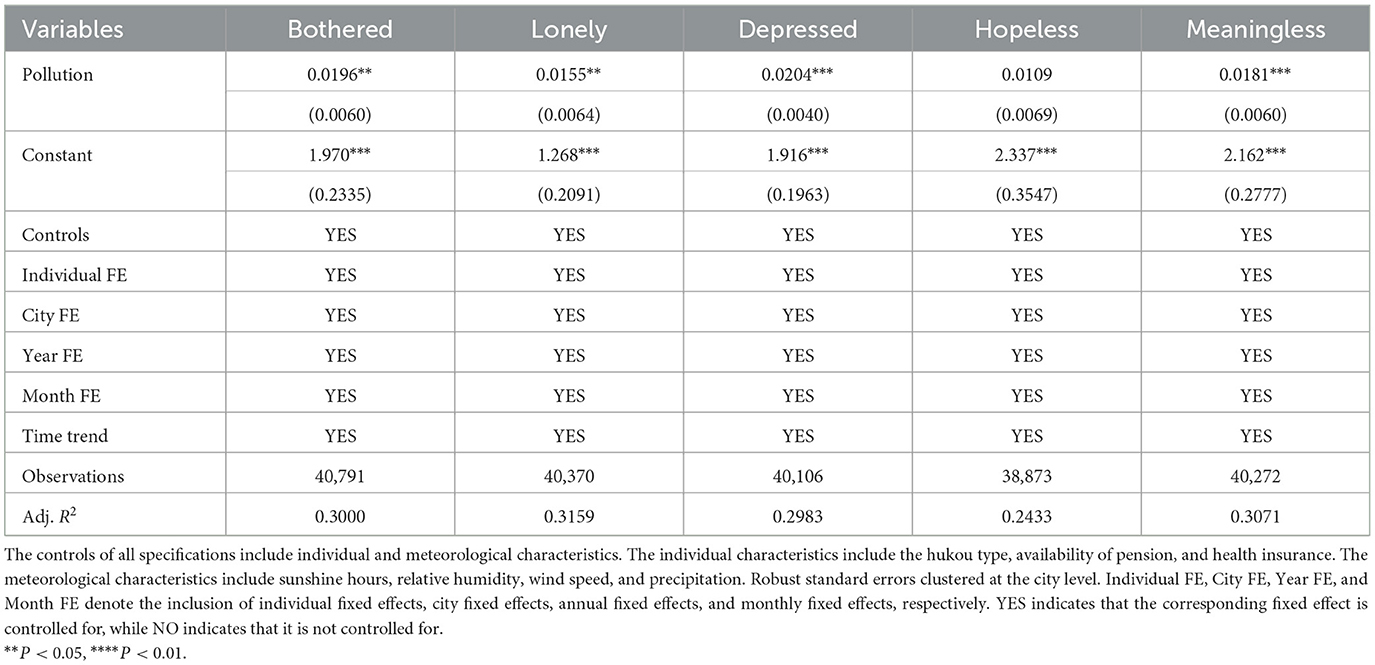
Table 3. The effect of air pollution on specific depressive symptoms.
5.2 Classifying air pollution levels
We further used Air Quality Index (AQI), which was later substituted in robustness checks to strengthen the baseline results. The AQI data were obtained from the China National Environmental Monitoring Center through the web crawler technology, which can provide a broader measure of air quality, capturing multiple pollutants beyond PM2.5 alone. We try to validate the robustness of the findings, examining whether the effects identified with PM2.5 hold when evaluated against a more comprehensive air quality index. This approach enables an inclusive assessment of pollution-related impacts on mental health outcomes. Specifically, the AQI tracks the levels of various air pollutants, including ground-level ozone, particulate matter (such as PM2.5 and PM10), carbon monoxide, sulfur dioxide, and nitrogen dioxide. We categorize the AQI value into levels of increasing health concern. When the AQI value is from 0 to 50, the air quality is considered satisfactory, and air pollution poses little or no risk. The AQI value is from 51 to 100. The air quality is acceptable; however, there may be some health concerns for a very small number of people who are unusually sensitive to air pollution. The AQI value is from 101 to 150. The air quality is unhealthy for sensitive groups, but the public is unlikely to be affected. The AQI value is from 151 to 200. The air quality is unhealthy, and everyone may experience health effects. The AQI value is from 201 to 300. The air quality is very unhealthy; everyone may experience more serious health effects. The AQI value is from 301 to 500. The air quality is hazardous, which is a health warning of emergency conditions.
We use the following model to examine the effects of different pollution gradients on mental health:
Since the AQI value is from 0 to 50, which is no potential threat to the public, we use the 0–50 (excellent air quality) as the baseline group. For each observation, pollutioncym represents the air quality falling into the kth bin of {301–500 (seriously unhealthy,); 201–300 (unhealthy); 151–200 (moderately unhealthy); 101–150 (slightly unhealthy); 51–100 (acceptable)}. The rest of this model is consistent with Equation 1. Table 4 presents the results indicating that severe air pollution levels were associated with higher CES-D scores and more pronounced depressive symptoms, worsening mental health status. Moreover, the results may suggest that the relationship between air pollution levels and mental health outcomes might not be strictly linear across different pollution bins.
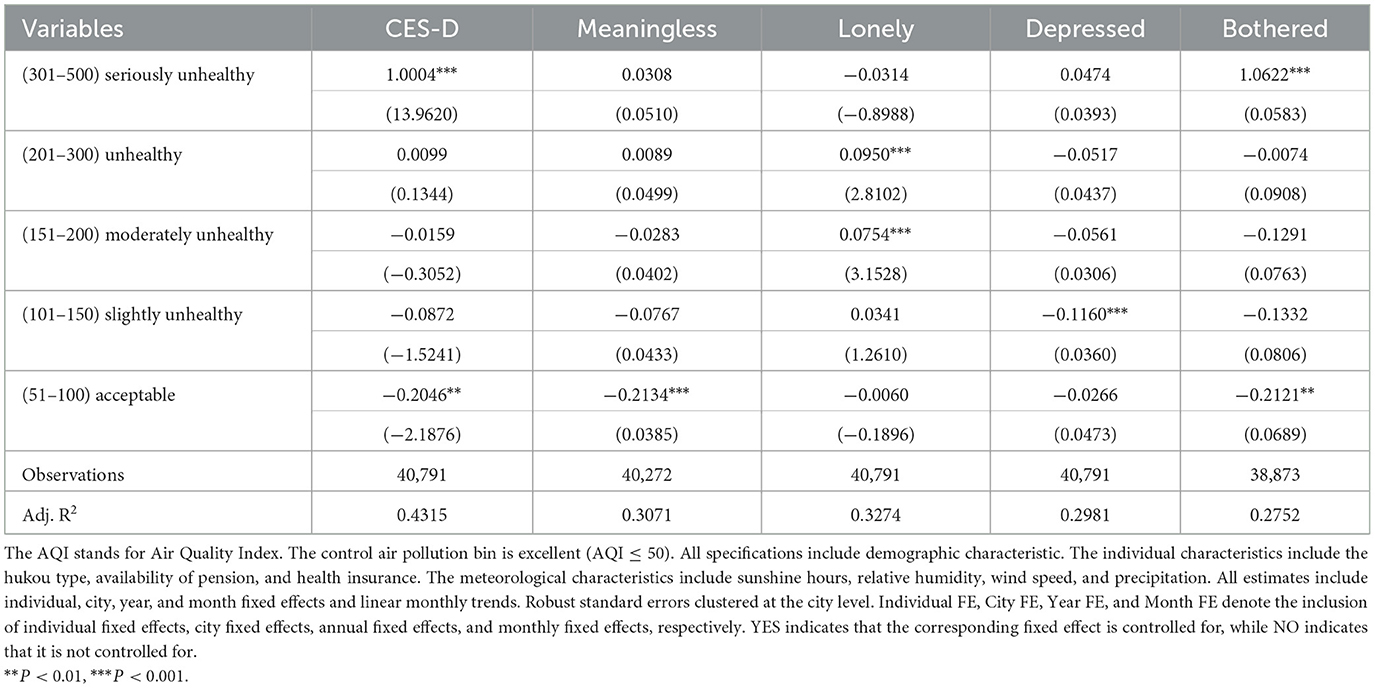
Table 4. The impact of different air pollution levels on different mental symptoms.
5.3 Placebo test
Although we have added adequate control variables at the city level that can affect air pollution, the empirical strategy may still be confounded by other unobservable factors that affect local air pollution and thus lead to estimation bias. Following Ferrara et al. (48), we use the placebo test by randomly assigning PM2.5 values. If no other factors disturb the policy, the coefficient will equal zero, meaning = 0. Next, we repeated the regression of Equation 1 500 times. In each round, the values of PM2.5 are shuffled across the city, year, and month, and the estimated coefficient is recorded. Figure 5 displays the distribution of these estimates, where the distribution of the coefficients follows a normal distribution with zero as the mean, which is far from the vertical dashed line indicating the actual coefficient estimate obtained from Column (4) in Table 2. This suggests that our identification is unbiased, and no unobserved characteristics affect our empirical results. It further verifies that the significant actual estimates rightfully refer to the impacts of air pollution on mental health rather than mere coincidence.
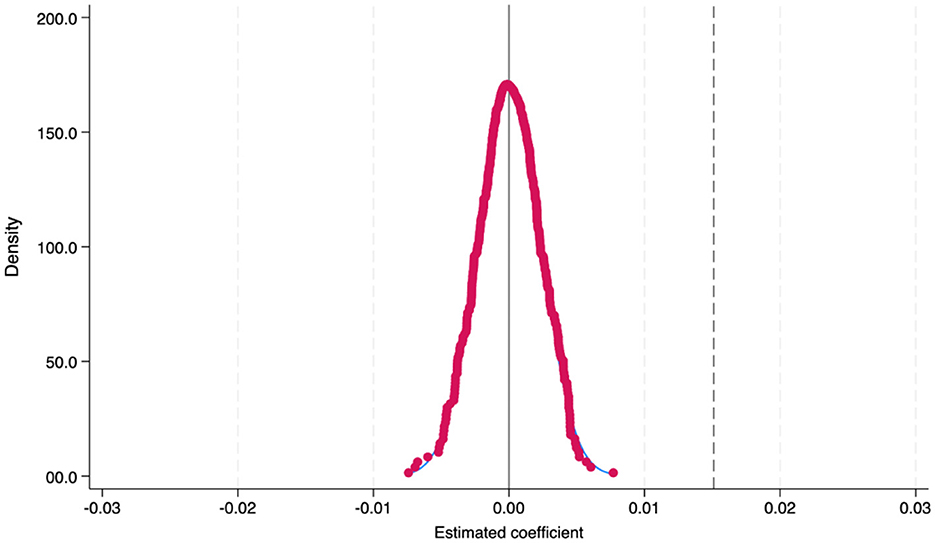
Figure 5. Placebo test results. This figure presents the results of the placebo test, demonstrating that the distribution of the coefficients adheres to a normal distribution centered around zero, which is significantly distant from the vertical dashed line that represents the actual coefficient estimate.
We consider another falsification test. Future air pollution is usually difficult and does not directly affect the current mental health status. Based on this, we follow Burnet and Kogan (49) and use the 2-year forward PM2.5 value as an explanatory variable in Equation 2 to conduct the falsification test. The results in column (1) of Table 5 signify that air pollution does not significantly affect mental health two years forward. This falsification test further demonstrates that our conclusions are not confounded by unobserved factors related to air pollution.
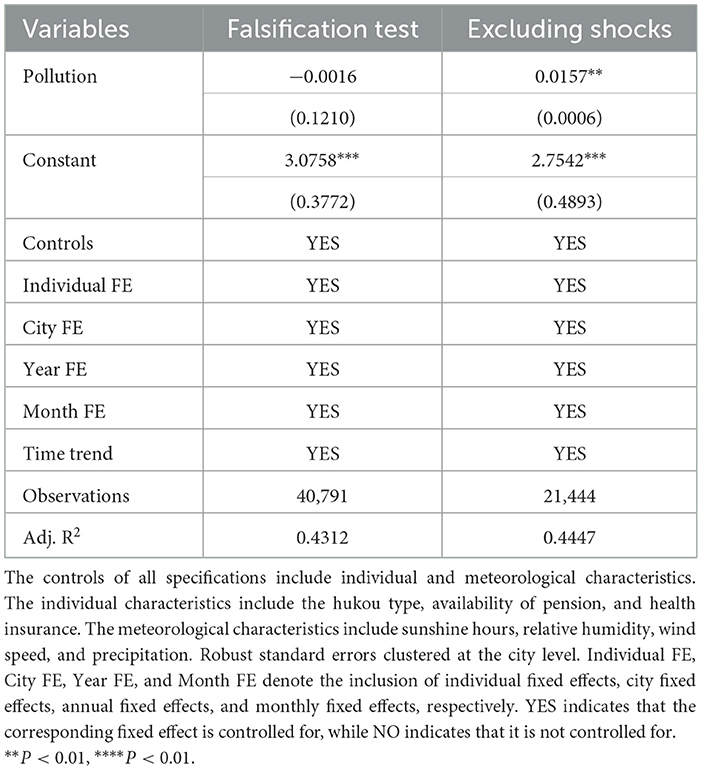
Table 5. Robustness check: falsification test and excluding unpredictable shocks.
5.4 Excluding unpredictable shocks
In spring 2020, COVID-19 started to spread in China. The fear of contracting the virus and the uncertainty surrounding the pandemic have contributed to heightened levels of anxiety and stress. Moreover, the social isolation measures of epidemic prevention, including lockdowns, social distancing, and quarantine, have led to increased feelings of loneliness and isolation, contributing to depression. Therefore, we exclude 2020, the worst year of the epidemic. The results shown in column (2) of Table 5 indicate that even if the effects of the epidemic are excluded, air pollution still raises CES-D scores and has a negative impact on the mental health of middle-aged and older adults.
5.5 Comparing impacts across regions
Given the potential heterogeneity in PM2.5 concentration changes across different regions, we further stratify our sample into four major regions in China—Eastern, Central, Western, and Northeastern—to examine the impact of PM2.5 concentration on the mental health of middle-aged and older adults. However, due to the relatively small sample size in the Northeastern region (observations = 2,806), we focus our empirical analysis on the Eastern, Central, and Western regions. As depicted in Figures 1, 2, the Western regions experienced an increase in PM2.5 concentration from 2000 to 2020. In contrast, the Eastern region witnessed a significant decline in PM2.5 concentration over the same period. The results presented in Table 6 indicate that regions with more substantial pollution changes exhibit more pronounced negative impacts on mental health, thereby providing further evidence that air pollution is a significant contributing factor. Specifically, each unit increase in PM2.5 concentration is associated with a 0.0316-point increase in the CES-D score among middle-aged and older adults in the Western regions, respectively. Moreover, this differential impact across regions with varying pollution trends supports the argument that air pollution is a significant contributing factor to mental health outcomes.
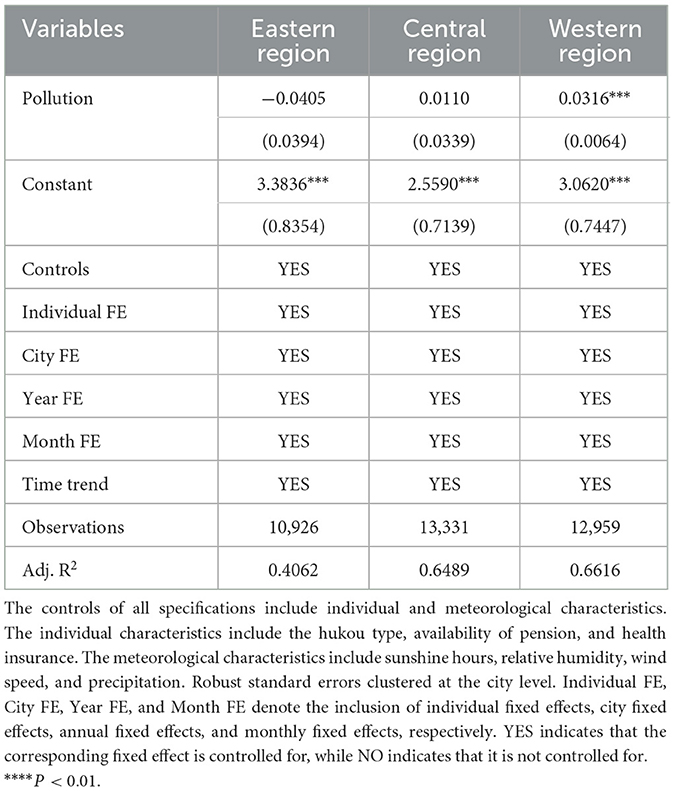
Table 6. Comparing impacts across regions.
5.6 Using alternative model specifications
Table 7 includes results for four more robustness checks using alternative model specifications. In column (1), we include year-month FE as a robust check. In column (2), we control for the city-month FE so that the estimated coefficients will be more accurate by accounting for potential omitted variable bias that varies across cities and over time. The results show that average air pollution affects mental health. Increases the CES-D score by 0.0347, indicating that a causal effect, large positive deviations from air pollution significantly deteriorate mental health. In column (3), we include the city-year FE as a robustness check. We aim to eliminate excessive variations in meteorological variables due to the data collection in the same city being usually conducted and focus on annual changes within each city. In column (4), we use the significance level of the estimates from the two-way clustering standard by city and interview month.
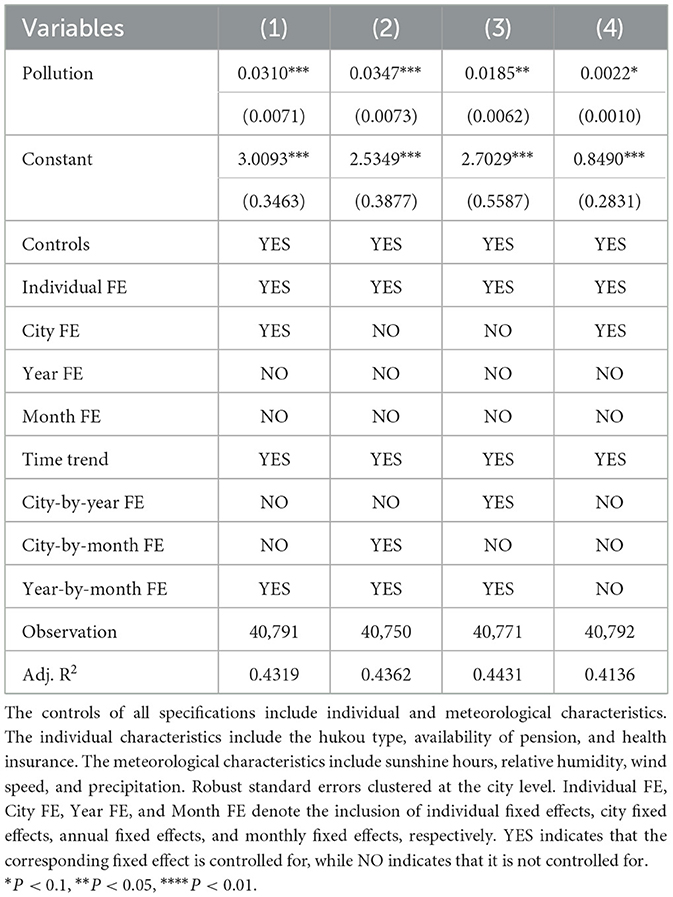
Table 7. A series of robustness checks: using alternative model specifications.
6 Heterogeneity analyses
To identify populations whose mental health is more vulnerable to air pollution, we investigate the heterogeneous effect of air pollution on depressive disorder among sample populations with different innate characteristics and acquired differences.
6.1 Heterogeneity by age
Some relevant literature pointed out that air pollution exposure may lead to a higher risk of depression later in life (50). We further divided the respondents into three groups: middle-aged (ages 45–60), older adults (ages 61–70), and old seniors (ages 71 and above), and conducted regression analyses for each group. Results in Table 8 indicate the heterogeneous effect of air pollution on mental health among different age groups. We find that middle-aged and older seniors are more susceptible to the adverse effects of air pollution on their mental health. Furthermore, the marginal impact on the mental health of older seniors is slightly higher than that on middle-aged individuals. However, for individuals aged between 61 and 70, referred to as the older adults, the air pollution does not have significant effects on the CES-D scores. For middle-aged individuals, frequent social activities, commuting, and outdoor work increase their exposure to polluted environments, thus rendering them more susceptible to the adverse effects of air pollution. In contrast, older seniors are more likely to rely on family and social care, with lower levels of autonomy in daily living and weaker adaptive capacity to environmental changes, making them more vulnerable to the impacts of air pollution. Consequently, social and family support play more critical roles in the mental health of this age group.
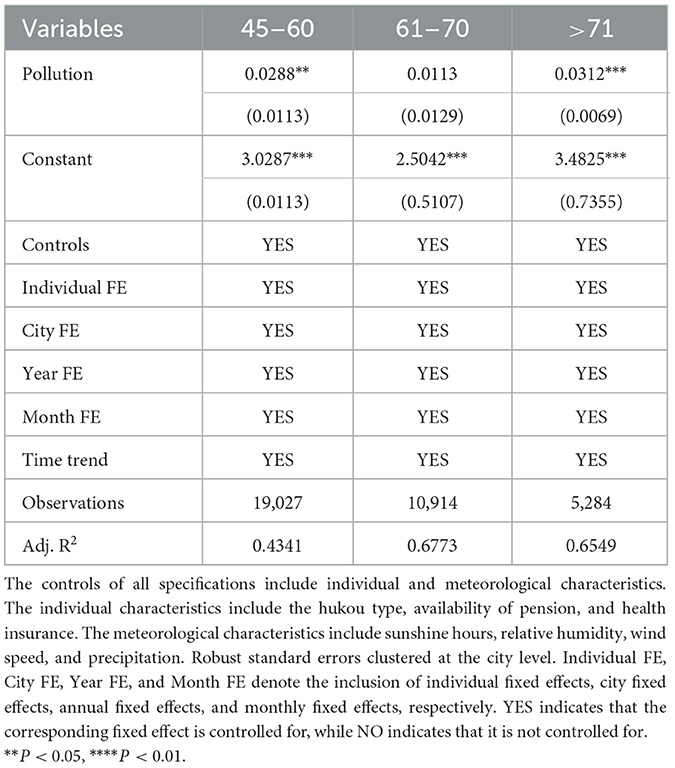
Table 8. Heterogeneous by age.
6.2 Heterogeneity by gender
Some studies suggest that the impact of air pollution on mental health has a significant modification by gender (51). Therefore, we proceed to examine the heterogeneous impact of air pollution on mental health between males and females. Results in column (1) of Table 9 show that males are more prone to mental illness induced by air pollution than females. The observed gender disparity may stem from several interrelated factors. Behaviorally, due to occupational differences, men are often more exposed to polluted environments. Furthermore, psychological literature suggests that men are less likely to seek emotional support, potentially exacerbating pollutant-induced stress effects.
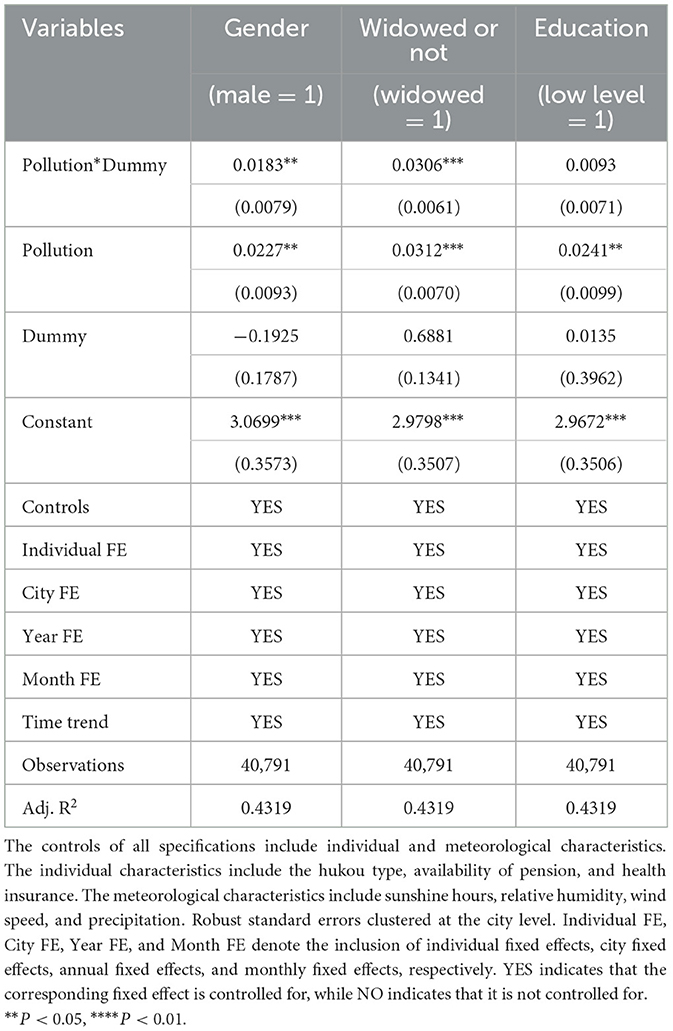
Table 9. Heterogeneity analyses by gender, marital status (widowed or not), and education level.
6.3 Widowed or not
The psychological state of widowed older adults can indeed be more fragile compared to their married or non-widowed counterparts (52). This fragility may stem from the significant emotional loss and the subsequent adjustment to life without their spouse, which can profoundly impact their mental health. Results in column (2) of Table 9 show that the widowed older adults are more susceptible to the effects of air pollution on mental health.
6.4 Heterogeneity by education level
Education may equip individuals with more knowledge on how to cope with air pollution (53). The survey population in CHARLS was mostly born in the 1970s, when educational attainment was generally low. Based on this, we next define a dummy variable of low educational attainment based on the 9-year compulsory education in the interviewers. Respondents who have obtained at least 9 years of education are classified into the higher education group, and those with < 9 years of education are classified into the lower education group. Results are displayed in column (3) of Table 9. We find that educational level does not significantly moderate the impact of air pollution on the mental health of middle-aged and older adults. Existing evidence suggests that air pollution impacts mental health primarily through biological mechanisms, including neuroinflammation, oxidative stress, and hypothalamic–pituitary–adrenal (HPA) axis dysregulation, that are independent of conscious awareness or behavioral mediation (54). Furthermore, physiological vulnerabilities associated with aging, such as increased prevalence of chronic diseases, may reduce the differential protective effects of education across exposure groups. Notably, individuals with higher education levels may exhibit greater environmental risk perception and awareness, potentially increasing psychological stress or anxiety related to pollution exposure (55). Consequently, educational attainment may not significantly moderate the relationship between air pollution exposure and mental health outcomes in the older adults population.
7 Underlying mechanisms
7.1 Sleep quality
Existing literature has suggested that air pollution exposure impairs physical health, which can lead to deteriorating mental health (56). Specifically, air pollution exposure may also change an individual's lifestyle and health behaviors. Studies have shown that exposure to higher concentrations of particulate matter (PM2.5) is associated with poor sleep quality (57). Notably, poor sleep quality is associated with an increased risk of mental health issues. Poor and insufficient sleep increases negative emotional responses to stressors, decreases positive emotions, and may exacerbate psychiatric symptoms (58).
Scientific studies recommend that older adults, typically those aged 65 and older, should aim for 7–8 h of sleep per night (59). However, we take individual variations into account. Specifically, some older adults may feel natural and energized waking up after 6 h of sleep, while others may need up to 9 h of sleep to feel rejuvenated. Moreover, CHARLS collects information on the duration of sleep at night over the past month. Based on this information, we construct a sleep quality indicator (sleep) based on their sleep duration, i.e., if a respondent sleeps more than 6 h and < 9 h during the night, we consider that he/she has good sleep quality, which takes the value of 1. Otherwise, it is equal to zero. Further, we divide the sample into two groups: the middle-aged group (45–65) and the older adult group (>65). We next estimated whether air pollution affects the status of individual health behaviors and sleep quality using a linear probability model. Results are displayed in column (1) and column (2) of Table 10. The air pollution exposure has a significant negative impact on older adults, but not on the middle-aged group (45–65 years old), suggesting that severe air pollution impairs sleep quality and affects the lifestyles of older adults. Poor sleep quality, in turn, can negatively impact mental health, leading to increased anxiety and depression.
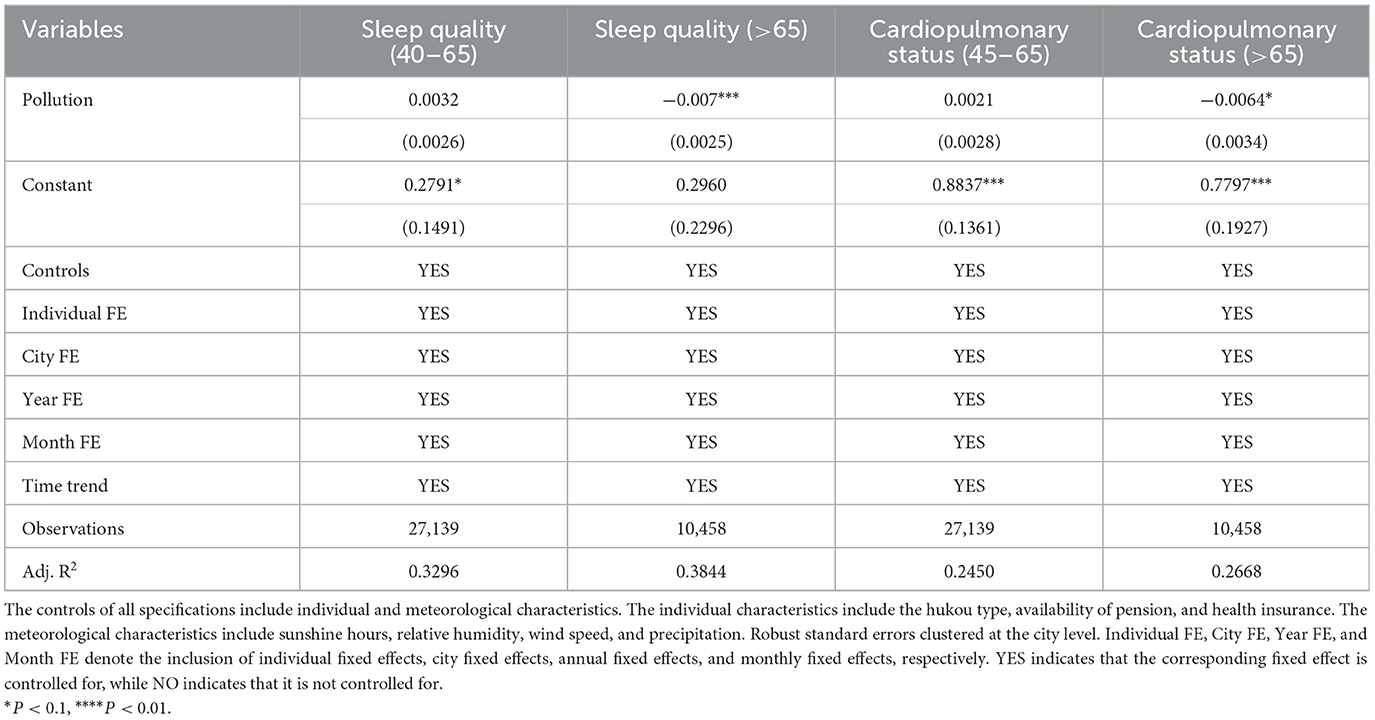
Table 10. Mechanisms underlying the depressive effects of PM2.5: sleep quality and cardiopulmonary status.
7.2 Individual cardiopulmonary health status
Existing literature suggests that air pollution impairs physical health, which can lead to deteriorating mental health (60). We estimate whether air pollution affects the cardiopulmonary health status of individuals. Based on this, CHARLS asks each interviewee whether they feel chest pain when climbing stairs (uphill) or walking quickly, which is usually used to assess cardiopulmonary health conditions. We define a dummy variable of individual cardiopulmonary health status that he/she feels well in the chest and walks quickly, which takes the value of 1. Otherwise, it is equal to zero. We estimate the effects of air pollution on this dummy variable using a linear probability model and differentiate the effects between the middle-aged and older adults. The primary findings are presented in columns (3) and (4) of Table 10. Specifically, a one-unit increase in PM2.5 concentration is associated with a 0.0064 rise in the probability of cardiovascular and cerebrovascular deterioration among the older adult population. This suggests that even minor fluctuations in PM2.5 levels can exert a significant impact on the cardiopulmonary health of this vulnerable group. For older adults who already suffer from cardiovascular and cerebrovascular diseases, the heightened risk may lead to a higher likelihood of disease exacerbation. This, in turn, indicates that air pollution not only directly harms the cardiopulmonary health of older adults but also indirectly exacerbates their mental health status through the worsening of physical health conditions. However, the effect of air pollution on the cardiopulmonary health status of the middle-aged group is not significant.
7.3 Life satisfaction
Air pollution has been found to impact life satisfaction negatively (61). A study explored the effect of ambient air pollution on individual levels of subjective wellbeing. This suggests that even relatively low levels of PM10 air pollution can adversely affect people's subjective assessments of well-being and its effects on physical health.
Based on this, we estimate the implication of air pollution on self-reported subjective wellbeing. The CHARLS asked each respondent about their recent life satisfaction. The self-reported future confidence is a discrete numerical variable that takes integer values from 1 to 5. Scoring values are as follows: completely satisfied, very satisfied, somewhat satisfied, not at all satisfied. The mean reported life satisfaction in the survey is 2.82 out of 5. The results are in columns (1) and (2) of Table 11. A one standard deviation rise in PM2.5 concentration results in a decrease of 0.034 units in life satisfaction, which means a decline in an individual's overall sense of wellbeing and contentment with life. Hence, it is crucial to improve air quality to enhance the quality of life for older adults. High PM2.5 concentrations can render the air turbid and reduce visibility, thereby restricting outdoor activities for older adults. This diminishes their comfort and convenience in daily life.
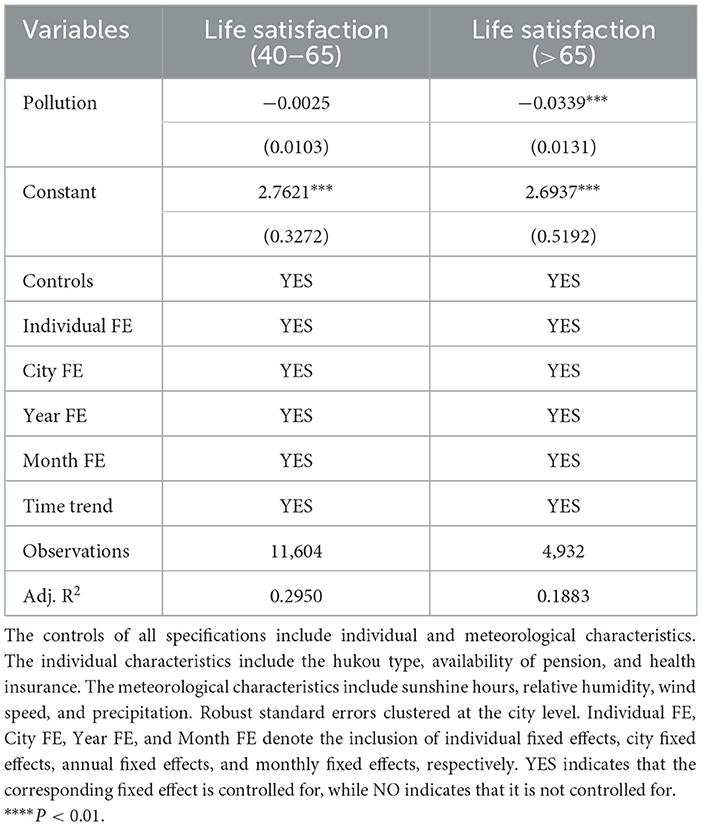
Table 11. Mechanisms underlying the depressive effects of PM2.5: life satisfaction.
7.4 Cognitive competence
Cognitive ability predicts health outcomes, academic achievement, and mental health. Therefore, we try to figure out the effect of air pollution exposure on human cognition. This has significant implications for multiple areas of policy. The scope of cognitive evaluation includes date recognition ability, numeracy, and situational memory capacity (62). Specifically, in the assessment of date recognition, respondents were asked to answer the current day of the week, date, month, season, and year, with each correct answer earning 1 point, for a total of five points. In the numeracy assessment, respondents were asked to answer 100 minus 7, with five consecutive subtractions, where 1 point was awarded for each correct answer, totalling 5 points. In the assessment of drawing ability, the respondent draws the picture that they have seen and scores 1 point for a successful drawing. The assessment has a total score of 11, with higher scores representing greater cognitive ability. The results are displayed in columns (1) and (2) of Table 12. A one standard deviation increase in PM2.5 concentration is associated with a decrease in cognitive ability scores by 3.0361 for middle-aged individuals yet exhibits no significant impact on older adults. We found that air pollution impairs cognitive performance in both middle-aged and older age groups, but to a greater extent in older adults than in middle-aged adults.
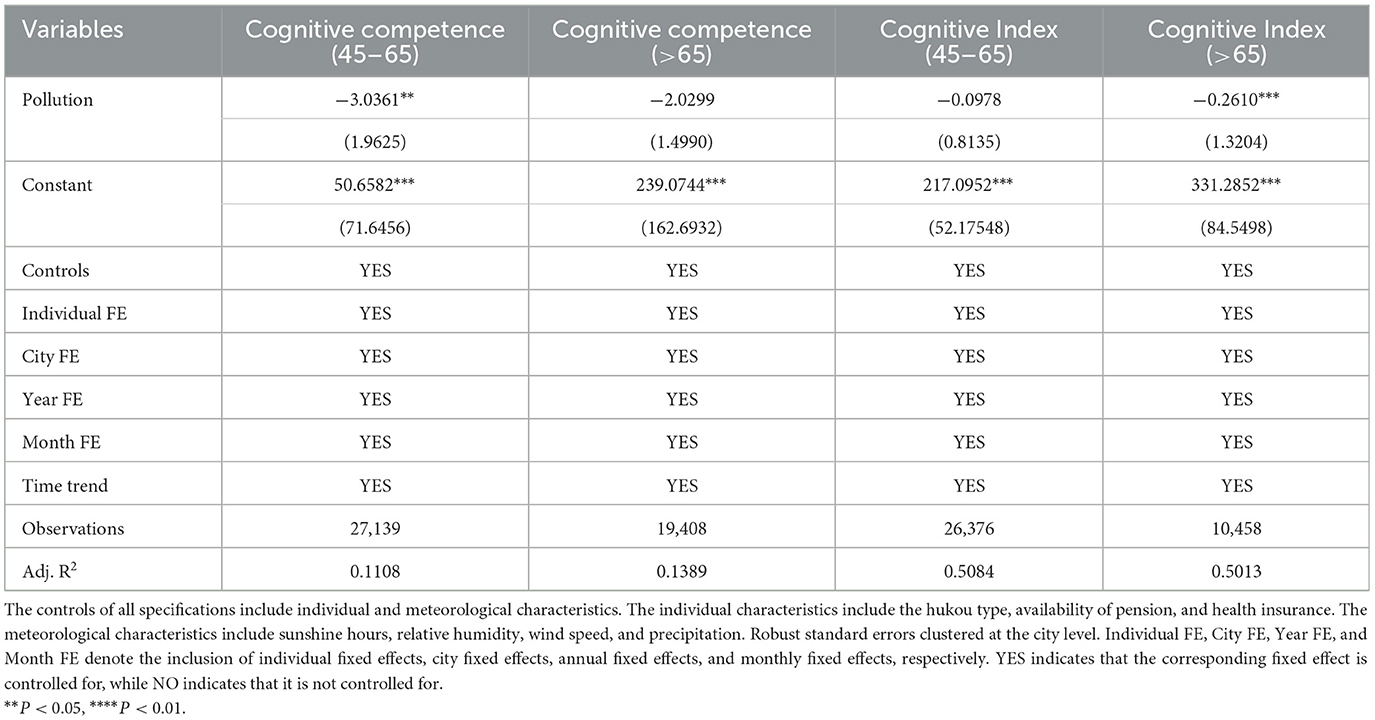
Table 12. Mechanisms underlying the depressive effects of PM2.5: cognitive competence.
Further, we construct an indicator of cognitive ability in the following Equation 3. CogIndex is the proportion of the overall number of indicators in which an individual has a health risk for each of the given health indicator ratings (63),
Where CogIndexi is the cognitive ill-health index. N is the total score of the cognitive health index variable (in our research, N = 11). Dij is the value corresponding to the jth variable reflecting the cognitive health ability of an individual i. Dij = 1 means the jth cognitive ability variable is healthy. Dij = 0 means that the jth cognitive ability variable is in a state of health risk. Therefore, the larger value of CogIndexi indicates that the individual's cognitive ability is more excellent. The results are presented in columns (3) and (4) of Table 12. A one standard deviation increases in PM2.5 concentration is associated with a 0.3307 reduction in the cognitive index for older adults. Our findings suggest that exposure to air pollution is correlated with cognitive decline, which is further associated with an elevated risk of depression, particularly for older adults. Meanwhile, relevant studies have indicated that individuals exhibiting higher levels of depressive symptoms at the initial stage tend to experience a more pronounced cognitive decline over time, suggesting a bidirectional relationship (64, 65). This finding underscores the complexity of the interplay between air pollution, cognitive function, and mental health. The bidirectional relationship between cognitive decline and depression has important implications for understanding the impact of air pollution on mental health. While our study primarily focused on cognitive decline as a mechanism linking air pollution to depression, the reverse pathway from depression to cognitive decline cannot be ignored.
8 Further analyses: How to minimize health risks from air pollution
8.1 Private avoidance behaviors
The high internet and mobile phone penetration in China provides a great opportunity to investigate pollution information using digital sources. The network significantly expands access to pollution information and elevates people's awareness about pollution issues. This information sharing may influence the avoidance behaviors of individuals who can take action. Like Google Trends, the Baidu Index is a data analysis tool provided by Baidu, the most widely used search engine in China. It allows users to see the research frequency of specific keywords in each city over a specified period since 2011. We focus on the search index for “haze pollution,” the internet catchphrase for air pollution, to illustrate personal access to the pollution information.
We estimate the moderating effects of private avoidance behaviors on the impact of air pollution on mental health. The results are shown in columns (1) and (2) of Table 12. The wider personal access to pollution-related information, the more effective they can be in counteracting the damage to mental health caused by air pollution, both for middle-aged and older adults. The results were not statistically significant for older adults. We assume that it may be related to the older population's lower proficiency in Internet use.
8.2 The filtering effect of urban vegetation density
Vegetation, especially trees and shrubs, can act as a natural air filter. They capture particulate matter on their leaves and surfaces, which helps to reduce the concentration of these particles in the air. Hence, we estimate the filtering effect of urban vegetation density (we call the urban forest).5 We use the NDVI indicator (normalized difference vegetation index), which is a graphical indicator used to analyze remote sensing measures of vegetation density to measure whether a city is an urban forest city and investigate the modifying role of greenness.
The formula for NDVI is:
Where NIR is the near-infrared light reflected by vegetation, and RED is the visible light reflected. NDVI values range from −1 to +1. Healthy vegetation can reflect a lot of near-infrared light (NIR) and absorb most infrared light (RED). Based on this, a high value (closer to +1) indicates high green, healthy vegetation concentrations, while lower values (closer to −1) indicate sparse or unhealthy vegetation or non-vegetative surfaces.
The NDVI data are obtained from the NASA Moderate Resolution Imaging Spectroradiometer (MODIS) product MOD13Q1.061, which provides vegetation indices at a spatial resolution of 1 km. We obtained monthly data based on when and where respondents were interviewed. We further matched the data with the NDVI values of the respondents' locations at the time of the survey. It is generally accepted that an NDVI value above 0.6 indicates that the location is rich in vegetation and appears very green.6 Further, we defined a dummy variable for urban forest cities, where a value of 1 indicates that the NDVI value in the area is above 0.6 (i.e., the area has dense vegetation), and a value of 0 indicates otherwise. We examined the interactions of this variable with urban air quality variables. The results are displayed in columns (3) and (4) of Table 13; compared with those interviewees in non-urban forest cities, respondents are less mentally impaired by air pollution. The improvement of mental health for older adults is more pronounced than for the middle-aged. The evidence points out that greenness, as a nature-based intervention, can mitigate the residential air pollution of physiological stress.
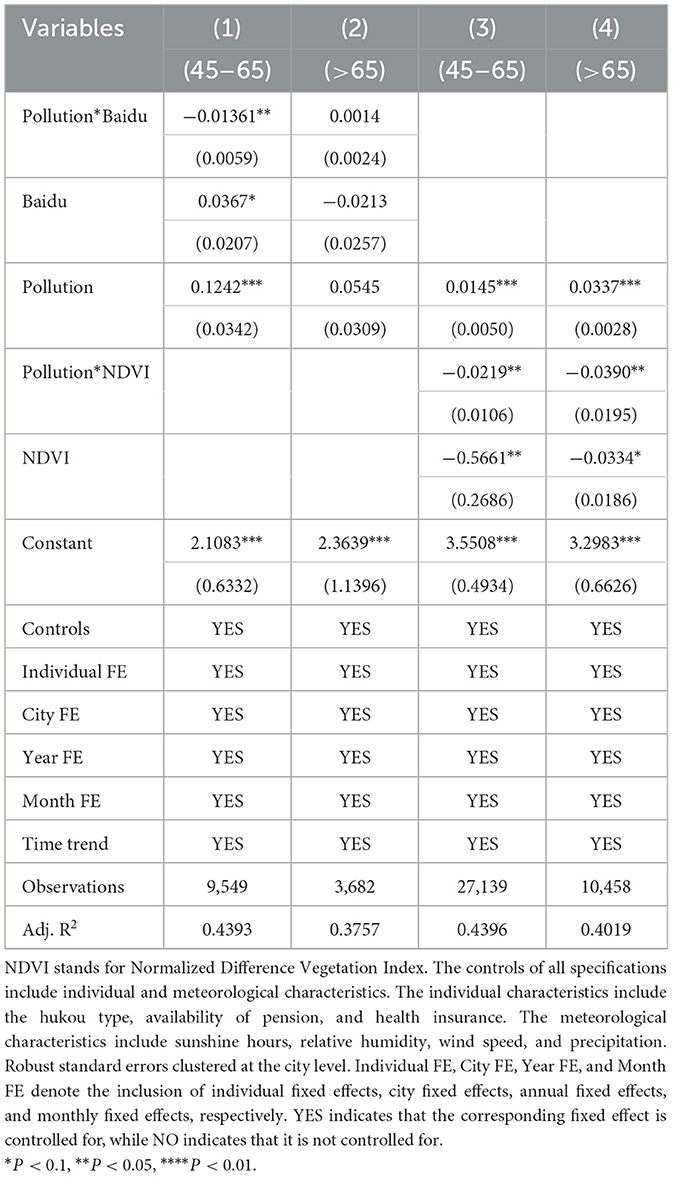
Table 13. The moderating effects of air pollution exposure: private avoidance behaviors and urban vegetation density.
Furthermore, we have conducted additional calculations to explore the marginal effect of high vegetation density (i.e., NDVI = 1) on the CES-D scores of middle-aged and older adults under varying concentrations of PM2.5. As illustrated in Figure 6, which presents the marginal effects of the interaction term, the influence of high vegetation density on the marginal effect of PM2.5 on the CES-D scores of middle-aged and older adults persists as PM2.5 concentrations increase. This effect significantly mitigates the CES-D scores, thereby improving psychological health status, although the magnitude of change is not substantial. These findings further verify the notion that a higher degree of greening can effectively ameliorate the impact of air pollution on the mental health of the middle-aged and older adults.
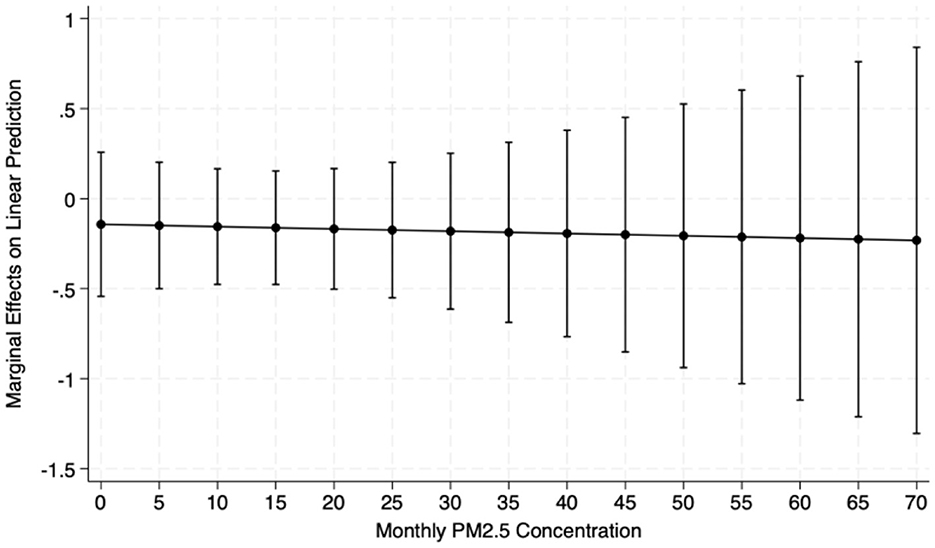
Figure 6. Marginal effects of NDVI on CES-D. The NDVI stands for Normalized Difference Vegetation Index. This figure presents the marginal effects of the interaction term (NDVI*Pollution). The influence of high vegetation density on the marginal impact of PM2.5 on the CES-D scores of middle-aged and older adults persists as PM2.5 concentrations increase.
9 Conclusions
Nearly 14% of the global burden of disease has been attributed to chronic depression and other common mental disorders (66). Mental disorders have become a severe threat to public health around the globe. In our paper, we explore the impacts of air pollution on mental health among middle-aged and older adults by applying the high-quality Chinese middle-aged and older adults survey database. We ensure the identification of the external variation in air pollution within an individual after meteorological characteristics, individual characteristics, a series of fixed effects, and common time trends.
The heterogeneous analyses on the mental health effects of air pollution help to identify more vulnerable populations. Females are more vulnerable than males to the effects of air pollution on their mental health conditions. Understanding these gender differences is crucial for developing targeted interventions and policies to protect and improve mental health in the face of increasing air pollution worldwide. Both middle-aged and older adults are susceptible to air pollution. However, the effect of air pollution on the oldest-old is not significant, possibly due to limited mobility and less time for outdoor activities. Widowed individuals are affected more than married ones, which complements the existing literature that air pollution imposes a far-reaching influence on mentally relevant costs for the widowed. The compounded stress of widowhood and exposure to air pollution can exacerbate mental health issues in this population.
Regarding the underlying mechanisms, we consider the differences in somatic functions and differentiate between the middle-aged and older adults. Air pollution is found to significantly reduce the length of sleep at night and life satisfaction among older adults. The cardiopulmonary health status of the aged, likely affected by air pollution, becomes worse. Air pollution significantly reduces cognitive performance in middle-aged and older adults, which is also corroborated by some literature (67). Furthermore, we continue to analyze people's avoidance behaviors for air pollution, including vegetation shielding and information retrieval. We found that the lusher vegetation in urban areas, which usually means a higher NDVI value, can effectively filter out part of the air pollutants and increase psychological wellbeing. Expanding access to information on air pollution can also help people take timely measures to avoid air pollution. Policymakers should prioritize increasing tree coverage in polluted districts, as vegetation can act as a natural barrier to filter out air pollutants and enhance psychological wellbeing. Mandating green buffer zones around older adults communities could provide a protective environment for this vulnerable population. Additionally, enhancing targeted mental health interventions for women and widowed persons is essential to address the disproportionate impacts of air pollution on their mental health. Expanding access to air pollution information and promoting public awareness campaigns can empower individuals to take timely measures to avoid exposure.
Exploring the impact of air pollution on mental health deepens our understanding of the socioeconomic consequences of climate change. While our study is based on a Chinese dataset, the findings have broader implications for other aging societies worldwide. The increasing prevalence of mental health issues among middle-aged and older adults, coupled with the growing threat of air pollution, is a global concern. Our results highlight the importance of integrating mental health considerations into air pollution control measures, such as emission reductions, the implementation of green infrastructure, and strategic urban planning. Additionally, evaluating the influence of public health policies and regulations on diminishing air pollution levels and enhancing overall population health outcomes is critical. We consider that there are important issues for future research. Furthermore, the geographic distribution of the survey participants in our study may not align perfectly with regions experiencing substantial increases in PM2.5 levels. This aspect could influence the spatial applicability of our results. Future studies could further enhance the external validity by ensuring a participant sample that more closely mirrors the demographics of areas with significant PM2.5 exposure changes.
Data availability statement
The original contributions presented in the study are included in the article/supplementary material, further inquiries can be directed to the corresponding author.
Author contributions
XZ: Writing – review & editing, Writing – original draft. YH: Writing – original draft, Writing – review & editing. HL: Writing – review & editing, Funding acquisition, Writing – original draft.
Funding
The author(s) declare that financial support was received for the research and/or publication of this article. APC was funded by the University of Bath Institutional Open Access Fund.
Conflict of interest
The authors declare that the research was conducted in the absence of any commercial or financial relationships that could be construed as a potential conflict of interest.
Generative AI statement
The author(s) declare that no Gen AI was used in the creation of this manuscript.
Publisher's note
All claims expressed in this article are solely those of the authors and do not necessarily represent those of their affiliated organizations, or those of the publisher, the editors and the reviewers. Any product that may be evaluated in this article, or claim that may be made by its manufacturer, is not guaranteed or endorsed by the publisher.
Footnotes
1. ^The website is https://www.cnemc.cn.
2. ^The website is: https://sites.wustl.edu/acag/datasets/surface-pm2-5/.
3. ^Given the serious lack of income data, we use the possession of a pension as a measure of financial security for the middle-aged and older adults. If a person has one or more of these types of pensions, we consider him/ her to have pension. They include pension for public servants, public institution employees, and basic pension for enterprise employees; supplementary pension insurance(annuity); urban and rural resident pension, new rural resident pension and urban resident pension; pension for land-expropriated farmers; life insurance; commercial pension insurance and other pension.
4. ^If a person has one or more of these nine types of medical insurance, we consider him/her to have medical insurance. They include urban employee medical insurance; urban resident medical insurance; new cooperative medical insurance (it's also called he-zuo-yi-liao); urban and rural resident medical insurance; government medical insurance (it's also called gong-fei); medical aid; private medical insurance: purchased by work unit; Private medical insurance: purchased by individual; urban non-employed person's health insurance; other medical insurance(specify).
5. ^The urban forests refer to the collection of trees and other vegetation with urban areas, which are valuable components of the urban environment.
6. ^https://climatedataguide.ucar.edu/climate-data/ndvi-normalized-difference-vegetation-index-noaa-avhrr
References
1. Bonadiman CSC, Malta DC, de Azeredo Passos VM, Naghavi M, Melo APS. Depressive disorders in Brazil: results from the Global Burden of Disease Study 2017. Popul Health Metr. (2020) 18:1–13. doi: 10.1186/s12963-020-00204-5
2. Layard R, Chisholm D, Patel V, Saxena S. Mental Illness and Unhappiness. (2013). doi: 10.2139/ssrn.2336397
3. Rissanen T, Viinamäki H, Honkalampi K, Lehto SM, Hintikka J, Saharinen T, et al. Long term life dissatisfaction and subsequent major depressive disorder and poor mental health. BMC Psychiatry. (2011) 11:1–6. doi: 10.1186/1471-244X-11-140
4. Kupferberg A, Bicks L, Hasler G. Social functioning in major depressive disorder. Neurosci Biobehav Rev. (2016) 69:313–32. doi: 10.1016/j.neubiorev.2016.07.002
5. Hendriks SM, Spijker J, Licht CM, Hardeveld F, de Graaf R, Batelaan NM, et al. Long-term work disability and absenteeism in anxiety and depressive disorders. J Affect Disord. (2015) 178:121–30. doi: 10.1016/j.jad.2015.03.004
6. Dewa CS, Thompson AH, Jacobs P. The association of treatment of depressive episodes and work productivity. Can J Psychiatry. (2011) 56:743–50. doi: 10.1177/070674371105601206
7. Andreeva E, Magnusson Hanson LL, Westerlund H, Theorell T, Brenner MH. Depressive symptoms as a cause and effect of job loss in men and women: evidence in the context of organizational downsizing from the Swedish Longitudinal Occupational Survey of Health. BMC Public Health. (2015) 15:1–11. doi: 10.1186/s12889-015-2377-y
8. Dell NA, Pelham M, Murphy AM. Loneliness and depressive symptoms in middle-aged and older adults experiencing serious mental illness. Psychiatr Rehabil J. (2019) 42:113. doi: 10.1037/prj0000347
9. Cai H, Jin Y, Liu R, Zhang Q, Su Z, Ungvari GS, et al. Global prevalence of depression in older adults: a systematic review and meta-analysis of epidemiological surveys. Asian J Psychiatr. (2023) 80:103417. doi: 10.1016/j.ajp.2022.103417
10. Kelly FJ, Fussell JC. Air pollution and public health: emerging hazards and improved understanding of risk. Environ Geochem Health. (2015) 37:631–49. doi: 10.1007/s10653-015-9720-1
11. Gouveia N, Rodriguez-Hernandez JL, Kephart JL, Ortigoza A, Betancourt RM, Sangrador JLT, et al. Short-term associations between fine particulate air pollution and cardiovascular and respiratory mortality in 337 cities in Latin America. Sci Total Environ. (2024) 171073. doi: 10.1016/j.scitotenv.2024.171073
12. Shah AS, Lee KK, McAllister DA, Hunter A, Nair H, Whiteley W, et al. Short term exposure to air pollution and stroke: systematic review and meta-analysis. BMJ. (2015) 350:h1295. doi: 10.1136/bmj.h1295
13. Kampa M, Castanas E. Human health effects of air pollution. Environ Pollut. (2008) 151:362–7. doi: 10.1016/j.envpol.2007.06.012
14. Sullivan DM. The True Cost of Air Pollution: Evidence from the Housing Market. Washington, DC: Resources for the Future (2017).
15. Qiu Y, Yang F-A, Lai W. The impact of indoor air pollution on health outcomes and cognitive abilities: empirical evidence from China. Popul Environ. (2019) 40:388–410. doi: 10.1007/s11111-019-00317-6
16. Mostafavi N, Vlaanderen J, Chadeau-Hyam M, Beelen R, Modig L, Palli D, et al. Inflammatory markers in relation to long-term air pollution. Environ Int. (2015) 81:1–7. doi: 10.1016/j.envint.2015.04.003
17. Min J, Min K. Exposure to ambient PM10 and NO2 and the incidence of attention-deficit hyperactivity disorder in childhood. Environ Int. (2017) 99:221–7. doi: 10.1016/j.envint.2016.11.022
18. Fajersztajn L, Veras M, Barrozo LV, Saldiva P. Air pollution: a potentially modifiable risk factor for lung cancer. Nat Rev Cancer. (2013) 13:674–8. doi: 10.1038/nrc3572
19. Ostro BD. The effects of air pollution on work loss and morbidity. J Environ Econ Manage. (1983) 10:371–82. doi: 10.1016/0095-0696(83)90006-2
20. Fu S, Viard VB, Zhang P. Air pollution and manufacturing firm productivity: nationwide estimates for China. Econ J. (2021) 131:3241–73. doi: 10.1093/ej/ueab033
21. Balakrishnan U, Tsaneva M. Air pollution and academic performance: evidence from India. World Dev. (2021) 146:105553. doi: 10.1016/j.worlddev.2021.105553
22. Cui J, Huang S, Wang C. The impact of air quality on innovation activities in China. J Environ Econ Manage. (2023) 122:102893. doi: 10.1016/j.jeem.2023.102893
23. Trushna T, Dhiman V, Raj D, Tiwari R. Effects of ambient air pollution on psychological stress and anxiety disorder: a systematic review and meta-analysis of epidemiological evidence. Rev Environ Health. (2021) 36:501–21. doi: 10.1515/reveh-2020-0125
24. Zhang X, Chen X, Zhang X. The impact of exposure to air pollution on cognitive performance. Proc Nat Acad Sci. (2018) 115:9193–7. doi: 10.1073/pnas.1809474115
25. Xue T, Zhu T, Zheng Y, Zhang Q. Declines in mental health associated with air pollution and temperature variability in China. Nat Commun. (2019) 10:2165. doi: 10.1038/s41467-019-10196-y
26. Vert C, Sánchez-Benavides G, Martínez D, Gotsens X, Gramunt N, Cirach M, et al. Effect of long-term exposure to air pollution on anxiety and depression in adults: a cross-sectional study. Int J Hyg Environ Health. (2017) 220:1074–80. doi: 10.1016/j.ijheh.2017.06.009
27. Braithwaite I, Shuo Z, Kirkbride JB, Osborn DPJ, Hayes JF. Air pollution (particulate matter) exposure and associations with depression, anxiety, bipolar, psychosis and suicide risk: a systematic review and meta-analysis. Environ Health Perspect. (2019) 127:126002. doi: 10.1289/EHP4595
28. Rosenfield S, Mouzon D. Gender and mental health. In:Aneshensel CS, Phelan JC, Bierman A, , editors. Handbook of the Sociology of Mental Health. Dordrecht: Springer (2013). p. 277–96. doi: 10.1007/978-94-007-4276-5_14
29. Cornaglia F, Crivellaro E, McNally S. Mental health and education decisions. Labour Econ. (2015) 33:1–12. doi: 10.1016/j.labeco.2015.01.005
30. Brown TN, Sellers SL, Brown KT, Jackson JS. Race, ethnicity, and culture in the sociology of mental health. In:Aneshensel CS, Phelan JC, , editors. Handbook of the Sociology of Mental Health. (1999) 167–82. doi: 10.1007/0-387-36223-1_9
31. Ferreira VR, Jardim TV, Sousa ALL, Rosa BMC, Jardim PCV. Smoking, alcohol consumption and mental health: data from the Brazilian study of Cardiovascular Risks in Adolescents (ERICA). Addict Behav Rep. (2019) 9:100147. doi: 10.1016/j.abrep.2018.100147
32. Webber M, Fendt-Newlin M. A review of social participation interventions for people with mental health problems. Soc Psychiatry Psychiatr Epidemiol. (2017) 52:369–80. doi: 10.1007/s00127-017-1372-2
33. Raphael D, editor. Social structure, living conditions, and health. In: Social Determinants of Health: Canadian Perspectives. Toronto, ON: Canadian Scholara' Press (2009) 20–36.
34. Dustmann C, Fasani F. The effect of local area crime on mental health. Econ J. (2016) 126:978–1017. doi: 10.1111/ecoj.12205
35. Paul KI, Moser K. Unemployment impairs mental health: meta-analyses. J Vocat Behav. (2009) 74:264–82. doi: 10.1016/j.jvb.2009.01.001
36. Wildman J. Income related inequalities in mental health in Great Britain: analysing the causes of health inequality over time. J Health Econ. (2003) 22:295–312. doi: 10.1016/S0167-6296(02)00101-7
37. Ebenstein A, Fan M, Greenstone M, He G, Yin P, Zhou M. Growth, pollution, and life expectancy: China from 1991–2012. Am Econ Rev. (2015) 105:226–31. doi: 10.1257/aer.p20151094
38. Chen SM, He LY. Welfare loss of China's air pollution: how to make personal vehicle transportation policy. China Econ Rev. (2014) 31:106–18. doi: 10.1016/j.chieco.2014.08.009
39. Lobanov-Rostovsky S, He Q, Chen Y, Liu Y, Wu Y, Liu Y, et al. Growing old in China in socioeconomic and epidemiological context: systematic review of social care policy for older people. BMC Public Health. (2023) 23:1272. doi: 10.1186/s12889-023-15583-1
40. Tang T, Jiang J, Tang X. Prevalence of depressive symptoms among older adults in mainland China: a systematic review and meta-analysis. J Affect Disord. (2021) 293:379–90. doi: 10.1016/j.jad.2021.06.050
41. Cui L, Ding D, Chen J, Wang M, He F, Yu S. Factors affecting the evolution of Chinese elderly depression: a cross-sectional study. BMC Geriatr. (2022) 22:109. doi: 10.1186/s12877-021-02675-z
42. Zhao Y, Hu Y, Smith JP, Strauss J, Yang G. Cohort profile: the China health and retirement longitudinal study (CHARLS). Int J Epidemiol. (2014) 43:61–8. doi: 10.1093/ije/dys203
43. Radloff LS. The CES-D scale: a self-report depression scale for research in the general population. Appl Psychol Meas. (1977) 1:385–401. doi: 10.1177/014662167700100306
44. Chen H, Mui AC. Factorial validity of the Center for Epidemiologic Studies Depression Scale short form in older population in China. Int Psychogeriatr. (2014) 26:49–57. doi: 10.1017/S1041610213001701
45. Deschenes O, Greenstone M, Shapiro JS. Defensive investments and the demand for air quality: evidence from the NOx budget program. Am Econ Rev. (2017) 107:2958–89. doi: 10.1257/aer.20131002
46. Zhang T, Yan B, Henneman L, Kinney P, Hopke PK. Regulation-driven changes in PM2.5 sources in China from 2013 to 2019: a critical review and trend analysis. Sci Total Environ. (2024) 934:173091. doi: 10.1016/j.scitotenv.2024.173091
47. Raskin A, Schulterbrandt J, Reatig N, McKeon JJ. Replication of factors of psychopathology in interview, ward behavior and self-report ratings of hospitalized depressives. J Nerv Ment Dis. (1969) 148:87–98. doi: 10.1097/00005053-196901000-00010
48. Ferrara EL, Chong A, Duryea S. Soap operas and fertility: evidence from Brazil. Am Econ J Appl Econ. (2012) 4:1–31. doi: 10.1257/app.4.4.1
49. Burnett CM, Kogan V. The politics of potholes: service quality and retrospective voting in local elections. J Polit. (2017) 79:302–14. doi: 10.1086/688736
50. Qiu X, Shi L, Kubzansky LD, Wei Y, Castro E, Li H, et al. Association of long-term exposure to air pollution with late-life depression in older adults in the US. JAMA Netw Open. (2023) 6:e2253668. doi: 10.1001/jamanetworkopen.2022.53668
51. Clougherty JE. A growing role for gender analysis in air pollution epidemiology. Environ Health Perspect. (2010) 118:167–76. doi: 10.1289/ehp.0900994
52. Wilcox S, Evenson KR, Aragaki A, Wassertheil-Smoller S, Mouton CP, Loevinger BL. The effects of widowhood on physical and mental health, health behaviors, and health outcomes: the Women's Health Initiative. Health Psychol. (2003) 22:513. doi: 10.1037/0278-6133.22.5.513
53. Kan H, London SJ, Chen G, Zhang Y, Song G, Zhao N, et al. Season, sex, age, and education as modifiers of the effects of outdoor air pollution on daily mortality in Shanghai, China: the Public Health and Air Pollution in Asia (PAPA) Study. Environ Health Perspect. (2008) 116:1183–8. doi: 10.1289/ehp.10851
54. Liu X, Li Y, Xie W, Hu M, Li S, Hu Y, et al. Long-term effects of fine particulate matter components on depression among middle-aged and elderly adults in China: a nationwide cohort study. J Affect Disord. (2024) 361:720–7. doi: 10.1016/j.jad.2024.06.066
55. Hou WH, Huang YC, Lu CY, Chen IC, Lee PC, Lin MY, et al. A national survey of ambient air pollution health literacy among adult residents of Taiwan. BMC Public Health. (2021) 21:1604. doi: 10.1186/s12889-021-11658-z
56. Tainio M, Andersen ZJ, Nieuwenhuijsen MJ, Hu L, De Nazelle A, An R, et al. Air pollution, physical activity and health: a mapping review of the evidence. Environ Int. (2021) 147:105954. doi: 10.1016/j.envint.2020.105954
57. Zhou P, Ma J, Li X, Zhao Y, Yu K, Su R, et al. The long-term and short-term effects of ambient air pollutants on sleep characteristics in the Chinese population: big data analysis from real world by sleep records of consumer wearable devices. BMC Med. (2023) 21:83. doi: 10.1186/s12916-023-02801-1
58. Scott AJ, Webb TL, Martyn-St James M, Rowse G, Weich S. Improving sleep quality leads to better mental health: a meta-analysis of randomised controlled trials. Sleep Med Rev. (2021) 60:101556. doi: 10.1016/j.smrv.2021.101556
59. Hirshkowitz M, Whiton K, Albert SM, Alessi C, Bruni O, DonCarlos L, et al. National Sleep Foundation's updated sleep duration recommendations: final report. Sleep Health. (2015) 1:233–43. doi: 10.1016/j.sleh.2015.10.004
60. Ohrnberger J, Fichera E, Sutton M. The relationship between physical and mental health: a mediation analysis. Soc Sci Med. (2017) 195:42–9. doi: 10.1016/j.socscimed.2017.11.008
61. Welsch H. Environment and happiness: valuation of air pollution using life satisfaction data. Ecol Econ. (2006) 58:801–13. doi: 10.1016/j.ecolecon.2005.09.006
63. Rockwood K, Song X, MacKnight C, Bergman H, Hogan DB, McDowell I, et al. A global clinical measure of fitness and frailty in elderly people. CMAJ. (2005) 173:489–95. doi: 10.1503/cmaj.050051
64. Forbes M, Lotfaliany M, Mohebbi M, Reynolds CF, Woods RL, Orchard S, et al. Depressive symptoms and cognitive decline in older adults. Int Psychogeriatr. (2024) 36:1039–50. doi: 10.1017/S1041610224000541
65. Yin J, John A, Cadar D. Bidirectional associations of depressive symptoms and cognitive function over time. JAMA Network Open. (2024) 7:e2416305. doi: 10.1001/jamanetworkopen.2024.16305
66. Prince M, Patel V, Saxena S, Maj M, Maselko J, Phillips MR, et al. No health without mental health. Lancet. (2007) 370:859–77. doi: 10.1016/S0140-6736(07)61238-0
67. Delgado-Saborit JM, Guercio V, Gowers AM, Shaddick G, Fox NC, Love S. A critical review of the epidemiological evidence of effects of air pollution on dementia, cognitive function and cognitive decline in adult population. Sci Total Environ. (2021) 757:143734. doi: 10.1016/j.scitotenv.2020.143734
Keywords: air pollution, mental health, older adults, CHARLS, vulnerable groups
Citation: Zou X, He Y and Lu H (2025) The hidden toll of air pollution: mental health effects on middle-aged and older adults. Front. Public Health 13:1610330. doi: 10.3389/fpubh.2025.1610330
Received: 14 April 2025; Accepted: 11 June 2025;
Published: 04 July 2025.
Edited by:
Tong Wang, Duke University, United StatesReviewed by:
Xue Wu, University of California, San Francisco, United StatesHan Feng, La Jolla Institute for Immunology (LJI), United States
Kexin Zhang, University of Massachusetts Medical School, United States
Wenfang Liu, The Ohio State University, United States
Shukun Yang, Johnson & Johnson, United States
Copyright © 2025 Zou, He and Lu. This is an open-access article distributed under the terms of the Creative Commons Attribution License (CC BY). The use, distribution or reproduction in other forums is permitted, provided the original author(s) and the copyright owner(s) are credited and that the original publication in this journal is cited, in accordance with accepted academic practice. No use, distribution or reproduction is permitted which does not comply with these terms.
*Correspondence: Haoyang Lu, aGwyNDM3QGJhdGguYWMudWs=