 Wenping Li
 Zhiyu Lv
 Mengdi Chen
 Dong Xia
 Jiayue Wang
 Jiapeng Chen2
- 1Department of Health Services, Naval Medical University, Shanghai, China
- 2China Population and Development Research Center, Beijing, China
Background: Leukemia remains a critical public health challenge in China’s post-poverty regions, where high treatment costs perpetuate the “disease-poverty” trap. Despite nationwide efforts to improve healthcare access, the evolving spatiotemporal dynamics and economic burden of leukemia in these regions remain understudied.
Methods: Using population-based data from China’s Health Poverty Alleviation Platform (2019–2024), we analyzed 97,472 leukemia cases across 832 poverty-alleviated counties. Age/sex-standardized incidence and mortality rates were calculated using 2020 census data. Spatiotemporal trends were evaluated via Joinpoint regression, and spatial clustering was mapped through global/local Moran’s I and Getis-Ord Gi* analyses. The economic burden was assessed by Out-Of-Pocket (OOP) payment ratios and costs.
Results: Longitudinal analysis of 97,472 leukemia cases across 832 Chinese poverty-alleviated counties (2019–2024) revealed: (1) Significant reductions in age-standardized incidence (AAPC = −59.4%, p = 0.015) and mortality (AAPC = −67.5%, p = 0.012), with persistently higher male incidence (χ2 = 1554.4, p < 0.001); (2) Spatiotemporal transition from Northeast/Central clustering (Moran’s I > 0.38, p < 0.001; 2019–2021) to Western hotspot expansion (Getis-Ord Gi*, p < 0.001; 2022–2024), indicative of improved diagnostic coverage; (3) Severe financial toxicity in Eastern China (median OOP ratio = 39.7%, approaching WHO catastrophic thresholds) and high absolute OOP cost clustering in Central regions, driven by therapy costs and insurance fragmentation.
Conclusion: While China’s poverty alleviation policies effectively reduced the leukemia burden, persistent regional disparities and financial toxicity demand targeted interventions. The westward hotspot migration post-2022 marks a diagnostic catch-up in resource-limited regions. Crucially, elevated male/youth incidence necessitates targeted screening in emerging clusters, while diverging financial toxicity demands region-specific solutions: for Eastern China’s catastrophic OOP ratios (39.7%), reform must prioritize novel-therapy reimbursement; Central China’s cost-clustering urges cross-provincial care networks to offset abandonment risks.
1 Introduction
Leukemia, a group of chronic malignant neoplastic diseases characterized by the uncontrolled proliferation of abnormal white blood cells, exerts profound and multifaceted impacts on patients-disrupting physical health, triggering psychological distress, and imposing heavy economic burdens (1, 2). As a major global public health challenge (3), its burden exhibits striking geographic heterogeneity, particularly in low- and middle-income settings where healthcare access remains constrained (4). In China, while the overall leukemia incidence is categorized as intermediate compared to global benchmarks (5), the disease’s distribution and impact in poverty-alleviated regions have long been underappreciated. This oversight is critical, as impoverished populations in these areas face a unique conundrum: limited access to primary care amplifies leukemia risk (4), and the disease itself acts as a potent driver of both persistent poverty and poverty recurrence-a “disease-poverty trap” that undermines the sustainability of China’s anti-poverty achievements.
China’s “Precision Poverty Reduction” strategy, launched in the late 2010s, marked a pivotal step in addressing health-related poverty. By reducing Out-Of-Pocket (OOP) medical expenses and curbing catastrophic healthcare costs, the policy significantly improved healthcare accessibility in impoverished counties (6). However, since China officially declared the elimination of absolute poverty in 2020, emerging evidence suggests that health-related financial burdens persist. Many families in poverty-alleviated regions still face the threat of returning to poverty due to high leukemia treatment costs. This highlights a critical gap between policy implementation and sustained health equity. Compounding this challenge, the epidemiological characteristics of leukemia in these newly poverty-free areas-including trends in incidence, mortality, and their spatiotemporal dynamics-have not been systematically quantified. Prior studies on Chinese leukemia burden have either focused on national or provincial scales (2, 5) or pre-poverty alleviation periods (4), leaving a void in understanding how the disease’s burden has evolved after the lifting of absolute poverty. Similarly, research on leukemia’s economic impact in these regions has been largely unidimensional, often focusing solely on OOP costs without integrating relative financial toxicity metrics (e.g., OOP ratios relative to household health expenditure), a limitation that obscures the true extent of economic vulnerability.
To fill these gaps, we conducted a multidimensional analysis of leukemia in 832 poverty-alleviated counties across China’s four major economic regions (Northeast, Central, East, and West) from 2019 to 2024. Leveraging population-based data from China’s Health Poverty Alleviation Big Data Platform-one of the largest datasets on post-poverty health outcomes to date-we analyzed 97,472 newly diagnosed leukemia cases. Our study aimed to address three core research questions: (1) How have leukemia incidence and mortality rates changed longitudinally in post-poverty counties, and do these trends differ by age, sex, or region? (2) What are the spatiotemporal dynamics of leukemia burden-including spatial clustering and regional shifts-across the study period? (3) How is the economic burden of leukemia (measured by both absolute OOP costs and relative OOP ratios) distributed across regions, and what factors drive these disparities?
2 Materials and methods
2.1 Data sources
Incidence and mortality data (2019–2024) were obtained from China’s Health Poverty Alleviation Big Data Platform, covering 832 counties officially removed from poverty registries(application required). Population denominators were adjusted using the 2020 Chinese National Census. County-level boundaries were sourced from the National Geomatics Center (Approval No. GS [2024]0650). The division of China’s four major economic regions (Northeast, Central, East, and West) was based on the Guiding Opinions of the Communist Party of China Central Committee and the State Council on Promoting Coordinated Regional Development.
2.2 Statistical methods
Time trends in leukemia incidence and mortality were analyzed using the Joinpoint regression model (Joinpoint Regression Program, Version 4.9.1.0, National Cancer Institute). Joinpoint regression is specifically designed to identify significant temporal turning points (joinpoints). These joinpoints refer to calendar years when the slope of a trend (e.g., incidence or mortality rate) exhibits a statistically significant change. The detection of such joinpoints indicates shifts in underlying disease dynamics, which may correlate with contextual factors including public health interventions or environmental exposures. To prevent model overfitting, we restricted the maximum number of turning points to two based on the sample size and study period of 6 years. The optimal number of turning points was determined through a permutation test (Permutation Test, 4,500 replications) at a significance level of α = 0.05. The Annual Percentage Change (APC) and the Average Annual Percentage Change (AAPC) were calculated for each period, with confidence intervals estimated through 10,000 Monte Carlo simulations. We compared different models with a maximum of three turning points (ranging from 0 to 3) and ultimately selected the model with the smallest Bayesian Information Criterion (BIC) value as the optimal solution.
Global spatial autocorrelation analysis was performed to examine the spatial distribution of three indicators: incidence rate, average out-of-pocket cost, and OOP ratio. This analysis used the ArcGIS 10.8 Spatial Statistics Toolkit, with a fixed bandwidth of 200 km and the Queen neighborhood criterion. We generated spatial distribution maps and optimized hotspot analysis maps. The significance of Moran’s I was evaluated via a 999-time Monte Carlo permutation test (α = 0.05).
Statistical methods employed included the chi-square test to assess differences in group incidence rates, with two-by-two comparisons adjusted using the Bonferroni method (α = 0.05). In accordance with the American Statistical Association guidelines, homogeneous subgroups were differentiated using superscript letters (a, b, c, d), where groups sharing common letters indicate no statistically significant difference (p ≥ 0.05).
2.3 Standardization
To ensure the comparability of leukemia incidence and mortality rates across different years, regions, age groups, and sexes-while accounting for variations in population structure (e.g., age/sex distribution differences among the 832 poverty-alleviated counties)-we applied direct standardization using the 2020 Chinese National Census data as the reference population. This approach eliminates the confounding effect of population composition, allowing for accurate temporal and spatial trend analyses of leukemia burden. Below are the key standardized metrics used in this study, along with their definitions and calculation formulas:
• Age-Standardized Incidence Rate (ASIR): A rate adjusted to a standard age distribution to reflect the incidence of leukemia that would be observed if different populations had the same age structure. It is used to compare leukemia incidence across groups with varying age compositions.
• Gender-Standardized Incidence Rate (GSIR): A rate adjusted to a standard sex distribution to compare leukemia incidence across populations with different male-to-female ratios.
• Age-Standardized Mortality Rate (ASMR): A mortality rate adjusted to a standard age distribution, enabling unbiased comparisons of leukemia mortality across groups with differing age structures.
• Gender-Standardized Mortality Rate (GSMR): A mortality rate adjusted to a standard sex distribution, used to compare leukemia mortality across populations with varying sex compositions.
λ: Standardized proportion according to the results of the 2020 Chinese National Census.
• Out-of-Pocket (OOP) Ratio: A relative indicator of financial burden, reflecting the proportion of a household’s total health expenditure allocated to leukemia-specific direct medical costs. It helps assess the relative economic pressure of leukemia treatment on households, with values approaching or exceeding the World Health Organization (WHO) defined catastrophic threshold (40%), indicating severe financial toxicity.
• Out-of-Pocket (OOP) cost: Sum of direct medical expenditures (including diagnostics, medication, hospitalization) within leukemia-specific episodes, excluding non-health consumption. Only direct medical costs were captured; indirect costs (e.g., income loss, caregiving, transportation) were excluded due to data constraints.”
3 Results
3.1 Descriptive statistics
Between 2019 and 2024, the total number of new cases was 97,472, with a cumulative crude incidence rate of 896.52 per 100,000 individuals, demonstrating a significant yearly decreasing trend in the annual crude incidence rate (average annual percentage of decline AAPC = −59.79, p = 0.014; Table 1). Based on data from the Seventh Population Census of China in 2020, the age-standardized results indicated that the incidence rate declined annually from 2019 (132.78 per 100,000; AAPC = −59.44, p = 0.015) to 2024 (3.38 per 100,000), resulting in a cumulative incidence rate of 415.59 per 100,000 (Table 1). Gender-standardized analyses also revealed a yearly decrease in incidence from 143.84 per 100,000 in 2019 (AAPC = −59.54, p = 0.017) to 4.18 per 100,000 in 2024, with a cumulative incidence of 451.70 per 100,000 (Table 1). Between 2019 and 2024, a cumulative total of 117,243 deaths were recorded, yielding a cumulative crude mortality rate of 1,031.28 per 100,000, which exhibited a significant downward trend in the annual crude mortality rate (AAPC = −64.73, p = 0.026; Table 1). According to the 2020 Chinese census data, the age-standardized results showed that the mortality rate declined each year from 2019 (125.62 per 100,000; AAPC = −67.53, p = 0.012) to 2024 (1.44 per 100,000; Table 1). Meanwhile, gender-standardized analysis results also indicated a yearly decrease in the mortality rate (AAPC = −66.89, p = 0.013) from 2019 (135.93 per 100,000) to 1.74 per 100,000 in 2024 (Table 1).
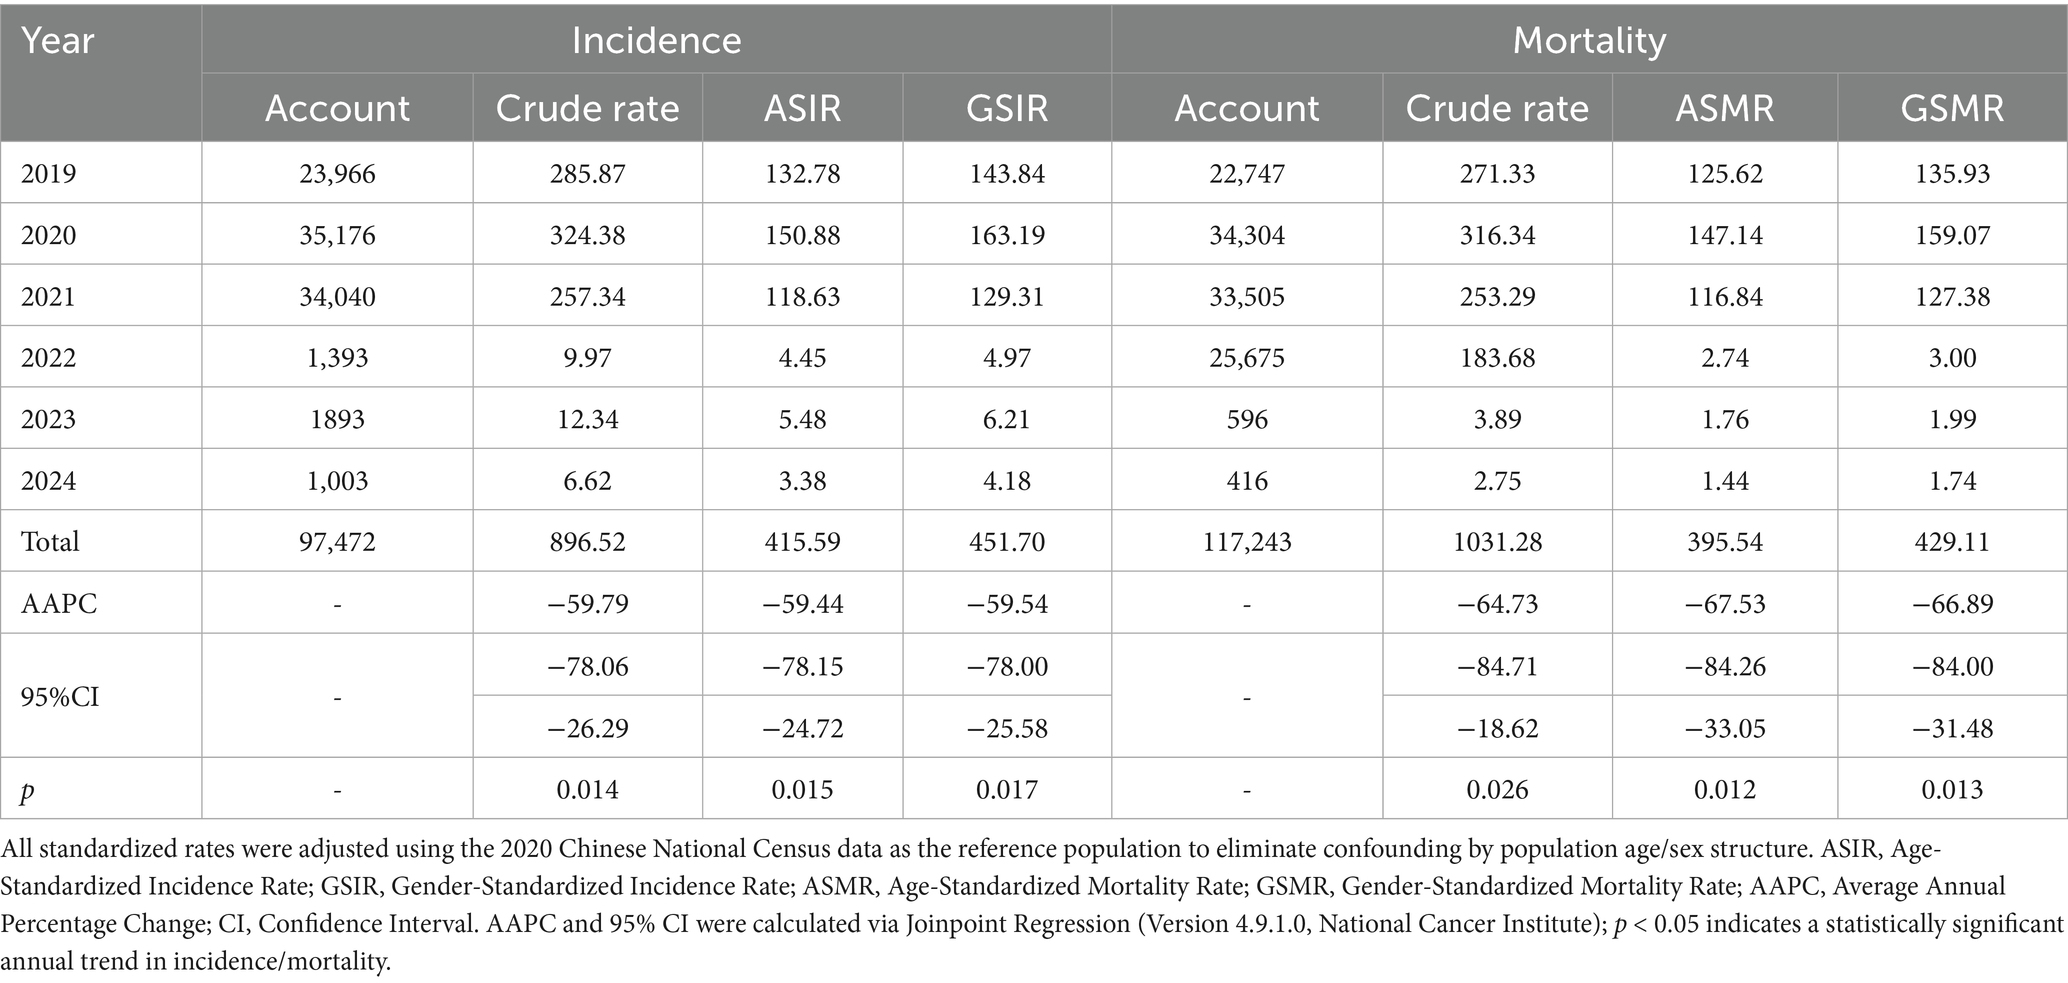
Table 1. Annual and cumulative leukemia incidence and mortality rates (per 100,000 population) in 832 poverty-alleviated counties of China (2019–2024).
The results of the JoinPoint incidence rate calculations indicated a decreasing trend in the incidence rates across various age and sex groups, as well as the overall standardized incidence rate (Figure 1). Both the ASIR and GSIR exhibited a significant downward trend, with APC values of −59.44 and −58.47, respectively (Figure 1C). Between 2019 and 2024, a total of 11,777 cases were reported in the juvenile group, 61,649 in the adult group, and 24,282 in the older adults group, with statistically significant differences in incidence rates among age groups in each year(χ2 > 200, p < 0.001; Table 2). In 2019–2021, the incidence rates were highest in older population, followed by the adult and juvenile groups; and in 2022–2024, the incidence rates were highest in the juvenile, followed by the adult and age group of people over 65 (Table 2). All age groups incidence rates showed a significant decline, with APC values of −39.54,-55.63 and −62.87, respectively (Figure 1A). A total of 58,467 cases were reported in males and 39,250 cases in females, with a male-to-female sex ratio of 1.49:1, and the incidence rate in males was higher than that in females in each year (χ2 > 15, p < 0.001), and the difference was statistically significant (Table 3). Both male and female incidence rates showed a significant decline, with APC values of −53.27 and −53.18, respectively (Figure 1B).

Figure 1. Joinpoint regression analysis of leukemia incidence and mortality rates in 832 poverty-alleviated counties (2019–2024). Incidence rates for age-stratified groups (A), sex-stratified groups (B), and standardized groups (C) exhibited statistically significant downward trends; Mortality rates for age-stratified groups (D), sex-stratified groups (E), and standardized groups (F) also demonstrated statistically significant downward trajectories. ASIR, Age-Standardized Incidence Rate; ASMR, Age-Standardized Mortality Rate; APC, Annual Percentage Change.
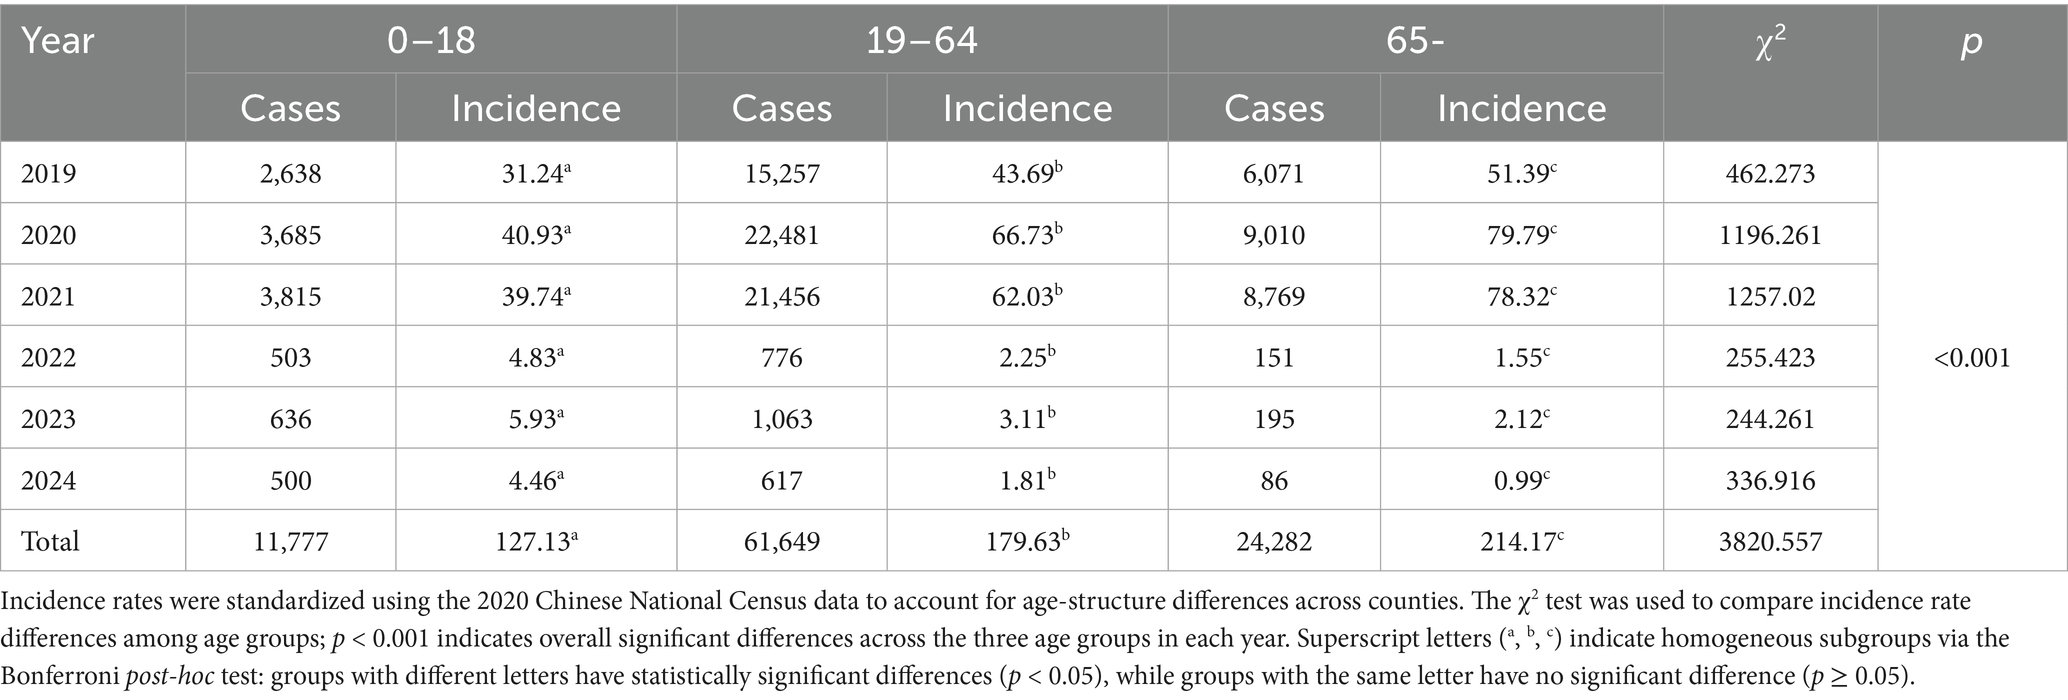
Table 2. Age-stratified leukemia incidence rates (per 100,000 population) in 832 poverty-alleviated counties of China (2019–2024).
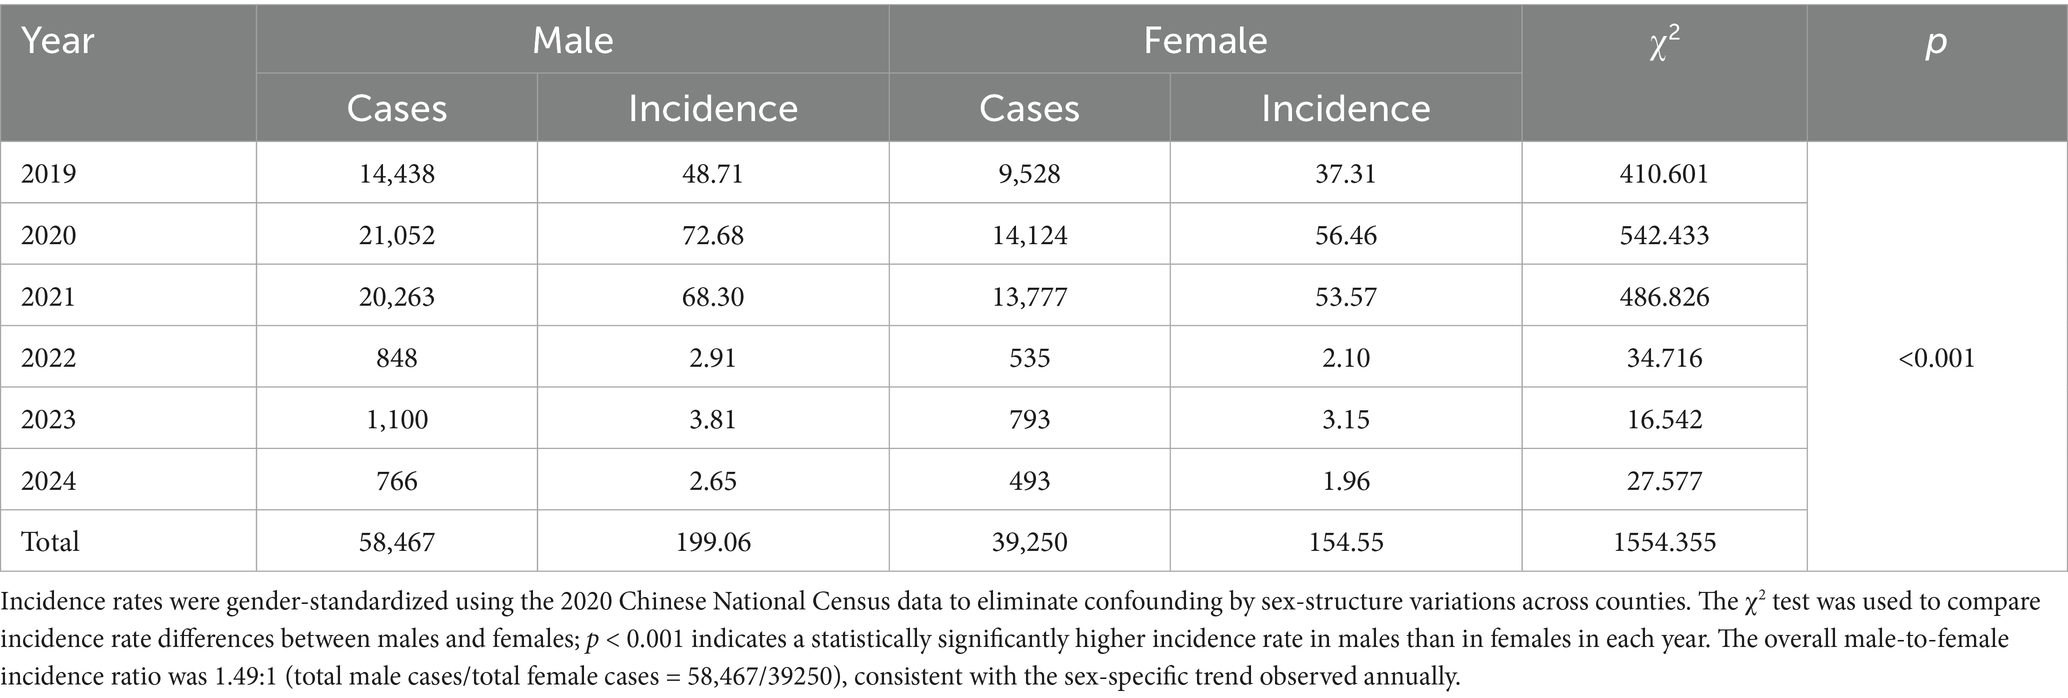
Table 3. Sex-stratified leukemia incidence rates (per 100,000 population) in 832 poverty-alleviated counties of China (2019–2024).
The results of the JoinPoint mortality calculations indicate a decreasing trend in the mortality rates across various age and sex groups, as well as a decline in the overall standardized mortality rate. The adult group experienced the most significant decrease, followed by the juvenile and age group of people over 65, with respective declines of −63.85, −61.08, and −60.73 (Figure 1D). Male mortality decreased more than female mortality, with rates of −62.33 and −63.37, respectively (Figure 1E). Both the ASMR and the GSMR exhibited a downward trend, with values of −67.53 and −66.89, respectively (Figure 1F).
3.2 Leukemia incidence distribution patterns
From 2019 to 2024, leukemia incidence among impoverished populations in China’s four major economic regions displayed significant spatial heterogeneity (χ2 = 28,385.27, p < 0.001), exhibiting a distinct regional hierarchy: Northeast > Central > East > West (Table 4). The 2019–2020 period revealed differential patterns, with both the Northeast and Eastern regions demonstrating elevated incidence rates. The Northeast particularly showed concentrated high-incidence clusters in 2020, whereas the Central region exhibited mixed medium-to-medium-high incidence counties without notable clustering. Conversely, the Western region consistently maintained low incidence levels throughout. Subsequent analysis (2020–2024) showed all regions transitioning toward predominantly low-incidence distribution patterns (Figures 2, 3).
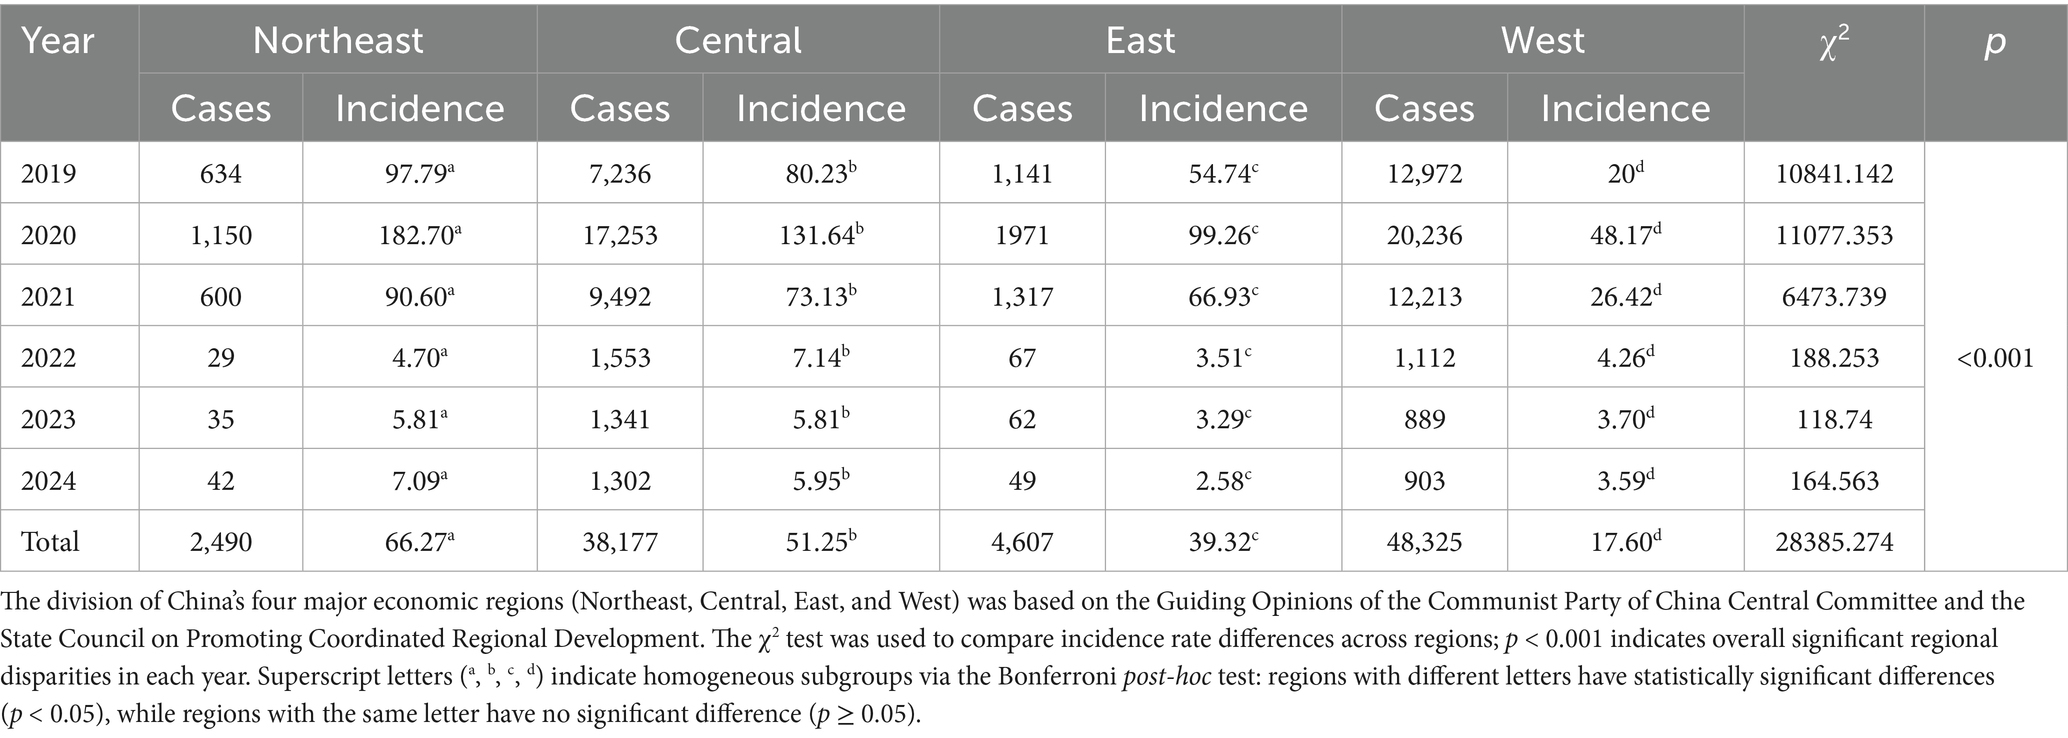
Table 4. Regional leukemia incidence rates (per 100,000 population) across four major economic regions of China (2019–2024, 832 poverty-alleviated counties).

Figure 2. Division of China’s four major economic regions and temporal trends in leukemia incidence (2019–2024). (A) Administrative division of the four major economic regions. (B) Temporal trends in crude incidence rates (per 100,000) across the four regions, regions showed a notable decline post-2020. 2019–2021: Northeast China had the highest incidence (2020 peak), followed by Central, East, and West China. 0.2022–2024: Incidence in all regions dropped to <10 per 100,000, with the regional hierarchy narrowing. The division of China’s four major economic regions (Northeast, Central, East, and West) was based on the Guiding Opinions of the Communist Party of China Central Committee and the State Council on Promoting Coordinated Regional Development. The 2020 peak in the Northeast/Central regions may reflect backlogged case identification following health poverty-alleviation interventions.
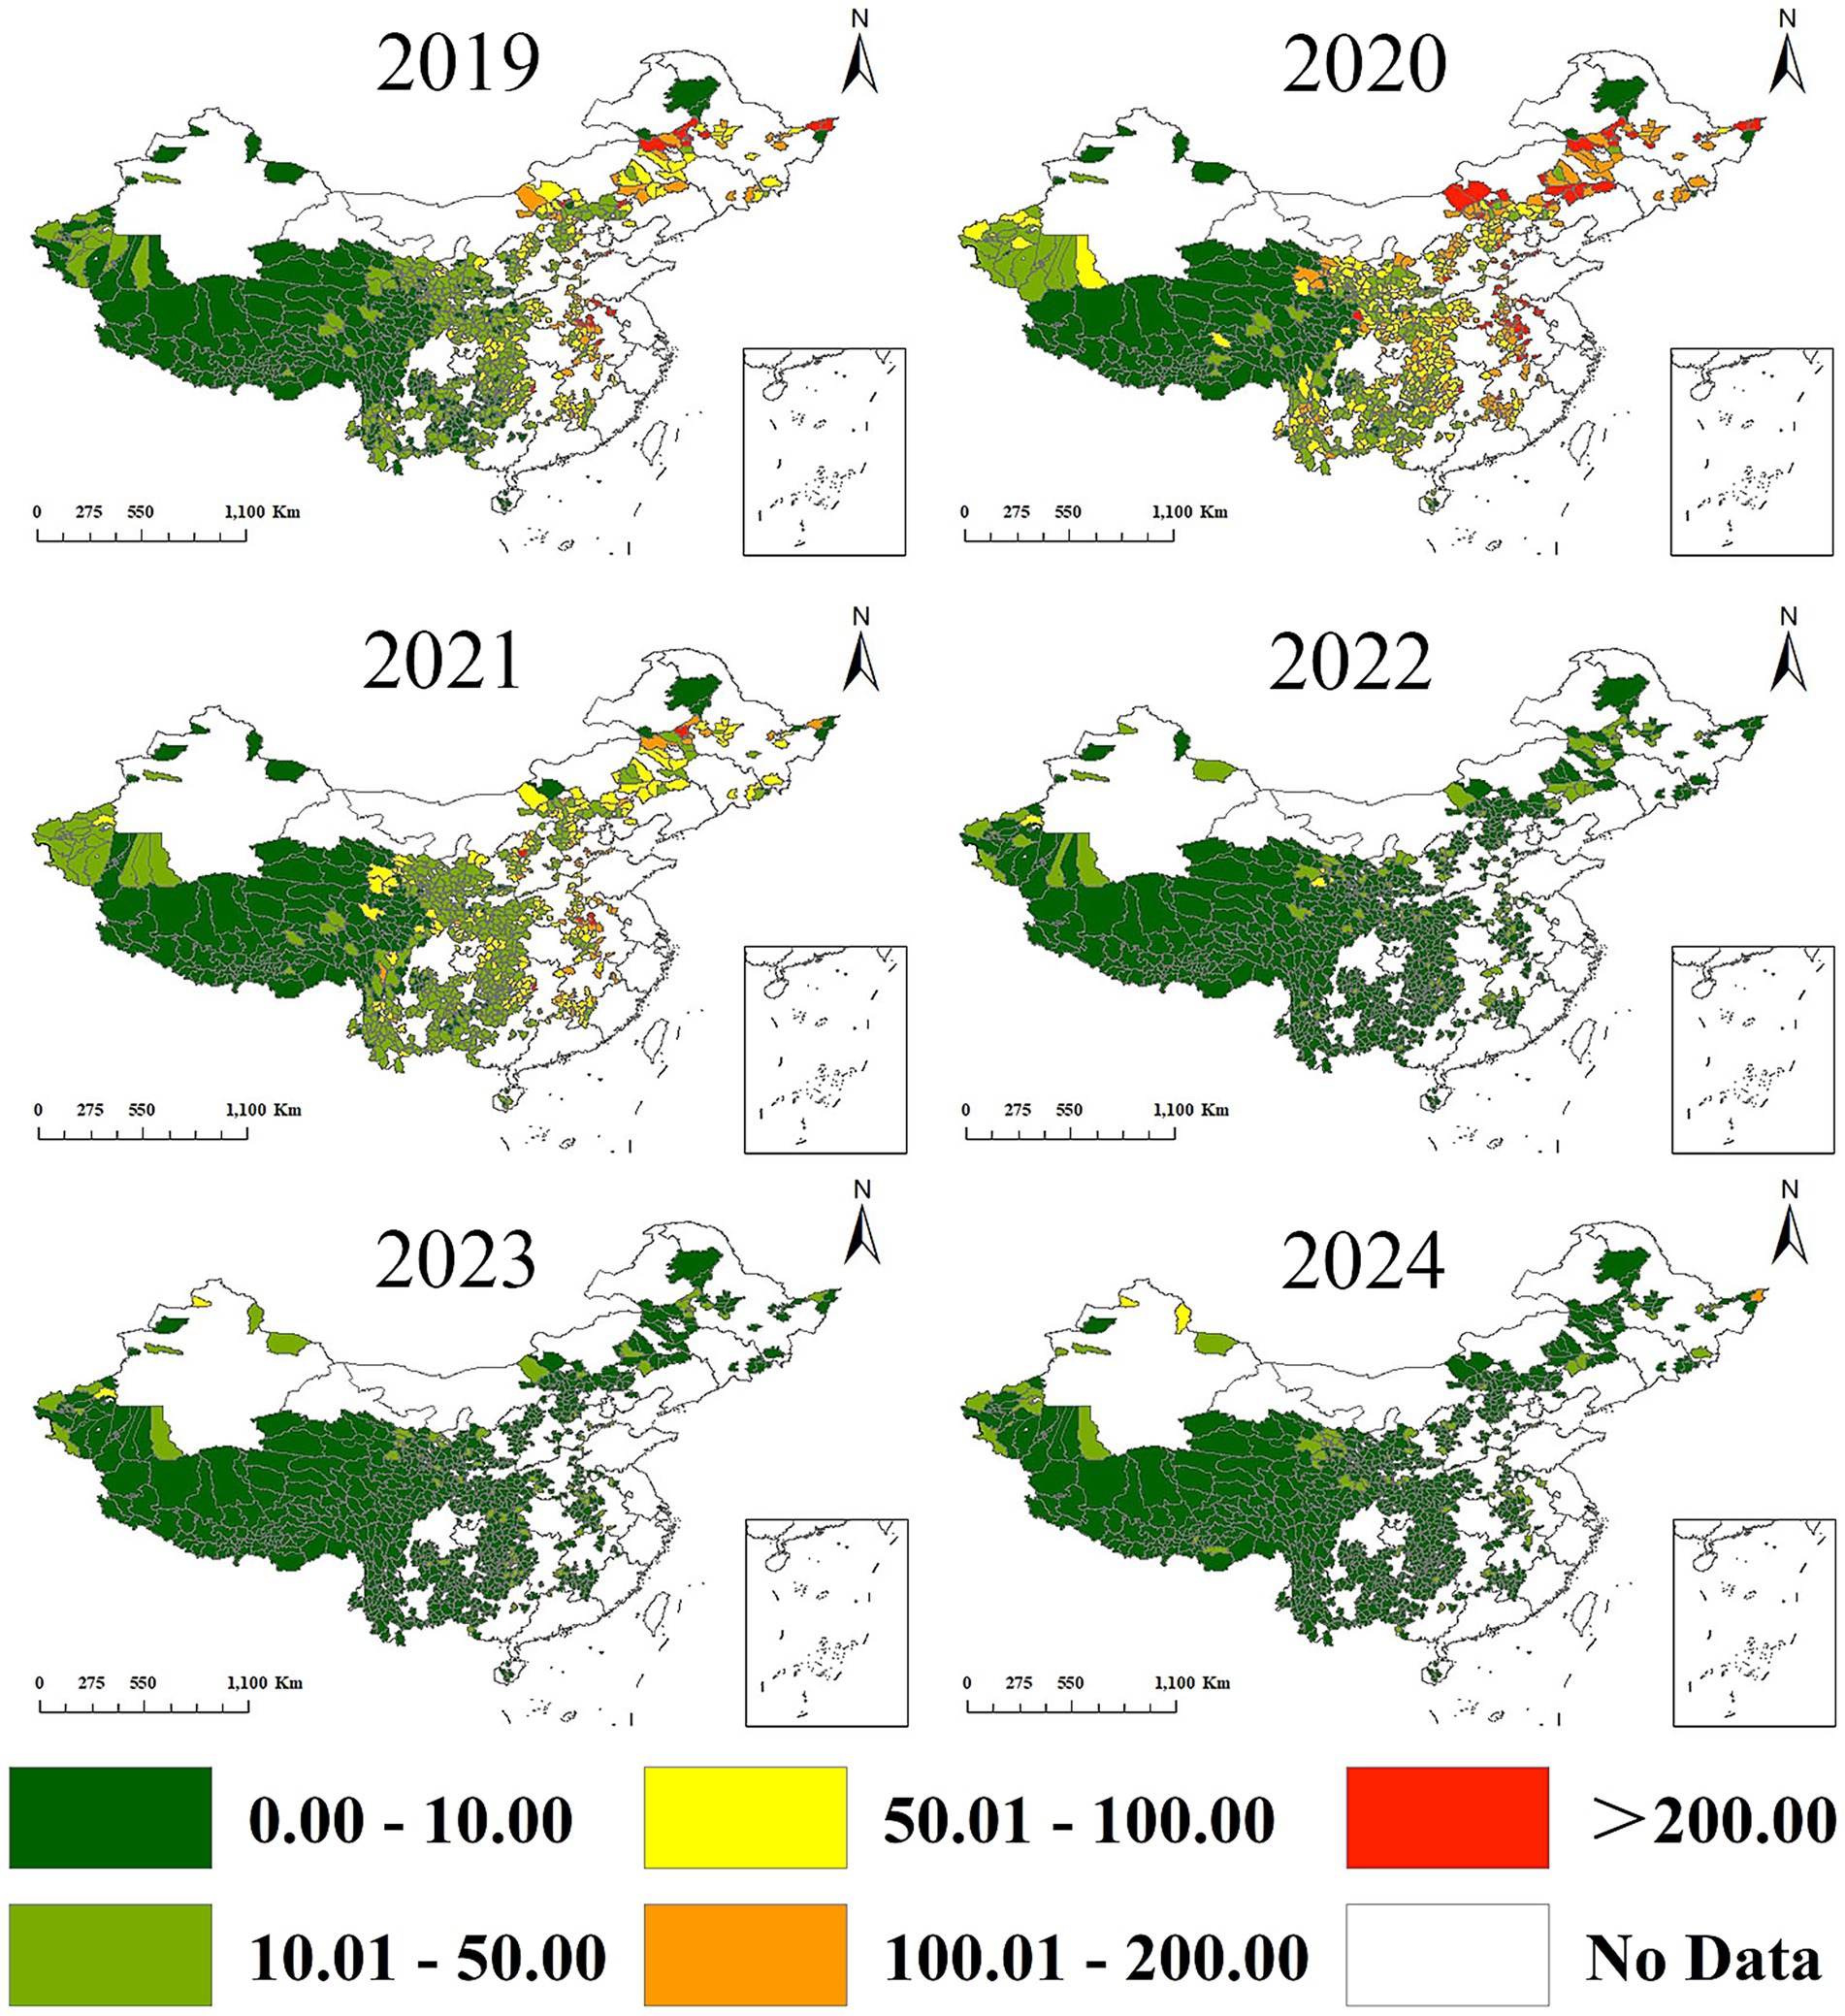
Figure 3. Spatiotemporal distribution of leukemia incidence in 832 poverty-alleviated counties (2019–2024). The spatial pattern of high-incidence counties shifted dynamically over the study period.2019–2021: High-incidence counties were densely clustered in Northeast China and scattered in Central China. East China had sporadic high-incidence counties, while West China had almost no high-incidence areas.2022–2024: The number of high-incidence counties decreased sharply across all regions. Northeast and Central China retained only isolated high-incidence counties, while West China began to show a small number of low-level high-incidence counties -consistent with improved diagnostic coverage in resource-limited regions. County boundaries were sourced from the National Geomatics Center (Approval No. GS [2024]0650).
Significant spatial aggregation patterns persisted across all study years, as evidenced by positive global autocorrelation indices: 2019 (Moran’s I = 0.245, p < 0.001), 2020 (Moran’s I = 0.383, p < 0.001), 2021 (Moran’s I = 0.386, p < 0.001), 2022 (Moran’s I = 0.139, p < 0.001), 2023 (Moran’s I = 0.143, p < 0.001), and 2024 (Moran’s I = 0.076, p < 0.001; Figure 4).

Figure 4. Global Moran’s I statistics for spatial autocorrelation of leukemia incidence (2019–2024). Leukemia incidence exhibited statistically significant spatial clustering in all study years (Monte Carlo permutation test, 999 replications, p < 0.01), with a gradual weakening of clustering intensity over time. Positive Moran’s I values indicate spatial aggregation (high-incidence counties adjacent to other high-incidence counties, and low-incidence counties adjacent to low-incidence counties); fixed bandwidth = 200 km, Queen neighborhood criterion.
Getis-Ord Gi* analysis identified distinct spatial–temporal patterns: 2019–2021 witnessed concentrated leukemia hotspots in Northeast and Central China, while Coldspots predominated in Central-West regions with progressive spatial contraction (Figure 5). Subsequent years (2022–2024) showed dynamic spatial evolution - Eastern hotspots demonstrated progressive attenuation, whereas Western regions developed novel hotspot clusters showing significant areal expansion (Figure 5).
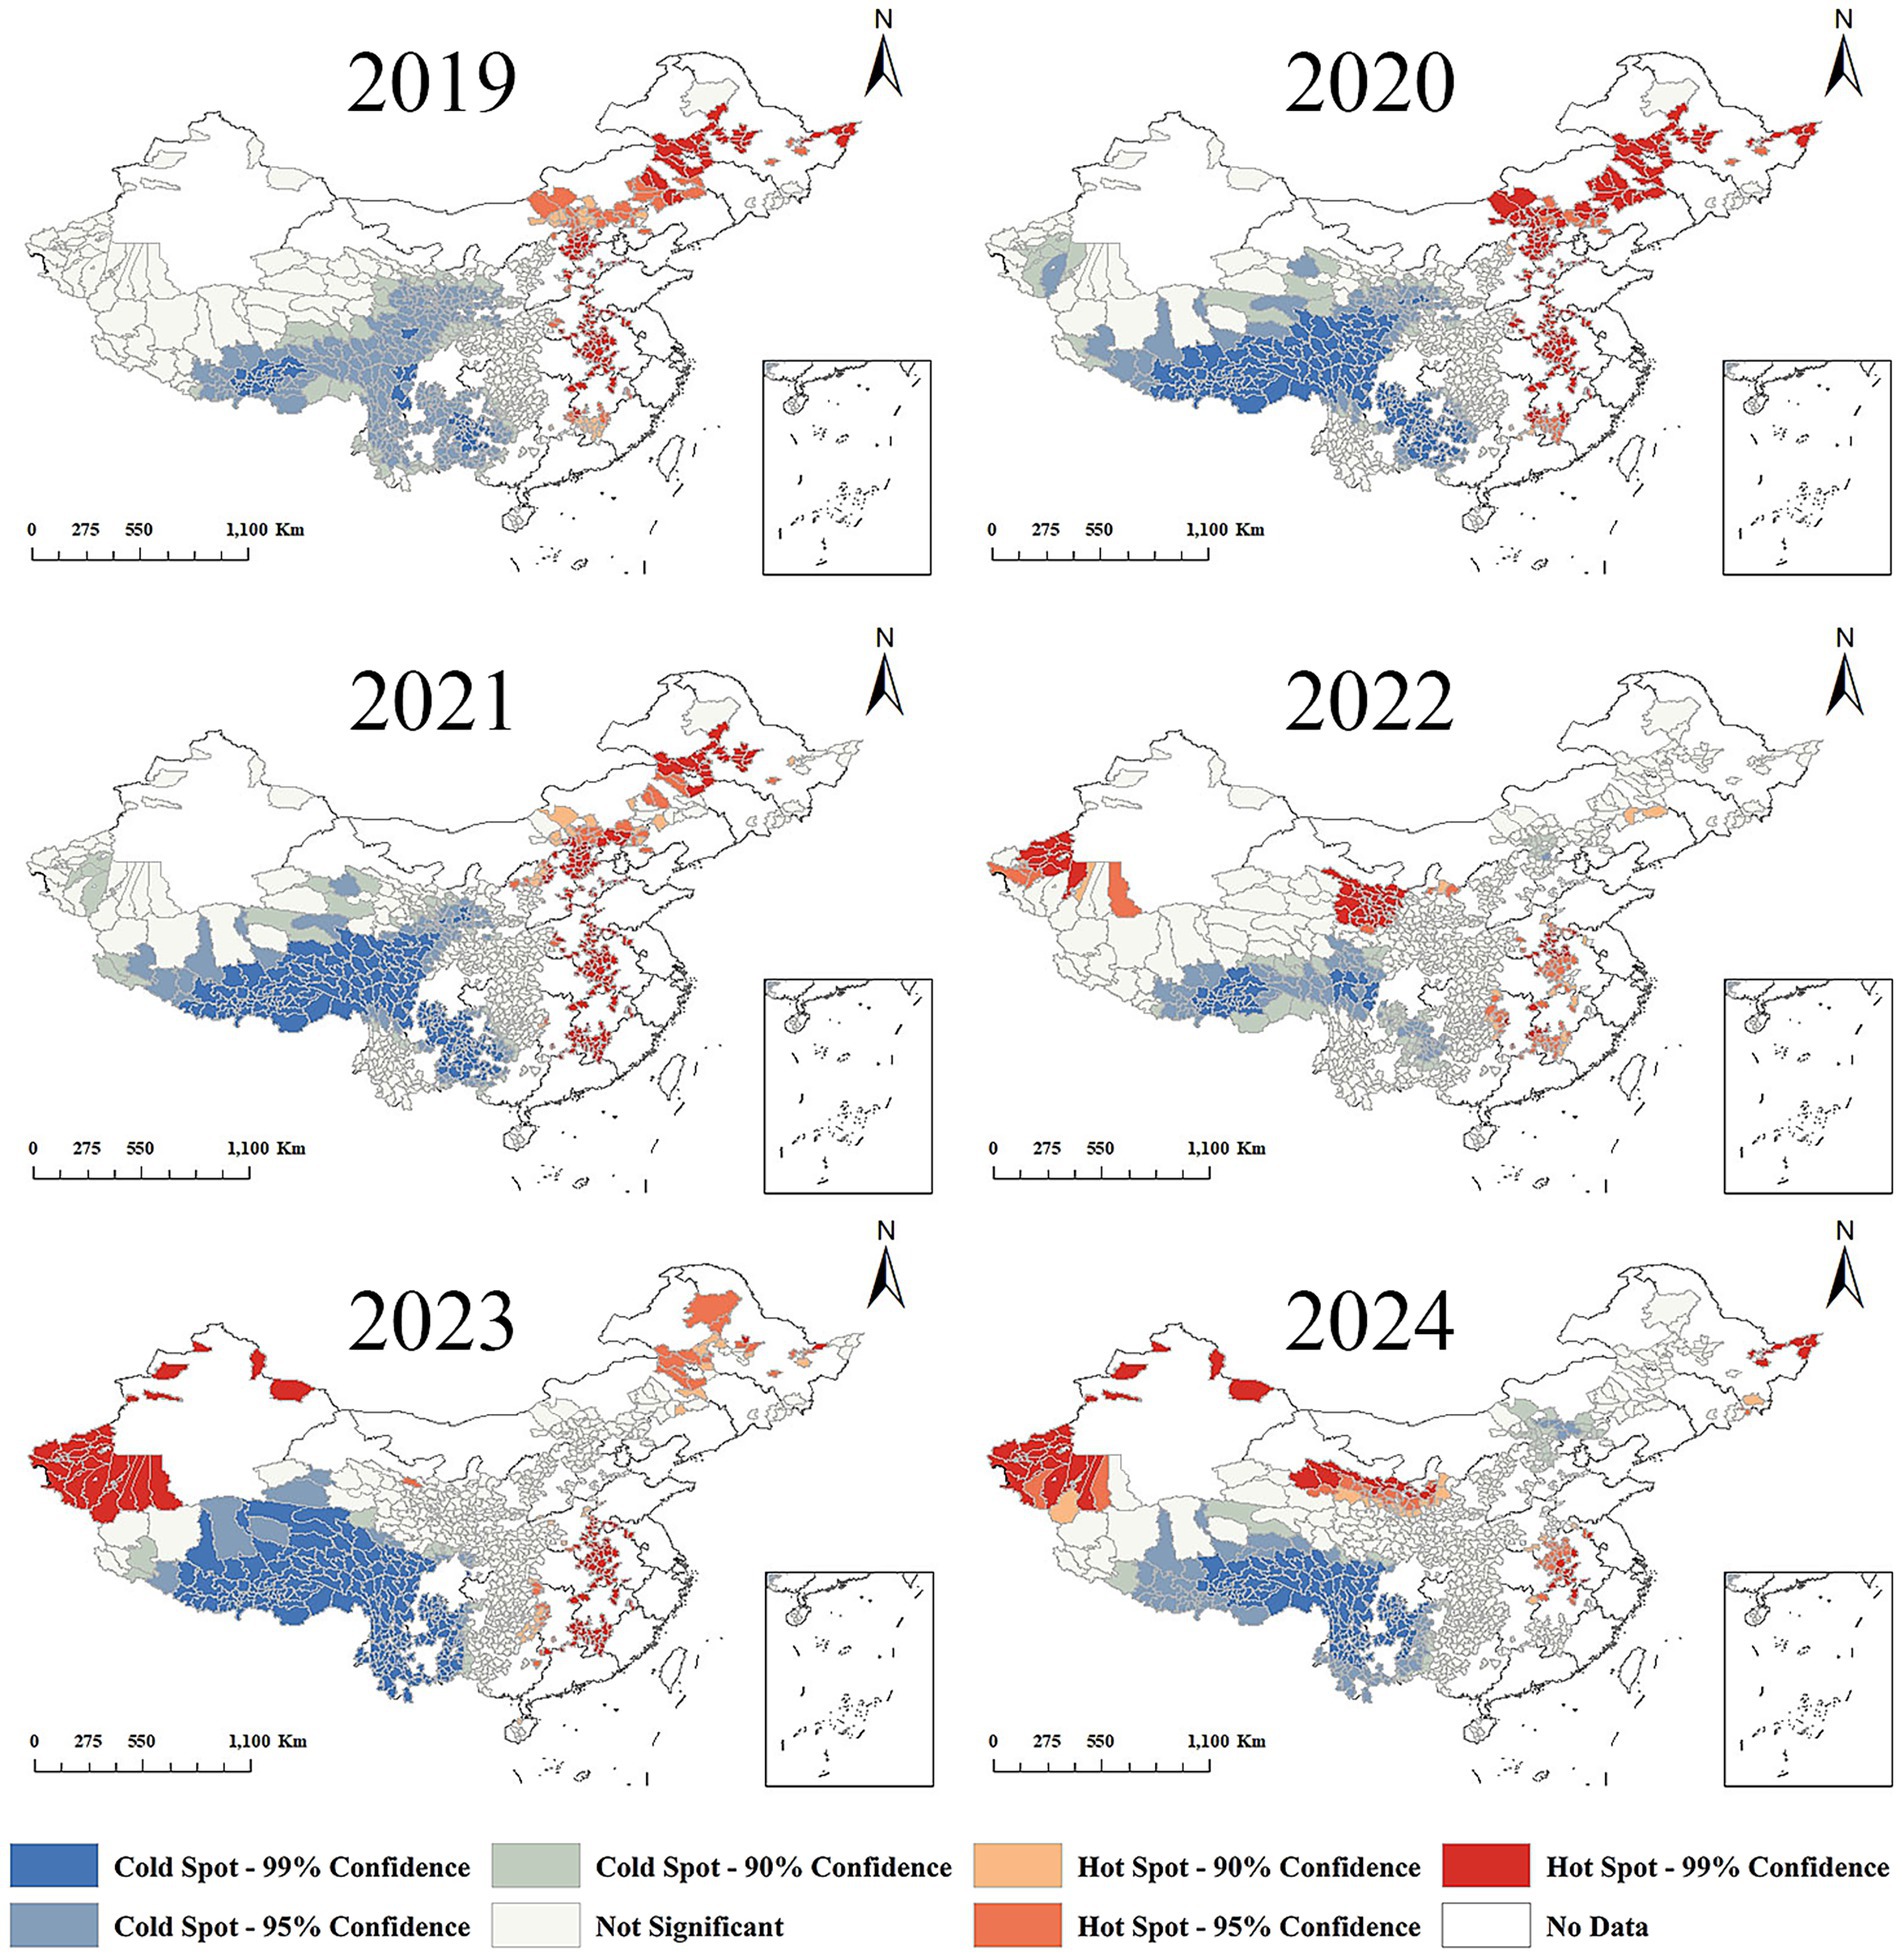
Figure 5. Getis-Ord Gi* statistics for local spatial autocorrelation of leukemia incidence (2019–2024). Shift of leukemia hotspots from Northeast/Central to Western China after 2022. 2019–2021: Hotspots were concentrated in Northeast China and parts of Central China; coldspots dominated in West China with gradual spatial contraction. 2022–2024: Hotspots in Northeast/Central China attenuated significantly; new hotspots emerged and expanded in West China. Coldspots persisted in remote western areas but shrank in size. The post-2022 westward shift in hotspots reflects improved diagnostic capacity in Western China rather than a true increase in leukemia burden, aligning with the rollout of health poverty-alleviation interventions in resource-limited regions.
3.3 Economic burden distribution patterns
Counties with high OOP costs were mainly concentrated in the Central region (Figure 6A). In contrast, counties with low OOP costs were primarily located in the Western region (Figure 6A). Per capita OOP costs in the Central region were higher than those in the Western region. However, no statistically significant difference was observed when comparing the Central region with the Eastern and Northeastern regions (Figure 6C). The results of the global spatial autocorrelation analysis [Moran I = 0.104329, p < 0.001] indicated a significant aggregation pattern (Figure 6D). Furthermore, the optimized hotspot analysis revealed that hotspot regions were predominantly situated in the Central, Northeast, and East regions, whereas coldspot regions were primarily found in certain areas of the western part (Figure 6B).

Figure 6. Spatiotemporal distribution and spatial autocorrelation of leukemia out-of-pocket (OOP) costs and OOP ratios (2019–2024). (A–D) OOP costs statistical analyses. (A) Spatiotemporal distribution. High OOP cost counties (≥50,000 RMB/year) were consistently concentrated in Central China and parts of East China; low OOP cost counties (<20,000 RMB/year) dominated in West China. (B) Getis-Ord Gi* hotspot analysis. Hotspots of high OOP costs were concentrated in Central China; no significant hotspots were observed in West China. (C) Regional comparison of median OOP costs. Central China had the highest median OOP cost, followed by East and Northeast China; West China had the lowest. Differences between Central and West China were statistically significant, while East and Northeast China showed no significant difference. (D) Global Moran’s I for OOP costs. Significant spatial clustering was observed, indicating that counties with similar OOP costs tended to be geographically adjacent. (E–H) OOP ratios statistical analyses. (E) Spatiotemporal distribution. High OOP ratio counties (≥30%) were concentrated in East, Northeast, and Central China; low OOP ratio counties (<15%) were primarily in West China. (F) Getis-Ord Gi* hotspot analysis. Hotspots of high OOP ratios were distributed in East and Central China; coldspots dominated West China. (G) Regional comparison of median OOP ratios. East China had the highest median OOP ratio (39.7%), approaching the WHO catastrophic health expenditure threshold (40%); this was significantly higher than West China (22.3%, p < 0.01) but not different from Northeast China (37.1%, p > 0.05). (H) Global Moran’s I for OOP ratios. Stronger spatial clustering was observed compared to OOP costs (Moran’s I = 0.189, p < 0.001), reflecting pronounced regional disparities in financial toxicity. OOP costs = sum of direct medical expenditures for leukemia treatment; OOP ratios = OOP costs/total household health expenditure × 100%. All spatial analyses used a fixed bandwidth = 200 km and Queen neighborhood criterion; statistical significance was determined by Monte Carlo permutation tests (p < 0.01).
Regions with elevated OOP ratios were predominantly located in the East, Northeast, and Central regions, while areas with lower OOP rates were primarily found in the West (Figure 6E). Eastern China exhibited the highest financial burden with a median Out-of-Pocket (OOP) ratio of 39.7%, critically approaching the WHO catastrophic threshold (7). Regional comparison revealed significantly higher OOP ratios in the East than West/Central (p < 0.001), while no statistical difference existed between East and Northeast as quantified in Figure 6G. The global spatial autocorrelation analysis indicated a significant global autocorrelation [Moran I = 0.188918, p < 0.001] in the OOP ratio, revealing a notable clustering pattern and positive spatial autocorrelation (Figure 6H). Furthermore, the optimized hotspot analysis identified hotspot regions primarily in the Central and Northeastern regions, while coldspot regions were predominantly located in the West (Figure 6F).
4 Discussion
This study represents the first epidemiological spatio-temporal analysis of leukemia among a population of 832 poverty-eradication counties across four major economic regions of China from 2019 to 2024. It holds significant importance for enhancing the targeting of leukemia prevention and control efforts, as well as for improving the effectiveness of preventing a resurgence of poverty attributable to leukemia.
The incidence of leukemia is significantly higher among the impoverished population in the eastern and northeastern regions compared to the western regions, particularly during the period from 2019 to 2021. This disparity may be attributed to various factors, including environmental conditions, lifestyle choices, and inadequate access to healthcare. Industrial pollution is a significant contributor to the elevated incidence of leukemia in the eastern region (2, 5), where individuals are more frequently exposed to harmful substances such as benzene. This exposure damages bone marrow and leads to chromosomal abnormalities, thereby increasing the likelihood of individuals developing leukemia (8–10). Secondly, the accelerated urbanization in the eastern region has resulted in significant lifestyle changes, with dietary patterns marked by high intake of fats, sugars, and salts recognized as a known risk factor for various types of leukemia, particularly chronic lymphocytic leukemia and granulocytic leukemia (11–13). Additionally, inadequate healthcare infrastructure, limited access to healthcare services (14), and low awareness of leukemia symptoms (15) may contribute to delayed diagnosis and increased morbidity. To address this issue, several measures have been implemented in the eastern region, including enhancing public health awareness and knowledge related to leukemia, promoting healthy lifestyles, strengthening environmental protection to mitigate chemical and environmental pollution (16, 17), screening and monitoring at-risk groups to identify and address potential issues, and establishing health policies and interventions tailored to the specific needs of the population in eastern China. The specific needs of the population in eastern China are addressed in reference (2). Improved access to healthcare has enabled more individuals to receive timely diagnoses and treatments (18). Furthermore, advancements in medical testing and diagnostic technologies have greatly enhanced the capacity to identify leukemia (5). As the economy progresses, the integration of advanced medical technologies and treatment options, such as targeted therapies and hematopoietic stem cell transplants, has markedly improved patient survival rates and prognoses (2).
Crucially, this observed hotspot expansion in western China post-2022, as identified by our Getis-Ord Gi analysis (Figure 5), stands in apparent contrast to the significant declines in national leukemia incidence and mortality reported herein (Table 1). This phenomenon presents the paradox of ‘high resource allocation leading to an apparent high disease burden’ at the local level and warrants specific consideration in relation to Health Poverty Alleviation (HPA) policy impacts. The post-2022 expansion of hotspots (Figure 5) reflects the progressive rollout of HPA interventions reaching deeper into Western regions, unmasking the pre-existing, but previously undiagnosed, burden of leukemia. This increased detection directly results from higher resource investment aimed at improving health equity. Thus, the seemingly paradoxical emergence of ‘high burden’ (hotspots) in the West following ‘high resource’ (HPA) investment is not indicative of a failure of the policies or an actual worsening of leukemia burden, but rather a testament to their success in improving case ascertainment and bringing previously hidden cases into the healthcare system. This phenomenon aligns with the identified peak in 2020 being attributable to uncovered backlogged cases (discussed earlier), but demonstrates its spatio-temporally evolving nature, shifting focus to disadvantaged western regions as HPA interventions deepened after 2020. Before 2022, the basic medical facilities in western China were relatively weak (19), with a lower number of health technicians per thousand population compared to the eastern region (20). This situation severely impacted the quality and accessibility of medical services. Consequently, leukemia’s were more likely to develop (21) and were often diagnosed at later stages, leading to higher morbidity and mortality rates (22) between 2019 and 2021 (23). However, following economic development and the poverty alleviation of impoverished counties (24), significant improvements have been made. With advancements in diagnostic capabilities and timeliness (25), the detection rate of leukemia has steadily increased in poverty-stricken regions of Western China (26). Getis-Ord Gi* analysis revealed significant hotspot expansion in western China post-2022 (Figure 5), contrasting with the prior northeast-central clustering pattern.
The distribution of the economic burden of leukemia is markedly uneven, with the eastern and central regions facing a greater economic burden than the poorer western regions, despite having better access to healthcare resources. With the OOP ratio median (39.7%) nearing the WHO catastrophic threshold (40%) (27), eastern China exhibits critical vulnerability to financial toxicity despite higher economic development (Figure 6). This suggests systemic inefficiencies in public coverage for leukemia care, demanding urgent formulary expansion to novel therapies. This high economic burden in the eastern and central regions may stem from a cycle characterized by “high healthcare resources - high treatment demand.” The advanced medical facilities and specialists available in these regions provide better treatment options and outcomes for leukemia patients, who often have elevated expectations regarding their treatment (28). However, the depth of health insurance coverage is frequently inadequate to fully cover the costs associated with leukemia-related treatments. Consequently, the involvement of insurance companies can lead to catastrophic medical expenditures, which significantly impact impoverished families (29).
Quality healthcare resources tend to attract more complex cases, such as those requiring hematopoietic stem cell transplantation. Conversely, inadequate coverage in health insurance catalogs compels patients to pay OOP for innovative drugs (30). This significant financial burden can heighten stress and anxiety for both patients and their families, complicating the disease management process (5, 31) and potentially leading families to abandon treatment, which can have severe consequences (32). In the western region, characterized by poorer economic conditions and medical standards (19, 33, 34), patients generally have lower treatment expectations and rely more heavily on local medical resources. This reliance often results in poorer treatment outcomes and higher mortality rates (35, 36) despite the relatively lower financial burden (37).
To address the significant financial burden in the east-central region, a pilot leukemia-specific healthcare voucher could be implemented to cover the OOP expenses associated with new targeted therapies. Additionally, expanding the scope of healthcare insurance and promoting the integration of commercial insurance with basic healthcare insurance would provide health-related financial risk protection for the impoverished, thereby reducing the likelihood of further poverty due to catastrophic healthcare expenditures (38, 39). Furthermore, the reimbursement rate for leukemia treatments should be increased, and a cross-provincial medical collaboration network should be established to lower the costs associated with inter-regional patient mobility. To tackle the issue of inadequate healthcare resources in the western region, the government should prioritize investments in enhancing healthcare facilities and services, elevating the level of medical assistance in impoverished counties, and ensuring that all individuals have access to basic medical insurance, major disease insurance, and medical assistance (40, 41). Lastly, efforts to improve public health literacy should be intensified to enhance overall health outcomes and decrease the incidence of disease-related poverty (42, 43).
5 Innovations
Transcending the provincial-scale spatial analyses dominating leukemia burden research and unidimensional economic evaluations, this study introduces three integrated innovations: First, a granular spatiotemporal framework analyzes county-level dynamics (n = 832 counties) through terrain-adjusted spatial autocorrelation (Global Moran’s I; Getis-Ord Gi*) coupled with Joinpoint regression (BIC-optimized inflection detection). Second, we establish a dual-burden quantification system, capturing both absolute OOP costs and relative financial toxicity (OOP ratios), revealing significant inter-regional disparities. Crucially, we reframe 2022–2024 high-burden clusters not as policy failures but as evidence of diagnostic catch-up success, where spatial case ascertainment bias serves as an equity-sensitive metric for healthcare modernization impact.
6 Limitations
Although this study systematically assessed the spatial distribution characteristics of leukemia incidence and its economic burden, the following limitations remain: 1. Data coverage bias: the data from the poverty alleviation platform may miss unregistered poor cases, especially in remote areas with poor transportation, which may lead to underestimation of incidence and distortion of spatial patterns. Follow-up studies need to validate patient coverage by combining data from multiple sources 2. Missing indirect costs: The economic analysis did not include indirect costs such as missed work and companionship, which may weaken the comprehensive assessment of the poverty-causing effects of the disease 3. Environmental and socioeconomic covariates were not fully captured and could influence spatial disparities. 4. Incomplete longitudinal socioeconomic indicators (832 counties, 2019–2024), absent age-stratified incidence matrices, and missing non-demographic covariates precluded three advanced analyses: SII/RII quantification of contextual disparities, APC modeling of cohort effects, and decomposition of population/non-population drivers. These gaps restrict cross-validation with studies using such causal inference techniques. Future work requires high-granularity socioeconomic panels, demographically disaggregated registries, and geospatial covariate libraries.
Data availability statement
The data analyzed in this study is subject to the following licenses/restrictions: you can get access to the data by requesting it from corresponding author. Requests to access these datasets should be directed to emxscm1pdEBhbGl5dW4uY29t; cXlkZWx3cEBmb3htYWlsLmNvbQ==.
Ethics statement
The study protocol was approved by the Ethics Committee of the Naval Medical University (Shanghai, China), with waived informed consent due to de-identified data.
Author contributions
WL: Conceptualization, Data curation, Formal analysis, Validation, Writing – original draft, Writing – review & editing. ZL: Data curation, Formal analysis, Methodology, Writing – original draft, Validation. MC: Conceptualization, Project administration, Data curation, Formal analysis, Methodology, Validation, Writing – original draft. DX: Conceptualization, Funding acquisition, Project administration, Writing – review & editing. JW: Methodology, Formal analysis, Validation, Writing – review & editing. JC: Methodology, Writing – review & editing. LZ: Conceptualization, Funding acquisition, Project administration, Writing – review & editing.
Funding
The author(s) declare that financial support was received for the research and/or publication of this article. This study was supported by the Comparative Study for Health Inequality among the Populations Lifted out of Poverty in Rural Areas of Eastern, Central, and Western China (72474220).
Acknowledgments
We appreciate all our colleagues in our research group for their helpful discussions and suggestions.
Conflict of interest
The authors declare that the research was conducted in the absence of any commercial or financial relationships that could be construed as a potential conflict of interest.
Generative AI statement
The author(s) declare that no Gen AI was used in the creation of this manuscript.
Any alternative text (alt text) provided alongside figures in this article has been generated by Frontiers with the support of artificial intelligence and reasonable efforts have been made to ensure accuracy, including review by the authors wherever possible. If you identify any issues, please contact us.
Publisher’s note
All claims expressed in this article are solely those of the authors and do not necessarily represent those of their affiliated organizations, or those of the publisher, the editors and the reviewers. Any product that may be evaluated in this article, or claim that may be made by its manufacturer, is not guaranteed or endorsed by the publisher.
References
1. Vallée, M. How government health agencies obscure the impact of environmental pollution and perpetuate reductionist framings of disease: the case of leukemia. Int J Soc Determ Health Health Serv. (2024) 54:28–39. doi: 10.1177/27551938231169119
2. Li, B, Tang, H, Cheng, Z, Zhang, Y, and Xiang, H. The current situation and future trend of leukemia mortality by sex and area in China. Front Public Health. (2020) 8:598215. doi: 10.3389/fpubh.2020.598215
3. Kowalczyk, A, Zarychta, J, Lejman, M, and Zawitkowska, J. Electrochemical and optical sensors for the detection of chemical carcinogens causing leukemia. Sensors (Basel). (2023) 23:3369. doi: 10.3390/s23073369
4. Wang, M, Tang, L, and Deng, S. Trends in the burden of leukemia in China from 2010 to 2021. J Infrastruct. (2024) 8:6932. doi: 10.24294/jipd.v8i8.6932
5. Lin, K, Jia, H, Cao, M, Xu, T, Chen, Z, Song, X, et al. Epidemiological characteristics of leukemia in China, 2005–2017: a log-linear regression and age-period-cohort analysis. BMC Public Health. (2023) 23:1647. doi: 10.1186/s12889-023-16226-1
6. Liu, X, Li, M, Zhu, H, Liu, Q, and Xie, X. Poverty alleviation and health services for the poor in China: evidence from national health service surveys in 2013 and 2018. Int J Equity Health. (2023) 22:221. doi: 10.1186/s12939-023-02000-7
7. Eze, P, Lawani, L, Agu, UJ, and Acharya, Y. Catastrophic health expenditure in sub-Saharan Africa: systematic review and meta-analysis. Bull World Health Organ. (2022) 100:337–351J. doi: 10.2471/BLT.21.287673
8. Sun, Q, Wang, B, Xu, S, Cong, X, Pu, Y, and Zhang, J. Research development and trends of benzene-induced leukemia from 1990 to 2019-a bibliometric analysis. Environ Sci Pollut Res. (2022) 29:9626–39. doi: 10.1007/s11356-021-17432-3
9. Wang, J, Han, L, Liu, Z, Zhang, W, Zhang, L, Jing, J, et al. Genus unclassified_Muribaculaceae and microbiota-derived butyrate and indole-3-propionic acid are involved in benzene-induced hematopoietic injury in mice. Chemosphere. (2023) 313:137499. doi: 10.1016/j.chemosphere.2022.137499
10. Lu, Y, Sui, P, Li, J, Lian, N, Zhou, J, Cheng, X, et al. Benzene metabolite hydroquinone enhances self-renewal and proliferation of preleukemic cells through the ppar-γ pathway. Toxicol Lett. (2023) 382:33–40. doi: 10.1016/j.toxlet.2023.05.009
11. Mazzarella, L, Botteri, E, Matthews, A, Gatti, E, Di Salvatore, D, et al. Obesity is a risk factor for acute promyelocytic leukemia: evidence from population and cross-sectional studies and correlation with FLT3 mutations and polyunsaturated fatty acid metabolism. Haematologica. (2020) 105:1559–66. doi: 10.3324/haematol.2019.223925
12. Ghosh, T, Richardson, M, Gordon, PM, Ryder, JR, Spector, LG, and Turcotte, LM. Body mass index associated with childhood and adolescent high-risk B-cell acute lymphoblastic leukemia risk: a children’s oncology group report. Cancer Med. (2020) 9:6825–35. doi: 10.1002/cam4.3334
13. Lee, M, Hamilton, JAG, Talekar, GR, Ross, AJ, Michael, L, Rupji, M, et al. Obesity-induced galectin-9 is a therapeutic target in B-cell acute lymphoblastic leukemia. Nat Commun. (2022) 13:1157. doi: 10.1038/s41467-022-28839-y
14. Mei, K, Kou, R, Bi, Y, Liu, Y, Huang, J, and Li, W. A study of primary health care service efficiency and its spatial correlation in China. BMC Health Serv Res. (2023) 23:247. doi: 10.1186/s12913-023-09197-x
15. Li, M, Ni, P, Zuo, T, Liu, Y, and Zhu, B. Cancer literacy differences of basic knowledge, prevention, early detection, treatment, and recovery: a cross-sectional study of urban and rural residents in Northeast China. Front Public Health. (2024) 12:1367947. doi: 10.3389/fpubh.2024.1367947
16. Zhang, Q, Zheng, Y, Tong, D, and Shao, M. Drivers of improved PM2.5 air quality in China from 2013 to 2017. Proc Natl Acad Sci. (2019) 116:24463–9. doi: 10.1073/pnas/1907956116
17. Dong, F, Wang, Y, and Zhang, X. Can environmental quality improvement and emission reduction targets be realized simultaneously? Evidence from China and a geographically and temporally weighted regression model. Int J Environ Res Public Health. (2018) 15:2343. doi: 10.3390/ijerph15112343
18. Morimoto, LM, Kwan, ML, Deosaransingh, K, Munneke, JR, Kang, AY, Quesenberry, C Jr, et al. History of early childhood infections and acute lymphoblastic leukemia risk among children in a US integrated health-care system. Am J Epidemiol. (2020) 189:1076–85. doi: 10.1093/aje/kwaa062
19. Wang, X, Guo, Y, Qin, Y, Nicholas, S, Maitland, E, and Liu, C. Regional catastrophic health expenditure and health inequality in China. Front Public Health. (2023) 11:1193945. doi: 10.3389/fpubh.2023.1193945
20. Zhang, R, Chen, Y, Liu, S, Liang, S, Wang, G, Li, L, et al. Progress of equalizing basic public health services in Southwest China--- health education delivery in primary healthcare sectors. BMC Health Serv Res. (2020) 20:247. doi: 10.1186/s12913-020-05120-w
21. Cui, Y, and Yan, Y. The global burden of childhood and adolescent leukaemia and attributable risk factors: an analysis of the global burden of disease study 2019. J Glob Health. (2024) 14:4045. doi: 10.7189/jogh.14.04045
22. Amri, S, and Sihotang, J. Impact of poverty reduction programs on healthcare access in remote areas: fostering community development for sustainable health. Law Econ. (2023) 17:170–85. doi: 10.35335/laweco.v17i3.43
23. Shi, Y, Chen, C, Huang, Y, Xu, Y, Xu, D, Shen, H, et al. Global disease burden and trends of leukemia attributable to occupational risk from 1990 to 2019: an observational trend study. Front Public Health. (2022) 10:1015861. doi: 10.3389/fpubh.2022.1015861
24. Wei, H, Wu, G, and Tan, X. Targeted poverty alleviation: China’s road of poverty reduction toward common prosperity In: H Wei and L Wang, editors. Poverty reduction in China. International research on poverty reduction. Singapore: Springer Nature Singapore (2022). 1–35.
25. Liu, W, Li, J, and Zhao, R. Rural public expenditure and poverty alleviation in China: a spatial econometric analysis. J Agric Sci. (2020) 12:46. doi: 10.5539/jas.v12n6p46
26. Li, Z, Chen, Y, and Ding, J. Health poverty alleviation project in rural China: impact on poverty vulnerability, health status, healthcare utilization, and health expenditures. Risk Manag Healthc Policy. (2023) 16:2685–702. doi: 10.2147/RMHP.S438352
27. Xu, K, Evans, DB, Kawabata, K, Zeramdini, R, Klavus, J, and Murray, CJL. Household catastrophic health expenditure: a multicountry analysis. Lancet (lond Engl). (2003) 362:111–7. doi: 10.1016/S0140-6736(03)13861-5
28. Guo, Y. Evolution and stages of China’s economic inequality from 1978 to 2018. PLoS One. (2023) 18:e0288873. doi: 10.1371/journal.pone.0288873
29. Song, X, Lan, L, Zhou, T, Yin, J, and Meng, Q. Economic burden of major diseases in China in 2013. Front Public Health. (2021) 9:649624. doi: 10.3389/fpubh.2021.649624
30. Maziarz, RT, Guérin, A, Gauthier, G, Heroux, J, Zhdanava, M, Wu, EQ, et al. Five-year direct costs of acute lymphoblastic leukemia pediatric patients undergoing allogeneic stem cell transplant. Int J Hematol Oncol. (2016) 5:63–75. doi: 10.2217/ijh-2016-0001
31. Lin, X, Wang, J, Huang, X, Wang, H, Li, F, Ye, W, et al. Global, regional, and national burdens of leukemia from 1990 to 2017: a systematic analysis of the global burden of disease 2017 study. Aging (Milano). (2021) 13:10468–89. doi: 10.18632/aging.202809
32. Zhou, Q, Hong, D, Lu, J, Zheng, D, Ashwani, N, and Hu, S. Pediatric medical care system in China has significantly reduced abandonment of acute lymphoblastic leukemia treatment. J Pediatr Hematol Oncol. (2015) 37:181–4. doi: 10.1097/MPH.0000000000000285
33. Luo, F, Huang, Y, Jiang, L, Fan, Q, and Gou, Z. Ethnic disparities and temporal trends in health resource allocation: a retrospective decadal analysis in Sichuan, a multi-ethnic province of Southwest China (2009–2019). BMC Health Serv Res. (2024) 24:541. doi: 10.1186/s12913-024-11036-6
34. Wang, YJ, Chen, XP, Chen, WJ, Zhang, ZL, Zhou, YP, and Jia, Z. Ethnicity and health inequalities: an empirical study based on the 2010 China survey of social change (CSSC) in western China. BMC Public Health. (2020) 20:637. doi: 10.1186/s12889-020-08579-8
35. Ren, Y, and Li, X. Direct and indirect costs of families with a child with acute lymphoblastic leukaemia in an academic hospital in China: a cross-sectional survey. BMJ Open. (2019) 9:e030511. doi: 10.1136/bmjopen-2019-030511
36. Natukunda, B, Omoding, A, Bongomin, F, Mubiru, KR, Ddungu, H, Sekaggya-Wiltshire, C, et al. One-year survival and prognosticators of adults with acute leukemia at the Uganda Cancer institute. JCO Glob Oncologia. (2023) 9:e2200244. doi: 10.1200/GO.22.00244
37. Liu, B, Lao, X, Feng, Y, Liu, J, Jiao, M, Zhao, M, et al. Cancer prevalence among the rural poverty-stricken population in Northeast China. Cancer Manag Res. (2019) 11:5101–12. doi: 10.2147/CMAR.S205867
38. Chen, C, and Pan, J. The effect of the health poverty alleviation project on financial risk protection for rural residents: evidence from Chishui City. China Int J Equity Health. (2019) 18:79. doi: 10.1186/s12939-019-0982-6
39. Zheng, L, and Peng, L. Effect of major illness insurance on vulnerability to poverty: evidence from China. Front Public Health. (2021) 9:791817. doi: 10.3389/fpubh.2021.791817
40. Zhou, Y, Guo, Y, and Liu, Y. Health, income and poverty: evidence from China’s rural household survey. Int J Equity Health. (2020) 19:36. doi: 10.1186/s12939-020-1121-0
41. Xu, L, You, X, Cui, Y, and You, J. Health poverty alleviation in China from the perspective of historical institutionalism: policy changes and driving factors. Front Public Health. (2024) 11:1265588. doi: 10.3389/fpubh.2023.1265588
42. Fu, L, Pei, T, Xu, J, Han, J, and Yang, J. Inspecting the “health poverty trap” mechanism: self-reinforcing effect and endogenous force. BMC Public Health. (2024) 24:917. doi: 10.1186/s12889-024-18464-3
Keywords: leukemia, China, poverty-alleviated regions, spatiotemporal analysis, financial toxicity
Citation: Li W, Lv Z, Chen M, Xia D, Wang J, Chen J and Zhang L (2025) Spatiotemporal inequality and financial toxicity of leukemia in post-poverty China: a national analysis of 832 counties (2019–2024). Front. Public Health. 13:1611102. doi: 10.3389/fpubh.2025.1611102
Edited by:
Fernanda Jannuzzi, Independent Researcher, Crown Point, United StatesReviewed by:
Satabdi Mitra, KPC Medical College and Hospital, IndiaPetre M. Savescu, University of Craiova, Romania
Nathalia Lopez Duarte, Rio de Janeiro Municipal Health Secretariat (SMS-RJ), Brazil
Copyright © 2025 Li, Lv, Chen, Xia, Wang, Chen and Zhang. This is an open-access article distributed under the terms of the Creative Commons Attribution License (CC BY). The use, distribution or reproduction in other forums is permitted, provided the original author(s) and the copyright owner(s) are credited and that the original publication in this journal is cited, in accordance with accepted academic practice. No use, distribution or reproduction is permitted which does not comply with these terms.
*Correspondence: Lulu Zhang, emxscm1pdEBhbGl5dW4uY29t
†These authors have contributed equally to this work and share first authorship