 Xueying Han
 Rulin Ma
 Jia He
 Bo YangSilin ChenXuelian WuDilimulati MuhetaerLanqing Ma
 Shijie ShenXiaoxue LiPengxiang Zuo*
 Heng Guo*
- Shihezi University School of Medicine, Shihezi, China
Introduction: Meteorological factors and air pollutants are two important factors affecting hospitalisation for coronary heart disease. This study aims to investigate the effects of meteorological factors and air pollutants on the risk of coronary heart disease hospitalisation and their interactions in rural areas with heavy particulate matter pollution at the edge of the desert in southern Xinjiang.
Methods: In this study, patients with coronary heart disease who were hospitalized in Tangyi Town, Tumushuke City, Xinjiang Province, were selected as the study subjects, and the lagged effects of meteorological factors and air pollutants on the risk of coronary heart disease hospitalisation and their interactions were analysed by combining the distributional lag nonlinear model and the quasi-Poisson regression model.
Results: The results showed that the associations between meteorological factors and air pollutant concentrations with the risk of coronary heart disease hospitalisation both showed non-linear and lagged effects. There was an antagonistic effect between mean daily temperature and PM2.5 and PM10 on the effect of coronary heart disease hospitalisation, with RERIs of −0.73 (95% CI: −2.63, −0.04), and −1.14 (95% CI: −1.93, −0.60), respectively. The relative risk of coronary heart disease hospitalisation in the low-temperature, high PM10 concentration environment was 1.53 (95% CI: 1.09, 2.13). The risk of hospitalization for coronary heart disease is increased by 30 and 19% in environments with low humidity and high PM2.5 and PM10 concentrations, respectively. There are also interactions between particulate matter and gaseous pollutants and between different gaseous pollutants.
Discussion: This study suggests the need to necessity of management of multiple air pollutants and response to climate change, as well as the importance of implementing targeted preventive and control measures by the relevant authorities in according to meteorological and air pollution conditions, which can effectively reduce the hospitalization rate of patients with coronary heart disease.
1 Introduction
Coronary heart disease (CHD) is a cardiovascular disease caused by coronary atherosclerosis leading to coronary artery stenosis or blockage, which ultimately causes myocardial ischemia or hypoxia (1). According to the Global Burden of Disease (GBD) statistics, CHD is the leading cause of death in the world, with 9 million deaths worldwide (2, 3). The China Cardiovascular Health and Disease Report shows that the number of people suffering from CHD in China is 11.39 million, making it one of the main causes of death among residents. Meteorological factors and air pollutants are two important factors affecting CHD (4). A large number of studies are exploring the environmental factors related to CHD including meteorological factors and air pollutants. For example, a national study in China found that a 10% increase in ambient humidity during the summer months increased the risk of Cardiovascular Diseases (CVD) by 17%; further subgrouping of ambient humidity during the summer months showed a “U” shaped effect, meaning that both dry and wet environments may increase the risk of CVD (5). Miao’s findings suggest that the risk of acute myocardial infarction(AMI) increases progressively with decreasing temperature, especially at extremely cold temperatures (−2°C), an environment in which the cumulative Relative Risk(RR) for AMI at a lag of 30 days is 4.66 (1.76, 12.30), but a peak in RR was observed at approximately 24°C as the temperature increased (6). Wang’s study found that the risk of CVD hospitalization increased by 2.3 and 0.8% for each 10 μg/m3 increase in PM2.5 and PM10 concentrations, respectively. Both PM2.5 and PM10 had a cumulative lag effect on the number of CVD hospitalizations, with a 7-day cumulative RR of 1.115 for PM2.5 and a 3-day cumulative RR of 1.015 for PM10 (7). Li’s study analyzed the effects of various pollutants and meteorological conditions on CHD, and found that for every 10 μg/m3 increase in PM10, NO2, and SO2 concentrations, the risk of death from CHD increased by 0.4, 1.1, and 1.5%, respectively. Heat wave and cold wave events increased the risk of CHD death by 20.2 and 19.9%, respectively. In addition, there was a synergistic effect between heat waves and PM10, which increased the risk of CHD death by an additional 37% (8). These studies have demonstrated that the effects of meteorological factors and air pollutants on CHD have not only acute effects, but also non-linear and lagged effects, and that the effects of different meteorological factors and air pollutants vary in different areas. Our study area is located at the edge of the Tarim Basin in southwestern Xinjiang, where the diurnal temperature difference is large and severely affected by particulate matter. Currently, there are few studies on the effects of meteorological factors and air pollutants on CHD in rural areas of southern Xinjiang. Previous studies have mostly used generalized additive model, with little analysis of lagged effects. Compared with generalized additive model, distributed lag nonlinear models (DLNM) can better utilize cross-basis functions to add lag dimensions to the exposure-effect relationship and simultaneously evaluate the lag effects and nonlinear effects of exposure factors (9). Therefore, this study used DLNM to assess the effects of short-term exposure to meteorological factors and air pollutants on the risk of CHD hospitalization in rural areas of southern Xinjiang, and to provide a scientific basis for further assessment of the health effects of meteorological factors and air pollutants.
2 Methods and materials
2.1 Data source
This study obtained daily CHD hospitalization case data from January 1, 2016 to December 31, 2022 in Tangyi Town, Tumushuke City, Xinjiang Province (Figure 1). The case information included hospitalization date, disease diagnosis code (ICD-10), disease diagnosis name, gender and age. The main hospitalization diagnosis was CHD (ICD-10: I25.1), and 882 hospitalized cases with a disease diagnosis of CHD were included in the analysis.
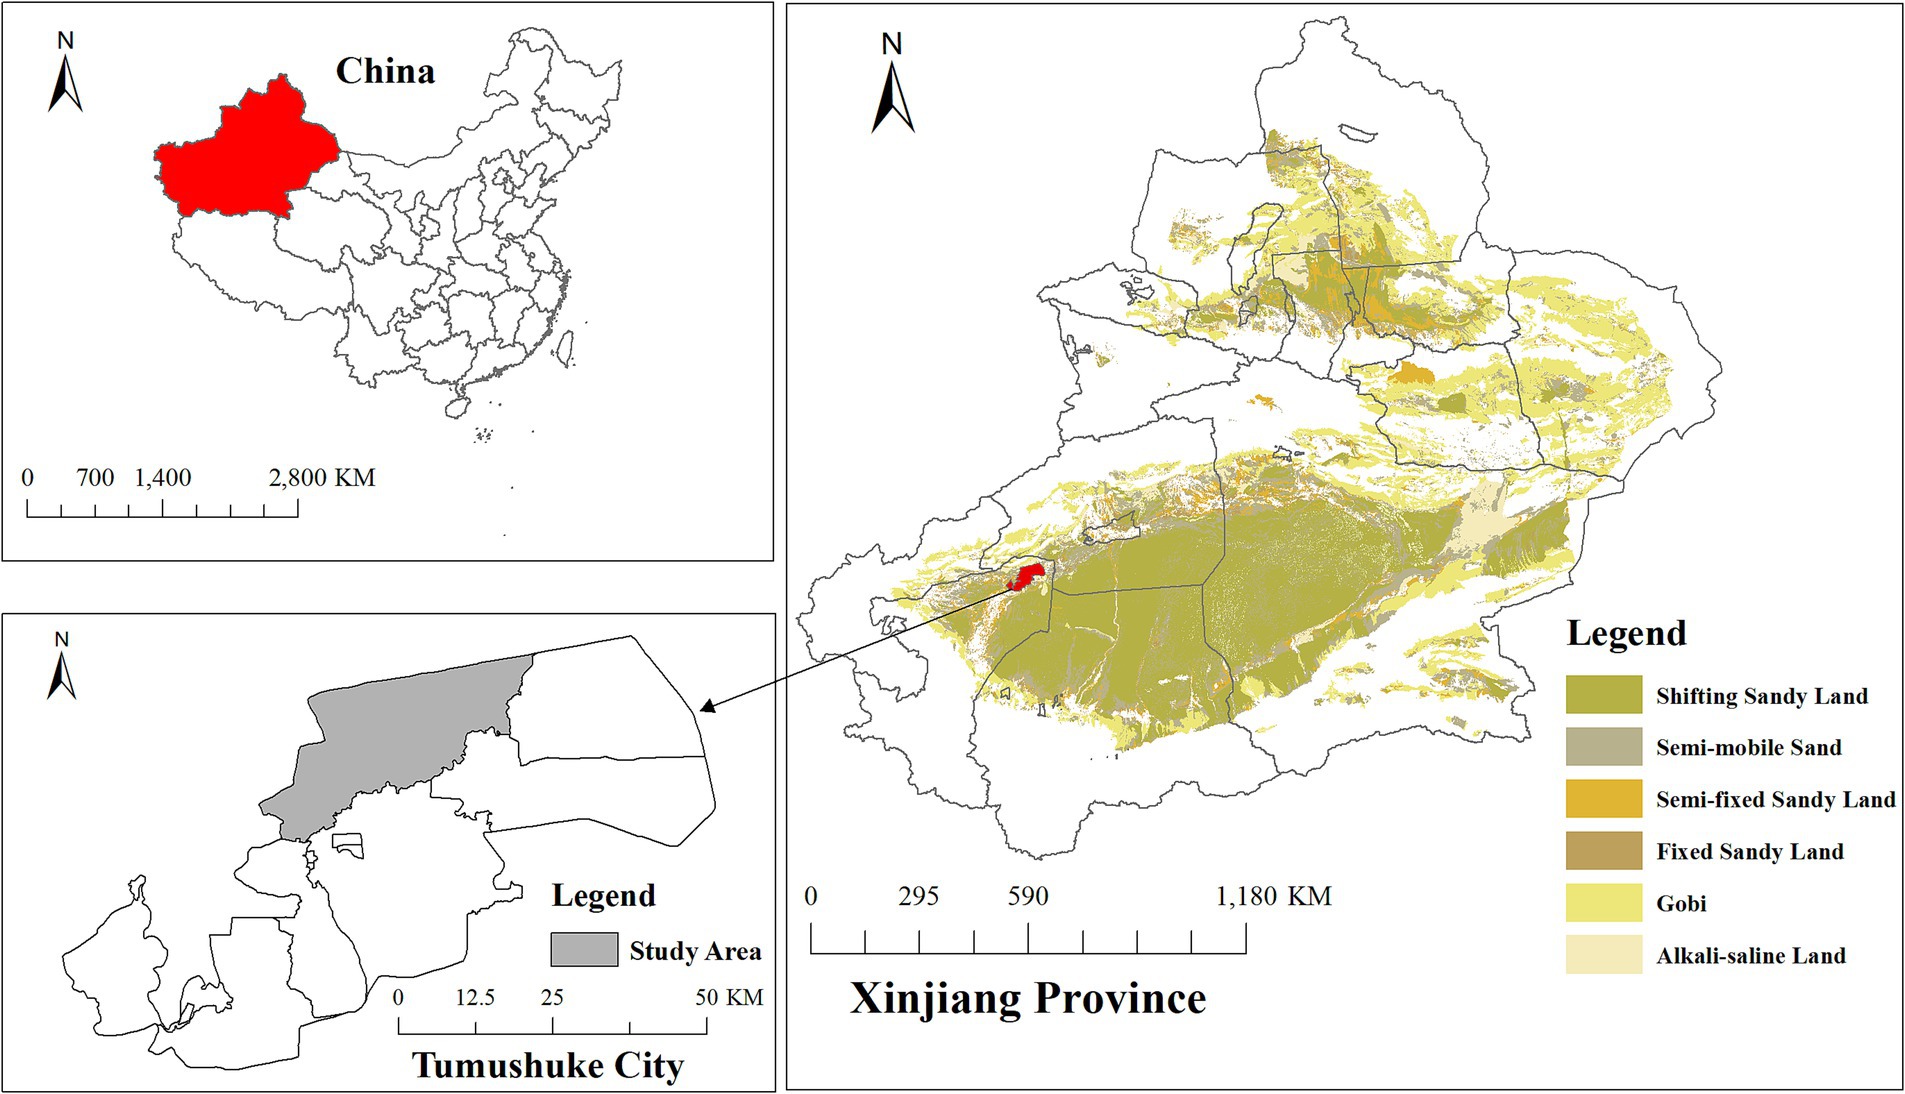
Figure 1. Geographic location of Tangyi Township, Tumushuke City, Xinjiang Province, China. Data source for desert distribution layer: Wang et al. (44) 1:100,000 desert dataset, National Tibetan Plateau Data Center.
Pollutant data were obtained based on the China Big Data Seamless Ground particulate matter (PM2.5, PM10), nitrogen dioxide (NO2), sulfur dioxide (SO2) dataset and China Seamless Ground Maximum 8-h Sliding Average Ozone (O3_8h) dataset obtained from Wei (10–14); meteorological data were obtained based on the Third Pole Region Temperature, Precipitation, Specific Humidity, Wind Speed, and Air Pressure dataset obtained from Yang (15). All of the above meteorological and pollutant data are open access. This study began downloading these data on November 30, 2024. ArcGis 10.8 was utilized to convert the above data into raster format data and to extract meteorological and pollutant concentration daily average data for Tangyi Town, Tumushuke City, Xinjiang Province, according to the administrative division area.
The study was approved by the Ethics Review Committee of the First Affiliated Hospital of Shihezi University School of Medicine (shz2010LL01). All experimental protocols involving human data were in accordance with the Declaration of Helsinki.
2.2 Statistical analysis
The statistical descriptions of daily mean temperature, relative humidity, and air pollutant concentrations (PM2.5, PM10, NO2, SO2, O3) were performed using a variety of methods, such as mean and standard deviation, percentile (P25, P50, P75), maximum versus minimum, and the number of days and multiples of pollutant concentration exceedances. To examine the relationship between meteorological variables and pollutant variables, Spearman’s correlation analysis was utilized. Chi-square test was used to statistically analyze the number of CHD hospitalizations by gender, age, and seasonal subgroups. Distributed lag nonlinear models (DLNM) were used to estimate the independent effects of daily mean temperature, relative humidity, and pollutant concentration on CHD, with subgroup analyses based on gender and age. In order to visualize the lagged effects of meteorological factors and pollutant concentrations, we also plotted three-dimensional and contour plots. In order to better understand the interaction effects between variables, we categorized these variables into binary variables by using the point of the minimum relative risk value of the exposure effect curves for mean daily temperature, relative humidity, and pollutants as the threshold point. Quasi-Poisson regression models were then used to estimate the interactions between these variables.
2.3 Distributed lag nonlinear model (DLNM)
The DLNM model allows for simultaneous consideration of nonlinear and lagged effects of the exposure variable on the outcome variable by constructing a cross-basis function (9), and quasi-Poisson regression allows for consideration of over-discrete types of data. Hence, the DLNM model for estimating the effects of meteorological factors and pollutant concentrations on CHD hospitalization is as follows:
In Equation 1, Yt represents the number of hospitalized cases of CHD on day t; μt represents the expected number of CHD hospitalizations on day t. In Equation 2, α1 is the intercept; Xt represents the variables on day t, including mean temperature, relative humidity, PM2.5, PM10, NO2, SO2, and O3; cb(Xt) was applied to capture the relationship between daily meteorological factors or daily pollutant concentrations (Xt) and the risk of CHD hospitalization. We used the natural spline functions (“ns”) in controlling the confounding of long-time trend. Based on previous literature, the maximum lag period considered in this analysis is 7 days. The degree of freedom (df) to control long-term trends is 6 (16). DOWt and Holidayt were applied to control for week effects and holiday effects, respectively.
2.4 Interaction analysis
The quasi-Poisson regression model was employed to analyze the interaction of meteorological factors with pollutants and between pollutants (16, 17). Prior to the interaction analysis, we conducted a Spearman’s correlation analysis among all meteorological and pollutant variables to assess their interrelationships. Variables with a Spearman’s correlation coefficient greater than 0.8 in absolute value were considered highly correlated and were excluded from the interaction analysis to avoid multicollinearity issues. Daily mean temperature, relative humidity and pollutant variables were categorized based on the exposure-effect curves obtained from the DLNM model. The turning point of the curve or the point of the lowest risk effect value was chosen as the threshold point at which the variables were binary categorized. The lowest risk point corresponds to the lowest level of disease risk on the exposure-effect curve, and using this point as the threshold allows for a better understanding of the interaction effects between variables. For the meteorological and pollutant variables, we define T = 0 if the value of the variable is less than or equal to the value at the threshold point, and T = 1 if it exceeds the threshold point. The interaction model is then constructed as Equations 3, 4:
where α is the intercept; When analyzing the interaction between meteorological factors and air pollutants, A represents meteorological factors and B represents air pollutants; when analyzing the interaction between air pollutants, A and B represent two different air pollutants, both of which are dichotomous variables; and A*B is the interaction term. The relative risks (RRs) associated with A, B and A*B were obtained from Equation 4, namely, RR10, RR01 and RR11, respectively. From the model, we can obtain the relative risk (RR) values for RR10, RR01, and RR11. These values are used to calculate the interaction relative risk (IRR), as well as the relative excess risk due to interaction (RERI) along with its corresponding 95% confidence interval (CI). These measures are utilized to evaluate the potential interaction effect. The formula for calculating IRR and RERI, along with their 95% CI, is as Equations 5, 6:
A significant interaction is observed when the 95% CI of the IRR does not include 1 or when the 95% CI of the RERI does not include 0. Specifically, if IRR > 1 or RERI>0, it indicates a synergistic interaction, suggesting that the combined effect of meteorological factor and air pollution or the combined effect between air pollutants is greater than their individual effects alone. On the other hand, if IRR < 1 or RERI < 0, it indicates an antagonistic interaction.
2.5 Sensitivity analysis
Sensitivity analysis based on the Bayesian Information Criterion was conducted to determine the df controlling the long-term trends. In addition, the exposure-effect curves of meteorological factors and air pollutants on CHD hospitalization were all univariate analysis results. The exposure response curves of daily meteorological factors and air pollutions to CHD hospitalization, respectively, were univariate analyses. By controlling for confounding analysis, when analyzing one variable (temperature, relative humidity or pollutions), all the others were taken as confounding control to analyze whether the pre- and post-differences were small.
The “dlnm”, “splines” and “mgcv” packages in R software (V.4.4.2) were used to conduct all the analyses.
3 Results
3.1 Descriptive statistics
A total of 882 cases were hospitalized for CHD from 2016 to 2022. The age < 65 years group had the highest percentage of cases (58.6%). In addition, spring was the season with the highest number of CHD admissions. There were statistically significant differences in the gender, age and season groups of the cases (p < 0.05) (Table 1). Spearman’s rank correlation coefficients between meteorological factors and air pollutants are shown in Table 2.
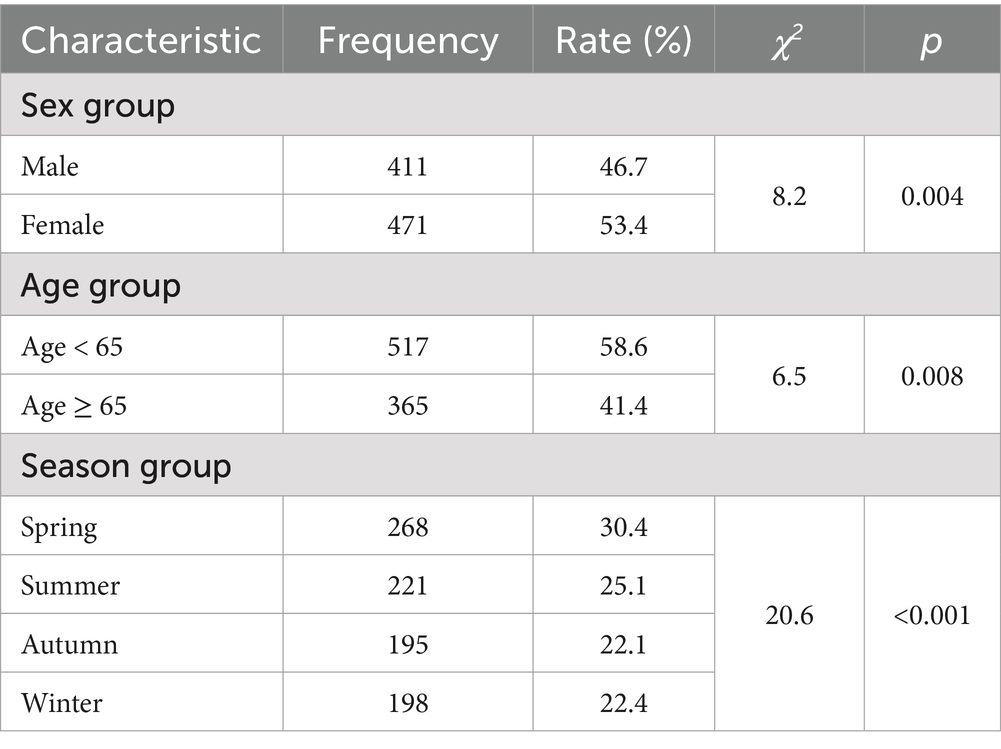
Table 1. Description of CHD hospitalization cases, 2016–2022.
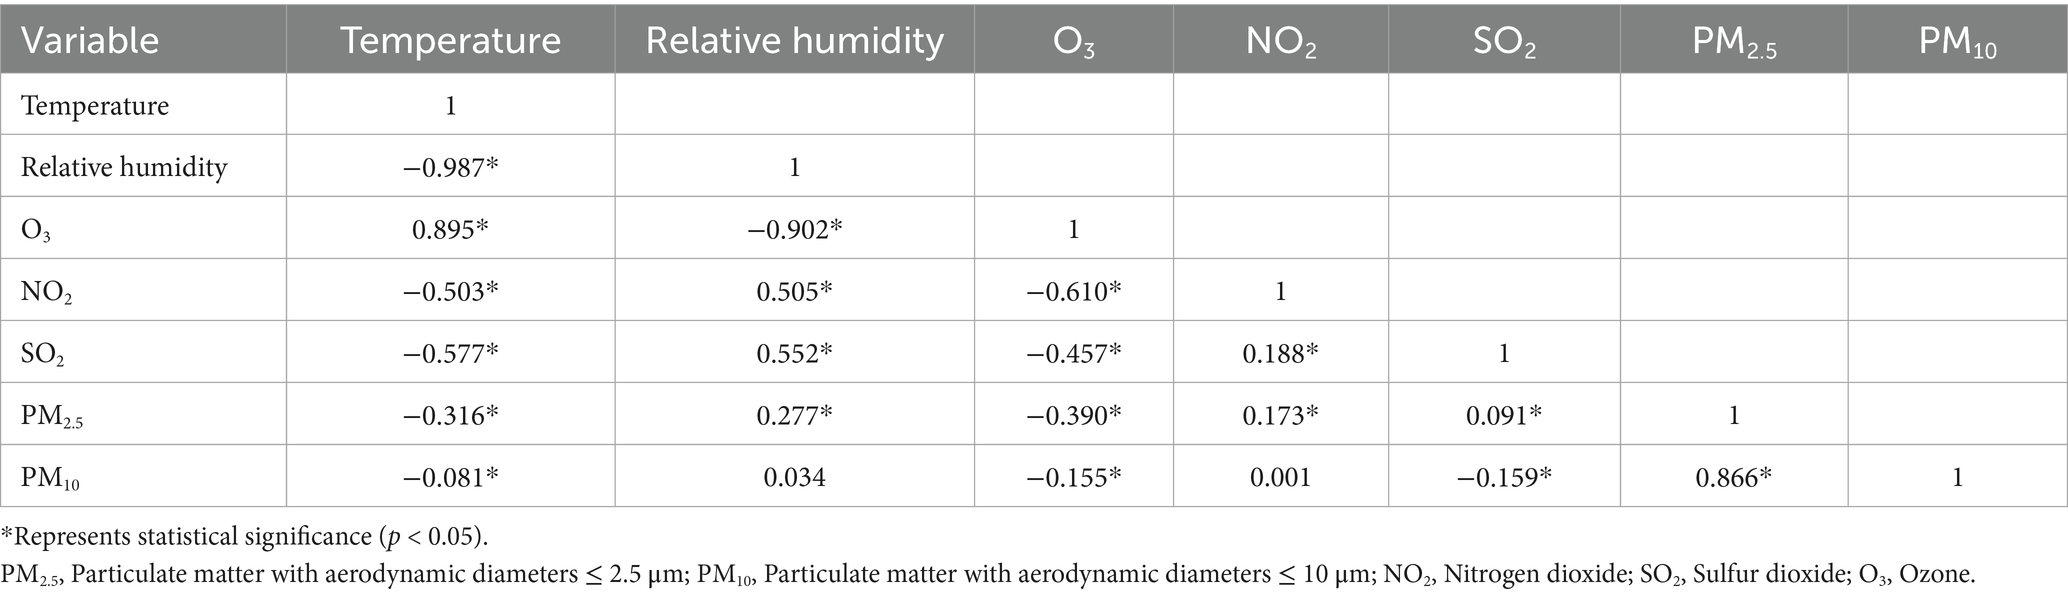
Table 2. Spearman’s rank correlation coefficients for meteorological factors and air pollutants, 2016–2022.
The average concentrations of PM2.5, PM10, SO2, NO2, and O3_8h were measured as 78.8 μg/m3, 274.9 μg/m3, 11.4 μg/m3, 19.6 μg/m3, and 100.3 μg/m3, respectively. The secondary maximum concentration limits for PM2.5, PM10, SO2, NO2, and O3_8h were 75, 150, 150, 80, and 160 μg/m3, respectively. PM2.5 and PM10 were the pollutants with the most serious exceedance days and maximum exceedance multiples, with maximum exceedance multiples of 8.2 and 16.3, respectively (Table 3).
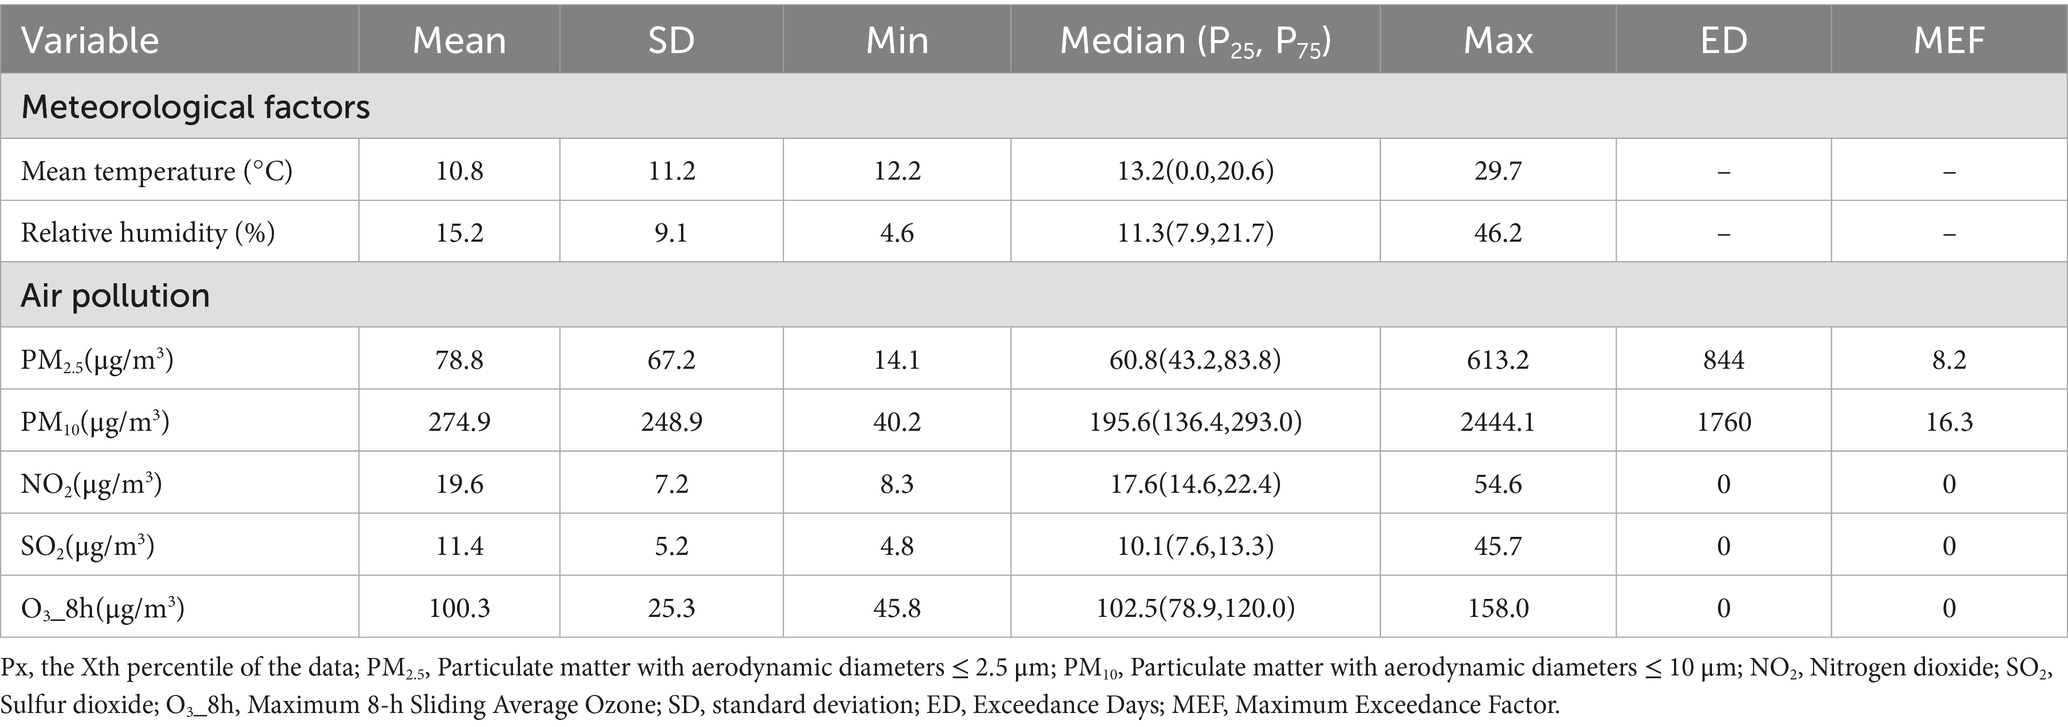
Table 3. Description of meteorological factors and air pollutants, 2016–2022.
3.2 Association between meteorological factors, air pollutants and the risk of hospitalization for CHD
Figure 2 shows cumulative exposure-effect curves for the effects of meteorological factors and air pollutants on CHD with a 7-day lag. Both lower and higher temperatures and relative humidity increased the risk of CHD hospitalization, with the RR for temperature being greatest at 12.8°C (RR = 1.52, 95% CI: 1.14, 2.01) and for relative humidity at 11% (RR = 1.46, 95% CI: 1.15, 1.85). The risk of CHD hospitalization increased significantly with higher PM2.5, PM10 concentrations. The lowest risk points of the exposure-effect curves for mean daily temperature, relative humidity, PM2.5, PM10, NO2, SO2, and O3 were at −1°C, 24%, 50 μg/m3, 156 μg/m3, 16 μg/m3, 11 μg/m3, and 111 μg/m3, respectively, and the variables were categorized in a binary fashion at these points.
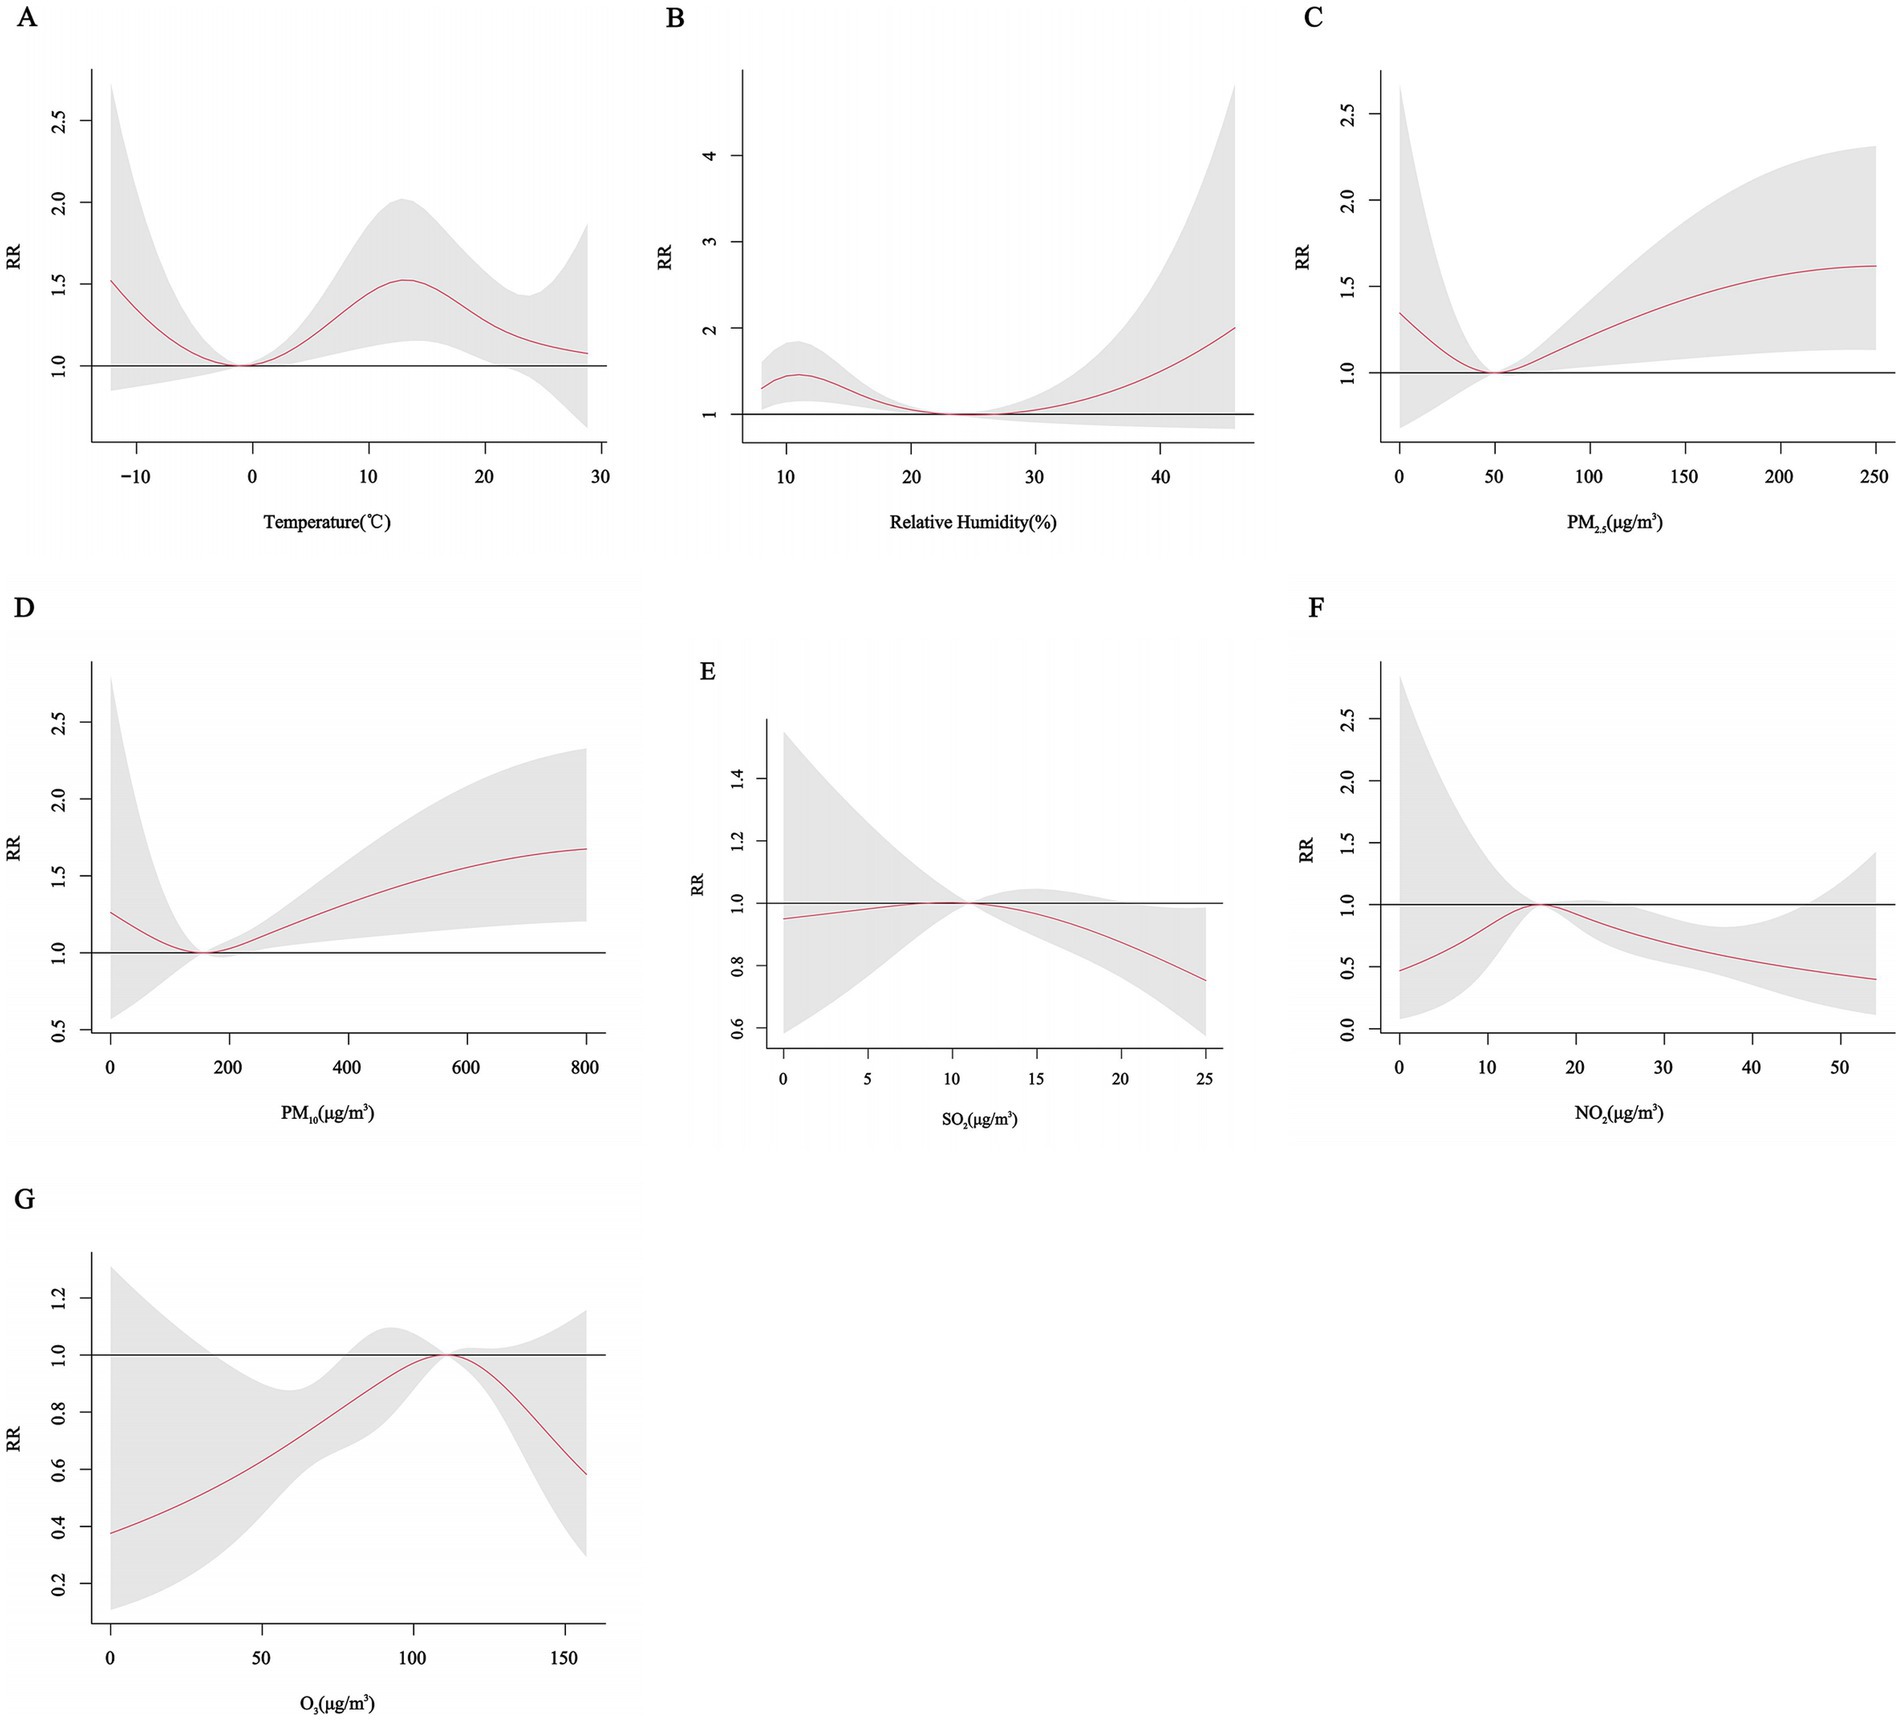
Figure 2. Cumulative exposure-effect curves of the effects of meteorological factors and air pollutants on CHD with a 7-day lag. (A) Temperature, (B) Relative humidity, (C) PM2.5: Particulate matter with aerodynamic diameters ≤ 2.5 μm, (D) PM10: Particulate matter with aerodynamic diameters ≤ 10 μm, (E) SO2: Sulfur dioxide, (F) NO2: Nitrogen dioxide, (G) O3: Ozone.
The three-dimensional plots showed that the associations of daily mean temperature, relative humidity and pollutant concentrations with CHD all had nonlinear and lagged effects. However, different pollutants had different trends and showed different effects at different lag days (Figure 3).
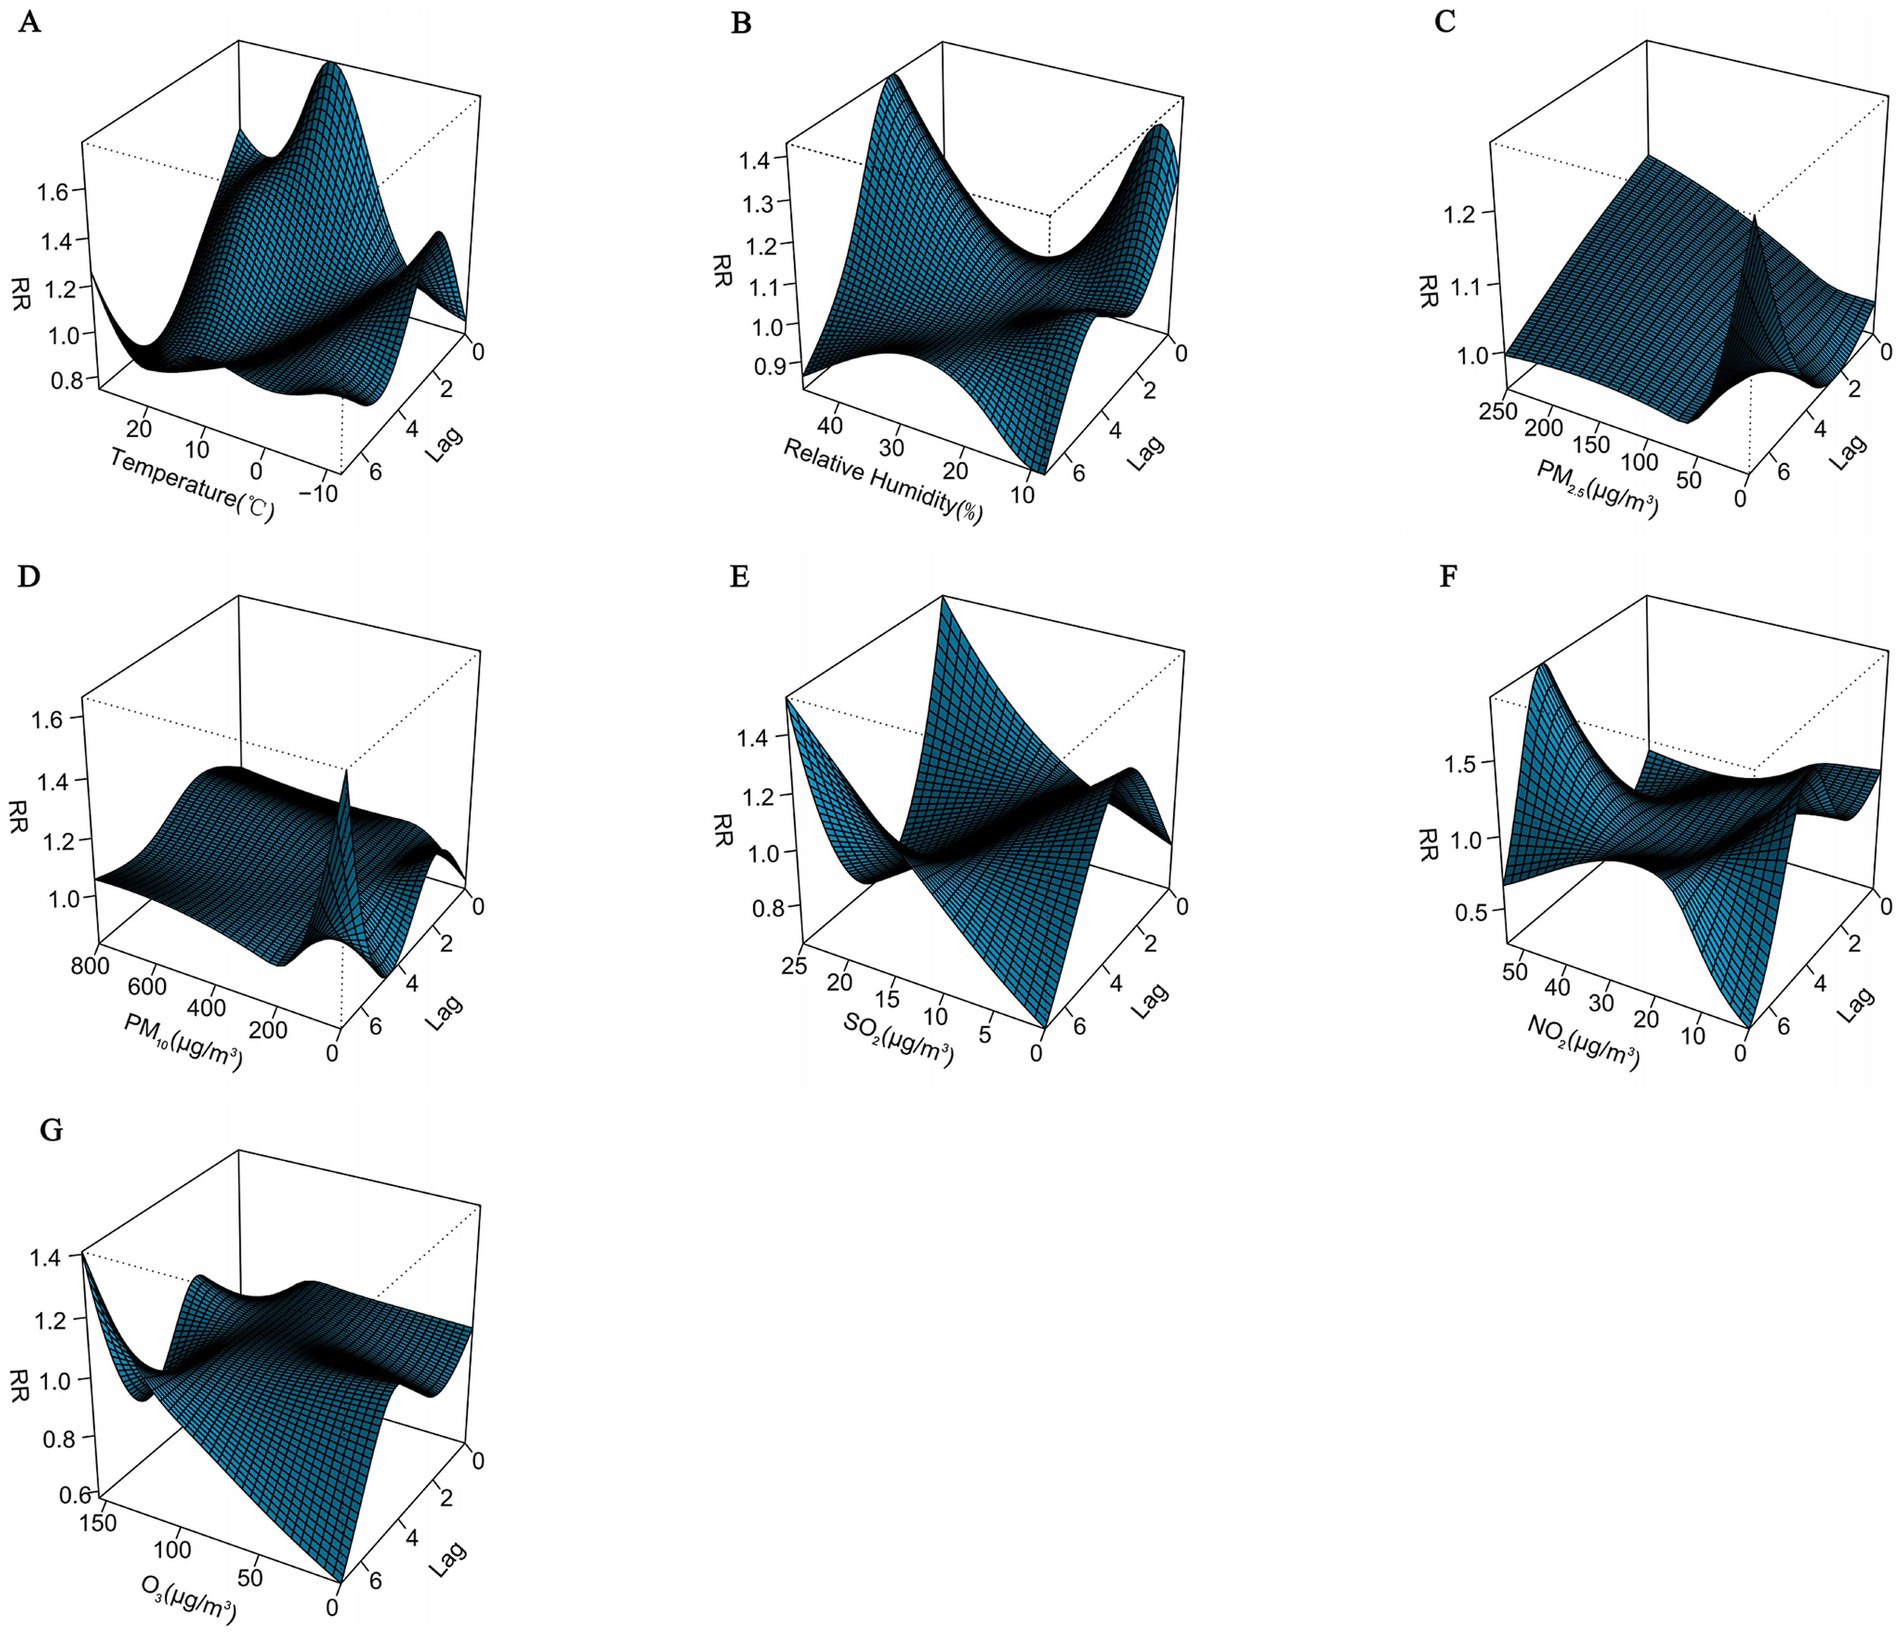
Figure 3. Three-dimensional plots of the association between meteorological factors and air pollutants and CHD with a 7-day lag. (A) Temperature, (B) Relative humidity, (C) PM2.5: Particulate matter with aerodynamic diameters ≤ 2.5 μm, (D) PM10: Particulate matter with aerodynamic diameters ≤ 10 μm, (E) SO2: Sulfur dioxide, (F) NO2: Nitrogen dioxide, (G) O3: Ozone.
In order to visualize the lagged effects of meteorological factors and air pollutants, we further plotted the contour plots of the effects of meteorological factors and air pollutants on CHD with a lag of 7 days. The contour plots suggest that lower temperature and higher relative humidity may also exhibit varying lag effects on CHD. In addition, different pollutants also have different lag effects (Figure 4).
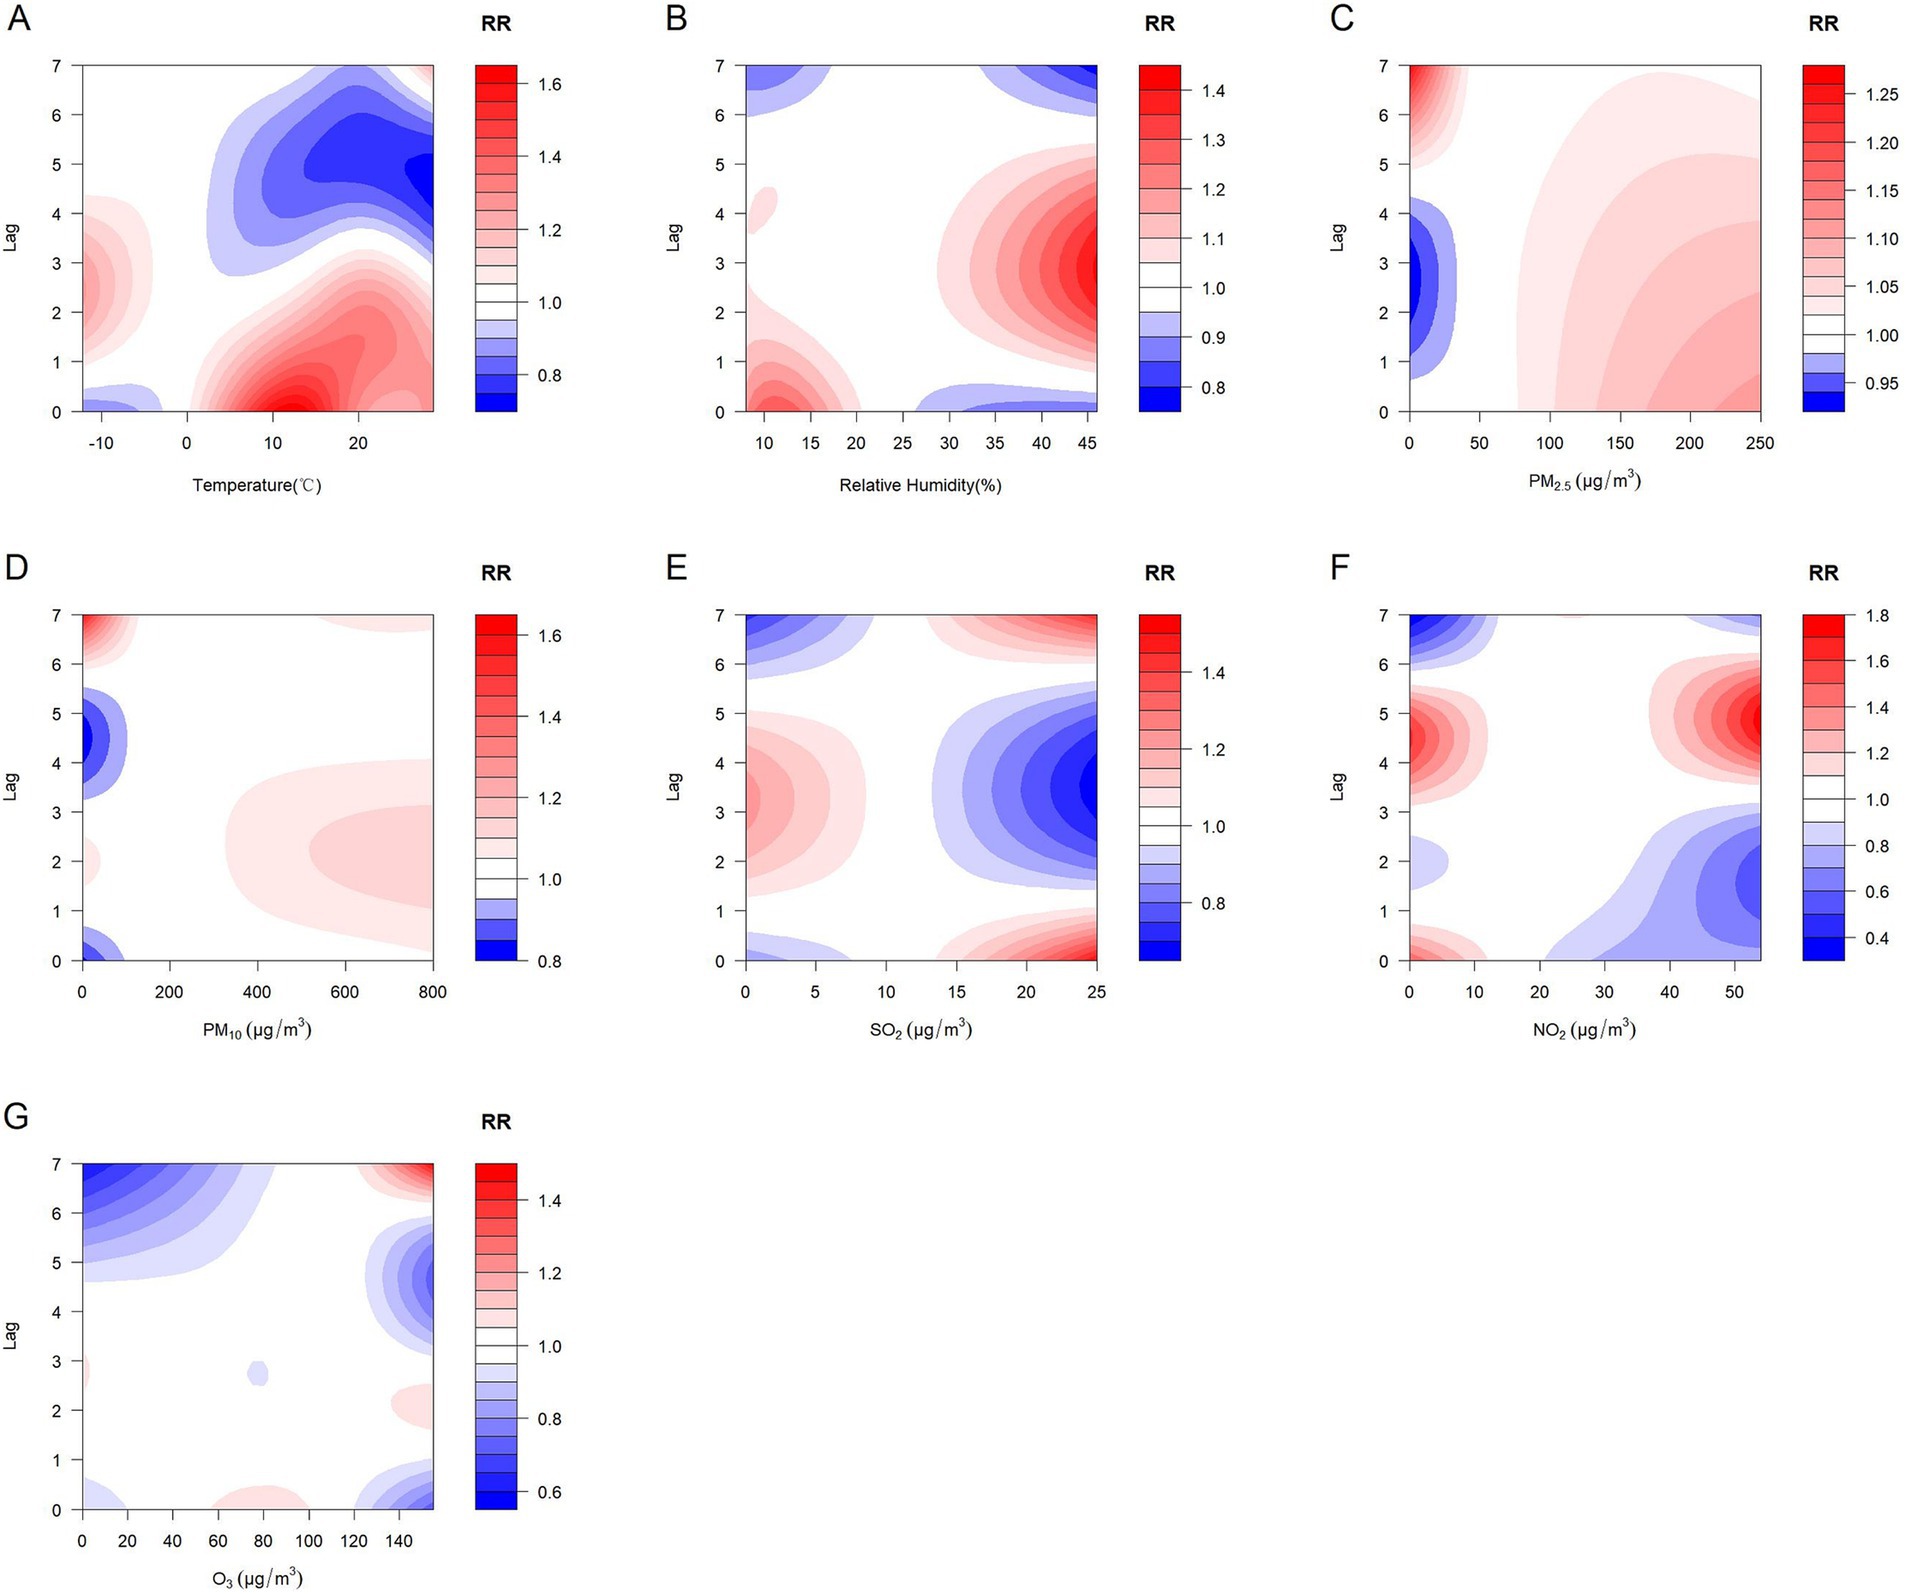
Figure 4. Contour plots of the effects of meteorological factors and air pollutants on CHD with a lag of 7 days. (A) Temperature, (B) Relative humidity, (C) PM2.5: Particulate matter with aerodynamic diameters ≤ 2.5 μm, (D) PM10: Particulate matter with aerodynamic diameters ≤ 10 μm, (E) SO2: Sulfur dioxide, (F) NO2: Nitrogen dioxide, (G) O3: Ozone.
3.3 Subgroup analysis
Gender subgroup analyses showed that for males, the risk of CHD hospitalization increased with decreasing temperature, peaking at approximately 12°C with a RR of 1.46 (95% CI: 0.97, 2.19), but the effect was not statistically significant. The effect on CHD hospitalization tended to increase and then decrease with decreasing relative humidity, peaking at 12% relative humidity with an RR of 1.47 (95% CI: 1.03, 2.00), and higher relative humidity did not have a significant effect on hospitalization but tended to increase. The effects of PM2.5, PM10, SO2, NO2, and O3 on CHD in males increased and then decreased, but none of these effects were significant. In females, the effect of temperature on CHD hospitalization showed a decreasing and then increasing trend, with a non-significant effect at low temperatures, peaking at approximately 15°C with an RR of 1.67 (95% CI: 1.16, 2.41), and the effect of relative humidity was similar to that of males, peaking at 10% relative humidity with an RR of 1.55 (95% CI: 1.12, 2.14). The effects of PM2.5 and PM10 concentrations on the risk of CHD hospitalization showed a “U” shaped trend, whereas the effects of SO2 and NO2 on CHD in females showed a decreasing trend, and the effect of O3 showed an inverted “U” shaped trend (Figures 5, 6).
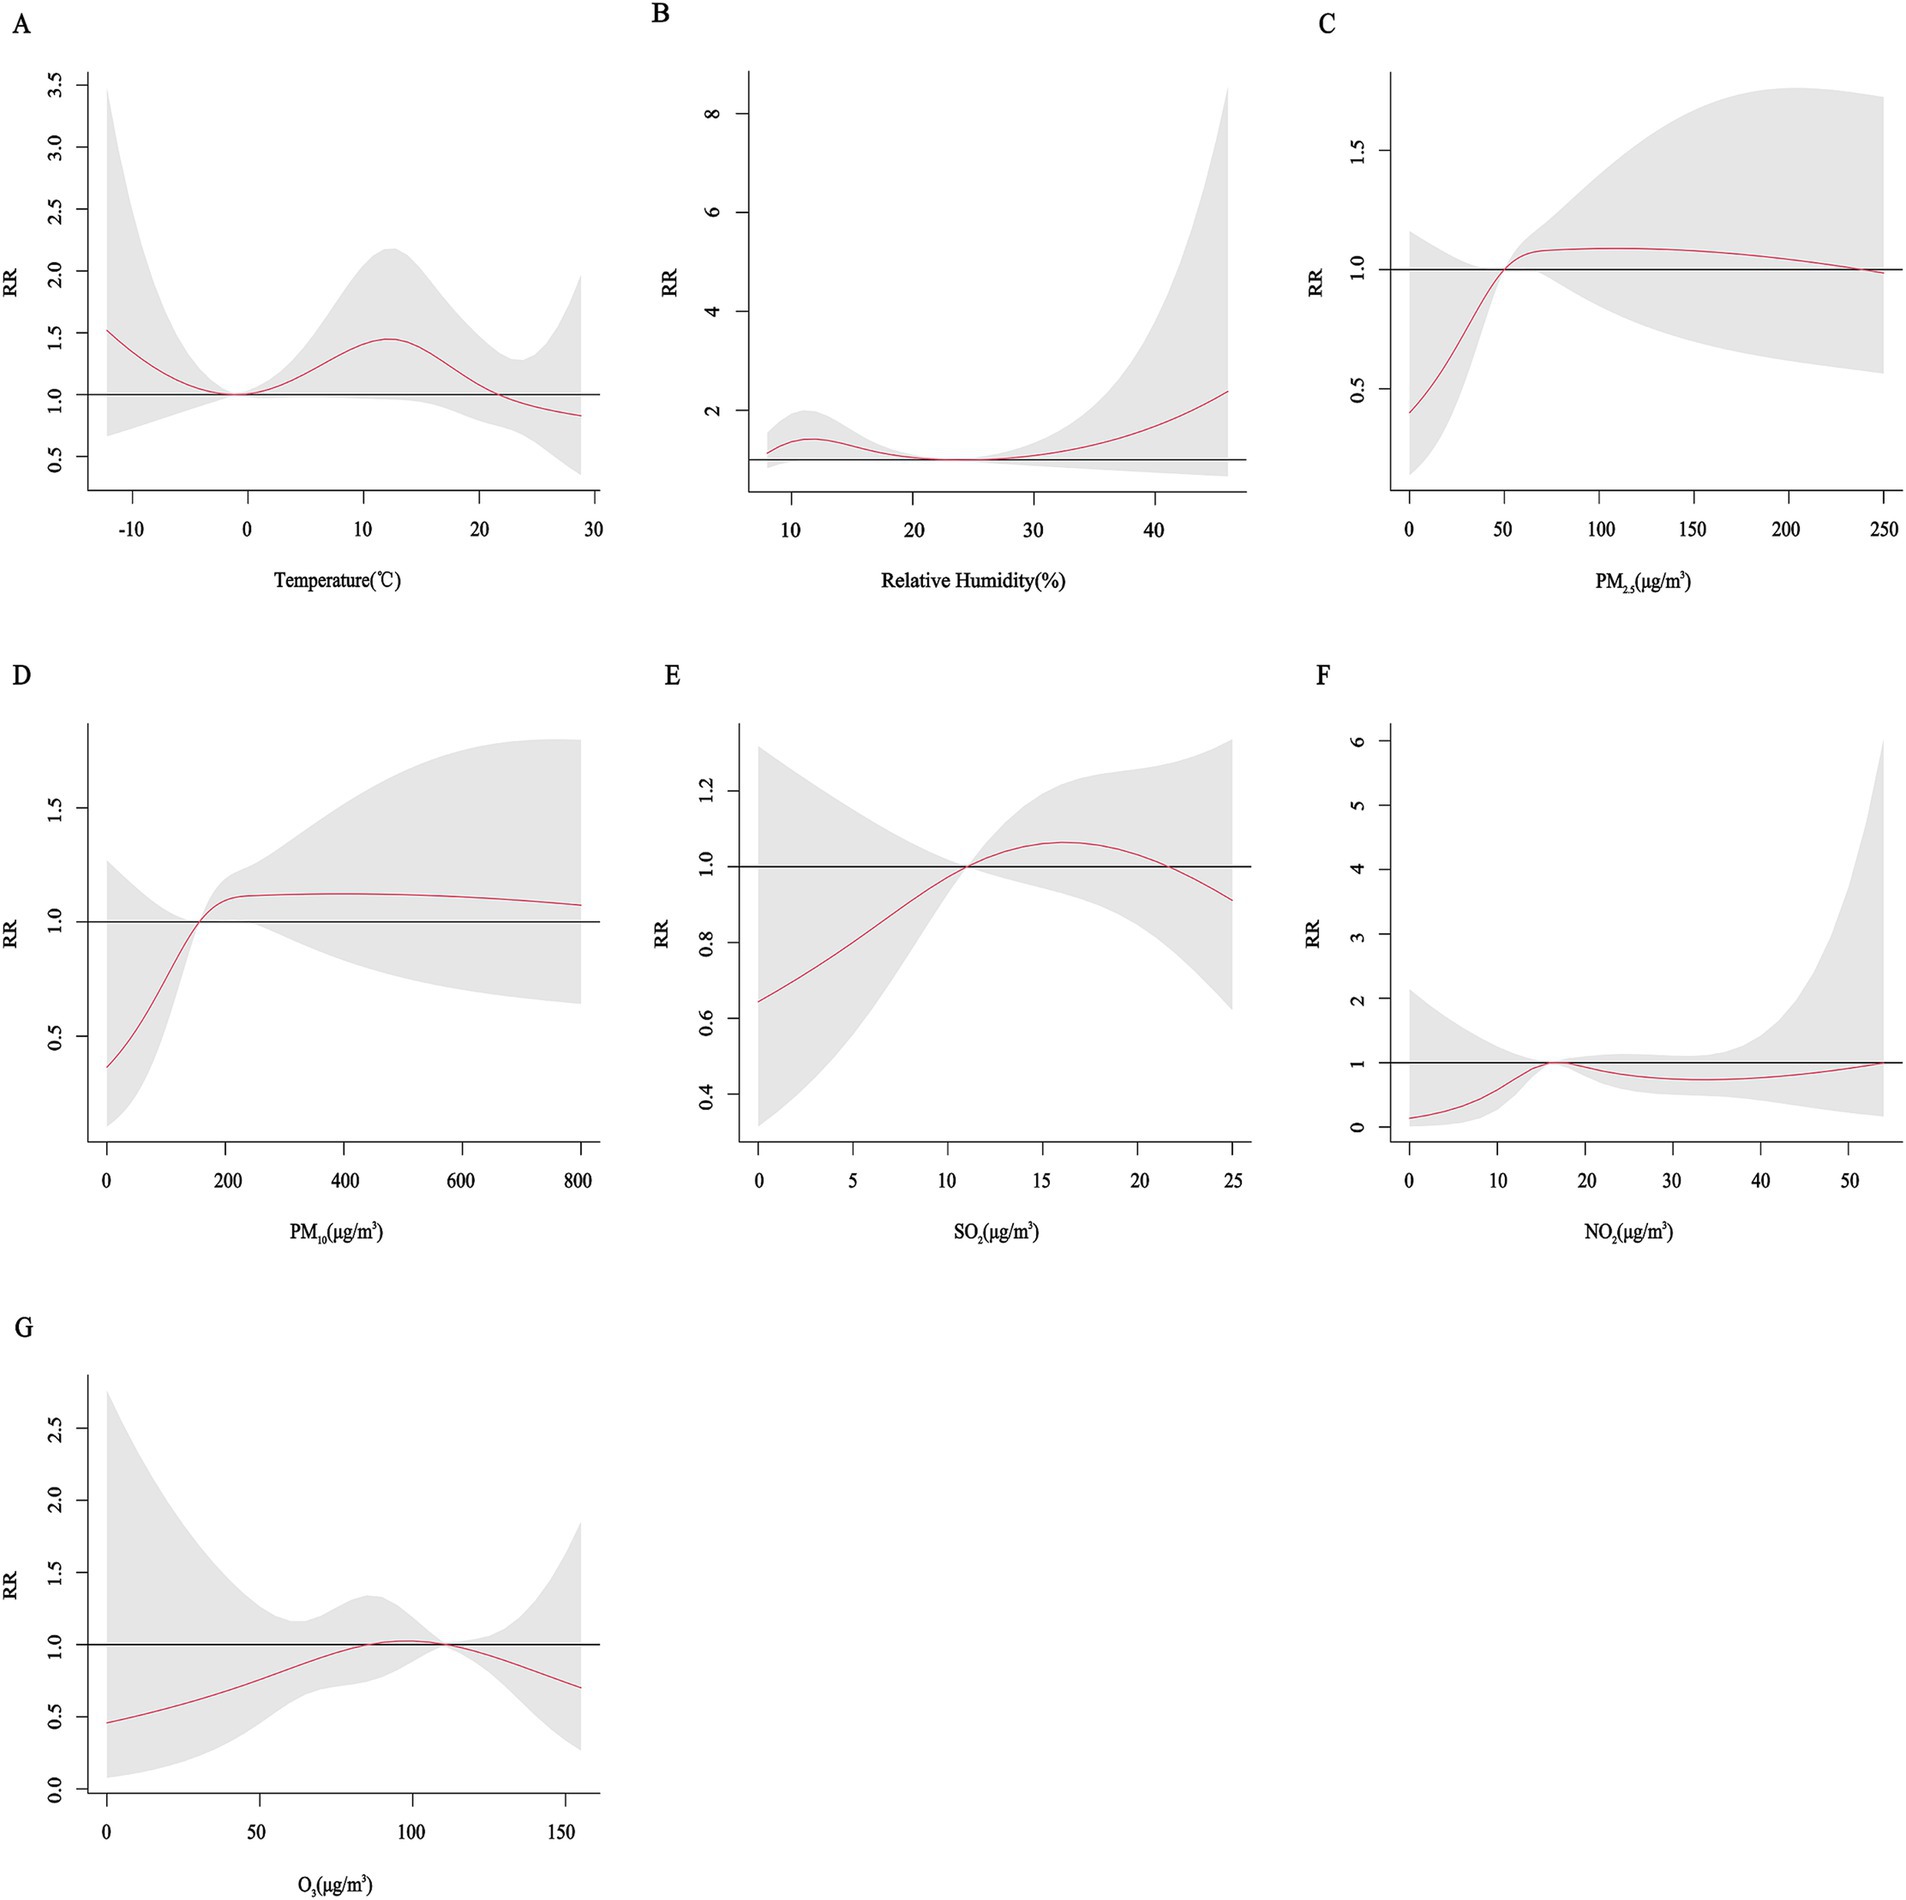
Figure 5. Cumulative exposure-effect curves of the effects of meteorological factors and air pollutants on CHD in male with a 7-day lag. (A) Temperature, (B) Relative humidity, (C) PM2.5: Particulate matter with aerodynamic diameters ≤ 2.5 μm, (D) PM10: Particulate matter with aerodynamic diameters ≤ 10 μm, (E) SO2: Sulfur dioxide, (F) NO2: Nitrogen dioxide, (G) O3: Ozone.
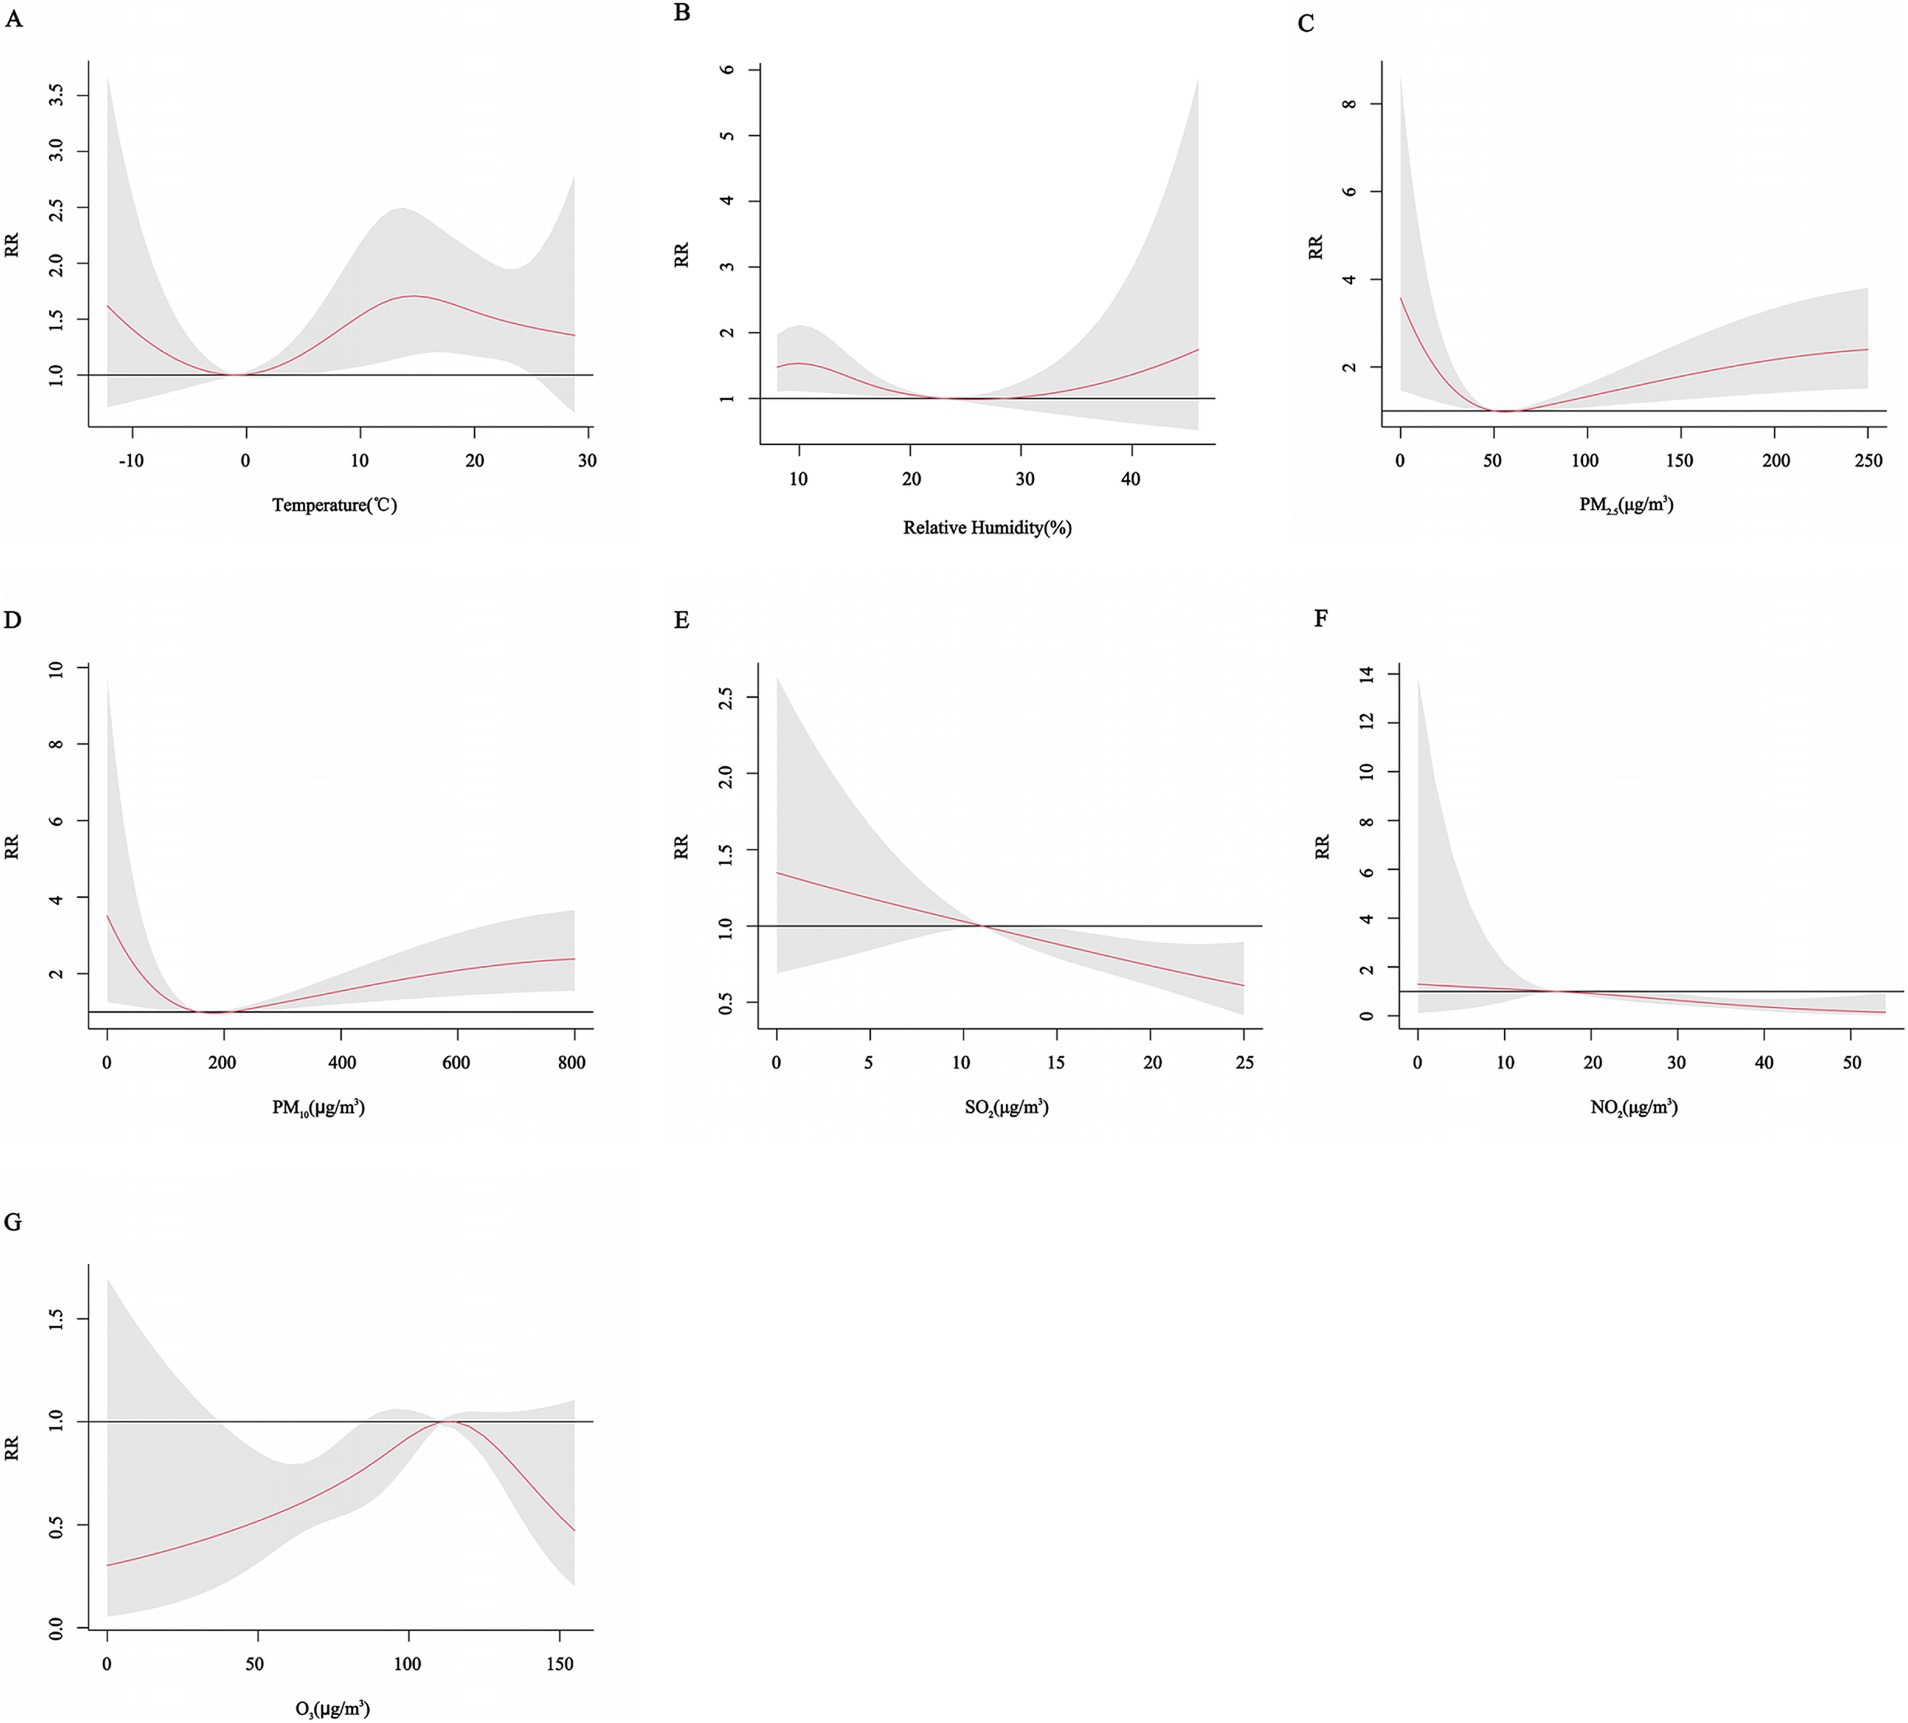
Figure 6. Cumulative exposure-effect curves of the effects of meteorological factors and air pollutants on CHD in female with a 7-day lag. (A) Temperature, (B) Relative humidity, (C) PM2.5: Particulate matter with aerodynamic diameters ≤ 2.5μm, (D) PM10: Particulate matter with aerodynamic diameters ≤ 10 μm, (E) SO2: Sulfur dioxide, (F) NO2: Nitrogen dioxide, (G) O3: Ozone.
Age subgroup analyses showed a U-shaped trend in the effect of PM2.5 concentration and relative humidity on the risk of CHD hospitalization in all age groups. The effect of lower relative humidity on the risk of CHD hospitalization peaked at 12% for all age groups. For the lower age groups (age < 65 years), different trends were observed for different pollutants, with a “U” shaped effect for PM10, with the risk of CHD hospitalization gradually increasing with increasing PM10 concentrations at higher concentrations, but not significantly at lower concentrations. The effect of temperature on CHD showed a similar U-shaped trend, with an increased risk of CHD hospitalization at both lower (approximately −10°C) and intermediate temperatures (10°C-20°C) and a peak RR at 13°C. The effect of SO2 showed a gradual decrease with decreasing concentration. The effects of NO2 and O3 on CHD showed an inverted “U” shaped trend. In the older age group (age ≥ 65 years), the effects of the other variables were not significant, except for the change in PM2.5 concentration, which had a significant effect on the risk of hospitalization for CHD. However, it is worth noting that the risk of hospitalization for CHD tended to increase at moderate temperatures (10°C-20°C) or with an increase in the concentration of PM10 (Figures 7, 8).
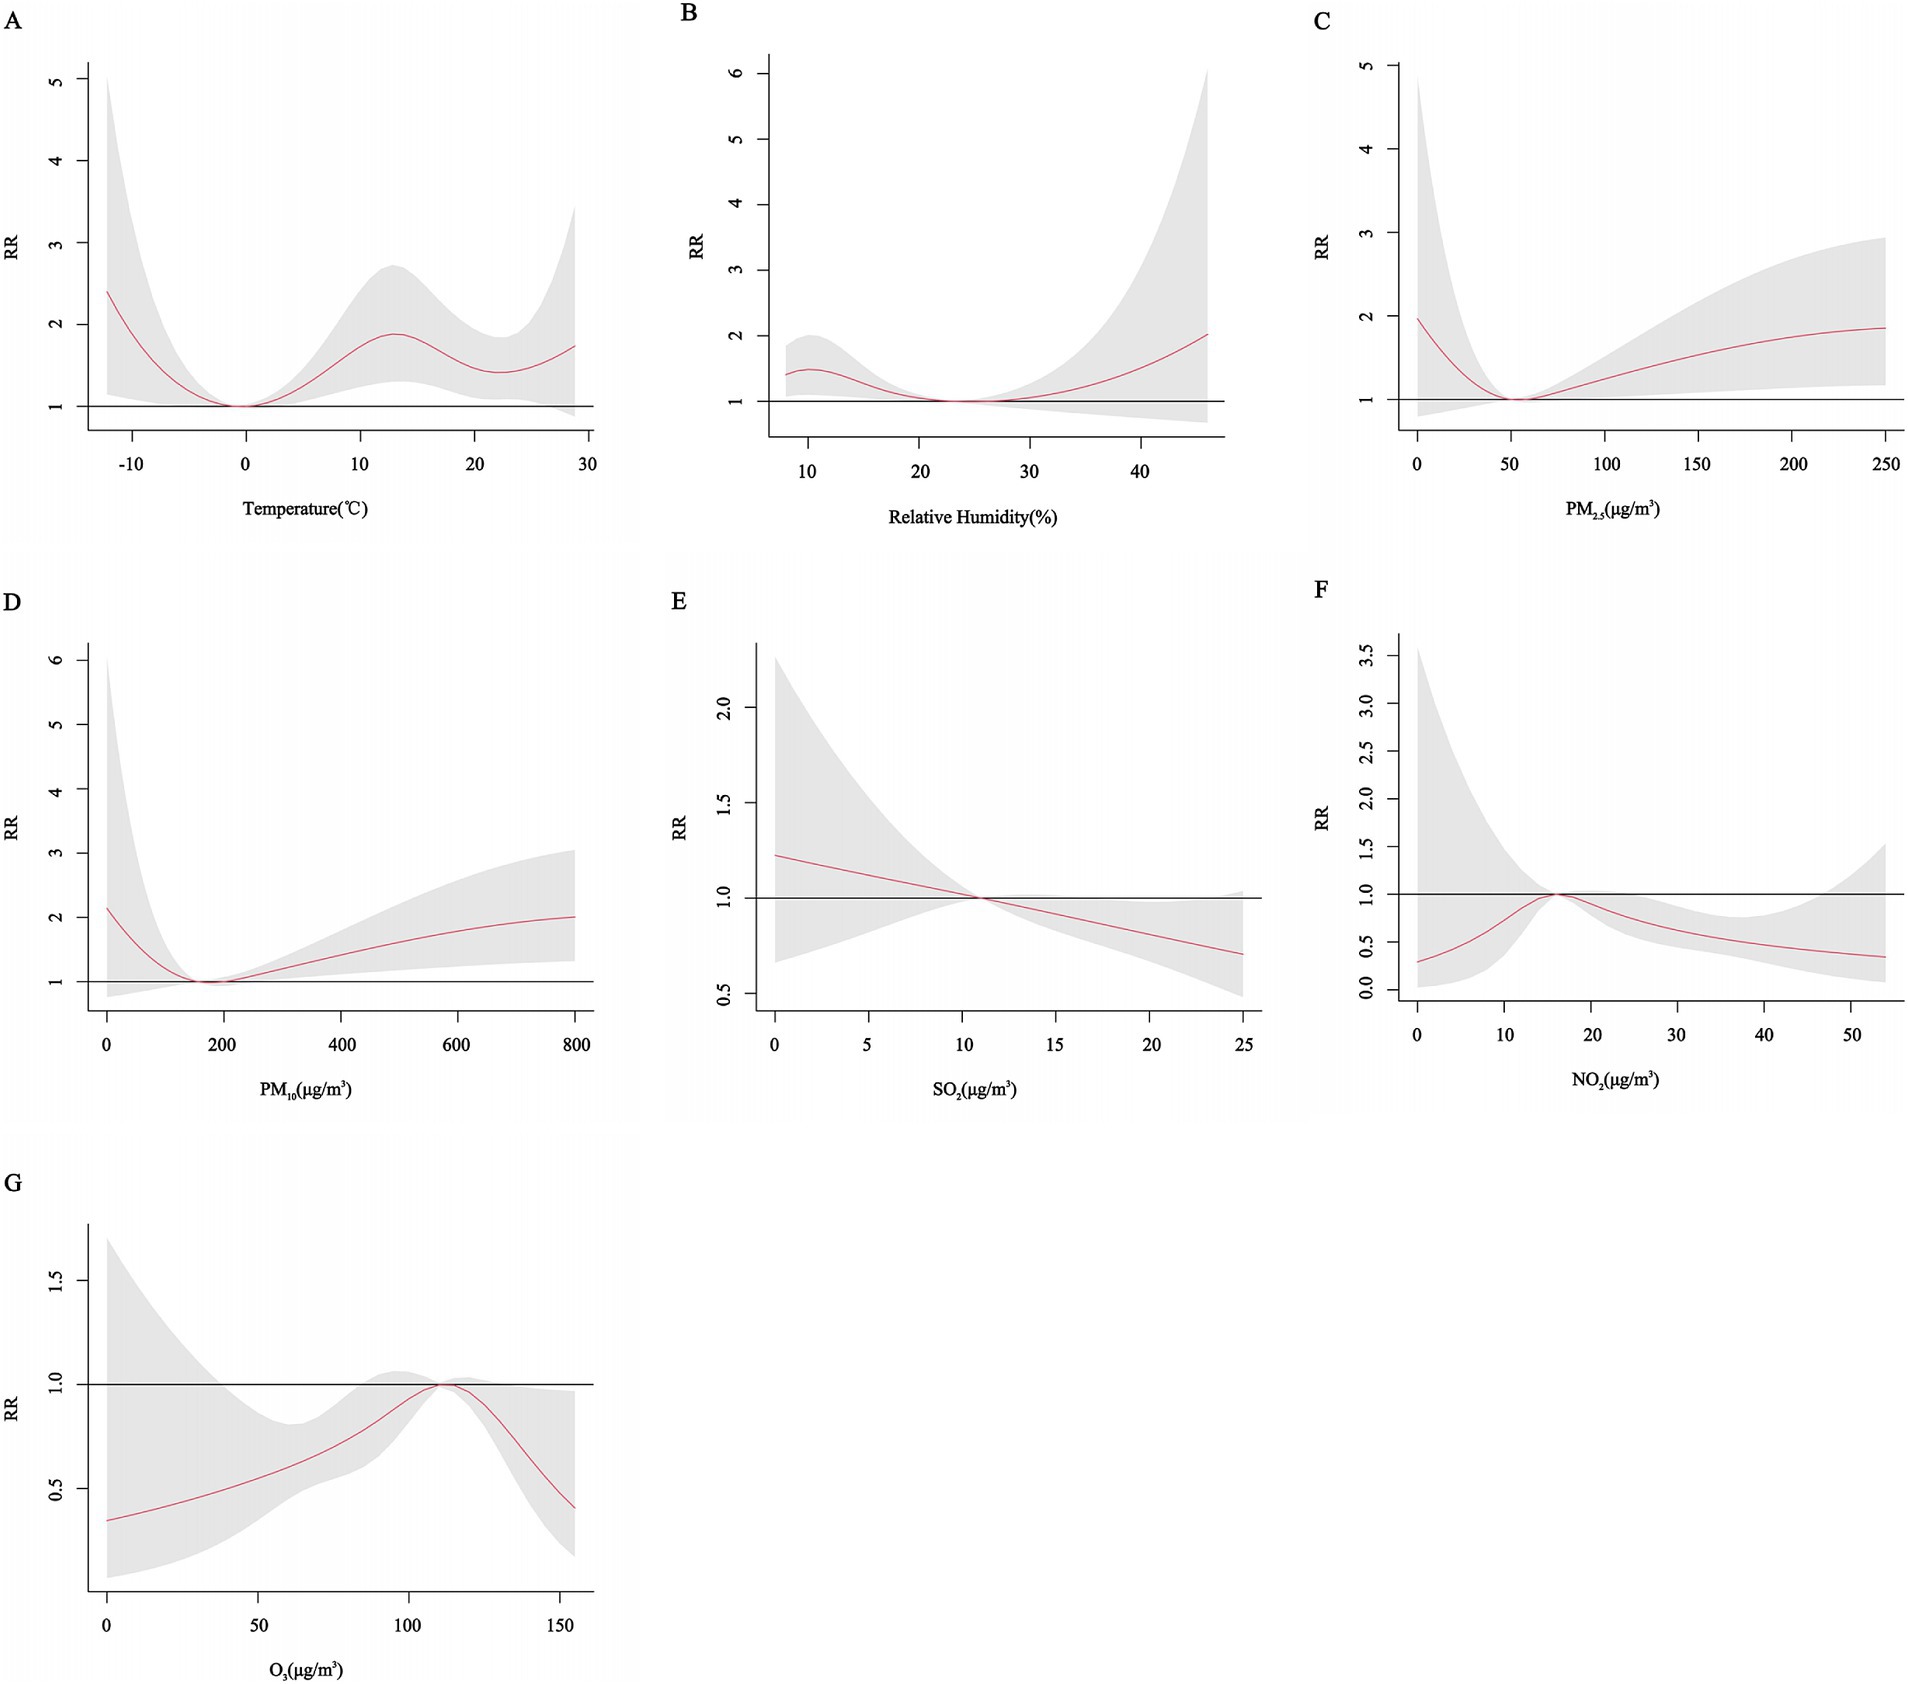
Figure 7. Cumulative exposure-effect curves of the effects of meteorological factors and air pollutants on CHD at age < 65 years with a 7-day lag. (A) Temperature, (B) Relative humidity, (C) PM2.5: Particulate matter with aerodynamic diameters ≤ 2.5 μm, (D) PM10: Particulate matter with aerodynamic diameters ≤ 10 μm, (E) SO2: Sulfur dioxide, (F) NO2: Nitrogen dioxide, (G) O3: Ozone.
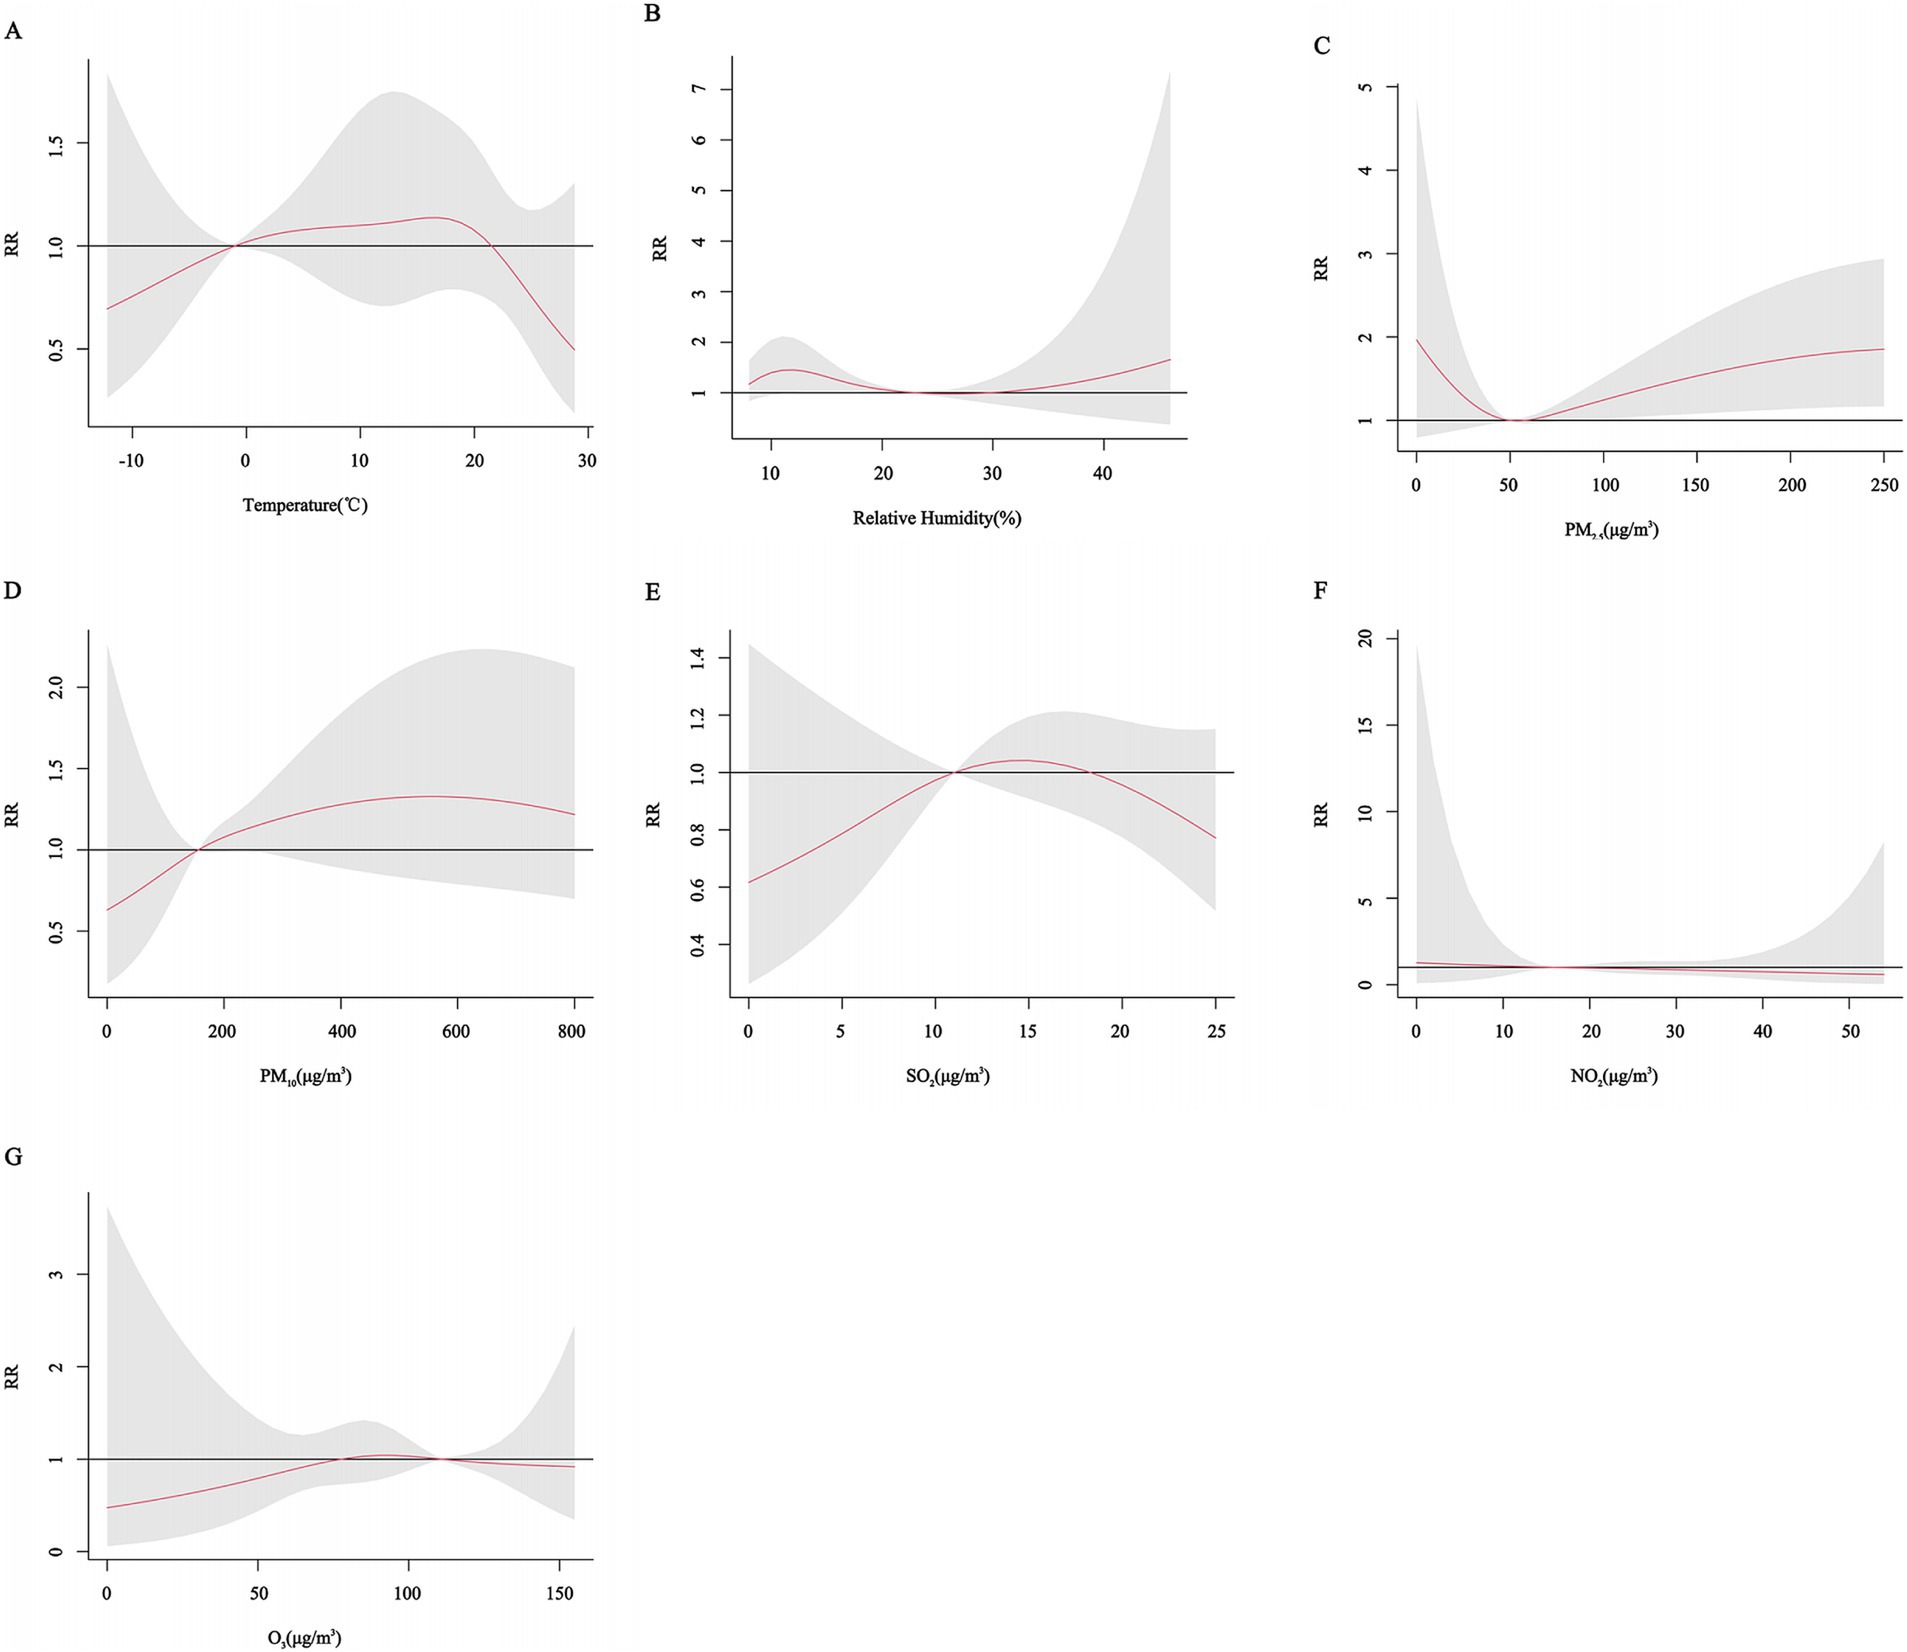
Figure 8. Cumulative exposure-effect curves of the effects of meteorological factors and air pollutants on CHD at age ≥ 65 years with a 7-day lag. (A) Temperature, (B) Relative humidity, (C) PM2.5: Particulate matter with aerodynamic diameters ≤ 2.5μm, (D) PM10: Particulate matter with aerodynamic diameters ≤ 10μm, (E) SO2: Sulfur dioxide, (F) NO2: Nitrogen dioxide, (G) O3: Ozone.
The results of the three-dimensional and contour plots of the gender and age subgroup analyses showed that there was a lagged effect of different meteorological factors and air pollutants on the risk of hospitalization for CHD in different gender and age groups (Supplementary Figures S1–S8).
3.4 Interaction analysis
Table 4 shows the interactions between meteorological factors and air pollutants, and between individual air pollutants on the risk of CHD hospitalization. There is a significant interaction between temperature and some pollutants, including PM2.5, PM10 and NO2. The corresponding IRRs and 95% CIs were estimated to be 0.53 (95% CI: 0.24, 0.83) and 0.36 (95% CI: 0.27, 0.47) and 0.24 (95% CI: 0.12, 0.35), respectively. The RERIs and 95% CIs were calculated to be −0.73 (95% CI: −2.63, −0.04) and −1.14 (95% CI: −1.93, −0.60) and −1.59 (95% CI: −3.80, −0.59), respectively, indicating an antagonistic effect between temperature and PM2.5, PM10 and NO2. However, we found that the risk of CHD hospitalization was increased only at low temperatures (<−1°C) with high PM10 concentrations (≥156 μg/m3) (RR = 1.53, 95% CI: 1.09, 2.13), and the antagonistic effect between temperature and PM2.5 was not significant. There was also an interaction of relative humidity with PM2.5, PM10 and NO2. The corresponding IRRs and 95% CIs were estimated to be 0.83 (95% CI: 0.80, 0.94) and 1.37 (95% CI: 1.27, 1.52) and 1.36 (95% CI: 1.30, 1.69), respectively. The RERIs and 95% CIs were calculated to be −0.24 (95% CI: −0.30, −0.05) and 0.28 (95% CI: 0.26, 0.37) and 0.29 (95% CI: 0.20, 0.46), respectively, which indicated that there was an antagonistic effect of relative humidity on PM2.5 and a synergistic effect on PM10 and NO2. Similarly, we found that the risk of hospitalization for CHD was increased only in environments with low relative humidity and high concentrations of PM2.5 (p < 0.05). Interaction analysis between air pollutants showed synergistic interactions between O3 and NO2 and SO2, and between SO2 and PM10. However, the risk of CHD hospitalization was decreased at low O3 and high SO2 concentrations, with a RR of 0.80 (95% CI: 0.66, 0.96). In addition, there was no interaction between NO2 and PM2.5 and PM10, while antagonistic interactions were observed for the remaining pollutants.
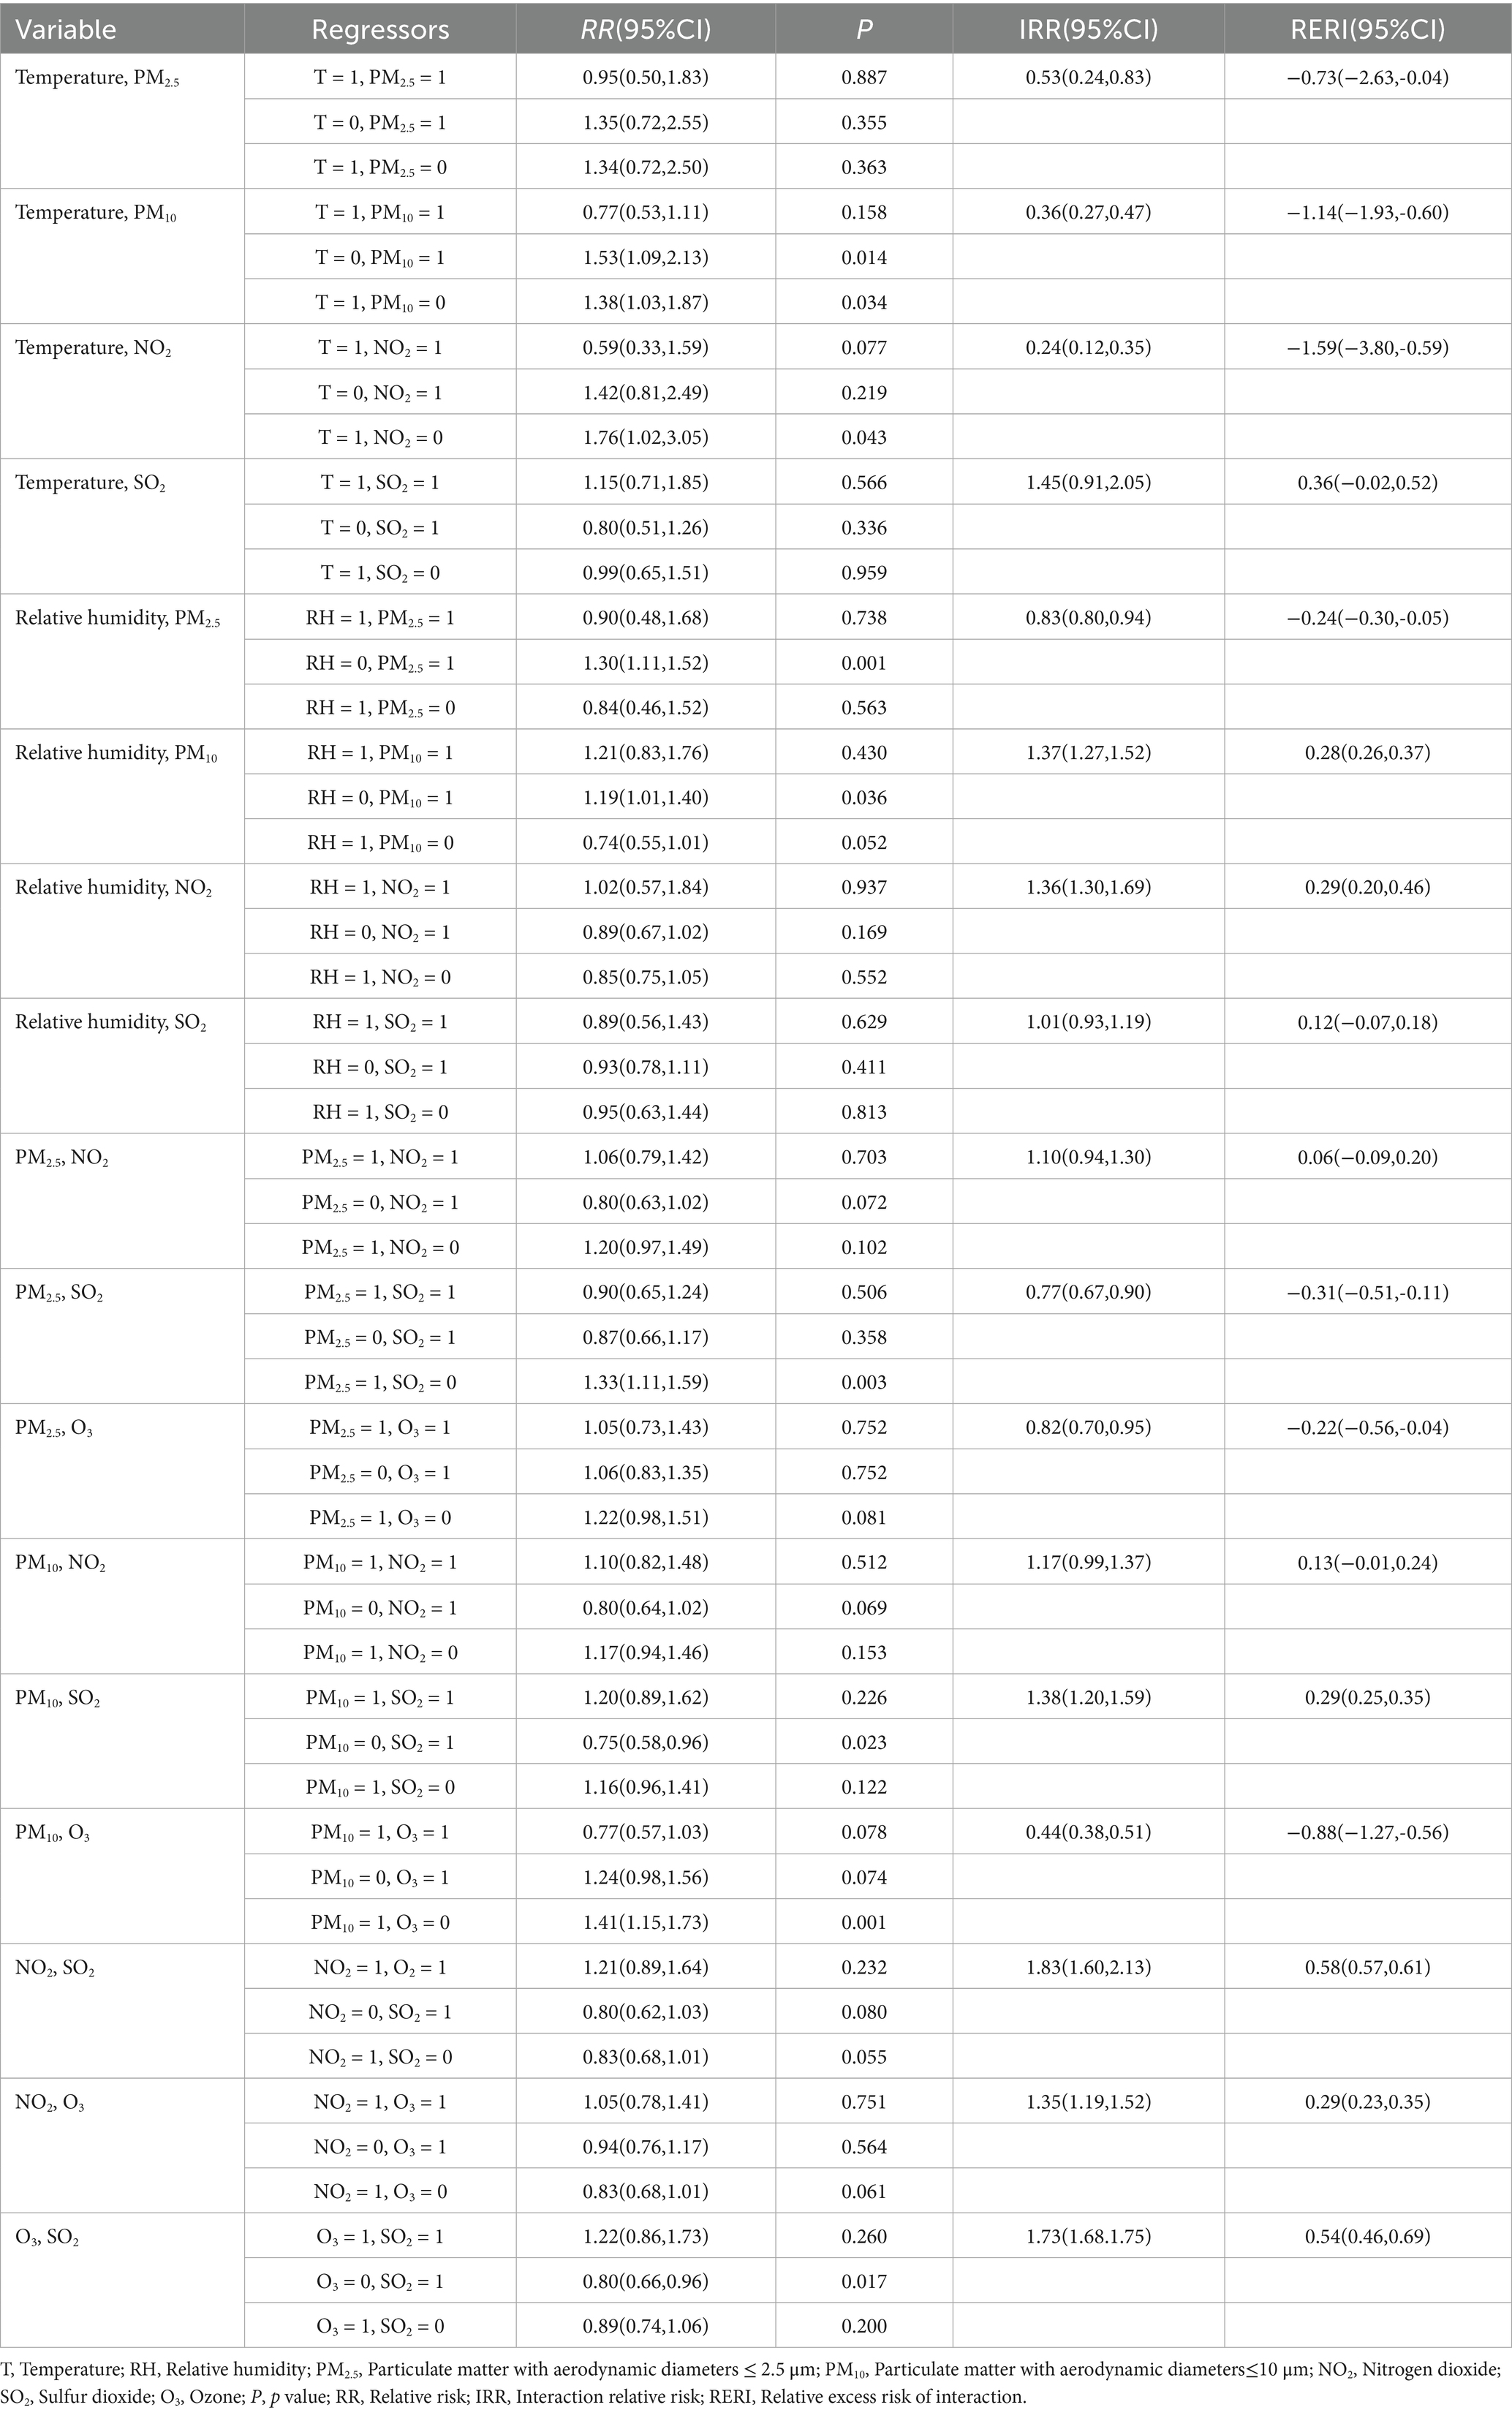
Table 4. Interaction analysis between meteorological factors and air pollutants on CHD hospitalization.
3.5 Sensitivity analysis
We estimated the BIC and AOE of the model when controlling for different degrees of freedom for the long-term trend. At a df of 6, the BIC and AOE values of the model were more desirable, and thus the model was chosen to control for the long-term trend at a degree of freedom of 6. In addition, the differences between the model before and after model adjustments were smaller when analyzing a single variable (either the meteorological factor or the air pollutant) while controlling for the remaining variables as confounders (Supplementary Figures S9, S10).
4 Discussion
This study investigated the individual and interactive effects of meteorological factors and air pollutants on CHD. The DLNM model was used to estimate the associations of meteorological factors and air pollutants with CHD hospitalization. The results showed that meteorological factors and air pollutants had nonlinear and lagged effects on the risk of CHD hospitalization, and the magnitude of this effect varied by gender and age. The interaction results indicated that the risk of CHD hospitalization was increased under conditions of low temperature with high concentrations of PM10.
Changes in temperature may be a risk factor for cardiovascular disease development and mortality. The cumulative exposure-effect curves of meteorological factors and CHD hospitalization in this study showed that both high and low temperature environments increased the risk of CHD hospitalization, especially in females and those younger than 65 years. This is consistent with the results of previous studies (18–23). Under high temperature conditions, the body regulates body temperature through sweating, and heat exposure of the skin leads to vasodilation, increased cardiac output, and increased cardiac load, which may affect CHD patients and thus lead to an increase in CHD hospitalization under high temperature (24). The low temperature environment will reduce the body heat dissipation through vasoconstriction, but the blood viscosity of the body will increase in the low temperature environment, and the imbalance between myocardial oxygen supply and oxygen demand will also lead to an increased risk of hospitalization for CHD (25, 26). In addition, it has been shown that inflammatory factors correlate with the development of CHD, and heat waves induce increased levels of inflammatory markers, accelerating atherosclerosis and thrombosis (27). Our study also found that the effect of temperature on the risk of CHD hospitalization was not significant in the exposure-response curves for males and the higher age group. This may be because the exact timing of the lagged effect may vary by subgroup, and the cumulative 7-day time window may not adequately capture the critical time point of the health effects of temperature change, resulting in a nonsignificant overall effect. The lagged effect found in the contour plots results further suggests that the effect of temperature change on the risk of CHD hospitalization may need to be captured by more refined analytical methods.
According to the Global Burden of Disease (GBD) estimates, environmental pollution was responsible for approximately 9 million deaths worldwide in 2019, with more than half of these deaths attributed to CVD (3). The present study found that PM2.5 and PM10 increase the risk of CHD even when cumulative exposures with a 7-day lag are considered. Numerous studies have shown that PM2.5 and PM10 can increase the risk of CHD by inducing adverse physiologic responses in the body and thus increasing the risk of CHD (26, 28–30).
However, conclusions regarding the effects of gaseous pollutants on CHD are currently inconsistent. For example, a Canadian study showed that NO2 exposure led to an increased number of emergency department visits for CHD with a ER of 5.9% (95% CI: 2.1 to 9.9%) (31). In contrast, Xie’s study found no significant association between NO₂ exposure and the number of coronary emergency department visits, but there was a positive correlation between SO2 exposure and the number of coronary emergency department visits, although this correlation was not statistically significant (32). Another study showed that high levels of SO2 increased the number of CHD visits with a ER of 5.02% (95% CI: 2.23–7.88%), whereas O3 exposure was negatively correlated with the number of visits (33). Lin’s study, on the other hand, found that O3 exposure increased the number of CHD visits (34).
The cumulative exposure curves in this study showed that NO2, SO2 and O3 had a protective effect on CHD. This may be due to the fact that the present study area is located in southwestern Xinjiang, China, where the levels of these pollutants are well below the national standard limits. In addition, the contour plots in this study showed that there was a lagged effect of NO2, SO2, and O3 on the risk of hospitalization for CHD, and this lagged effect was observed in different gender and age groups, while the cumulative exposure curves failed to capture the critical time points, which may have masked part of the effect. However, the specific mechanisms underlying the effects of various air pollutants on CHD are still not fully understood. Future studies need to further explore the potential pathways through which air pollutants affect CHD in order to provide a basis for effective public health policies.
Our study found an interaction between meteorological factors and air pollutants through interaction analysis. In low-temperature environments, high concentrations of PM2.5 and PM10 increased the risk of CHD hospitalization. This may be due to the fact that when the ambient temperature is low, especially when the height of the atmospheric boundary layer is low, air mobility is reduced and PM2.5 and PM10 are more likely to accumulate in the near-surface layer, resulting in elevated concentrations. This accumulation effect increases the exposure of the population to PM2.5 and exacerbates its health hazards (35). In low relative humidity environments, high concentrations of PM2.5 and PM10 also increase the risk of hospitalization for CHD. These results are consistent with previous studies. For example, Wu’s study noted that high concentrations of PM2.5 and PM10 increased the risk of CHD hospitalization by 23.9, 23.3%, respectively, under low temperature conditions (25). The effect of pollutants on CHD hospitalisation was more pronounced at high relative humidity than at low relative humidity (36). This interaction between meteorological factors and pollutants may be due to the fact that high humidity increases the solubility of pollutants and the hygroscopicity of particulate matter, thus exacerbating the toxicity of air pollutants (37). In turn, high concentrations of pollutants further exacerbate oxidative stress through direct stimulation of the respiratory tract and cardiovascular system and damage to endothelial cells, which leads to impaired vasodilatory function affecting autonomic regulation and aggravating the burden on the cardiovascular system (8, 37, 38). Our study also found an interaction between pollutants. Exposure to high concentrations of PM10 and SO2 also increased the risk of CHD hospitalisation. This is consistent with the results of most previous studies (39–41). Both airborne particulate matter and gaseous pollutants induce adverse physiologic responses in the body, and simultaneous exposure to both can exacerbate damage to the body, thus further exacerbating the risk of CHD. It was also found that there was also a synergistic interaction between gaseous pollutants and that concurrent exposure increased the risk of CHD hospitalisation. This is consistent with previous findings (41, 42). In addition to triggering metabolic disorders in the respiratory and cardiovascular systems of the body, combined pollutant exposure can also trigger metabolic disorders such as insulin resistance and dyslipidaemia, which can further exacerbate the risk of cardiovascular disease (43).
This study has some limitations. Firstly, the environmental variables in our study were obtained through monitoring stations and cannot accurately reflect individual exposure levels, resulting in potential bias in the results. Secondly, this study is not a community-based study, and we are studying a population in a rural area of southern Xinjiang. The geographic specificity of the study area and the unique living and dietary habits of this population mean that the results may be influenced by specific environmental or population characteristics, which limits the generalizability of the results and makes it possible that the results may not be directly generalizable to other different communities or populations. Third, this study is essentially an ecological study and cannot confirm the causal relationship between meteorological factors and air pollutants and CHD. Fourth, the small number of hospitalizations included in this study may have had an impact on the statistical reliability of the overall results, especially when the data were further subdivided into subgroups. Future studies with larger samples and in more areas are needed to verify the association between meteorological factors and air pollutants on CHD. Finally, it is worth noting that although the COVID-19 pandemic was covered during the period of this study, we believe that its impact on this study was minimal. Strict control measures, inherently low population density, and predominantly agro-pastoralist production practices in the study area limited its spread. These factors effectively minimized the potential interference of COVID-19-related confounding factors with the study results.
5 Conclusion
In this study, the cumulative lagged effects of individual meteorological factors or air pollutants on the risk of CHD hospitalization and the interactions between the variables were simultaneously analyzed using a time-series DLNM model. The results of the study indicate that changes in meteorological conditions and high concentrations of airborne particulate matter may increase the risk of hospitalization for CHD in the heavily particulate-polluted rural areas of southern Xinjiang. Low-temperature or low-humidity environments accompanied by high concentrations of particulate matter may be key to the increased risk of hospitalization for CHD. There are also different interactions between gaseous pollutants and particulate matter. It is worth noting that high concentrations of SO2 may increase the risk of hospitalization for CHD even when airborne particulate matter concentrations are low. The results of this study emphasize the importance of relevant departments implementing targeted prevention and control measures based on meteorological and air pollution conditions. By doing so, we can effectively reduce the hospitalization rate among CHD patients and alleviate the burden of this disease.
Data availability statement
The original contributions presented in the study are included in the article/Supplementary material, further inquiries can be directed to the corresponding authors.
Ethics statement
The studies involving humans were approved by the Ethics Review Committee of the First Affiliated Hospital of Shihezi University School of Medicine (shz2010LL01). The studies were conducted in accordance with the local legislation and institutional requirements. The participants provided their written informed consent to participate in this study.
Author contributions
XH: Data curation, Software, Investigation, Writing – original draft, Conceptualization, Methodology. RM: Investigation, Writing – review & editing, Methodology. JH: Methodology, Investigation, Writing – review & editing. BY: Formal analysis, Writing – review & editing, Investigation. SC: Formal analysis, Writing – review & editing, Methodology, Software, Investigation. XW: Investigation, Writing – review & editing, Methodology, Data curation. DM: Writing – review & editing, Investigation, Data curation. LM: Methodology, Formal analysis, Investigation, Data curation, Writing – review & editing. SS: Formal analysis, Writing – review & editing, Investigation, Software, Data curation, Methodology. XL: Software, Methodology, Investigation, Writing – review & editing. PZ: Funding acquisition, Writing – review & editing, Conceptualization. HG: Writing – review & editing, Formal analysis, Data curation, Conceptualization, Methodology, Investigation.
Funding
The author(s) declare that financial support was received for the research and/or publication of this article. This study was supported by the Guided Science and Technology Program Projects of the Xinjiang Production and Construction Corps (2024ZD026), the Key Science and Technology Tackling Programme of the Xinjiang Production and Construction Corps (2023AB048), and the Tianshan Young Talent Scientific and Technological Innovation Team: Innovative Team for Research on Prevention and Treatment of High-incidence Diseases in Central Asia (No.2023TSYCTD0020).
Acknowledgments
We sincerely thank the residents of Tangyi Town for being able to participate in our research. We are grateful to the Tangyi Town Hospital for supporting our work.
Conflict of interest
The authors declare that the research was conducted in the absence of any commercial or financial relationships that could be construed as a potential conflict of interest.
Generative AI statement
The authors declare that no Gen AI was used in the creation of this manuscript.
Publisher’s note
All claims expressed in this article are solely those of the authors and do not necessarily represent those of their affiliated organizations, or those of the publisher, the editors and the reviewers. Any product that may be evaluated in this article, or claim that may be made by its manufacturer, is not guaranteed or endorsed by the publisher.
Supplementary material
The Supplementary material for this article can be found online at: https://www.frontiersin.org/articles/10.3389/fpubh.2025.1615288/full#supplementary-material
Abbreviations
CHD, Coronary heart disease; GBD, Global burden of disease; RR, Relative risk; IRR, Interaction relative risk; RERI, Relative excess risk of interaction; DLNM, Distributed lag nonlinear model; ED, Days of exceedance; MEF, Maximum Exceedance Factor; RH, Relative humidity; PM2.5, Particulate matter with aerodynamic diameters ≤ 2.5 μm; PM10, Particulate matter with aerodynamic diameters ≤ 10 μm; SO2, Sulfur dioxide; NO2, Nitrogen dioxide; O3, Ozone; O3_8h, Daily Maximum 8-h Average Ozone; SD, Standard deviation.
References
1. Rao, SV, O'Donoghue, ML, Ruel, M, Rab, T, Tamis-Holland, JE, Alexander, JH, et al. ACC/AHA/ACEP/NAEMSP/SCAI guideline for the management of patients with acute coronary syndromes: a report of the American College of Cardiology/American Heart Association joint committee on clinical practice guidelines. Circulation. (2025) 151:e771–e862. doi: 10.1161/CIR.0000000000001309
2. British Heart Foundation. Global heart & circulatory diseases factsheet. London, United Kingdom: British Heart Foundation (2025).
3. Collaborators GRF. Global burden and strength of evidence for 88 risk factors in 204 countries and 811 subnational locations, 1990-2021: a systematic analysis for the global burden of disease study 2021. Lancet. (2024) 403:2162–203. doi: 10.1016/S0140-6736(24)00933-4
4. National Center for Cardiovascular Diseases the Writing Committee of the Report on Cardiovascular Health and Diseases in China. Report on cardiovascular health and diseases in China 2023: an updated summary. Chin Circ J. (2024) 39:625–60. doi: 10.3969/j.issn.1000-3614.2024.07.001
5. Zheng, C, Wu, J, Tang, H, Wang, X, Tian, Y, Cao, X, et al. Relationship of ambient humidity with cardiovascular diseases: a prospective study of 24,510 adults in a general population. Biomed Environ Sci. (2024) 37:1352. doi: 10.3967/bes2024.156
6. Miao, H, Bao, W, Lou, P, Chen, P, Zhang, P, Chang, G, et al. Relationship between temperature and acute myocardial infarction: a time series study in Xuzhou, China, from 2018 to 2020. BMC Public Health. (2024) 24:2645. doi: 10.1186/s12889-024-20066-y
7. Wang, WML, Su, D, Ma, Q, and Yang, H. Impact of atmospheric particulate matters on the number of hospitalizations for cardiovascular and cerebrovascular diseases in Urumqi, 2019-2021. Pract Preventive Med. (2023) 30:1338–42. doi: 10.3969/j.issn.1006-3110.2023.11.014
8. Li, Z, Wang, R, Dai, Z, Wu, C, Peng, S, Wu, S, et al. Associations between short-term exposure to air pollution, extreme temperature events and coronary heart disease mortality: a seven-year time-series study in Wuhan, China. Atmos Environ. (2024) 333:120611. doi: 10.1016/j.atmosenv.2024.120611
9. Gasparrini, A. Distributed lag linear and non-linear models in R: the package dlnm. J Stat Softw. (2011) 43:1–20. doi: 10.18637/jss.v043.i08
10. Wei, J, and Li, Z. ChinaHighPM2.5: high-resolution and high-quality ground-level PM2.5 dataset for China (2000-2023). National Tibetan Plateau Data Center; (2024).
11. Wei, J, and Li, Z. ChinaHighPM10: high-resolution and high-quality ground-level PM10 dataset for China (2000-2023). National Tibetan Plateau Data Center; (2024).
12. Wei, J, and Li, Z. ChinaHighSO2: high-resolution and high-quality ground-level SO2 dataset for China (2013-2023). National Tibetan Plateau Data Center; (2024.)
13. Wei, J, and Li, Z. ChinaHighO3: high-resolution and high-quality ground-level MDA8 O3 dataset for China (2000-2023). National Tibetan Plateau Data Center; (2024).
14. Wei, J, and Li, Z. ChinaHighNO2: high-resolution and high-quality ground-level NO2 dataset for China (2008-2023). National Tibetan Plateau Data Center; (2024).
15. Yang, K, Jiang, Y, Tang, W, He, J, Shao, C, Zhou, X, et al. A high-resolution near-surface meteorological forcing dataset for the third pole region (TPMFD, 1979-2022). In. National Tibetan Plateau Data C, editor.: National Tibetan Plateau Data Center.(2025) doi: 10.11888/Atmos.tpdc.300398
16. Huang, J, Ma, Y, Lv, Q, Liu, Y, Zhang, T, Yin, F, et al. Interactive effects of meteorological factors and air pollutants on hand, foot, and mouth disease in Chengdu, China: a time-series study. BMJ Open. (2022) 12:e067127. doi: 10.1136/bmjopen-2022-067127
17. Shi, C, Zhu, J, Liu, G, Du, Z, and Hao, Y. Time series analysis of the interaction between ambient temperature and air pollution on hospitalizations for AECOPD in Ganzhou, China. Sci Rep. (2024) 14:17106. doi: 10.1038/s41598-024-67617-2
18. Lu, P, Xia, G, Zhao, Q, Xu, R, Li, S, and Guo, Y. Temporal trends of the association between ambient temperature and hospitalisations for cardiovascular diseases in Queensland, Australia from 1995 to 2016: a time-stratified case-crossover study. PLoS Med. (2020) 17:e1003176. doi: 10.1371/journal.pmed.1003176
19. Bayentin, L, El Adlouni, S, Ouarda, TB, Gosselin, P, Doyon, B, and Chebana, F. Spatial variability of climate effects on ischemic heart disease hospitalization rates for the period 1989-2006 in Quebec, Canada. Int J Health Geogr. (2010) 9:5. doi: 10.1186/1476-072X-9-5
20. Fuhrmann, CM, Sugg, MM, Konrad, CE 2nd, and Waller, A. Impact of extreme heat events on emergency department visits in North Carolina (2007-2011). J Community Health. (2016) 41:146–56. doi: 10.1007/s10900-015-0080-7
21. Liu, J, Varghese, BM, Hansen, A, Zhang, Y, Driscoll, T, Morgan, G, et al. Heat exposure and cardiovascular health outcomes: a systematic review and meta-analysis. Lancet Planet Health. (2022) 6:e484–95. doi: 10.1016/S2542-5196(22)00117-6
22. He, X, Zhai, S, Liu, X, Liang, L, Song, G, Song, H, et al. Interactive short-term effects of meteorological factors and air pollution on hospital admissions for cardiovascular diseases. Environ Sci Pollut Res Int. (2022) 29:68103–17. doi: 10.1007/s11356-022-20592-5
23. Huang, J, He, Q, Jiang, Y, Wong, JMJ, Li, J, Liu, J, et al. Low ambient temperature and incident myocardial infarction with or without obstructive coronary arteries: a Chinese nationwide study. Eur Heart J. (2024) 46:439–50. doi: 10.1093/eurheartj/ehae711
24. Han, WSA, Li, H, and Wang, X. Meteorological factors and coronary heart disease. Chin J Evidence-Based Cardiovasc Med. (2020) 12:118–9. doi: 10.3969/j.issn.1674-4055.2020.01.30
25. Wu, D, Wang, C, Lu, Y, Li, C, Shi, Y, Yilihamu, Y, et al. Effects of meteorological factors and air pollutants on hospitalization volume of ischemic heart disease in Urumqi City. J Environ Occup Med. (2024) 41:1115–23. doi: 10.11836/JEOM24137
26. Kawada, T. RE: ambient temperature and risk of cardiovascular and respiratory adverse health outcomes. Eur J Prev Cardiol. (2024) 32:351. doi: 10.1093/eurjpc/zwae257
27. Liu, HZS, Zhou, Y, and Kuang, Z. Effects of simulated heat wave and strong cooling on risk factors for coronary heart disease of Apo E knockout mice. Adv Meteorol Sci Technol. (2016) 11:37–45. doi: 10.3969/j.issn.2095-1973.2016.01.006
28. Zhu, WHY, Cai, J, Zhang, H, Gu, F, and Wu, J. Review on mechanisms of PM2.5 in cardiovascular system injuries. J Environ Occup Med. (2020) 37:929–35. doi: 10.13213/j.cnki.jeom.2020.20235
29. Sun, C, Jiang, R, Zhang, XY, Zha, L, Liu, DY, and Jin, EZ. Role of low-density lipoprotein in mediating the effect of air pollution on coronary heart disease: a two-step multivariate Mendelian randomization study. Eur Rev Med Pharmacol Sci. (2024) 28:525–33. doi: 10.26355/eurrev_202401_35050
30. Feng, S, Huang, F, Zhang, Y, Feng, Y, Zhang, Y, Cao, Y, et al. The pathophysiological and molecular mechanisms of atmospheric PM(2.5) affecting cardiovascular health: a review. Ecotoxicol Environ Saf. (2023) 249:114444. doi: 10.1016/j.ecoenv.2022.114444
31. Szyszkowicz, M. Air pollution and emergency department visits for ischemic heart disease in Montreal, Canada. Int J Occup Med Environ Health. (2007) 20:167–73. doi: 10.2478/v10001-007-0015-3
32. Xie, J, He, M, and Zhu, W. Acute effects of outdoor air pollution on emergency department visits due to five clinical subtypes of coronary heart diseases in shanghai, China. J Epidemiol. (2014) 24:452–9. doi: 10.2188/jea.JE20140044
33. Zhou, Y, Jin, Y, and Zhang, Z. Short-term exposure to various ambient air pollutants and emergency department visits for cause-stable ischemic heart disease: a time-series study in Shanghai, China. Sci Rep. (2023) 13:16989. doi: 10.1038/s41598-023-44321-1
34. Lin, CA, Amador Pereira, LA, de Souza Conceição, GM, Kishi, HS, Milani, R Jr, Ferreira Braga, AL, et al. Association between air pollution and ischemic cardiovascular emergency room visits. Environ Res. (2003) 92:57–63. doi: 10.1016/s0013-9351(02)00054-3
35. Cao, Y, Gong, M, Shen, F, Ma, J, Yang, G, and Lin, X. Estimation of PM2.5 concentration and analysis of influencing factors in China. J Atmos Environ Optics. (2023) 18:245–57. doi: 10.3969/j.issn.1673-6141.2023.03.006
36. Li, YWJ, Han, J, Zhao, Y, Hang, J, Tan, J, Zhang, Q, et al. Research progress in relationship between atmospheric environment and acute myocardial infarction. Med Recapitulate. (2023) 13:18169–74. doi: 10.3969/j.issn.1006-2084.2018.02.024
37. Kim, SY, Kim, SH, Wee, JH, Min, C, Han, SM, Kim, S, et al. Short and long term exposure to air pollution increases the risk of ischemic heart disease. Sci Rep. (2021) 11:5108. doi: 10.1038/s41598-021-84587-x
38. Li, Z, Wan, J, Peng, S, Wang, R, Dai, Z, Liu, C, et al. Associations between cold spells of different time types and coronary heart disease severity. Environ Pollut. (2024) 343:123100. doi: 10.1016/j.envpol.2023.123100
39. Jiang, W, Chen, H, Liao, J, Yang, X, Yang, B, Zhang, Y, et al. The short-term effects and burden of particle air pollution on hospitalization for coronary heart disease: a time-stratified case-crossover study in Sichuan, China. Environ Health. (2022) 21:19. doi: 10.1186/s12940-022-00832-4
40. Huang, W, Zhou, Y, Chen, X, Zeng, X, Knibbs, LD, Zhang, Y, et al. Individual and joint associations of long-term exposure to air pollutants and cardiopulmonary mortality: a 22-year cohort study in northern China. Lancet Reg Health West Pac. (2023) 36:100776. doi: 10.1016/j.lanwpc.2023.100776
41. Scimeca, M, Palumbo, V, Giacobbi, E, Servadei, F, Casciardi, S, Cornella, E, et al. Impact of the environmental pollution on cardiovascular diseases: from epidemiological to molecular evidence. Heliyon. (2024) 10:e38047. doi: 10.1016/j.heliyon.2024.e38047
42. Yang, YS, Pei, YH, Gu, YY, Zhu, JF, Yu, P, and Chen, XH. Association between short-term exposure to ambient air pollution and heart failure: an updated systematic review and meta-analysis of more than 7 million participants. Front Public Health. (2022) 10:948765. doi: 10.3389/fpubh.2022.948765
43. Kumar, V, H, S, Huligowda, LKD, Umesh, M, Chakraborty, P, Thazeem, B, et al. Environmental pollutants as emerging concerns for cardiac diseases: a review on their impacts on cardiac health. Biomedicines. (2025) 13:241. doi: 10.3390/biomedicines13010241
Keywords: coronary heart disease, meteorological factors, air pollutants, hospitalizations, interaction
Citation: Han X, Ma R, He J, Yang B, Chen S, Wu X, Muhetaer D, Ma L, Shen S, Li X, Zuo P and Guo H (2025) Association between meteorological factors, air pollutants and daily hospitalizations of coronary heart disease in rural areas of southern Xinjiang, China. Front. Public Health. 13:1615288. doi: 10.3389/fpubh.2025.1615288
Edited by:
Arthit Phosri, Mahidol University, ThailandReviewed by:
Worradorn Phairuang, Chiang Mai University, ThailandSitthichok Puangthongthub, Chulalongkorn University, Thailand
Copyright © 2025 Han, Ma, He, Yang, Chen, Wu, Muhetaer, Ma, Shen, Li, Zuo and Guo. This is an open-access article distributed under the terms of the Creative Commons Attribution License (CC BY). The use, distribution or reproduction in other forums is permitted, provided the original author(s) and the copyright owner(s) are credited and that the original publication in this journal is cited, in accordance with accepted academic practice. No use, distribution or reproduction is permitted which does not comply with these terms.
*Correspondence: Pengxiang Zuo, enVvX3Blbmd4aWFuZ0BzaW5hLmNvbQ==; Heng Guo, Z3VvaGVuZ0BzaHp1LmVkdS5jbg==