 Xuedong Liu
 Jian Cao1
- 1Department of Medical Administration, The First People’s Hospital of Neijiang, Neijiang, China
- 2School of Public Health, Chongqing Medical University, Chongqing, China
Objective: This study aims to evaluate hospital medical service performance in Sichuan Province, China.
Methods: A total of 306 secondary and tertiary general hospitals were included in the analysis. A comprehensive evaluation model was developed using exploratory factor analysis (EFA) based on diagnosis-related groups (DGRS) indicators to assess medical service performance. Indicators were determined within the Donabedian structure-process-outcome (SPO) framework. Hierarchical clustering analysis (HCA) was applied to categorize hospitals into performance clusters, and the Kruskal-Wallis H test was used to compare disparities in performance characteristics across clusters.
Results: The comprehensive evaluation revealed that all top 10 hospitals were tertiary general hospitals (TGHs), with 40.00% located in the Chengdu region. Conversely, the bottom 10 hospitals were exclusively secondary general hospitals (SGHs), predominantly concentrated in northeastern Sichuan. TGHs were classified into three clusters: “Excellent” (30.83%), “Middle” (57.14%), and “Inferior” (12.03%), while SGHs were categorized as “Excellent” (26.01%), “Middle” (69.94%), and “Inferior” (4.05%). For TGHs, the “Excellent” cluster displayed significantly higher performance in case-mix index (CMI), number of DRGS (ND), total weight (TW), and time efficiency index (TEI) compared to the “Middle” and “Inferior” clusters, but performed worst in cost efficiency index (CEI) and mortality of middle and low-risk group cases (MMLRG). For SGHs, “Excellent” cluster hospitals significantly outperformed others in ND and TW, while the “Inferior” cluster performed best in CMI but alarmingly worst in MMLRG.
Conclusion: Significant regional and hierarchical disparities in medical service performance were observed across Sichuan Province, with Chengdu region demonstrating optimal performance. For TGHs, hospitals in the “Inferior” cluster are recommended to enhance their medical ability and efficiency compared to those in the “Excellent” cluster. Conversely, hospitals in the “Excellent” cluster should focus on controlling medical costs compared to those in the “Inferior” cluster. For SGHs, hospitals in the “Inferior” cluster should concentrate on improving medical security and ensuring patient safety compared to those in the “Middle” and “Excellent” clusters.
1 Introduction
The evaluation of medical service performance has emerged as a critical research focus, garnering substantial attention worldwide. Over the past few decades, extensive literature has explored various instruments for measuring hospital service quality (1). In 1966, American scholar Avedis Donabedian proposed the classic three-dimensional quality framework, comprising the dimensions of structure, process, and outcome (SPO) to assess healthcare quality (2, 3). In this framework, “structure” denotes the physical settings, provider qualifications, and administrative systems; “process” refers to the delivery components of care; and “outcome” encompasses recovery, functional restoration, and survival (3). Through continuous international scholarly exploration, the Donabedian model has deepened its theoretical connotations and become a globally recognized framework for healthcare quality assessment (2).
In China, scholars have applied the Donabedian framework to construct evaluation systems. For example, Wang et al. developed an index system for evaluating the core competencies of hospital specialist service operation assistants using SPO-based indicators (4). Cai et al. established a single-disease quality management system guided by the SPO model (5). Wang et al. clarified the model’s connotations in Chinese healthcare, defining “structure” as the static configuration and efficiency of institutional resources, “process” as the dynamic quality and efficiency of service operations, and “outcome” as the integrated measurement of structural and process quality (6). This framework has categorized medical ability and security indicators under “outcome” and efficiency indicators under “process” dimensions, forming a theoretical foundation for similar quality assessment studies.
China has implemented SPO-based hospital performance evaluation for years. A significant milestone was the 2019 State Council document entitled “Strengthening Performance Evaluation of Tertiary Public Hospitals” (7). This initiative focused on SPO dimensions relating to hospital management, such as sustainable development, operational efficiency, medical quality, and patient satisfaction (7). Indicators like inpatient workload per physician, physician-to-nurse ratio, and outpatient satisfaction were used to construct a comprehensive evaluation matrix (7). A notable feature of this approach is the use of isolated indicators with assigned weights to form the assessment system.
However, previous studies have identified limitations in using isolated indicators such as average cost, length of stay (LOS), mortality, work efficiency, and workload for performance evaluation (8–10). These indicators are inadequate and inappropriate due to healthcare’s complexity (9), diverse needs, and information asymmetry (11, 12). Such isolated indicators fail to capture the full spectrum of service quality (1, 13), raising concerns about comparability and comprehensiveness (10). One widely recognized approach is integrating risk adjustment into evaluation processes (8, 14). Diagnosis-related groups (DRGS), a patient classification system developed at Yale University in the 1970s, standardizes healthcare payment and performance assessment by grouping patients with similar clinical causes and treatments (10, 15, 16). A significant application is for performance evaluation. For instance, Vitikainen et al. used two different output grouping systems (Classic and FullDRG) to estimate hospital efficiency (17). Luo et al. utilized DRGS indicators, including case-mix index (CMI), number of DRGs (ND), total weight (TW), cost efficiency index (CEI), time efficiency index (TEI), and mortality of middle and low-risk group cases (MMLRG) to objectively evaluate inpatient performance among tertiary hospitals in Sichuan’s Panxi region (18).
Since its inception, numerous DRGS-based evaluation models have been developed. Jian et al. used CEI, TEI, CMI, and inpatient mortality of low-risk group cases (IMLRG) to evaluate inpatient service performance in Beijing (19). Liu et al. adopted CMI, ND, TW, CEI, TEI, and IMLRG to evaluate medical service performance for breast cancer patients in Henan Province (20). Lu et al. evaluated an organ transplant department using similar metrics (21). These models primarily compare inter-hospital performance via DRGS indicators themselves. Contrasts to previous studies, Liu et al. developed two models by combining principal component analysis (PCA), entropy, TOPSIS, and rank sum ratio (RSR) methods based on CMI, ND, TW, CEI, TEI, MMLRG, and hospital case fatality rate (SCFR) to evaluate TGHs performance (10).
Despite great advancements in hospital performance evaluation, literature review has revealed that no studies have integrated exploratory factor analysis (EFA) and hierarchical clustering analysis (HCA) methods based on DRGS indicators within the Donabedian theoretical framework to evaluate hospital medical service performance. Given this gap, our study introduces a novel model combining the two methods based on DRGS indicators within the Donabedian theoretical framework to assess 306 hospitals in Sichuan, China. The findings of this study may inform healthcare management and future research.
2 Methods
2.1 Hospital determination
This study focused on secondary general hospitals (SGHs) and tertiary general hospitals (TGHs) in Sichuan, China. Hospitals specializing in traditional Chinese medicine, traditional Chinese medicine and Western medicine hospitals, and specialized hospitals were excluded. To holistically assess the disparities in medical service performance across hospital levels, all SGHs and TGHs registered in the Sichuan Health Data Analysis and Decision Support Cloud Platform (SHDADSCP) (22) were selected as the study hospitals. This resulted in a total sample size of 306 hospitals, including 173 SGHs and 133 TGHs. These hospitals are distributed across all 21 municipalities in Sichuan. Detailed geographic and hospital-level distributions of the study hospitals are displayed in Figure 1.
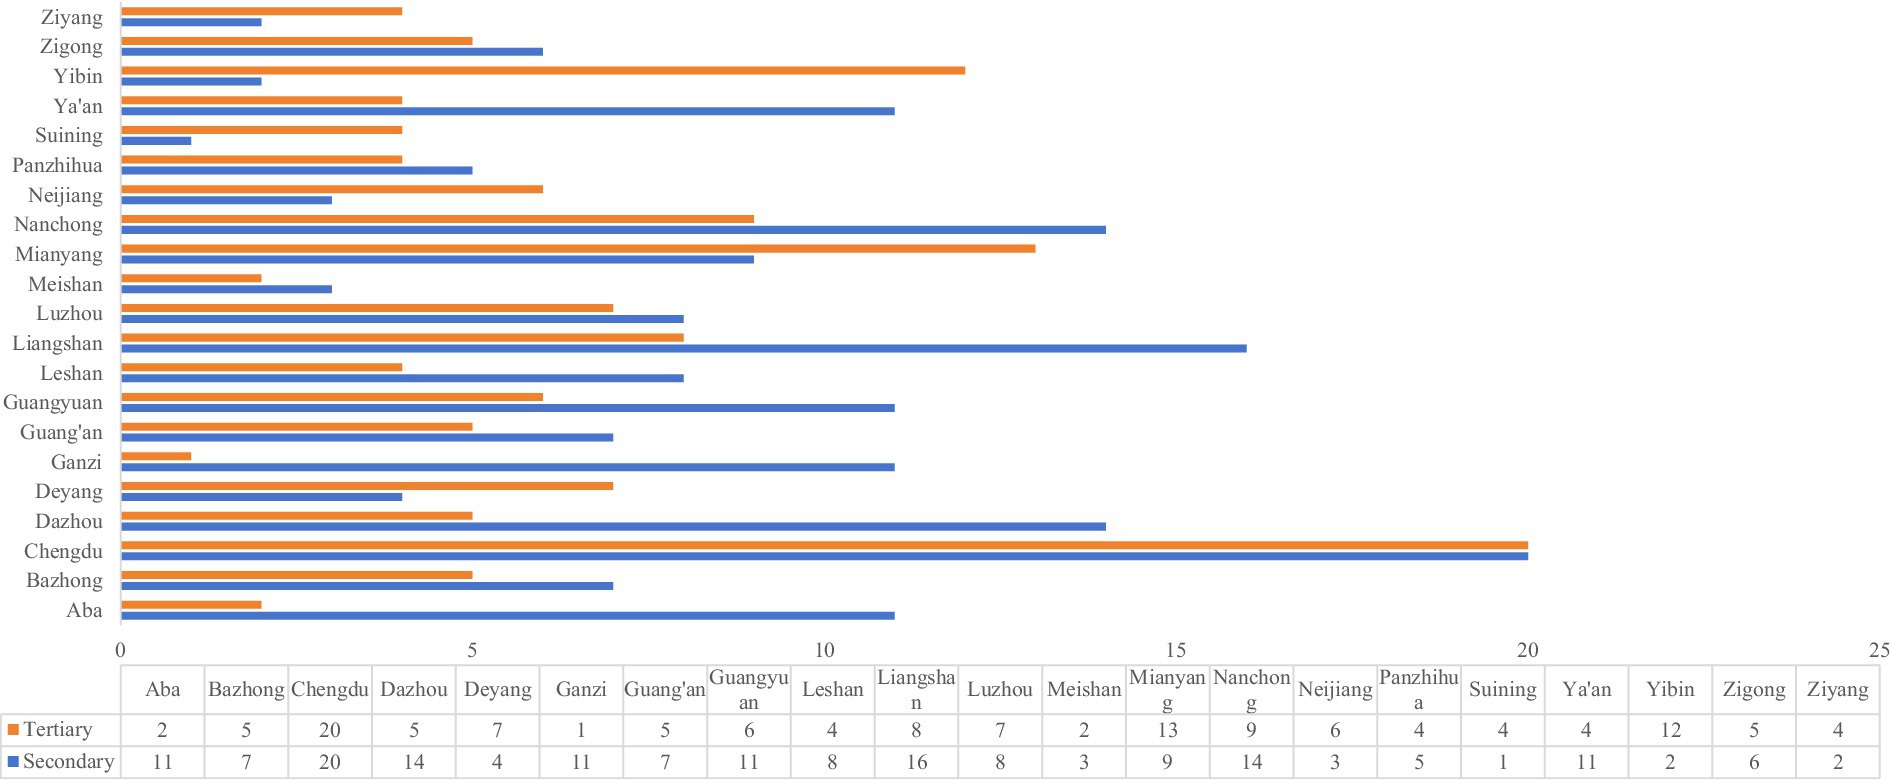
Figure 1. Geographic and hospital-level distributions of the 306 study hospitals.
2.2 Indicator selection
In 2014, the former Health and Family Planning Commission of Sichuan Province introduced the “Front Page of Medical Records (FPMR) (2014 edition)” (23), a standardized format for collecting inpatient medical data across the region. This data included demographic characteristics, diagnosis and treatment information, and medical expenses (24). In 2024, the SHDADSCP analyzed the FPMR data from 306 hospitals and developed a comprehensive evaluation matrix. This matrix consisted of three primary indicators and seven secondary indicators (22). In reference to relevant studies (23, 25, 26), this study selected six indicators for evaluation: CMI, ND, TW, CEI, TEI, and MMLRG. Among these, CMI, ND, and TW were considered positive indicators, while CEI, TEI, and MMLRG were negative indicators (27–29). Detailed explanations of these evaluation indicators are illustrated in Table 1.
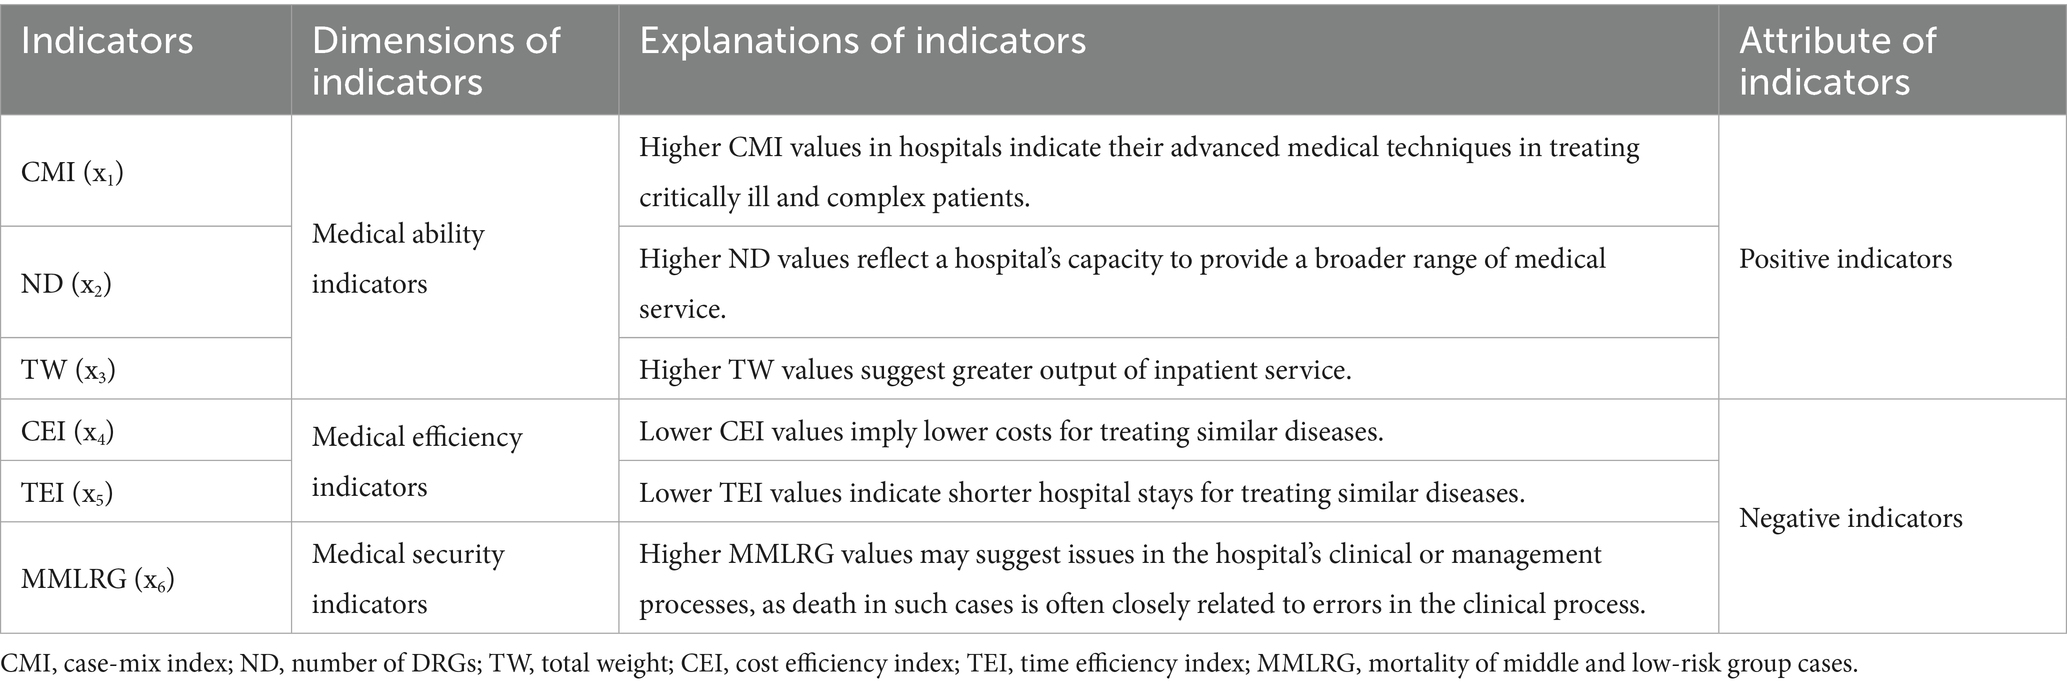
Table 1. Explanations of medical service performance evaluation indicators.
2.3 Medical service performance evaluation procedures
2.3.1 Data extraction and preparation
The data for this study were extracted from the SHDADSCP in the “Comprehensive Evaluation” section. All data were collected and organized in Excel format. The data preparation followed the following procedures:
1 Data extraction: The original data matrix was labeled as Xij, where i = 1, 2, …, m and j = 1, 2, …, n. Here, m represents the number of evaluation indicators, and n represents the number of study hospitals.
2 Data trends homogenization: The absolute negative indicators of CEI and TEI were homogenized using Equation 1. The relative negative indicator of MMLRG was homogenized using Equation 2 (30).
3 Data standardization: To eliminate the influence of varying dimensions, all data were standardized using Equation 3. This step ensured that each indicator contributed equally to the analysis, regardless of its original scale or unit of measurement.
2.3.2 EFA procedures
EFA, initially developed by Charles Spearman in 1904, is a multivariate statistical method. It classifies multiple variables into a few common factors based on the correlations among the variables. The fundamental concept involves decomposing original variables into two components: one is a linear combination of common factors (CFs) that condense most of the information in the original variables, and the other is a special factor that exhibits no correlation with the CFs. The main purpose is to explore the underlying structure beneath extensive observed data and identify latent factors influencing these data (31).
Following data standardization, we conducted EFA using SPSS 27.0 software. The main procedures were as follows:
1 Test data appropriateness. Before performing EFA, it is necessary to evaluate data appropriateness. Two commonly used metrics are the Kaiser-Meyer-Olkin (KMO) test and Bartlett’s test of sphericity. Data are deemed appropriate for EFA when the KMO value exceeds 0.6 or 0.7 and Bartlett’s test yields a significance level below 0.05.
2 Calculate communality values. Communality, denoted as , was calculated using Equation 4:
where i = 1,2,…,n.
3 Extract CFs. The principal component analysis (PCA) method was used to determine the number of CFs. Factors with accumulative variance contribution (AVC) ≥ 85% (32) were extracted. The AVC was calculated using Equation 5:
where represents the eigenvalues of each indicator.
4 Compute factor loading matrix. The factor loading matrix A was derived from the eigenvalues and their corresponding eigenvectors. The matrix was defined as Equation 6:
where represents the eigenvalue, represents the eigenvector, i = 1, 2, …, m; j = 1, 2, …, n; m represents the number of evaluation indicators, and n represents the number of study hospitals.
5 Rotate CFs. To enhance the interpretability of each CF, rotation was performed using the varimax method. The rotated factor loading matrix visually reflects the contribution of each variable to the principal components. A larger absolute value of a variable’s loading coefficient on a specific CF implies a stronger correlation between the variable and that factor.
6 Determine factor score functions. The factor score function was defined as Equation 7:
where represents the coefficients of CF scores, represents the standardized data matrix, and k represents the number of CFs.
7 Calculate the evaluation scores for each study hospital. The comprehensive evaluation scores (CES) of each study hospital were calculated using Equation 8 and ranked accordingly:
where RVC represents the rotated variance contribution.
2.4 HCA procedures
HCA is a descriptive statistical method that groups original data into clusters by measuring distances between data points. The goal is to minimize intra-cluster heterogeneity and maximize inter-cluster heterogeneity. To account for inherent differences between hospital levels, SGHs and TGHs were clustered separately following these procedures:
1. Variable standardization. Prior to HCA, variables including CF1, CF2, CF3, and CES were standardized using the Z-score method.
2. Distance metric and clustering algorithm. The Squared Euclidean Distance was used to measure data point dissimilarity, and the Between-groups Linkage method served as the clustering algorithm.
3. Optimal cluster determination. The Silhouette Coefficient (SC) (33, 34) was initially used to identify the optimal number of clusters (K), theoretically set at the highest SC value. Professional interpretation was additionally incorporated to refine this determination. The final optimal number of clusters for HCA was three, as illustrated in Figure 2.
4. Cluster definition. Three clusters were defined by research members according to the average values of six evaluation indicators per cluster.
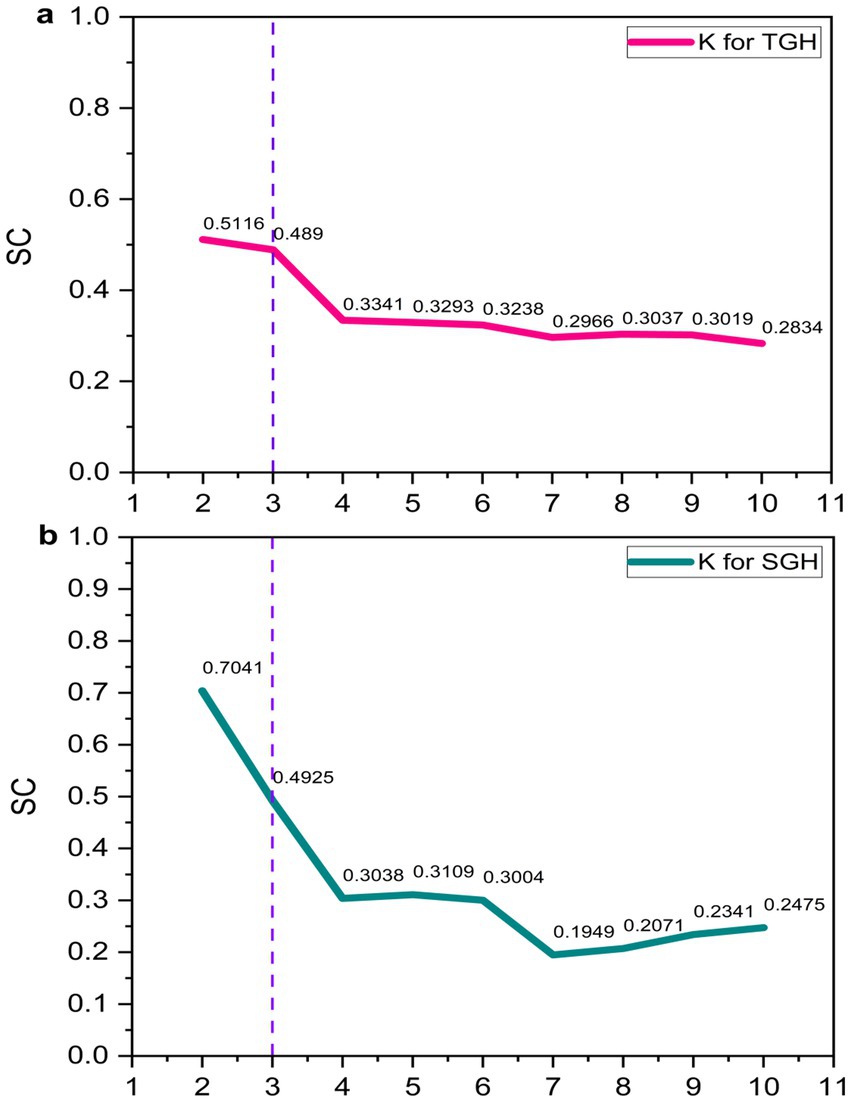
Figure 2. Determination of the optimal number of clusters using SC. TGH, tertiary general hospital; SGH, secondary general hospital; SC, Silhouette Coefficient. Panel (a) corresponds to the analysis of tertiary general hospitals (TGH), showing how the Silhouette Coefficient (SC) changes with the number of clusters (K). Panel (b) corresponds to the analysis of secondary general hospitals (SGH), illustrating the SC-K relationship for this hospital level.
2.5 Statistical analysis
All statistical analyses were performed using SPSS 27.0. The normality of continuous variables was assessed using the Shapiro–Wilk test. Non-normally distributed variables were described using the median and interquartile range [M (IQR)]. To examine the characteristic disparities across clusters, the Kruskal-Wallis H test was applied to non-normally distributed variables. A p-value less than 0.05 was considered statistically significant.
3 Results
3.1 EFA results
The KMO test and Bartlett’s test of sphericity confirmed the data suitability for EFA, with a KMO value was 0.726 and significant Bartlett’s test results (p < 0.001). Three CFs were extracted according to the extraction principle. CF1 explained 48.502% of the total variance (rotated eigenvalue = 2.910), CF2 explained 19.052% (rotated eigenvalue = 1.143), and CF3 explained 18.085% (rotated eigenvalue = 1.085), collectively accounting for 85.639% of the cumulative variance. All communality values of the six indicators exceeded 0.790, with the largest in MMLRG (0.956), followed by TEI (0.918), CMI (0.874), ND (0.806), TW (0.794), and CEI (0.791), indicating strong representation of original indicators by the extracted CFs. Detailed variance contributions and eigenvalues are presented in Table 2.
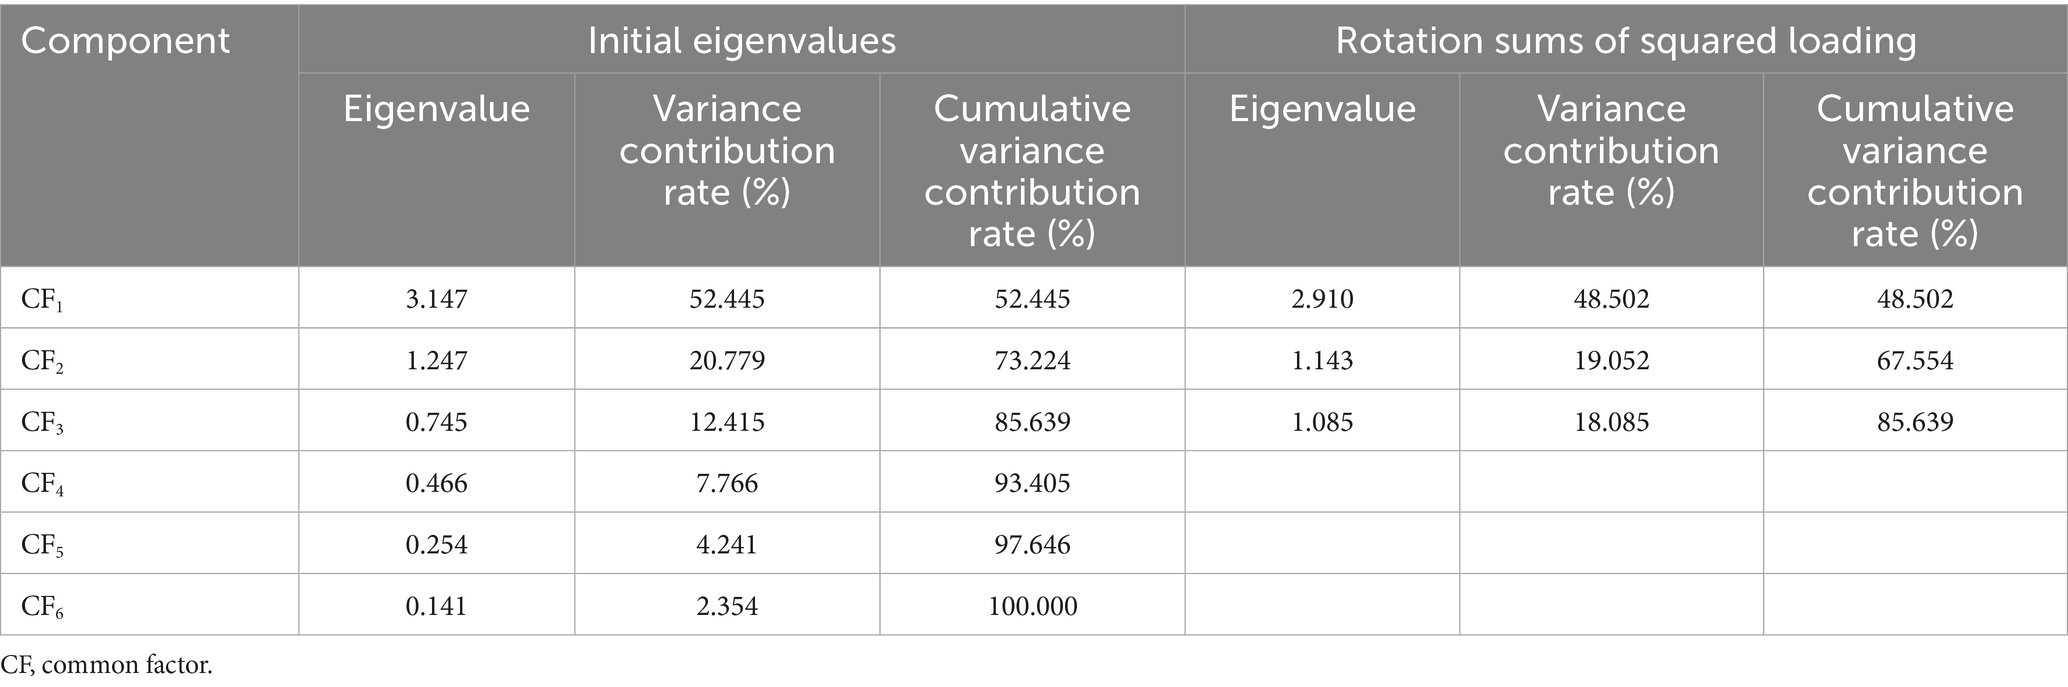
Table 2. Eigenvalues of the correlation matrix and variance contribution rate.
The rotated factor loading matrix showed that CF1 had high loadings on CMI (0.903), ND (0.823), and TW (0.804), reflecting hospital medical abilities, thus labeled as the medical ability factor. CF2 exhibited a dominant loading on TEI (0.931), labeled as the medical efficiency factor, while CF3 demonstrated a high loading on MMLRG (0.964), designated as the medical security factor. Factor loading details are presented in Table 3.
Table 3. Factor loading matrix and rotated factor loading matrix.
Common factor scores for each study hospital were calculated based on the factor score coefficient matrix (Table 4):
Table 4. Factor score coefficient matrix.
The CES for each study hospital was computed using the following function:
Ranking based on CES showed all top 10 hospitals were TGHs, with four located in Chengdu and one each in Luzhou, Suining, Deyang, Mianyang, and Nanchong. Conversely, the bottom 10 hospitals were all SGHs, predominantly concentrated in northeastern Sichuan (Guangyuan, Dazhou, Guang’an, Nanchong, Bazhong), with seven of the 10 located there. Top and the bottom 10 hospital details are in Table 5, and full EFA rankings for 306 study hospitals are in Table 6.
Table 5. The information of the top 10 and the bottom 10 hospitals based on EFA.
Table 6. Overall ranking results of the study hospitals.
3.2 HCA results
3.2.1 HCA for TGHs
Three distinct clusters were identified among TGHs: the “Excellent” cluster (Cluster 1, n = 41, 30.83%), “Middle” cluster (Cluster 2, n = 76, 57.14%), and “Inferior” cluster (Cluster 3, n = 16, 12.03%). Performance metrics showed significant inter-cluster differences: (1) the “Excellent” cluster outperformed “Middle” and “Inferior” clusters in CMI (1.02 vs. 0.80 vs. 0.68, p < 0.001), ND (663.00 vs. 575.00 vs. 517.50, p < 0.001), TW (77,231.31 vs. 28,130.14 vs. 19,023.35, p < 0.001), and TEI (0.92 vs. 1.06 vs. 1.02, p < 0.001); (2) the “Inferior” cluster demonstrated the best CEI (0.61 vs. 0.82 vs. 0.85, p < 0.001) and MMLRG (0.05 vs. 0.09 vs. 0.09, p = 0.011). Detailed clustering results and inter-cluster comparisons are presented in Tables 7, 8.
Table 7. Results of HCA for TGHs.
Table 8. Comparison analysis among different clusters of TGHs.
3.2.2 HCA for SGHs
SGHs were categorized into three clusters: “Excellent” (Cluster 1, n = 45, 26.01%), “Middle” (Cluster 2, n = 121, 69.94%), and “Inferior” (Cluster 3, n = 7, 4.05%). Significant inter-cluster differences were identified: (1) the “Excellent” cluster outperformed in ND (392.00 vs. 293.00 vs. 186.00, p < 0.001) and TW (7,088.34 vs. 4,072.28 vs. 1,873.11, p = 0.001); (2) the “Inferior” cluster demonstrated the highest CMI (0.81 vs. 0.70 vs. 0.64, p < 0.001) but the worst MMLRG (3.39 vs. 0.18 vs. 0.04, p < 0.001); (3) the “Middle” cluster exhibited optimal CEI (0.57 vs. 0.72 vs. 0.64, p < 0.001) and TEI (0.99 vs. 1.16 vs. 1.19, p < 0.001). Clustering results and comparative analyses are provided in Tables 9, 10.

Table 9. Results of HCA for SGHs.
Table 10. Comparison analysis among different clusters of SGHs.
4 Discussion
4.1 Rationales and indicators for medical service performance evaluation
Since 2019, China has implemented a national initiative to strengthen performance evaluations of tertiary public hospitals, establishing a 55-indicator national evaluation framework as a reference for health authorities at all levels (35). In 2019, the Sichuan Provincial People’s Government launched a targeted evaluation of tertiary hospital performance (36), followed by the Sichuan Health Commission’s 2020 initiative for secondary public hospitals (37). These regional frameworks primarily relied on isolated health indicators, similar to historical approaches. In contrast, numerous studies have adopted DRGS indicators to develop comprehensive evaluation models for assessing medical service performance across hospitals or regions (14, 18–21, 23, 25, 26, 28, 29, 38). Adoption of DRGs indicators addresses the limitations associated with single-index methods, the challenges in horizontal comparisons (10), and thus enhances evaluation efficiency (39).
4.2 Rationality of the DRGs-based evaluation model integrating EFA and HCA
Our study developed a novel evaluation model incorporating EFA and HCA using DRGS indicators to evaluate 306 hospitals in Sichuan. The model’s scientific validity stems from two key strengths: data authenticity and methodological rigor. Hu et al. identified common issues in Chinese medical quality evaluations, such as unreliable data sources and low accuracy (40), which our study mitigates through DRGs indicators derived from the FPMR database (23). This ensures original data authenticity, consistency, and standardization, and thereby guaranteeing the credibility of the evaluation results.
Another notable issue concerning DRGS indicators is multicollinearity, defined by Mamouei et al. as inter-variable correlations that distort statistical inference (41). Compared to traditional evaluation indicators, DRGS indicators are interrelated and mutually constrained (10, 39). For instance, increasing CMI (by treating more severe cases) often elevates LOS and medical costs, thereby influencing CEI and TEI. To address this, our study adopted EFA to condense six original indicators into three significant CFs, reducing indicator interactions and enhancing evaluation reliability (10). This approach aligns with PCA methodologies recommended for multicollinearity mitigation (41).
4.3 Disparities in overall performances of the study hospitals
Significant disparities in the medical service performance of 306 study hospitals in Sichuan Province were observed in 2024. TGHs in the Chengdu region predominantly outperformed SGHs in northeastern Sichuan, findings contradict with the conclusion that minority-inhibited regions in Sichuan generally exhibited the worst performance (42–44), but partially consistent with previous studies (42, 45). These discrepancies may be attributed to the combined influences of hospital location and hospital level.
Geographically, Chengdu’s advantageous location, high economic development, strong government support (42), and advanced medical resources facilitate the attraction of skilled healthcare professionals (42, 45) and continuous enhancement of medical techniques. This enables the region to handle a larger patient volume, especially those with severe illnesses. Despite the high pressures of serving massive patient loads, hospitals here typically demonstrate higher management skills to maintain medical quality and retain their leading position in performance evaluations. However, as to northeastern Sichuan, their worst performance may be partially attributed to the underdeveloped economy, insufficient allocation of high-quality medical institutions (especially tertiary hospitals), and imbalanced healthcare talent structure. Relevant data show its GDP growth rate has been significantly lower than the provincial average, which may strain fiscal support for healthcare and hinder development (46). In 2022, tertiary hospitals accounted for only 11.4% in the region-far below the proportion in Chengdu, indicating a severe shortage of premium healthcare resources. Additionally, the region suffers a dearth of experienced practitioners, with only 9.2% of staff holding senior qualifications, far below the 38.7% in Chengdu (47, 48).
From the perspective of hospital level, China’s hospital system is categorized into three tiers (49). TGHs function as regional medical centers, integrating comprehensive capabilities in clinical care, education, and research to provide high-level specialized services across regions, cities, provinces, and even nationwide (50). Equipped with abundant medical resources and top-tier talent, they inherently achieve higher technical standards. Previous studies have also shown that tertiary hospitals dominate healthcare service provision in China, regardless of the severity of illness (51–53). Their large patient bases, advanced equipment, and skilled personnel confer a decisive advantage in performance evaluations. In contrast, SGHs primarily serve local communities while undertaking limited teaching and research roles (49). Compared to tertiary institutions, they lag in bed capacity, clinical department configuration, medical equipment, technical proficiency, talent reserves, and research capabilities (54, 55). These structural gaps place secondary hospitals at a competitive disadvantage, typically resulting in lower rankings in performance evaluations.
4.4 Disparities in performances among different clusters
4.4.1 Performance variations in TGHs
Our study observed that the majority of tertiary general hospitals were clustered into the “Middle” cluster, with over 10% classified into the “Inferior” cluster. In 2021, the Health Commission of Sichuan Province issued the “Implementation Rules for the Evaluation Criteria of Tertiary Hospitals in Sichuan Province (2021 edition),” instructing tertiary hospitals in the region to enhance daily management and consistently improve medical quality (10). Despite uniform construction standards for THGs in Sichuan, significant disparities in medical service performance were revealed. Hospitals in the “Excellent” cluster significantly outperformed those in the “Middle” and “Inferior” clusters in medical ability and time efficiency (10, 42). However, they demonstrated poorer performance in cost efficiency (10, 42) and medical security, which contrasts with previous studies (10).
Hospitals in the “Excellent” cluster typically serve as top-tier regional institutions, benefiting from stronger government support, advanced medical equipment, and highly skilled healthcare teams. This enables them to treat a larger volume of patients, particularly those with severe illnesses, thereby expanding their disease coverage. As a result, they exhibit higher medical abilities, as indicated by higher CMI, ND, and TW values compared to other hospitals. Previous studies have found that regions generally exhibit lower time efficiency regardless of their medical service levels (42). However, our study identified that “Excellent” cluster hospitals performed best in time efficiency. This finding contrasts with previous research and may be attributed to their superior hospital management skills and professional teams. Health authorities have set stringent and uniform requirements on inpatient LOS in tertiary hospitals (14). Our findings suggest that “Excellent” cluster hospitals, with their specialized management teams and advanced management skills, can achieve better performance in time efficiency performance.
Consistent with previous studies (10, 42, 45, 56), our study found that “Excellent” cluster hospitals exhibited higher medical costs and mortality of middle and low-risk patients, likely linked to their status as regional top-tier institutions. These hospitals are responsible for admitting and treating regional severe, complicated, and acute cases (57), which consume more medical resources (e.g., advanced equipment and experienced staff), require longer hospital stays, and have higher treatment failure rates due to the severity of conditions. Collectively, these factors may contribute to the elevated medical costs and mortality values observed in “Excellent” cluster hospitals.
4.4.2 Performance variations in SGHs
Our study revealed that, similar to TGHs, the majority of SGHs were clustered into the “Middle” cluster, with fewer than 5% clustered into the “Inferior” cluster. Unlike TGHs, SGHs in the “Excellent” cluster only outperformed in ND and TW. In contrast, those in the “Inferior” exhibited the best performance in CMI but the worst in MMLRG. Neither the “Excellent” nor the “Inferior” cluster hospitals performed best in CEI and TEI. These findings suggest that “Excellent” cluster hospitals outperformed in disease coverage and total inpatient output, whereas “Inferior” cluster hospitals performed relatively better in admitting and treating severely ill patients but struggled to maintain medical service quality, as evidenced by the disproportionately high MMLRG.
In 2019, the Health Commission of Sichuan Province issued the “Guidelines on Further Improving the Graded Diagnosis and Treatment System,” which explicitly stipulated the establishment of a scientific and efficient two-way referral mechanism between lower-level hospitals (secondary or grassroots) and tertiary hospitals within the region to meet the local medical service demands (58). Nevertheless, there are no mandatory regulations regarding patient referrals between SGHs. Patients may choose “Inferior” cluster hospitals based on geographic convenience rather than the hospital’s medical abilities for treating their conditions. As a result, these patients may be randomly admitted and treated by SGHs. The higher CMI values suggest that “Inferior” cluster hospitals may receive a great number of severe patients due to their convenient location. However, their medical abilities may fall short of the required standards for treating these patients, as indicated by the alarmingly high MMLRG values. Therefore, for SGHs in the “Inferior” cluster, enhancing medical abilities and maintaining medical quality should be prioritized as urgent tasks to ensure inpatient safety.
4.5 Limitations of our study
Several limitations of our study should be acknowledged. Firstly, although the data used in this study originated from the FPMR, potential errors may have occurred during the upload process to the SHDADSCP for generating DRGS indicators. These potential errors could influence the results of the medical service performance evaluation. Secondly, the algorithms for calculating DRGS indicators vary across different regions. For instance, BJ-DRG for Beijing and MS-DRG for Sichuan. Even with the same original data, the results of DRGS indicators may differ due to these regional variations. Therefore, caution should be exercised when applying our findings to other regions. Thirdly, this study did not consider the weights of DRGS indicators in constructing the performance evaluation model. Previous studies have demonstrated that different weights assigned to evaluation indicators can potentially affect the evaluation results (3). Therefore, future studies are anticipated to explore these underlying mechanisms.
5 Conclusion
DRGS serve as a widely adopted risk adjustment tool for evaluating the medical service performance both within and among hospitals. By implementing EFA, our study mitigated the multicollinearity inherent in DRGS indicators, yielding more reliable and accurate evaluation results. Significant disparities in medical service performance were observed across different regions and hospital levels in Sichuan Province, with Chengdu region demonstrating optimal performance. For TGHs, hospitals in the “Inferior” cluster are recommended to enhance their medical ability and efficiency compared to those in the “Excellent” cluster. Conversely, hospitals in the “Excellent” cluster should focus on controlling medical costs compared to those in the “Inferior” cluster. For SGHs, hospitals in the “Inferior” cluster should concentrate on improving medical security and ensuring patient safety compared to those in the “Middle” and “Excellent” clusters.
Data availability statement
The raw data supporting the conclusions of this article will be made available by the authors without undue reservation.
Author contributions
XL: Conceptualization, Formal analysis, Methodology, Writing – original draft, Writing – review & editing. JC: Resources, Supervision, Writing – review & editing. RG: Data curation, Writing – review & editing. OJ: Project administration, Supervision, Writing – review & editing.
Funding
The author(s) declare that no financial support was received for the research and/or publication of this article.
Acknowledgments
Many thanks to the Sichuan Health Data Analysis and Decision Support Cloud Platform for their support in extracting the original data.
Conflict of interest
The authors declare that the research was conducted in the absence of any commercial or financial relationships that could be construed as a potential conflict of interest.
Generative AI statement
The authors declare that no Gen AI was used in the creation of this manuscript.
Publisher’s note
All claims expressed in this article are solely those of the authors and do not necessarily represent those of their affiliated organizations, or those of the publisher, the editors and the reviewers. Any product that may be evaluated in this article, or claim that may be made by its manufacturer, is not guaranteed or endorsed by the publisher.
References
1. Fatima, I, Humayun, A, Iqbal, U, and Shafiq, M. Dimensions of service quality in healthcare: a systematic review of literature. Int J Qual Health Care. (2018) 31:11–9. doi: 10.1093/intqhc/mzy125
2. Yang, JR, Liu, F, Yang, CX, Wei, JY, Ma, YH, Xu, LS, et al. Application of Donabedian three-dimensional model in outpatient care quality: a scoping review. J Nurs Manag. (2025) 2025:6893336. doi: 10.1155/jonm/6893336
3. Ayanian, JZ, and Markel, H. Donabedian's lasting framework for health care quality. N Engl J Med. (2016) 375:205–7. doi: 10.1056/NEJMp1605101
4. Wang, M, Zhang, X, Qin, DW, Lyu, MR, Shi, C, Mei, XY, et al. Construction of the evaluation index system for core competence of hospital specialist service operation assistants (in Chinese). Chin J Hosp Admin. (2023) 39:692–7. doi: 10.3760/cma.j.cn111325-20230511-00382
5. Cai, PM, and Wu, Y. Discussion on the construction of single disease quality management system based on Donabedian theory (in Chinese). Chin Hosp Manag. (2024) 12:60–2.
6. Wang, ZK, Peng, F, Tu, SG, Chen, Z, Chen, JH, and Li, G. Construction of the outpatient medical quality assessment system of general hospitals based on the Donabedian model (in Chinese). Chin Hosp. (2019) 23:8–10. doi: 10.19660/j.issn.1671-0592.2019.08.03
7. The General Office of the State Council of the People’s Republic of China. Strengthening performance evaluation of tertiary public hospitals. (2019). Available online at: https://www.gov.cn/zhengce/content/2019-01/30/content_5362266.htm (Accessed April 24, 2025).
8. DeCenso, B, Duber, HC, Flaxman, AD, Murphy, SM, and Hanlon, M. Improving hospital performance rankings using discrete patient diagnoses for risk adjustment of outcomes. Health Serv Res. (2018) 53:974–90. doi: 10.1111/1475-6773.12683
9. Zhang, Q, and Li, XD. Application of DRGs in hospital medical record management and its impact on service quality. Int J Qual Health Care. (2022) 34:1–5. doi: 10.1093/intqhc/mzac090
10. Liu, XD, and Ye, ML. Medical service performance evaluation of tertiary general hospitals in Sichuan Province in China based on diagnosis-related groups. BMC Health Serv Res. (2025) 25:563. doi: 10.1186/s12913-025-12256-0
11. Yong, PL, Saunders, RS, and Olsen, L. The healthcare imperative: lowering costs and improving outcomes. Washington (DC): National Academies Press (US) (2010).
12. Fay, MD, Jackson, DA, and Vogel, BB. Implementation of a severity-adjusted diagnosis-related groups payment system in a large health plan: implications for pay for performance. J Ambul Care Manage. (2007) 30:211–7. doi: 10.1097/01.JAC.0000278981.65063.87
13. Rodriguez, KE, Bibbo, J, Verdon, S, and O’Haire, ME. Mobility and medical service dogs: a qualitative analysis of expectations and experiences. Disabil Rehabil Assist Technol. (2019) 15:499–509. doi: 10.1080/17483107.2019.1587015
14. Feng, LF, Tian, Y, He, M, Tang, J, Peng, Y, Dong, CJ, et al. Impact of DRGs-based inpatient service management on the performance of regional inpatient service in Shanghai, China: an interrupted time series study, 2013-2019. BMC Health Serv Res. (2020) 20:942. doi: 10.1186/s12913-020-05790-6
15. Goldfield, N. The evolution of diagnosis-related groups (DRGs): from its beginnings in case-mix and resource use theory, to its implementation for payment and now for its current utilization for quality within and outside the hospital. Qual Manag Health Care. (2010) 19:3–16. doi: 10.1097/QMH.0b013e3181ccbcc3
16. Fetter, RB, Shin, Y, Freeman, JL, Averill, RF, and Thompson, JD. Case mix definition by diagnosis-related groups. Med Care. (1980) 18:1–53.
17. Vitikainen, K, Street, A, and Linna, M. Estimation of hospital efficiency-do different definitions and casemix measures for hospital output affect the results? Health Policy. (2009) 89:149–59. doi: 10.1016/j.healthpol.2008.05.012
18. Luo, MW, and Xie, SW. Research on evaluation of inpatient service performance of grade a tertiary hospitals in Panxi area based on DRGs (in Chinese). Chongqing Med. (2020) 49:2043–51. doi: 10.3969/j.issn.1671-8348.2020.12.033
19. Jian, WY, Huang, YM, Hu, M, and Zhang, XM. Performance evaluation of inpatient service in Beijing: a horizontal comparison with risk adjustment based on diagnosis related groups. BMC Health Serv Res. (2009) 9:72. doi: 10.1186/1472-6963-9-72
20. Liu, XK, Liu, FR, Liu, W, Wu, MF, Yang, LP, and Wei, L. Performance evaluation of medical service for breast cancer patients based on diagnosis related groups. BMC Health Serv Res. (2021) 21:496. doi: 10.1186/s12913-021-06439-8
21. Lu, JJ, Lin, ZC, Xiong, Y, Pang, H, Zhang, Y, Xin, ZY, et al. Performance assessment of medical service for organ transplant department based on diagnosis-related groups: a programme incorporating ischemia-free liver transplantation in China. Front Public Health. (2023) 11:1092182. doi: 10.3389/fpubh.2023.1092182
22. The Sichuan health data analysis and decision support cloud platform. Available online at: https://jczcypt.scwjxx.cn:1446/Hcloud/meta/CommonData/public/login/login.ftl?redirectUrl=/meta/HI/analyses/DRGPic/main (Accessed April 24, 2025).
23. Yang, YL, Yang, T, Zhang, ZW, Han, X, Duan, ZQ, Luo, YY, et al. DRGs-based evaluation of medical service quality and performance at tertiary hospitals in Sichuan province (in Chinese). Chin J Hosp Admin. (2018) 34:133–6. doi: 10.3760/cma.j.issn.1000-6672.2018.02.010
24. Originality Document Knowledge Sharing Platform. Practical standard sample and item filling instructions for the first page of medical Records in Sichuan Province (2014 edition) (in Chinese). (2021). Available online at: https://max.book118.com/html/2020/1101/6001045050003014.shtm (Accessed April 24, 2025).
25. Jian, WY, Hu, M, and Zhang, XM. DRGs-based methodology for medical performance evaluation and case studies. Chin J Hosp Admin. (2013) 29:180–5. doi: 10.3760/cma.j.issn.1000-6672.2013.03.007
26. Yang, SS, He, M, Yang, J, Jin, CL, and Wang, XJ. Medical service quality and performance evaluation based on DRGs in Jiading District in Shanghai (in Chinese). Chinese Health Qual Manag. (2017) 24:22–5. doi: 10.13912/j.cnki.chqm.2017.24.3.08
27. Dai, X, Jiang, YR, Li, YY, Wang, XX, Wang, RR, and Zhang, YY. Evaluation of community basic public health service effect in a city in Inner Mongolia Autonomous Region-based on entropy weight TOPSIS method and RSR fuzzy set. Arch Public Health. (2023) 81:149. doi: 10.1186/s13690-023-01151-x
28. Li, L, and Shi, T. 55 tertiary general hospitals in Shandong Province in the context of DRG payment inpatient medical service evaluation study (in Chinese). Chinese Hosp Manag. (2023) 43:27–36.
29. Ruan, ZH, and Qian, AB. A DRG-based evaluation of inpatient service in tertiary general hospitals in Hubei Province (in Chinese). Chin J Med Manage Sci. (2022) 12:8–14. doi: 10.3969/j.issn.2095-7432.2022.03.002
30. Wu, WM, Xu, MJ, Zhang, XH, Huang, KY, and Yang, XL. Comprehensive evaluation of medical quality of 6 county level general hospitals in Guangxi (in Chinese). Chinese Health Statistic. (2013) 30:716–8.
31. Li, JM, Lu, J, Bai, HL, Liu, HL, Yan, XC, and Pu, XH. Comprehensive evaluation and analysis of service capacity of primary medical institutions in Gansu Province (in Chinese). Soft Sci Health. (2024) 38:46–50. doi: 10.3969/j.issn.1003-2800.2024.07.011
32. Yan, H, and Xu, YY. Medical statistics (3rd edition in Chinese). Beijing: Chinese People’s Medical Publishing House. (2015) 396–397.
33. Zhao, QP, Xu, MT, and Fränti, P. Sum-of-squares based cluster validity index and significance analysis. ICANNGA. (2009) 5495:313–22. doi: 10.1007/978-3-642-04921-7_32
34. Rousseeuw, PJ. Silhouettes: a graphical aid to the interpretation and validation of cluster analysis. J Comput Appl Math. (1987) 20:53–65. doi: 10.1016/0377-0427(87)90125-7
35. The Central People’s Government of People’s Republic of China. Notice on the implementation plan for the performance evaluation of tertiary public hospitals in China. (2019). Available online at: https://www.gov.cn/zhengce/zhengceku/2019-09/16/content_5430153.htm (Accessed July 5, 2025).
36. The People’s Government of Sichuan Province. Notice on the implementation plan for the performance evaluation of tertiary public hospitals in Sichuan Province. (2019). Available online at: https://www.sc.gov.cn/10462/c103046/2019/6/27/6efed3f35510465d96a129088e4a5e12.shtml (Accessed April 24, 2025).
37. The Health Commission of Sichuan Province. The implementation plan for the performance evaluation of secondary public hospitals in Sichuan Province. (2020). Available online at: https://wsjkw.sc.gov.cn/scwsjkw/zcwj11/2020/6/3/e610bb9366104e32ab6d473bfff0d40e.shtml (Accessed May 21, 2025).
38. Wu, YG, Luo, MW, Cheng, Z, Guo, GH, and Li, RY. Comprehensive evaluation of performance in clinical specialties based on entropy weight-TOPSIS-RSR (in Chinese). Mod Hosp J. (2025) 25:238–42. doi: 10.3969/j.issn.1671-332X.2025.02.020
39. Zheng, J, He, JX, Wang, J, Yang, SY, and He, ZS. Application of medical service performance evaluation based on diagnosis related groups in China (in Chinese). Heilongjiang Med. (2022) 46:764–6. doi: 10.3969/j.issn.1004-5775.2022.06.045
40. Hu, SN, Chen, D, Zhou, YN, and Zhou, JJ. Research on evaluation indexes of hospital medical quality in China (in Chinese). Chinese Hospitals. (2021) 25:27–9. doi: 10.19660/j.issn.1671-0592.2021.1.08
41. Mamouei, M, Zhu, YJ, Nazarzadeh, M, Hassaine, A, Khorshidi, GS, Cai, YT, et al. Investigating the association of environmental exposures and all-cause mortality in the UK biobank using sparse principal component analysis. Sci Rep. (2022) 12:9239. doi: 10.1038/s41598-022-13362-3
42. Luo, MW, and Xie, SW. Evaluation of medical service capabilities in different regions of Sichuan Province based on DRGs in Sichuan Province (in Chinese). Admin J Chin PLA. (2020) 27:617–20. doi: 10.16770/J.cnki.1008-9985.2020.07.006
43. Zhang, XL, Duan, ZQ, Luo, YY, Zhang, ZW, Han, X, Guo, XL, et al. Analysis on the application of DRGs performance system to medical and health services in Sichuan Province (in Chinese). Chinese Medical Record. (2021) 20:36–9. doi: 10.3969/j.issn.1672-2566.2019.08.014
44. Chen, Y, Wen, XY, and Chen, L. Based on DRG medical capacity evaluation and disease analysis of one province in 2018 (in Chinese). Chin Med Rec. (2021) 22:12–5. doi: 10.3969/j.issn.1672-2566.2021.10.005
45. Luo, YY, Duan, ZQ, Zhang, XL, and Zhang, ZW. DRGS performance evaluation on hospitalization service in 3-a class general hospital in Sichuan province (in Chinese). Soft Sci Health. (2020) 34:73–7. doi: 10.3969/j.issn.1003-2800.2020.01.016
46. Chen, P, Deng, J, Zeng, X, Lu, QH, and Zhang, Z. Analysis on the evaluation and regional difference of medical service quality from the perspective of high-quality development (in Chinese). Chin Health Econ. (2025) 44:84–9.
47. Dai, P. Research on spatial-temporal evolution of reachability of high-quality medical institutions in Sichuan Province (in Chinese). Chongqing Normal Univ. (2023)
48. Health Commission of Sichuan Province. Statistical bulletin on the development of health undertakings in Sichuan Province (in Chinese). (2023). Available online at: https://wsjkw.sc.gov.cn/scwsjkw/njgb/2024/10/15/08d5497ecbba48e0a76e275f81a8a6e3.shtml (Accessed July 5, 2025).
49. Health Ministry of China. The measures for the administration of the hospital grade (in Chinese). (1989). Available online at: https://baike.baidu.com/item/%E5%8C%BB%E9%99%A2%E5%88%86%E7%BA%A7%E7%AE%A1%E7%90%86%E5%8A%9E%E6%B3%95/420525 (Accessed April 24, 2025).
50. Shi, HM, Fan, M, Zhang, H, Ma, SY, Wang, WX, Yan, ZG, et al. Perceived health-care quality in China: a comparison of second- and third-tier hospitals. Int J Qual Health Care. (2021) 33:mzab027. doi: 10.1093/intqhc/mzab027
51. Hsiao, WC. The Chinese health care system: lessons for other nations. Soc Sci Med. (1995) 41:1047–55. doi: 10.1016/0277-9536(94)00421-o
52. Eggleston, K, Li, L, Meng, QY, Lindelow, M, and Wagstaff, A. Health service delivery in China: a literature review. Health Econ. (2008) 17:149–65. doi: 10.1002/hec.1306
53. Zhou, JC, Pan, KH, Zhou, DY, Zheng, SW, Zhu, JQ, Xu, QP, et al. High hospital occupancy is associated with increased risk for patients boarding in the emergency department. Am J Med. (2012) 125:416.e1–7. doi: 10.1016/j.amjmed.2011.07.030
54. The Health Commission of Sichuan Province. Implementation rules for the evaluation standards of tertiary general hospitals in Sichuan Province (2023 edition). (2023). Available online at: https://wsjkw.sc.gov.cn/scwsjkw/zcwj11/2023/5/12/16ba1d99db034f859171cd4ef9d969d8.shtml (Accessed May 21, 2025).
55. The Health Commission of Sichuan Province. Operational manual for the evaluation of secondary general hospitals in Sichuan Province (2023 edition). (2023). Available online at: https://wsjkw.sc.gov.cn/scwsjkw/qtwj/2023/7/14/4a51023385fa4b43bb043c82daa26fc3.shtml (Accessed May 21, 2025).
56. Yang, L, Zhang, T, and Chen, W. Application of DRGs in performance evaluation of inpatient Services in Regional General Hospitals (in Chinese). Chin J Health Inform Manag. (2019) 16:366–9. doi: 10.3969/j.issn.1672-5166.2019.03.026
57. Lp, H. Application of diagnosis related group in the development evaluation of surgical department in tertiary general hospital (in Chinese). Guangxi Med. (2022) 44:2153–8. doi: 10.11675/j.issn.0253-4304.2022.18.18
58. The Health Commission of Sichuan Province. Guidelines on further improving the graded diagnosis and treatment system. (2019). Available online at: https://wsjkw.sc.gov.cn/scwsjkw/qtwj/2019/10/24/2aac38d32fe84d279d79e6f973d2fb50.shtml (Accessed May 21, 2025).
Keywords: DRGS, exploratory factor analysis, hierarchical clustering analysis, Donabedian, hospital, performance evaluation
Citation: Liu X, Cao J, Ge R and Jiang O (2025) Evaluating medical service performance of hospitals in Sichuan Province, China: exploratory factor analysis and hierarchical clustering analysis based on diagnosis-related groups. Front. Public Health. 13:1617945. doi: 10.3389/fpubh.2025.1617945
Edited by:
Bernadette Pfang, University Hospital Fundación Jiménez Díaz, SpainReviewed by:
Sheng Ding, The Central Hospital of Wuhan, ChinaRicardo De Moraes E. Soares, Instituto Politecnico de Setubal (IPS), Portugal
Copyright © 2025 Liu, Cao, Ge and Jiang. This is an open-access article distributed under the terms of the Creative Commons Attribution License (CC BY). The use, distribution or reproduction in other forums is permitted, provided the original author(s) and the copyright owner(s) are credited and that the original publication in this journal is cited, in accordance with accepted academic practice. No use, distribution or reproduction is permitted which does not comply with these terms.
*Correspondence: Xuedong Liu, c2Nob2xhcnh1ZWRvbmdsaXVAMTYzLmNvbQ==; Ou Jiang, cHJvZmVzc29yamlhbmdvdUAxNjMuY29t