 Miguel Atl Silva-Magaña1,2
 Marisa Mazari-Hiriart2
 Adalberto Noyola3
 Ana C. Espinosa-García2
 Guillermo de Anda-Jáuregui1,4*
 Enrique Hernández-Lemus1*
- 1Computational Genomics Division, National Institute of Genomic Medicine, Mexico City, Mexico
- 2Laboratorio Nacional de Ciencias de la Sostenibilidad, Instituto de Ecología, Universidad Nacional Autónoma de México, Mexico City, Mexico
- 3Instituto de Ingeniería, Universidad Nacional Autónoma de México, Mexico City, Mexico
- 4Investigadores por México, National Council for Science and Technology, Mexico City, Mexico
Wastewater-based epidemiology (WBE) provides a non-invasive, community-level approach to monitor infectious diseases such as COVID-19. This study investigated the temporal relationship between SARS-CoV-2 RNA levels in wastewater and reported COVID-19 cases in adjacent populations in Mexico City. A total of 40 samples were collected from the Copilco neighborhood during two epidemiological waves (April-September 2021 and November 2021-February 2022). An optimized one-step RT-qPCR protocol targeting the N1 gene achieved 96.7% efficiency with a detection limit of 10 copies/μL. Spatial classification identified three proximity zones based on drainage system topology. Cross-correlation analysis between viral genome copies and confirmed case data revealed a significant temporal lag of 6-8 days. These results support the application of WBE as an early-warning tool to inform public health strategies and anticipate infection trends.
1 Introduction
Emerging infectious diseases (EIDs), such as COVID-19, represent a persistent global health challenge, characterized by their rapid spread and significant societal impact (1–4). Defined as infections that have newly appeared or increased in incidence within the last two decades, EIDs like SARS-CoV-2 pose a critical burden on health systems worldwide (5–7). These diseases often overwhelm healthcare infrastructure, necessitate substantial investments in treatment and vaccination, and exacerbate pre-existing health disparities (8, 9). In Mexico, the COVID-19 pandemic has highlighted vulnerabilities in healthcare access and response capabilities, particularly in densely populated urban centers (10–16).
The SARS-CoV-2 virus, responsible for COVID-19, spreads primarily via respiratory droplets but has also been detected in fecal matter, suggesting wastewater as a potential surveillance medium. Wastewater-based epidemiology (WBE) has gained traction as a non-invasive tool to monitor viral prevalence within communities (17–21). Unlike traditional epidemiological approaches, WBE provides a cost-effective and comprehensive snapshot of population-level infection dynamics, encompassing symptomatic and asymptomatic cases (22–24). Such methodologies are particularly relevant in low-resource settings where widespread clinical testing may be unfeasible.
Globally, WBE has proven effective in early outbreak detection, guiding public health interventions, and estimating disease prevalence (25, 26). The approach offers distinct advantages for public health and policy. First, it enables real-time monitoring of infection trends at a community scale, reducing the need for costly individual-level testing. Second, WBE can identify asymptomatic carriers who might otherwise go undetected in traditional surveillance systems (27–29). In parallel, WBE has enabled the early identification of emerging variants, often several days or even weeks ahead of clinical sampling, underscoring its potential utility for genomic surveillance (30–33). Finally, it supports proactive health policy decisions by providing data that inform resource allocation, intervention timing, and public communication strategies. These advantages make WBE an invaluable component of integrated public health surveillance systems (34, 35).
In Mexico City, one of the areas most severely impacted by COVID-19, leveraging WBE presents a unique opportunity to strengthen epidemiological surveillance and inform policy decisions (12, 13, 36, 37). This study evaluates the temporal relationship between SARS-CoV-2 RNA levels in wastewater from the Copilco neighborhood and reported infection trends, aiming to validate WBE's role in public health preparedness and response.
2 Methods
A diagrammatic scheme with the methods described here is presented in the form of a workflow in the Figure 1.
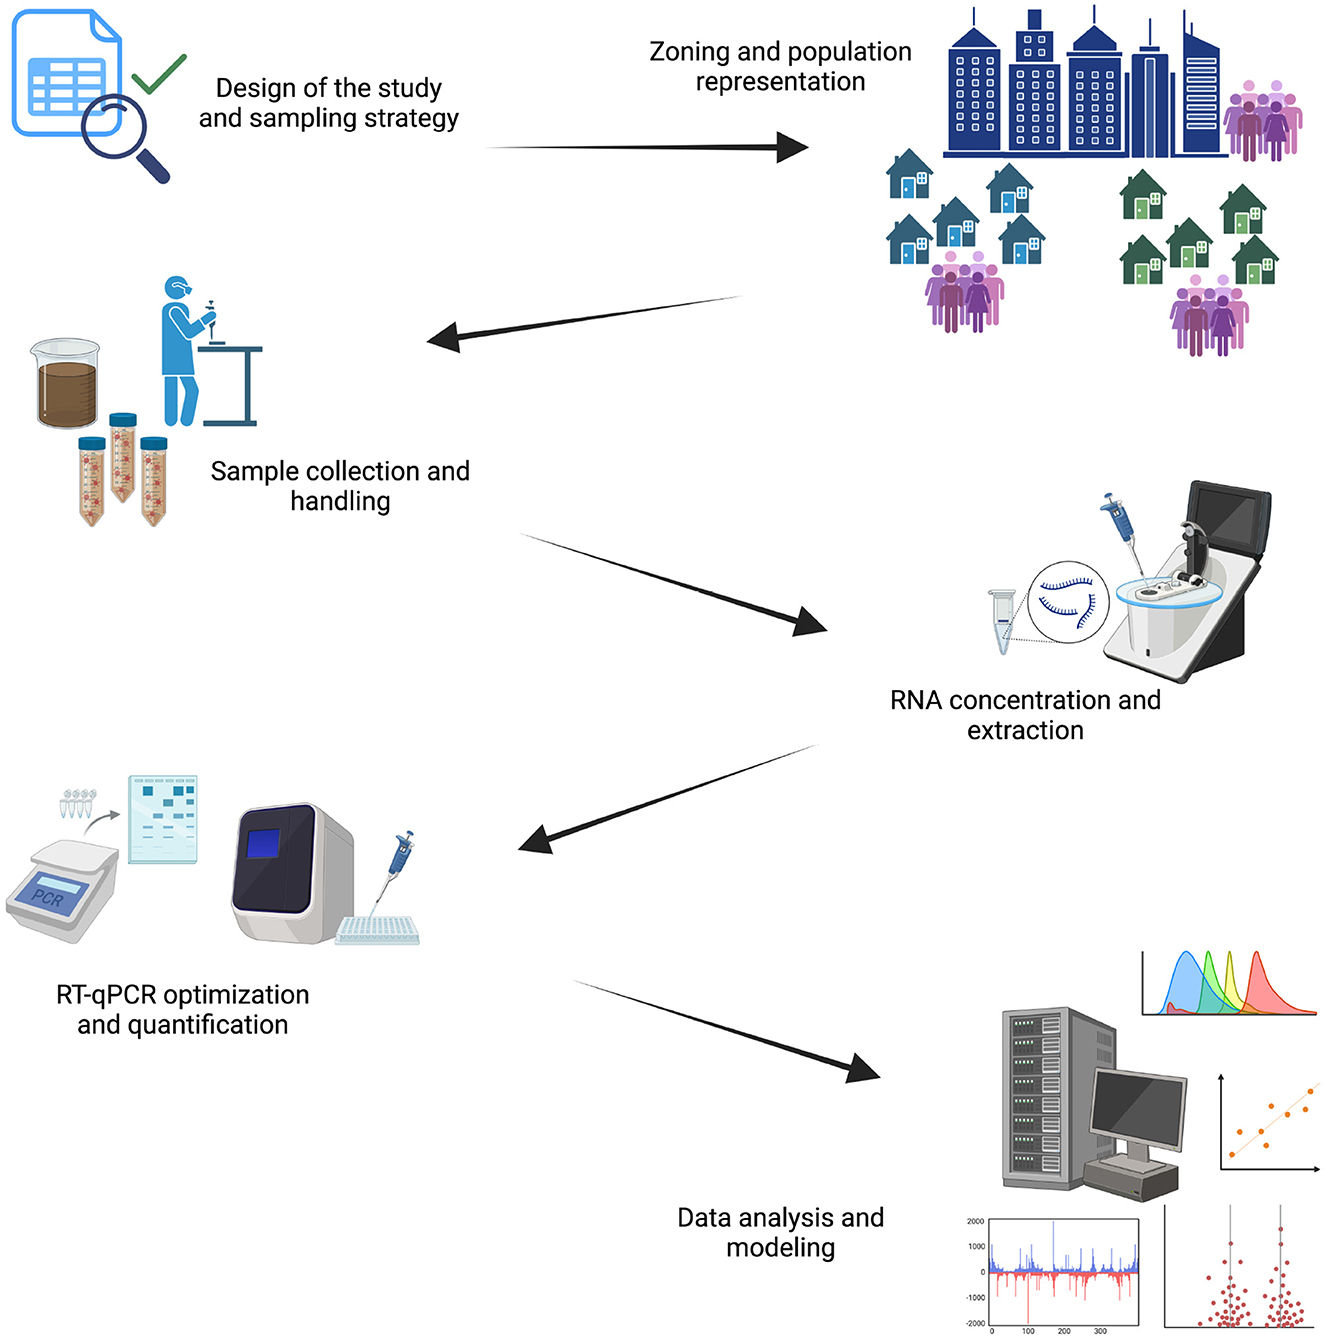
Figure 1. Workflow for this work. Created in https://BioRender.com.
2.1 Study design and sampling
This study was conducted in the Copilco neighborhood of Mexico City, a densely populated urban area with a complex drainage network. A total of 40 wastewater samples were collected across two sampling seasons: April to September 2021 (n = 18) and November 2021 to February 2022 (n = 22). These periods were selected based on local epidemiological data indicating significant COVID-19 case peaks. Sampling was performed at a drainage point located near Copilco Metro station (19.335757 N, -99.176893 E), chosen for its accessibility and strategic position within the local drainage system.
2.2 Zoning and population representation
To assess spatial resolution, the area was divided into three nested analysis zones based on drainage topology, encompassing different distances from the sampling point. Postal codes were used as unique proximity identifiers, as follows: Zone A (ZA) comprised only the postal code where the sampling point was located; Zone B (ZB) included the ZA and the immediately subsequent postal codes connected by a drainage line; and Zone C (ZC) included the ZA-ZB and the immediately subsequent postal codes connected by a drainage line (Figure 2). The reported number of inhabitants for ZA is 8,458, for the ZB it is 22,099, and for ZC it is 43,204. According to the latest Population and Housing Census for Mexico City 2020 (38). Using the postal codes associated with each zone, local reported cases specific to each zone were obtained from the Mexican National Epidemiological Surveillance System (SISVER) database. Spatial mapping and zoning were performed using QGIS software (version 3.24.3) (39).
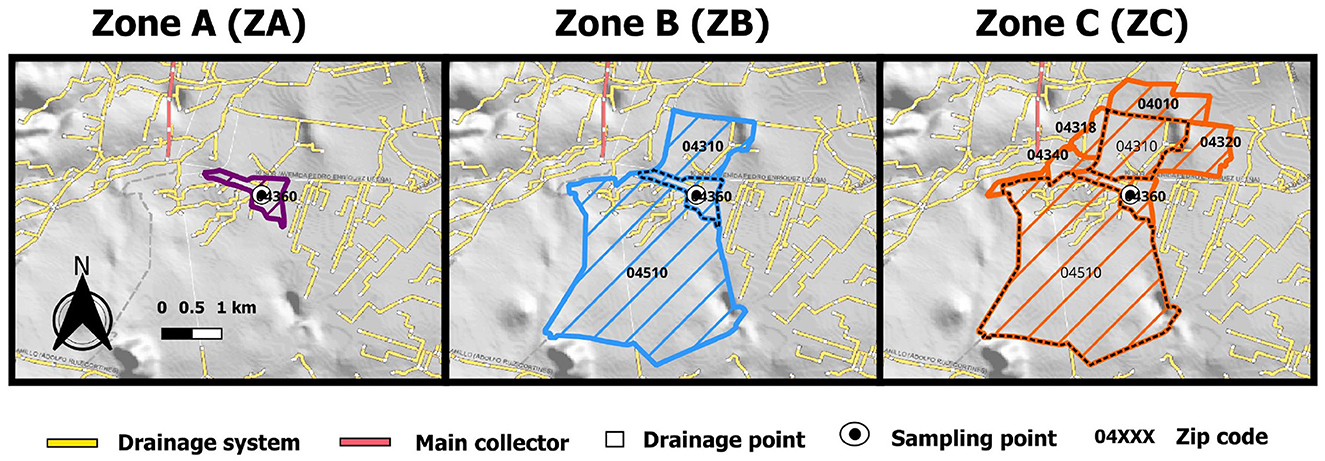
Figure 2. Zones (ZA, ZB, ZC) defined for analysis, based on proximity to the sampling point, using postal codes and the wastewater drainage map.
2.3 Sample collection and handling
Samples were collected following the Centers for Disease Control and Prevention (CDC) guidelines for wastewater surveillance (https://www.cdc.gov/nwss/wastewater-surveillance.html) (40), emphasizing safety and contamination prevention. Each sample was taken around 10 a.m., using sterile polypropylene containers (1 L capacity) and transported at 4°C to the laboratory for processing within 24 h.
2.4 Concentration and RNA extraction
Wastewater samples were concentrated using a polyethylene glycol (PEG) precipitation method (41, 42), modified for higher recovery efficiency (43). A 200 mL aliquot of each sample was mixed with 25 mL of Tris-Glycine-Extract Broth (TGEB, pH 9.5), agitated for 2 h at 4°C, and centrifuged at 2,500 g for 10 min. The supernatant was adjusted to pH 7.0–7.2 and precipitated using 20% PEG 8000 and 0.3 M NaCl. After overnight incubation at 4°C with agitation, the samples were centrifuged at 10,000 g for 30 min. Pellets were resuspended in 0.5 mL of phosphate-buffered saline (PBS) and stored at -80°C until RNA extraction. RNA was extracted using the QIAGEN QIAamp Viral RNA Mini Kit, yielding a final volume of 60 μL per sample.
2.5 RT-qPCR optimization and quantification
The RT-qPCR protocol targeted the N1 gene of SARS-CoV-2, using forward primer 5'-GACCCCAAAATCAGCGAAAT-3', reverse primer 5'-TCTGGTTACTGCCAGTTGAATCTG-3' and probe 5'-FAM-ACCCCGCATTACGTTTGGTGGACC-BHQ1-3' sequences (44). Quantification standard curves were prepared using the synthetic control VR-3276T (ATCC) with a range between 101 and 104 copies of the N1 gene. All samples were analyzed in triplicate, including negative controls (RNase-free water) and parallel detection of rotavirus A nonstructural protein 5 gen (NSP5) was performed using a standard genesig kit from Primerdesign Ltd. as an internal control. Thermal cycling was performed on an Applied Biosystems StepOnePlus system. Key optimizations included: annealing-extension temperature, adjustment of magnesium chloride (MgCl2), primer and probe concentrations to improve efficiency, and reduction of reaction volume to 10 μL.
2.6 Data analysis
The model considers the three defined zones ZA, ZB, ZC for spatial analysis and three time blocks: TB1: April 2021 to February 2022 (total time represented); TB2: April 2021 to September 2021 (sampling session 1); TB3: November 2021 to February 2022 (sampling session 2) for temporal analysis. Time series for interpolated viral RNA counts and reported COVID-19 cases were smoothed using a 7-day simple moving average (SMA 7) (45–47). Cross-correlation analysis (48–50) was performed to identify temporal lags between SARS-CoV-2 RNA levels and reported COVID-19 cases. The analysis included statistical tests for differences between sampling seasons using the Wilcoxon signed-rank test (51–53). The R statistical programming language (version 4.2.1) using the “ xcorr” function. The cross-correlation estimate is thus calculated by a spectral method in which the Fast Fourier Transform (FFT) of the first vector is multiplied element-by-element with the FFT of second vector. The computational burden of this algorithm depends on the length N of the vectors and is independent of the number of lags. Wilcoxon signed-rank test were calculated using the “ wilcoxon.test” function of the “MASS” R-library (54, 55).
3 Results
3.1 RT-qPCR optimization
The RT-qPCR protocol was successfully optimized to achieve high sensitivity and efficiency. By reducing reaction volumes to 10 μL and fine-tuning magnesium chloride concentrations, oligonucleotide levels, and probe quantities, an efficiency of 96.7% was achieved with a detection limit of 10 copies/μL. The optimized conditions reduced reagent usage while maintaining robust performance, offering a cost-effective alternative to commercial kits. Final reaction conditions were as follows: 50°C for 5 min 95°C for 20 s (enzyme activation), 45 cycles of 95°C for 5 s and 60°C for 20 s. The associated results of the initial and final optimized conditions can be seen in Figure 3.
1. 2.5 μL of 4X Master Mix (Applied Biosystems, A28525)
2. 1 μL each of forward and reverse primers (150 nM)
3. 1 μL of probe (60 nM)
4. 0.4 μL of MgCl2 (2 mM)
5. 3 μL of RNA template
6. 1.1 μL of nuclease-free water
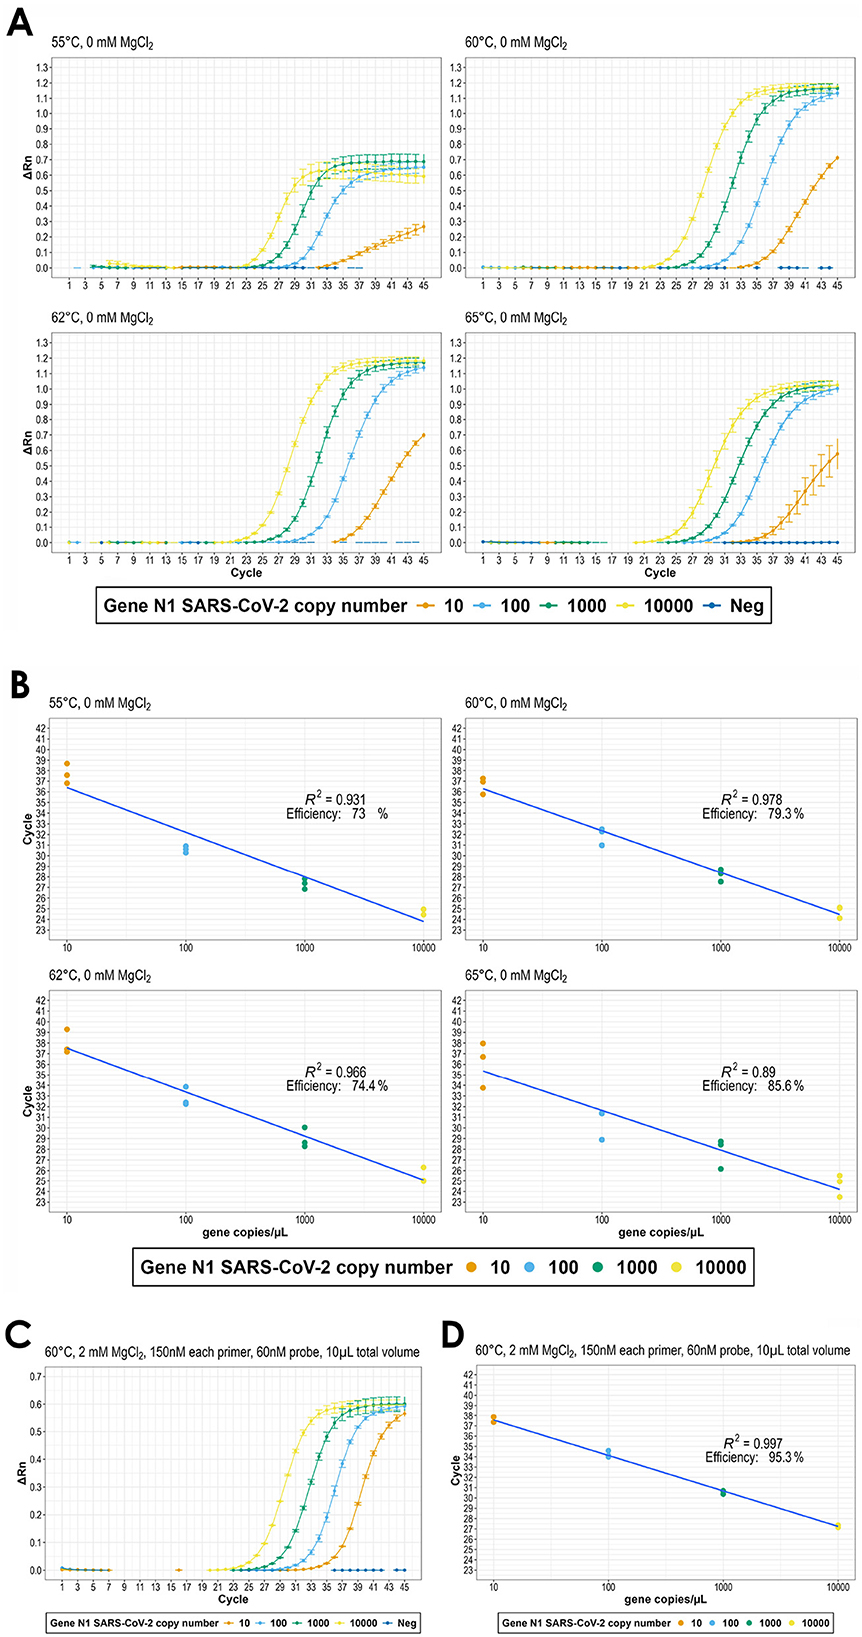
Figure 3. Outline of the RT-qPCR analytical method. (A) amplification panel (ΔRn vs. Cycle) and (B) associated regression panel (copies/μL N1 gene vs. Cycle), for annealing-extension temperatures 55°C, 60°C, 62°C, 65°C and 25 μL final volume; (C) amplification (ΔRn vs. Cycle) and (D) associated regression (copies/μL N1 gene vs. Cycle) for optimized RT-qPCR (60°C, MgCl2 (2 mM), forward and reverse primers (150 nM), probe (60 nM) and 10 μL final volume.
3.2 Quantification of viral RNA
N1 gene copy number counts per liter (copies/L) in wastewater samples ranged from 103 to 105. Temporal trends revealed distinct peaks in viral RNA levels during the sampling seasons, corresponding to reported COVID-19 case surges. The first season (April–September 2021) showed a gradual increase, peaking in July 2021, while the second season (November 2021–February 2022) exhibited sharper spikes in December 2021 (Figure 4).
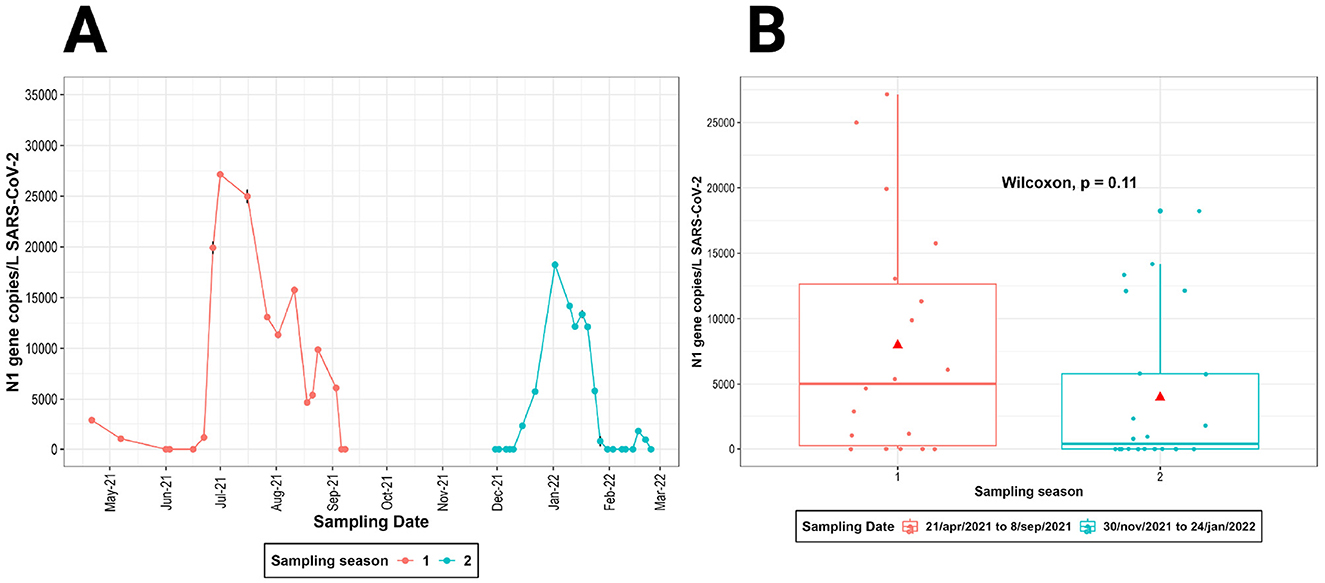
Figure 4. SARS-CoV-2 copies measured on each sampling dates. (A) Sampling dates for season 1 and season 2. (B) Boxplots of SARS-CoV-2 copies showed no statistical differences in the two sampling seasons.
3.3 Spatial analysis of infection trends
The analysis of the relationship between SARS-CoV-2 viral load in wastewater and clinically reported cases in three geographical areas studied (ZA, ZB and ZC) revealed a positive correlation, more pronounced in Zone C, which covers a wider area (Figures 5, 6). This trend was consistent across the different temporal periods analyzed, becoming more evident during period TB3, corresponding to the sampling season 2 (Figure 7). The steeper slope observed in the data from Zone C suggests that spatial integration over a larger geographic scale allows for a more robust identification of the relationship between viral circulation and reported cases. However, this approach requires careful consideration of the associated population size, as expanding the spatial coverage may also increase data variability and, consequently, weaken the strength of the observed association between the variables.
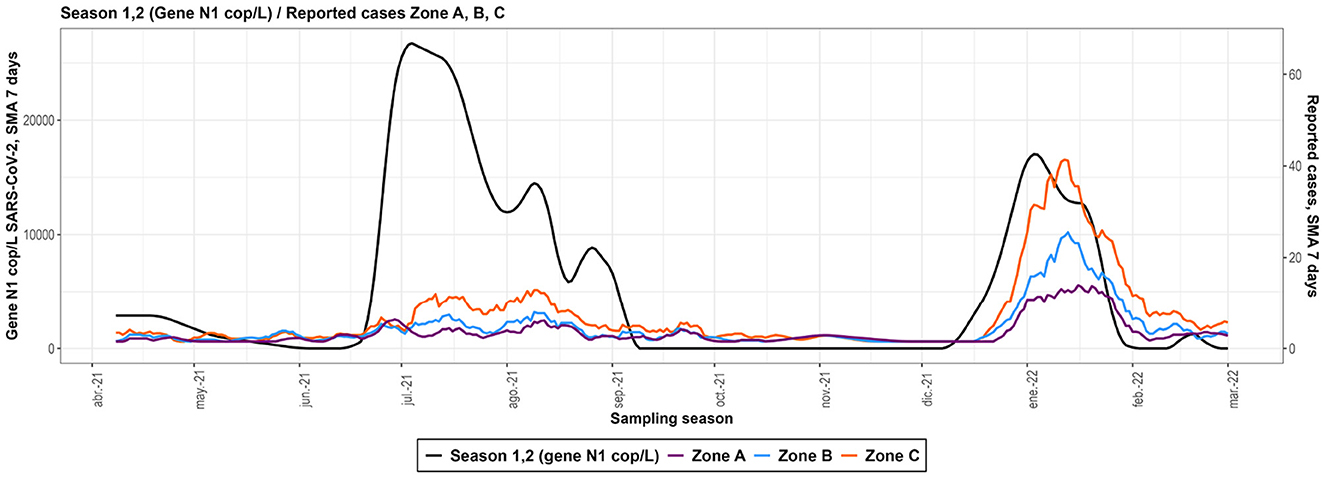
Figure 5. Smoothed curves depicting the full sampling season. Black curve with scale on the left y-axis is the measured concentration of SARS-CoV-2 whereas red blue and green curves with scale on the right y-axis are the number of cases in zones A, B, and C respectively.
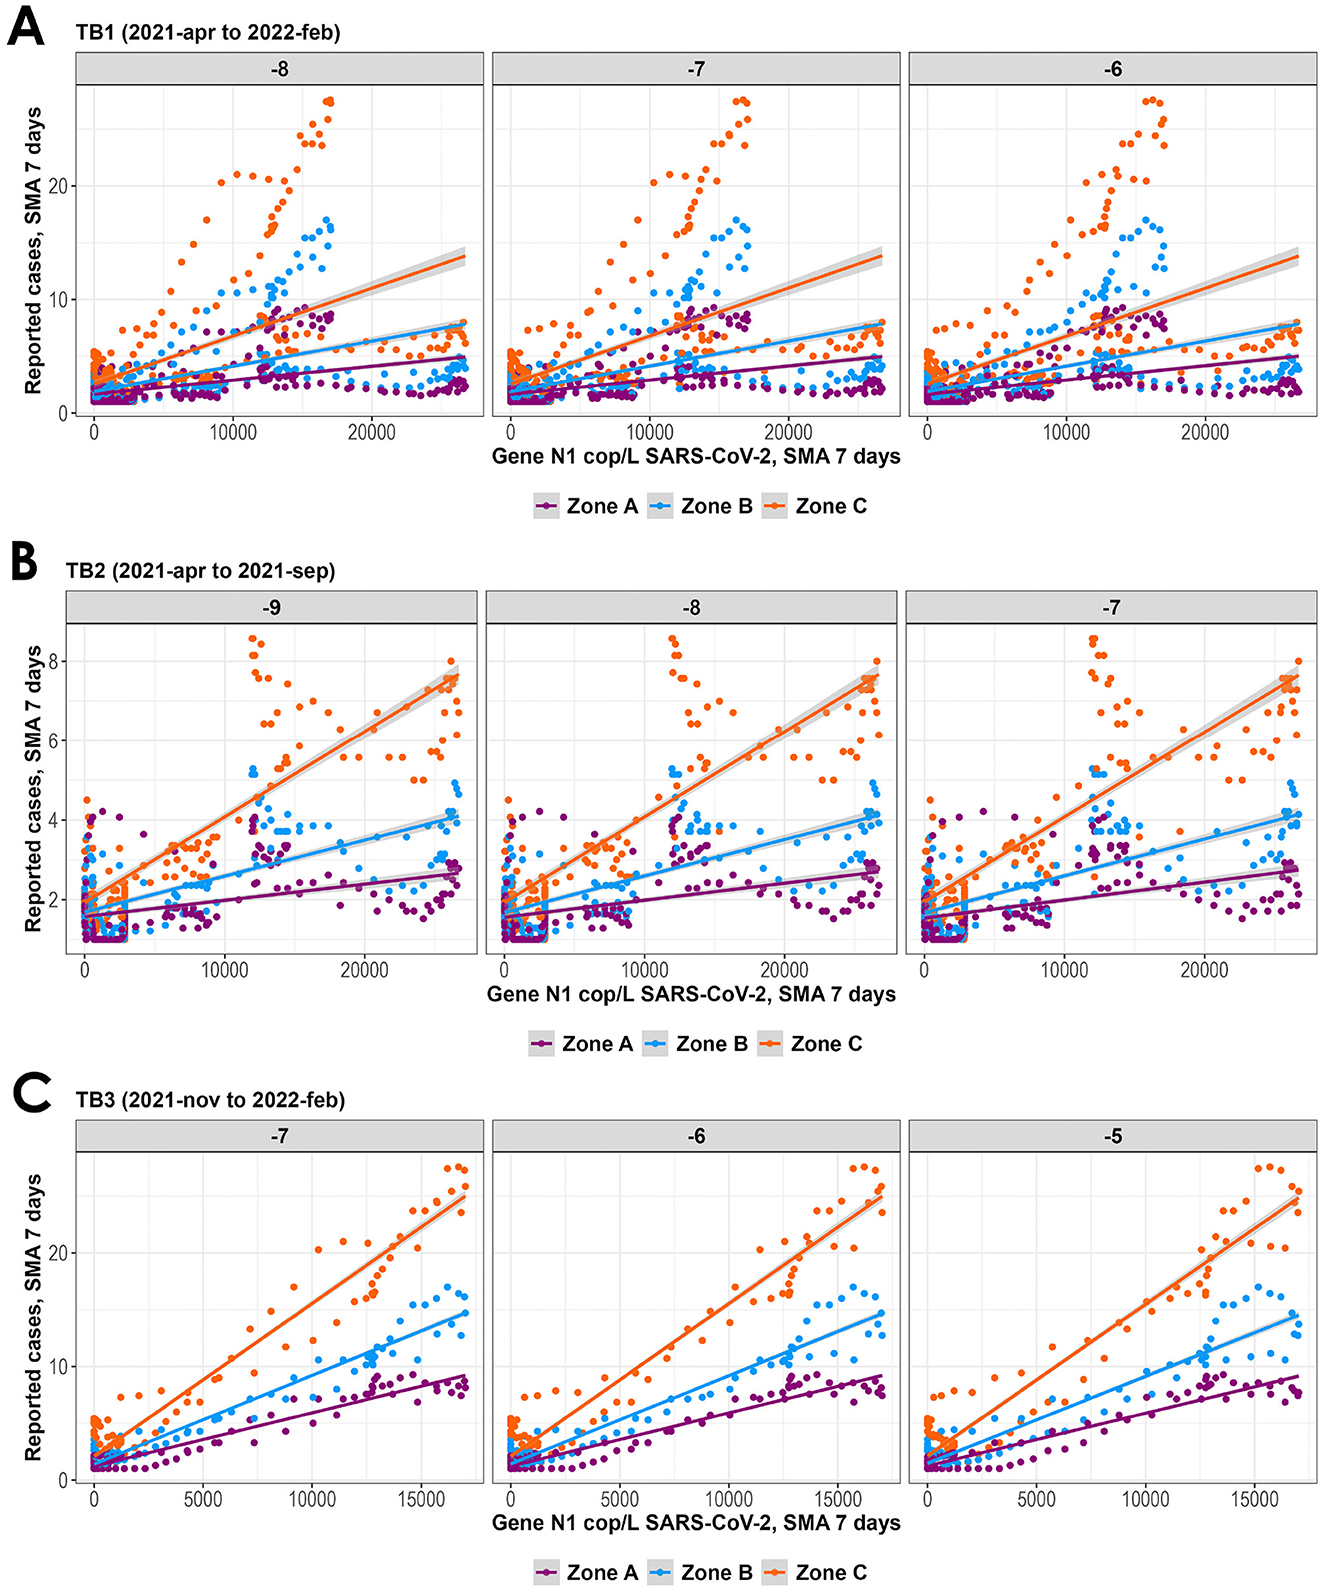
Figure 6. Scatter plot behavior for the different defined zones: ZA,ZB and ZC across selected time lags (only the most relevant are shown) and date ranges. (A) TB1 April 2021 to February 2022; (B) TB2 April 2021 to September 2021; (C) TB3 November 2021 to February 2022.
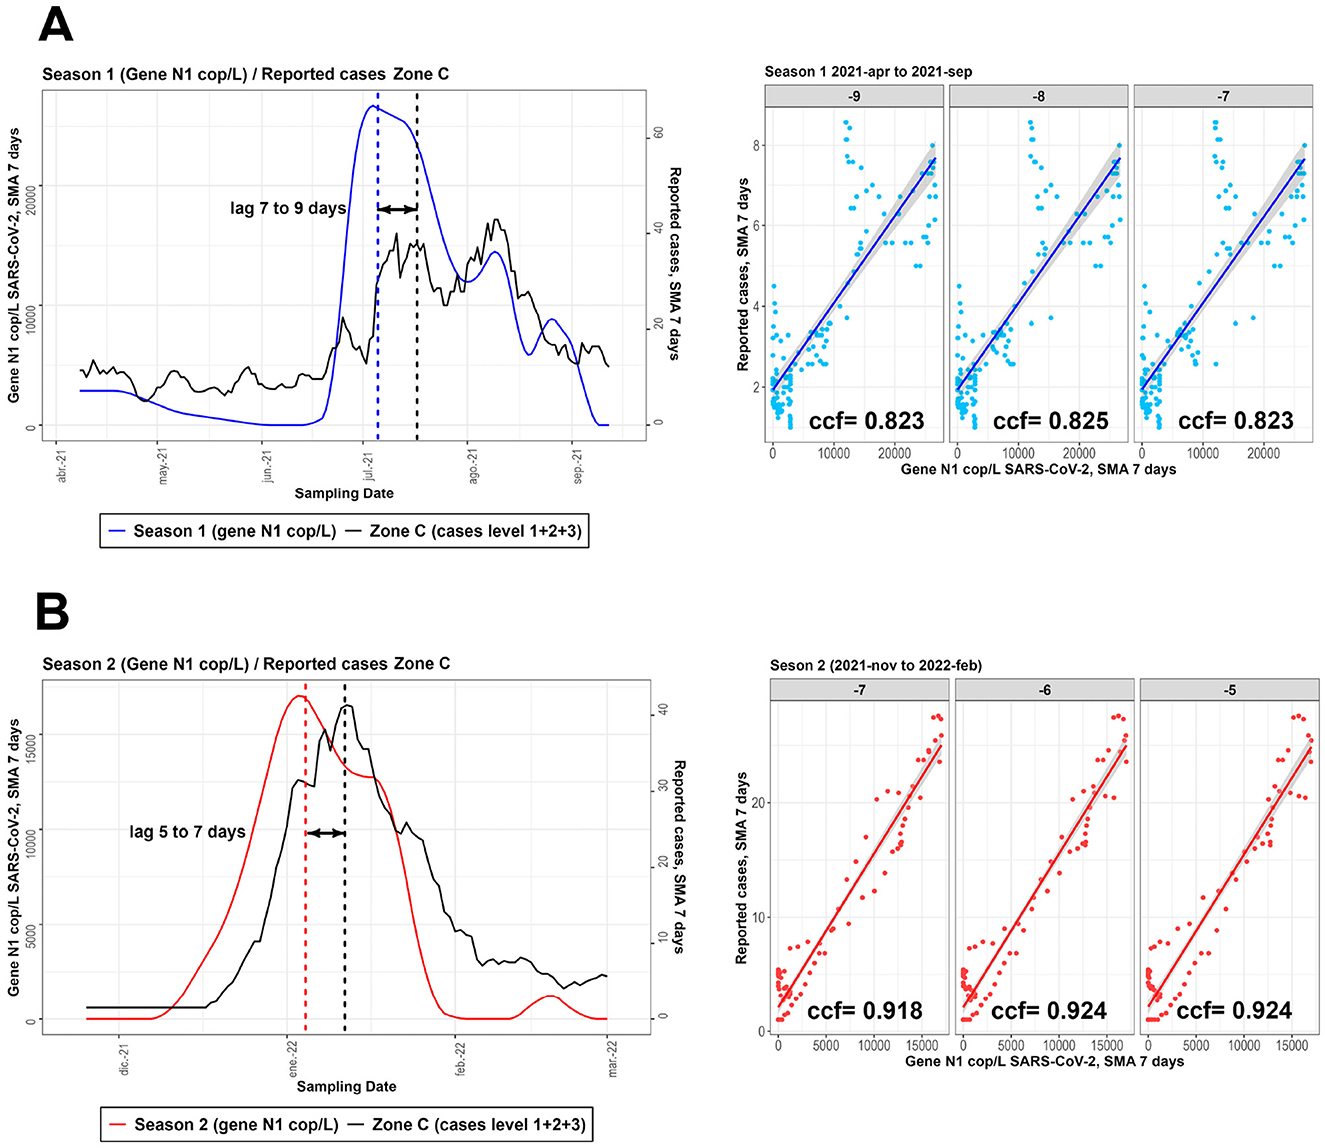
Figure 7. Graphs and cross-correlation results between the concentration of measured viral copies and reported cases for season 1 (A) and season 2 (B) for the analysis of Zone C.
3.4 Temporal correlation analysis
Cross-correlation analysis revealed significant time lags between viral counts in wastewater and reported infections. In TB1, the highest correlation (ccf = 0.571) was observed with a 7-day lag; in TB2, the strongest correlation (ccf = 0.825) was observed with an 8-day lag; and in TB3, the highest correlation (ccf = 0.924) was observed with a 6-day lag. These results can be seen in Table 1 and the associated graphs in the Supplementary material (Supplementary Figure S1). The cross-correlation values obtained throughout the process can be compared in the Supplementary material (Supplementary Figure S2 and Supplementary Table S1), which contain the values obtained using only the interpolation process and using interpolation and smoothing. Figure 7 shows the results for the ZC, which showed the highest correlation values. These results in particular show similar trends to those found in other studies (56–58) where it was possible to find maximum infection peaks in advance using WBE of SARS-CoV-2 with a variable time advantage.
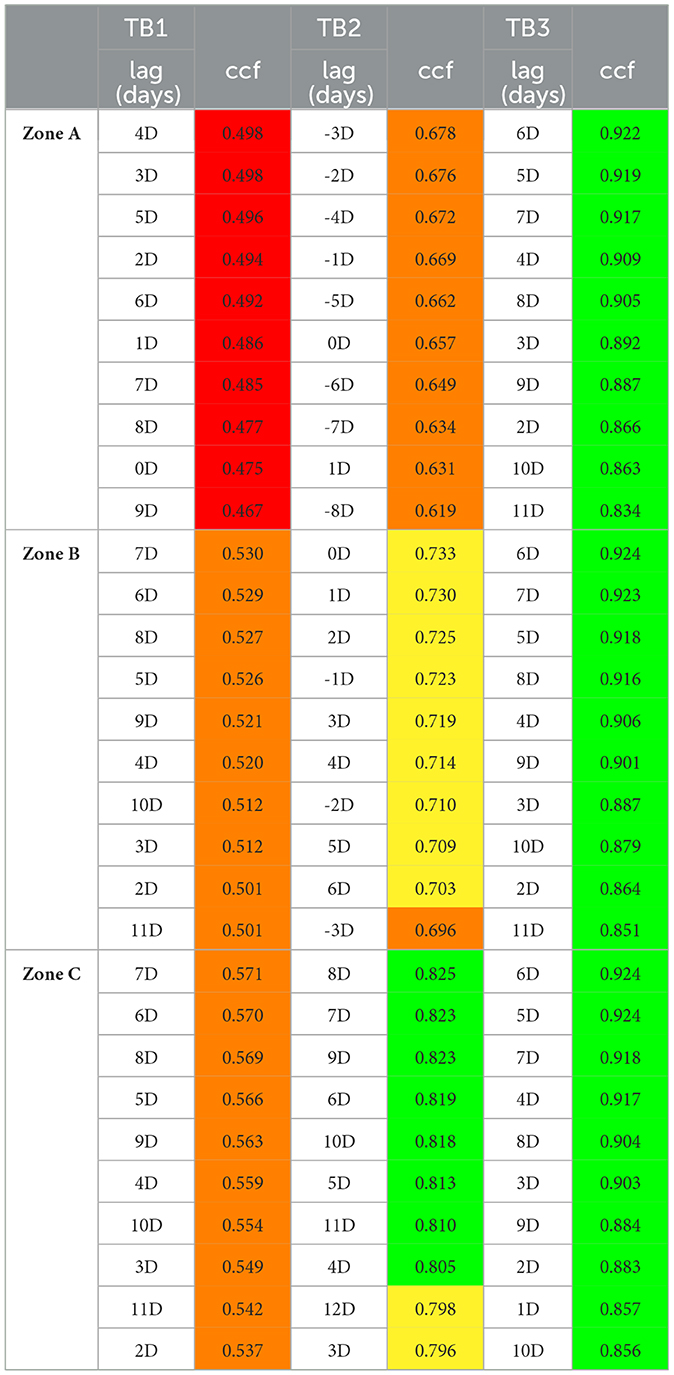
Table 1. Results of the cross-correlation factor (CCF) analysis for the combinations between the defined study zones (ZA, ZB, ZC) and the different time blocks (TB1, TB2, TB3).
4 Discussion
This study reinforces the value of wastewater monitoring as a surveillance tool, particularly in urban settings. The significant time lags observed indicate that wastewater monitoring can provide early warnings of infection spikes, enabling proactive public health responses. While this study focused on a single sampling site, the surrounding population ranges from 8,000 to 43,000 inhabitants, depending on the zone (A, B, C) analyzed. This is a strategic location, as it serves as a wastewater collection point for the surrounding neighborhoods. Due to these characteristics, the study assumes high local representativeness, but expanding the sampling network to increase coverage and reliability could improve the representativeness of Mexico City.
It should be noted that a formal power analysis was not performed due to the lack of standardized methods for estimating power in time-lagged WBE studies of SARS-CoV-2 viral RNA concentrations at the time of sampling. This work should be considered an exploratory analysis demonstrating the feasibility of detecting temporal correlations between SARS-CoV-2 N1 gene quantifications in wastewater and reported infections in a specific urban context. Future work would benefit from larger sample sizes and power calculations based on the effect sizes and time lags observed here. Furthermore, the detection of SARS-CoV-2 RNA in wastewater only reflects the presence of genomic material and does not guarantee viral viability (59–61). Therefore, the observed peaks should be interpreted as a population indicator of epidemiological trends useful for monitoring but not as a direct measure of the risk of community transmission.
To address missing data from dates without sample collection or reported cases, data interpolation was performed for both datasets. A higher number of interpolated values were required for wastewater samples, though an expected trend of genome count fluctuations was observed. Additionally, data smoothing was applied to reduce noise and facilitate subsequent analysis, ensuring the identification of generalizable patterns within the model's variable constraints.
To conduct an exploratory graphical analysis of the potential temporal relationship between both datasets, a scatter plot analysis was performed. This involved shifting the genome count data by one-day increments relative to the number of reported cases, within a time-lag window ranging from 14 days before to 5 days after. The analysis was carried out using the complete dataset from both sampling periods combined (TB1) and separately for each sampling period (TB2 and TB3). As it was previously mentioned, a cross-correlation analysis was performed. In all cases, the cross-correlation factor (CCF) is higher for TB2 and TB3, that is, when the sampling seasons are analyzed separately. It is also greater for Zone C, which corresponds to the sum of infection cases reported in Proximity Levels 1, 2, and 3. Additionally, the time lags with the highest CCF values correspond to the scatter plots with the steepest slopes. This suggests that the relationship improves when analyzing time periods with better representativity of sampled days and a higher number of reported cases. Therefore, these two parameters were continuously refined to enhance the proposed model.
For TB2 (April 2021 to September 2021), the highest CCF (0.823 to 0.825) corresponds to a lag of 7 to 9 days before the reported cases in the population. In contrast, for TB3 (November 2021 to February 2022), the highest CCF (0.918 to 0.924) corresponds to a lag of 5 to 7 days before the reported cases. As it was shown in the Results section, these time windows align with the steepest slopes in the previous exploratory graphical analysis, indicating the period before detection through direct epidemiological evaluation in the population.
One of the first studies conducted to evaluate the correlation between the presence of SARS-CoV-2 genomes in wastewater and reported cases in the population analyzed data from treatment plants in six cities and an airport in the Netherlands. It found the presence of viral particles 7 to 9 days in advance using RT-qPCR (56). Another study evaluating 32 treatment plants in Catalonia, Spain, detected viral genomes 7 days in advance. It also assessed different population sizes and models, concluding that understanding population dynamics can lead to a more accurate predictive model (57). In a separate study that collected a total of 1,101 samples from various treatment plants and sewer systems in Paris, France, it was found that SARS-CoV-2 genomes could be detected 3 to 4 days in advance, particularly in populations with limited mobility. The variation in detection also depended significantly on the time of sample collection mainly due to the different dynamics of population behavior (62, 63).
A more recent study conducted in Xàtiva, in the province of Valencia, reported predictive windows of 15 to 17 days using different models and hospitalization data. This was facilitated by a more established local sampling strategy and a well-documented population dynamic (64). Meanwhile, another study in Yamanashi Prefecture, Japan, reported a predictive window ranging from 3 to 9 days (58).
It is important to note that some longitudinal studies indicate that a proportion of those infected shed SARS-CoV-2 RNA in feces days before the onset of symptoms, but shedding can also last several weeks, so the exact magnitude of this presymptomatic phase varies between populations and viral lineages (65–67). Therefore, inference of time lags from WBE should be interpreted with caution due to this uncertainty, and the set-up of a monitoring system should consider these issues (61, 68).
A key aspect of this study was the selection of populations associated with the sampling points. This was done by integrating information on drainage systems with population sizes linked to postal codes, defining an area of influence around the selected collection point. This approach allowed for the delineation of reported infection data corresponding to the sampling site. This is particularly important because infection dynamics may differ in other areas, and including additional populations could increase variability in the model, making it less robust.
All these findings indicate that predictive time windows can vary across different locations depending on the population and site context. The inclusion of intrinsic variables related to the population's dynamics, along with a detailed understanding of wastewater characteristics and additional health system data, could help refine these predictive models. In the case of this study, the determination of the geographic area and, consequently, the study population was appropriate; however, incorporating a parameter to normalize the size population size associated with each sample could help reduce result variability if applied correctly. Therefore, it is recommended to explore measurement strategies such as genes associated with Pepper mild mottle virus (PMMoV) or physicochemical parameters like chemical oxygen demand (COD) or different nitrogenous compounds to include them as part of the analysis process (69–72).
5 Conclusions
The findings of this study highlight the effectiveness of wastewater-based epidemiology as a viable tool for monitoring SARS-CoV-2 infection trends at the community level.
The optimized RT-qPCR method for quantifying the N1 gene of SARS-CoV-2 reported in this study has a detection limit of 10 copies/μL with a runtime of 30 to 35 min using separately available reagents. Additionally, it can be optimized for even smaller volumes or adapted to different enzyme brands if necessary. This makes it a viable alternative to commercial test kits, which can be more expensive or have limited availability.
The various sample processing methods used for detecting SARS-CoV-2, along with inherent variations in population behavior, contribute to variability in the results. Despite this, the raw data suggest that infection trends in the target population–both increases and decreases–can be tracked using this direct wastewater monitoring method integrating information on drainage systems with local population size. Even with a relatively small number of samples, this approach demonstrates effectiveness compared to traditional epidemiological monitoring methods, however, incorporating a method to normalize population size would be necessary to further improve the model.
When comparing the genome count data for the N1 gene with reported infection data, the application of computational methods for data interpolation on missing dates, along with data smoothing using the central simple moving average technique, revealed a time lag of 5 to 9 days. Additionally, a cross-correlation factor ranging from 0.825 to 0.924 was observed between the genome detection curves and reported infection curves. This lag can serve as an early warning for infections in monitored populations, allowing for the implementation of public health contingency measures if needed.
The method presented here can be replicated in other populations, provided that sampling points in the sewage system are carefully selected. Combined with a well-planned collection schedule, this approach can help validate and improve the proposed model.
Both the sample processing techniques and computational analysis methods can be further refined through continuous feedback, which would enhance the effectiveness of the proposed monitoring system.
In conclusion, we have shown how WBE offers a viable approach for monitoring SARS-CoV-2 and potentially other pathogens. Future research should integrate more variables, such as mobility patterns and climatic factors, to refine predictive models and enhance public health interventions.
Data availability statement
The datasets presented in this study can be found in online repositories. The names of the repository/repositories and accession number(s) can be found at: https://github.com/miguelatlsm/EpiCovid_MexicoCity.
Author contributions
MS-M: Conceptualization, Data curation, Investigation, Validation, Writing – original draft, Writing – review & editing. MM-H: Funding acquisition, Methodology, Project administration, Resources, Supervision, Writing – review & editing. AN: Funding acquisition, Investigation, Methodology, Supervision, Writing – review & editing. AE-G: Data curation, Methodology, Supervision, Writing – review & editing. GA-J: Conceptualization, Formal analysis, Methodology, Software, Supervision, Visualization, Writing – review & editing. EH-L: Conceptualization, Formal analysis, Funding acquisition, Investigation, Methodology, Project administration, Supervision, Writing – original draft, Writing – review & editing.
Funding
The author(s) declare that financial support was received for the research and/or publication of this article. This work was supported by funding from the Secretariat of Education, Science, Technology and Innovation of Mexico City (SECTEI), through the project “The Chinampera Label as a Promoter of Economic and Nutritional Strengthening and the Integral Restoration of the Lacustrine Zone of Xochimilco through the Chinampa-Refugio Model” (Project No. SECTEI/258/2019); the project “Analysis of the Effectiveness in the Removal of Pathogens in Effluents and Sludge from Wastewater Treatment Plants in Mexico City for Safe Reuse Purposes” (Project No. SECTEI/9241C19); and the project “Surveillance System in Wastewater Treatment Plants for SARS-CoV-2 in Mexico City and San Francisco,” supported by the UCMX–InnovaUNAM Alliance (2021–2022).
Acknowledgments
The authors gratefully acknowledge the Universidad Nacional Autónoma de México (UNAM) for providing the institutional resources and laboratory facilities that enabled the experimental work. The authors also thank the Sistema de Aguas de la Ciudad de México (SACMEX) for granting the sampling permits and for providing logistical support in the field. Special appreciation is extended to Dr. Daniel de los Cobos Vasconcelos of the Instituto de Ingeniería, UNAM, for his valuable insights and constructive feedback on the project. EH-L and GA-J are grateful for the academic support given by the Centro de Ciencias de la Complejidad at the Universidad Nacional Autónoma de México.
Conflict of interest
The authors declare that the research was conducted in the absence of any commercial or financial relationships that could be construed as a potential conflict of interest.
Generative AI statement
The author(s) declare that no Gen AI was used in the creation of this manuscript.
Publisher's note
All claims expressed in this article are solely those of the authors and do not necessarily represent those of their affiliated organizations, or those of the publisher, the editors and the reviewers. Any product that may be evaluated in this article, or claim that may be made by its manufacturer, is not guaranteed or endorsed by the publisher.
Supplementary material
The Supplementary Material for this article can be found online at: https://www.frontiersin.org/articles/10.3389/fpubh.2025.1640581/full#supplementary-material
References
1. McArthur DB. Emerging infectious diseases. Nurs Clin North Am. (2019) 54:297. doi: 10.1016/j.cnur.2019.02.006
2. Chala B, Hamde F. Emerging and re-emerging vector-borne infectious diseases and the challenges for control: a review. Front Public Health. (2021) 9:715759. doi: 10.3389/fpubh.2021.715759
3. Lodge EK, Schatz AM, Drake JM. Protective population behavior change in outbreaks of emerging infectious disease. BMC Infect Dis. (2021) 21:1–7. doi: 10.1186/s12879-021-06299-x
4. Barouki R, Kogevinas M, Audouze K, Belesova K, Bergman A, Birnbaum L, et al. The COVID-19 pandemic and global environmental change: emerging research needs. Environ Int. (2021) 146:106272. doi: 10.1016/j.envint.2020.106272
5. Gebru AA, Birhanu T, Wendimu E, Ayalew AF, Mulat S, Abasimel HZ, et al. Global burden of COVID-19: situational analysis and review. Hum Antibodies. (2021) 29:139–48. doi: 10.3233/HAB-200420
6. Labgold K, Hamid S, Shah S, Gandhi NR, Chamberlain A, Khan F, et al. Estimating the unknown: greater racial and ethnic disparities in COVID-19 burden after accounting for missing race and ethnicity data. Epidemiology. (2021) 32:157–61. doi: 10.1097/EDE.0000000000001314
7. Azzopardi PS, Kerr JA, Francis KL, Sawyer SM, Cini KI, Patton GC, et al. The unfinished agenda of communicable diseases among children and adolescents before the COVID-19 pandemic, 1990-2019: a systematic analysis of the Global Burden of Disease Study 2019. Lancet. (2023) 402:313–35. doi: 10.1016/S0140-6736(23)00860-7
8. Kramer V, Papazova I, Thoma A, Kunz M, Falkai P, Schneider-Axmann T, et al. Subjective burden and perspectives of German healthcare workers during the COVID-19 pandemic. Eur Arch Psychiatry Clin Neurosci. (2021) 271:271–81. doi: 10.1007/s00406-020-01183-2
9. Richards F, Kodjamanova P, Chen X, Li N, Atanasov P, Bennetts L, et al. Economic burden of COVID-19: a systematic review. Clinicoecon Outcomes Res. (2022) 14:293–307. doi: 10.2147/CEOR.S338225
10. Dahal S, Banda JM, Bento AI, Mizumoto K, Chowell G. Characterizing all-cause excess mortality patterns during COVID-19 pandemic in Mexico. BMC Infect Dis. (2021) 21:432. doi: 10.1186/s12879-021-06122-7
11. Fernández-Rojas MA, Luna-Ruiz Esparza MA, Campos-Romero A, Calva-Espinosa DY, Moreno-Camacho JL, Langle-Martínez AP, et al. Epidemiology of COVID-19 in Mexico: symptomatic profiles and presymptomatic people. Int J Infect Dis. (2021) 104:572–9. doi: 10.1016/j.ijid.2020.12.086
12. de Anda-Jáuregui G, García-García L, Hernández-Lemus E. Modular reactivation of Mexico City after COVID-19 lockdown. BMC Public Health. (2022) 22:961. doi: 10.1186/s12889-022-13183-z
13. López-Cuevas JA, Martínez-García M, Hernández-Lemus E, Anda-Jáuregui Gd. Exploring disparities and novel insights into metabolic and cardiovascular comorbidities among COVID-19 patients in Mexico. Front Public Health. (2023) 11:1270404. doi: 10.3389/fpubh.2023.1270404
14. Vallejo M, Gutiérrez-Esparza G, Ríos-Núñez L, Altamira-Mendoza R, Groves-Miralrio LE, Hernández-Lemus E, et al. Social, demographic and morbimortality characteristics of the cases treated for COVID-19 at the Ignacio Chávez National Institute of Cardiology. A descriptive cross-sectional study. Arch Cardiol Mex. (2023) 93(Suppl. 6):7586. doi: 10.24875/ACM.22000095
15. Segura-García S, Barrera-Ramírez A, Gutiérrez-Esparza GO, Groves-Miralrio E, Martínez-García M, Hernández-Lemus E. Effects of social confinement during the first wave of COVID-19 in Mexico City. Front Public Health. (2023) 11:1202202. doi: 10.3389/fpubh.2023.1202202
16. de Anda-Jáuregui G, Gómez-Romero L, Cañas S, Campos-Romero A, Alcántar-Fernández J, Cedro-Tanda A. COVID-19 reinfections in Mexico City: implications for public health. Front Public Health. (2024) 11:1321283. doi: 10.3389/fpubh.2023.1321283
17. Bogler A, Gross A, Ronen A, Weisbrod N, Nir O, Gillor O, et al. Rethinking wastewater risks and monitoring in light of the COVID-19 pandemic. Nat Sustain. (2020) 3:981–90. doi: 10.1038/s41893-020-00605-2
18. Hillary LS, Malham SK, McDonald JE, Jones DL. Wastewater and public health: the potential of wastewater surveillance for monitoring COVID-19. Curr Opin Environ Sci Health. (2020) 17:14–20. doi: 10.1016/j.coesh.2020.06.001
19. McMahan CS, Self S, Rennert L, Kalbaugh C, Kriebel D, Graves D, et al. COVID-19 wastewater epidemiology: a model to estimate infected populations. Lancet Planet Health. (2021) 5:e874–81. doi: 10.1016/S2542-5196(21)00230-8
20. Pulicharla R, Kaur G, Brar SK. A year into the COVID-19 pandemic: rethinking of wastewater monitoring as a preemptive approach. J Environ Chem Eng. (2021) 9:106063. doi: 10.1016/j.jece.2021.106063
21. Sharara N, Endo N, Duvallet C, Ghaeli N, Matus M, Heussner J, et al. Wastewater network infrastructure in public health: applications and learnings from the COVID-19 pandemic. PLoS Global Public Health. (2021) 1:e0000061. doi: 10.1371/journal.pgph.0000061
22. Randazzo W, Cuevas-Ferrando E. Sanjuán R, Domingo-Calap P, Sánchez G. Metropolitan wastewater analysis for COVID-19 epidemiological surveillance. Int J Hyg Environ Health. (2020) 230:113621. doi: 10.1016/j.ijheh.2020.113621
23. Shrestha S, Yoshinaga E, Chapagain SK, Mohan G, Gasparatos A, Fukushi K. Wastewater-based epidemiology for cost-effective mass surveillance of COVID-19 in low-and middle-income countries: challenges and opportunities. Water. (2021) 13:2897. doi: 10.3390/w13202897
24. Ali S, Gudina EK, Gize A, Aliy A, Adankie BT, Tsegaye W, et al. Community wastewater-based surveillance can be a cost-effective approach to track COVID-19 outbreak in low-resource settings: feasibility assessment for Ethiopia context. Int J Environ Res Public Health. (2022) 19:8515. doi: 10.3390/ijerph19148515
25. Hart OE, Halden RU. Computational analysis of SARS-CoV-2/COVID-19 surveillance by wastewater-based epidemiology locally and globally: feasibility, economy, opportunities and challenges. Sci Total Environ. (2020) 730:138875. doi: 10.1016/j.scitotenv.2020.138875
26. Naughton CC, Roman FA, Jr Alvarado AGF, Tariqi AQ, Deeming MA, Kadonsky KF, et al. Show us the data: global COVID-19 wastewater monitoring efforts, equity, and gaps. FEMS Microbes. (2023) 4:xtad003. doi: 10.1093/femsmc/xtad003
27. Schmitz BW, Innes GK, Prasek SM, Betancourt WQ, Stark ER, Foster AR, et al. Enumerating asymptomatic COVID-19 cases and estimating SARS-CoV-2 fecal shedding rates via wastewater-based epidemiology. Sci Total Environ. (2021) 801:149794. doi: 10.1016/j.scitotenv.2021.149794
28. Wannigama DL, Amarasiri M, Hurst C, Phattharapornjaroen P, Abe S, Hongsing P, et al. Tracking COVID-19 with wastewater to understand asymptomatic transmission. Int J Infect Dis. (2021) 108:296–9. doi: 10.1016/j.ijid.2021.05.005
29. Fernandez-Cassi X, Scheidegger A, Bänziger C, Cariti F, Tuñas Corzon A, Ganesanandamoorthy P, et al. Wastewater monitoring outperforms case numbers as a tool to track COVID-19 incidence dynamics when test positivity rates are high. Water Res. (2021) 200:117252. doi: 10.1016/j.watres.2021.117252
30. Jahn K, Dreifuss D, Topolsky I, Kull A, Ganesanandamoorthy P, Fernandez-Cassi X, et al. Early detection and surveillance of SARS-CoV-2 genomic variants in wastewater using COJAC. Nat Microbiol. (2022) 7:1151–60. doi: 10.1038/s41564-022-01185-x
31. Karthikeyan S, Levy JI, De Hoff P, Humphrey G, Birmingham A, Jepsen K, et al. Wastewater sequencing reveals early cryptic SARS-CoV-2 variant transmission. Nature. (2022) 609:101–8. doi: 10.1038/s41586-022-05049-6
32. Yousif M, Rachida S, Taukobong S, Ndlovu N, Iwu-Jaja C, Howard W, et al. SARS-CoV-2 genomic surveillance in wastewater as a model for monitoring evolution of endemic viruses. Nat Commun. (2023) 14:6131. doi: 10.1038/s41467-023-41369-5
33. Pilapil JD, Notarte KI, Yeung KL. The dominance of co-circulating SARS-CoV-2 variants in wastewater. Int J Hyg Environ Health. (2023) 253:114224. doi: 10.1016/j.ijheh.2023.114224
34. Daughton CG. Wastewater surveillance for population-wide COVID-19: the present and future. Sci Total Environ. (2020) 736:139631. doi: 10.1016/j.scitotenv.2020.139631
35. Gahlot P, Alley KD, Arora S, Das S, Nag A, Tyagi VK. Wastewater surveillance could serve as a pandemic early warning system for COVID-19 and beyond. Wiley Interdisciplinary Reviews. (2023) 10:e1650. doi: 10.1002/wat2.1650
36. Fowler Z, Moeller E, Roa L, Castañeda-Alcántara ID, Uribe-Leitz T, Meara JG, et al. Projected impact of COVID-19 mitigation strategies on hospital services in the Mexico City Metropolitan area. PLoS ONE. (2020) 15:e0241954. doi: 10.1371/journal.pone.0241954
37. Sifuentes-Osornio J, Angulo-Guerrero O, De Anda-Jáuregui G, Díaz-De-León-Santiago JL, Hernández-Lemus E, Benítez-Pérez H, et al. Probability of hospitalisation and death among COVID-19 patients with comorbidity during outbreaks occurring in Mexico City. J Glob Health. (2022) 12:05038. doi: 10.7189/jogh.12.05038
38. Instituto Nacional de Estadística y Geografía. Censo de Población y Vivienda 2020. Ciudad de México: Resultados definitivos por alcaldía (2021). Available online at: https://www.inegi.org.mx/programas/ccpv/2020/default.html#Tabulados
39. Moyroud N, Portet F. Introduction to QGIS. In: QGIS and Generic Tools. London: Wiley-ISTE (2018). p. 1–17. doi: 10.1002/9781119457091.ch1
40. Sims N, Kasprzyk-Hordern B. Future perspectives of wastewater-based epidemiology: monitoring infectious disease spread and resistance to the community level. Environ Int. (2020) 139:105689. doi: 10.1016/j.envint.2020.105689
41. Sapula SA, Whittall JJ, Pandopulos AJ, Gerber C, Venter H. An optimized and robust PEG precipitation method for detection of SARS-CoV-2 in wastewater. Sci Total Environ. (2021) 785:147270. doi: 10.1016/j.scitotenv.2021.147270
42. Farkas K, Hillary LS, Thorpe J, Walker DI, Lowther JA, McDonald JE, et al. Concentration and quantification of SARS-CoV-2 RNA in wastewater using polyethylene glycol-based concentration and qRT-PCR. Methods Protoc. (2021) 4:17. doi: 10.3390/mps4010017
43. Oyervides-Muñoz MA, Aguayo-Acosta A, de Los Cobos-Vasconcelos D, Carrillo-Reyes J, Espinosa-García AC, Campos E, et al. Inter-institutional laboratory standardization for SARS-CoV-2 surveillance through wastewater-based epidemiology applied to Mexico City. IJID Regions. (2024) 12:100429. doi: 10.1016/j.ijregi.2024.100429
44. Wozniak A, Cerda A, Ibarra-Henríquez C, Sebastian V, Armijo G, Lamig L, et al. A simple RNA preparation method for SARS-CoV-2 detection by RT-qPCR. Sci Rep. (2020) 10:16608. doi: 10.1038/s41598-020-73616-w
45. Nelson BK. Time series analysis using autoregressive integrated moving average (ARIMA) models. Acad Emerg Med. (1998) 5:739–44. doi: 10.1111/j.1553-2712.1998.tb02493.x
46. Johnston F, Boyland JE, Meadows M, Shale E. Some properties of a simple moving average when applied to forecasting a time series. J Oper Res Soc. (1999) 50:1267–71. doi: 10.1057/palgrave.jors.2600823
47. Alessio E, Carbone A, Castelli G, Frappietro V. Second-order moving average and scaling of stochastic time series. Eur Phys J B. (2002) 27:197–200. doi: 10.1140/epjb/e20020150
48. Vio R, Wamsteker W. Limits of the cross-correlation function in the analysis of short time series. Publ Astron Soc Pac. (2001) 113:86. doi: 10.1086/317967
49. Olden JD, Neff BD. Cross-correlation bias in lag analysis of aquatic time series. Mar Biol. (2001) 138:1063–70. doi: 10.1007/s002270000517
50. Rehfeld K, Marwan N, Heitzig J, Kurths J. Comparison of correlation analysis techniques for irregularly sampled time series. Nonlinear Process Geophys. (2011) 18:389–404. doi: 10.5194/npg-18-389-2011
51. Hallin M, Puri ML. Rank tests for time series analysis: a survey. IMA Volumes in Mathematics and its Applications. (1992) 45:111–111.
52. Kosiorowski D, Rydlewski JP, Snarska M. Detecting a structural change in functional time series using local Wilcoxon statistic. Stat Pap. (2019) 60:1677–98. doi: 10.1007/s00362-017-0891-y
53. Du L, Gao R, Suganthan PN, Wang DZ. Bayesian optimization based dynamic ensemble for time series forecasting. Inf Sci. (2022) 591:155–75. doi: 10.1016/j.ins.2022.01.010
56. Medema G, Heijnen L, Elsinga G, Italiaander R, Brouwer A. Presence of SARS-Coronavirus-2 RNA in sewage and correlation with reported COVID-19 prevalence in the early stage of the epidemic in the Netherlands. Environ Sci Technol Lett. (2020) 7:511–6. doi: 10.1021/acs.estlett.0c00357
57. Joseph-Duran B, Serra-Compte A, Sàrrias M, Gonzalez S, López D, Prats C, et al. Assessing wastewater-based epidemiology for the prediction of SARS-CoV-2 incidence in Catalonia. Sci. Rep. (2022) 12:15073. doi: 10.1038/s41598-022-18518-9
58. Shrestha S, Malla B, Angga MS, Sthapit N, Raya S, Hirai S, et al. Long-term SARS-CoV-2 surveillance in wastewater and estimation of COVID-19 cases: an application of wastewater-based epidemiology. Sci Total Environ. (2023) 896:165270. doi: 10.1016/j.scitotenv.2023.165270
59. Bivins A, Kaya D, Ahmed W, Brown J, Butler C, Greaves J, et al. Passive sampling to scale wastewater surveillance of infectious disease: lessons learned from COVID-19. Sci Total Environ. (2022) 835:155347. doi: 10.1016/j.scitotenv.2022.155347
60. Buonerba A, Bastianini A, Capunzo M. A critical review on SARS-CoV-2 infectivity in water and wastewater: what do we know? Sci Total Environ. (2021) 774:145721. doi: 10.1016/j.scitotenv.2021.145721
61. Phan T, Brozak S, Pell B, Ciupe SM, Ke R, Ribeiro RM, et al. Post-recovery viral shedding shapes wastewater-based epidemiological inferences. Commun Med. (2025) 5:193. doi: 10.1038/s43856-025-00908-5
62. Wurtzer S, Waldman P, Levert M, Cluzel N, Almayrac JL, Charpentier C, et al. SARS-CoV-2 genome quantification in wastewaters at regional and city scale allows precise monitoring of the whole outbreaks dynamics and variants spreading in the population. Sci Total Environ. (2022) 810:152213. doi: 10.1016/j.scitotenv.2021.152213
63. Mendoza Grijalva L, Brown B, Cauble A, Tarpeh WA. Diurnal variability of SARS-CoV-2 RNA concentrations in hourly grab samples of wastewater influent during low COVID-19 incidence. ACS ES&T Water. (2022) 2:2125–33. doi: 10.1021/acsestwater.2c00061
64. López-Peñalver RS, Cañas-Cañas R, Casaña-Mohedo J, Benavent-Cervera JV, Fernández-Garrido J, Juárez-Vela R, et al. Predictive potential of SARS-CoV-2 RNA concentration in wastewater to assess the dynamics of COVID-19 clinical outcomes and infections. Sci Total Environ. (2023) 886:163935. doi: 10.1016/j.scitotenv.2023.163935
65. Miura F, Kitajima M, Omori R. Duration of SARS-CoV-2 viral shedding in faeces as a parameter for wastewater-based epidemiology: re-analysis using a shedding dynamics model. Sci Total Environ. (2021) 769:144549. doi: 10.1016/j.scitotenv.2020.144549
66. Killingley B, Mann AJ, Kalinova M, Boyers A, Goonawardane N, Zhou J, et al. Safety, tolerability and viral kinetics during SARS-CoV-2 human challenge in young adults. Nat Med. (2022) 28:1031–41. doi: 10.1038/s41591-022-01780-9
67. Arts PJ, Kelly JD, Midgley CM, Anglin K, Lu S, Abedi GR, et al. Longitudinal and quantitative faecal shedding dynamics of SARS-CoV-2, pepper mild mottle virus, and crAssphage. mSphere. (2023) 8:e00132–23. doi: 10.1128/msphere.00132-23
68. Li L, Haak L, Carine M, Pagilla KR. Temporal assessment of SARS-CoV-2 detection in wastewater and its epidemiological implications in COVID-19 case dynamics. Water Res. (2023) 233:120372. doi: 10.2139/ssrn.4604353
69. Bivins A, North D, Wu Z, Shaffer M, Ahmed W, Bibby K. Within- and between-day variability of SARS-CoV-2 RNA in municipal wastewater during periods of varying COVID-19 prevalence and positivity. ACS ES&T Water. (2021) 1:2097–108. doi: 10.1021/acsestwater.1c00178
70. Maal-Bared R, Qiu Y, Li Q, Gao T, Hrudey SE, Bhavanam S, et al. Does normalization of SARS-CoV-2 concentrations by Pepper Mild Mottle Virus improve correlations and lead time between wastewater surveillance and clinical data in Alberta (Canada): comparing twelve SARS-CoV-2 normalization approaches. Sci Total Environ. (2023) 856:158964. doi: 10.1016/j.scitotenv.2022.158964
71. Bello-García O, Magaña-Alemán F, Hernández R. Hydrological and physicochemical parameters associated with SARS-CoV-2 and pepper mild mottle virus loads in urban wastewater. J Water Health. (2024) 23:413–25. doi: 10.2166/wh.2025.352
Keywords: waste-water based epidemiology, COVID-19, SARS-CoV2, temporal dynamics, predictive models, early signals
Citation: Silva-Magaña MA, Mazari-Hiriart M, Noyola A, Espinosa-García AC, de Anda-Jáuregui G and Hernández-Lemus E (2025) Temporal dynamics of SARS-CoV-2 detection in wastewater and population infection trends in Mexico City. Front. Public Health 13:1640581. doi: 10.3389/fpubh.2025.1640581
Received: 03 June 2025; Accepted: 23 July 2025;
Published: 14 August 2025.
Edited by:
Severino Jefferson Ribeiro Da Silva, University of Toronto, CanadaReviewed by:
Kin Israel Notarte, Johns Hopkins University, United StatesTin Phan, Los Alamos National Laboratory (DOE), United States
Copyright © 2025 Silva-Magaña, Mazari-Hiriart, Noyola, Espinosa-García, de Anda-Jáuregui and Hernández-Lemus. This is an open-access article distributed under the terms of the Creative Commons Attribution License (CC BY). The use, distribution or reproduction in other forums is permitted, provided the original author(s) and the copyright owner(s) are credited and that the original publication in this journal is cited, in accordance with accepted academic practice. No use, distribution or reproduction is permitted which does not comply with these terms.
*Correspondence: Enrique Hernández-Lemus, ZWhlcm5hbmRlekBpbm1lZ2VuLmdvYi5teA==; Guillermo de Anda-Jáuregui, Z2RlYW5kYUBpbm1lZ2VuLmVkdS5teA==