 Marina Piacenti-Silva1*
 Samuel de Mattos Alves2
 Hulder Henrique Zaparoli1*
 Marcela de Oliveira1
 Juliano Morimoto3,4
 Carolina L. Zilli Vieira5*
- 1Department of Physics and Meteorology, School of Sciences, São Paulo State University–UNESP, Bauru, São Paulo, Brazil
- 2Institute of Biosciences of Botucatu, São Paulo State University–UNESP, Botucatu, São Paulo, Brazil
- 3Institute of Mathematics, University of Aberdeen, King’s College, Aberdeen, United Kingdom
- 4Graduate Program in Ecology and Conservation (PPGECO), Universidade Federal do Paraná, Curitiba, Brazil
- 5Department of Environmental Health, Harvard T.H. Chan School of Public Health, Boston, MA, United States
Introduction: Light plays a key role in regulating circadian rhythms and downstream physiological and behavioural functions. However, excessive exposure to artificial blue light (450–500 nm) can disrupt sleep, metabolism and neural integrity. Visual opsins mediate light-dependent signalling, but organisms also express non-visual opsins whose roles in blue-light-induced neural stress are not well understood.
Methods: We used Drosophila melanogaster knockout lines lacking either visual rhodopsin 1 (Rh11) or non-visual rhodopsin 7 (Rh71), alongside wild-type (w1118) controls. Flies were continuously exposed to 488 nm blue light (1,320 lux; 1,120 μW·cm−2) from egg deposition until they were 20 days old. DNA damage (γ-H2Av immunostaining) and vacuole formation were quantified in brain regions associated with sensory processing and neurotransmission.
Results: Rh11 flies exhibited the highest levels of DNA damage and vacuolisation compared to the w1118 and Rh71 lines. These effects were most pronounced in neuropils linked to sensory integration and synaptic activity.
Discussion: Our findings demonstrate that the visual opsin Rh1 plays a predominant role in blue-light-induced DNA damage and neurodegeneration in the Drosophila central nervous system. This suggests that it is visual, rather than non-visual, opsins that mediate the neurotoxic effects of exposure to artificial light.
1 Introduction
Light is an environmental stimulus of primary importance to all forms of life, playing a fundamental role in the regulation of circadian rhythms and influencing a wide range of physiological and behavioral functions in living organisms (1, 2). However, with the increasing use of electronic devices, human exposure to light has increased significantly. For many people, this means that overall exposure to light from electronic devices can now total 8–10 h a day versus 3–5 h in earlier decades (3). The evening period is particularly critical because many people now extend their device use well into the hours before sleep, which significantly increases exposure to blue-enriched light (4–9).
Blue light is a high energy electromagnetic radiation in the wavelength range of 380–500 nm, known to be able to penetrate ocular tissues and reach the retina and deeper brain regions (10). Modern electronic devices such as smartphones, tablets, and laptops emit blue light with spectral peaks between 445 and 455 nm. Peak irradiance at 450 nm reaches up to 0.00526 mW/cm2 on laptops and 0.00102 mW/cm2 on smartphones under typical usage conditions—levels that, while below sunlight intensity, raise concerns about cumulative exposure and its long-term effects on ocular and neural health (11). In humans, prolonged exposure to blue light has been associated with retinal phototoxicity, circadian rhythm disruption, and neurodegeneration (12–14). Evidence from experimental and clinical studies suggests that even moderate levels of artificial light exposure (100–1,000 lux), especially in the evening, can suppress melatonin production, disrupt sleep and other biological processes controlled by the body’s circadian clock, and cause adverse effects, including mental disorders such as depression, anxiety, bipolar disorder and self-mutilation (15), and metabolic disorders such as cardiovascular disease and cancer (4–9, 16).
Although direct evidence in humans remains limited, these findings in animal models underscore the need to better understand the biological consequences of chronic blue light exposure. Prolonged exposure to blue light can induce early puberty in male rats, suppress spermatogenesis, and impair testicular integrity (17), highlighting the broader physiological effects of light exposure. Studies in both cell culture and animal models have also shown that blue light can accelerate aging, significantly reduce lifespan, and promote molecular stress responses in neural tissues, including oxidative stress and DNA damage (9, 14, 18).
The main photoreceptor shared between invertebrates and mammals are opsins, photosensitive membrane proteins associated with a chromophore, that change conformation from a resting state to a signaling state during the phototransduction process after the absorption of a photon (19, 20). In humans, rod photoreceptors contain rhodopsin (OPN2), which is responsible for twilight vision, while cone photoreceptors contain opsins (OPN1), which are responsible for daytime vision and can be divided into four subgroups according to their absorption spectra: long (LW or red), short 1 (SW1 or UV/violet), short 2 (SW2 or blue) and medium (MW) (20, 21). In addition to the visual opsins, animals also express non-visual opsins such as melanopsins (Opn4); encephalopsins or panopsins (Opn3); neuropsins (Opn5) and the retinal photoisomerase G protein-coupled receptor (RGR) (20, 22–24). These non-visual opsins are present in several structures besides the retina, including the brain, testicles, liver, skin, spinal cord and lungs, suggesting an extra-retinal photomodulation (22). Drosophila has seven opsin genes (Rh1, Rh2, Rh3, Rh4, Rh5, Rh6 and Rh7) (20, 25), which encode their corresponding proteins (rhodopsins). Rh1’s predominant expression in the outer photoreceptors occurs directly when exposed to environmental light (26). In contrast, Rh7 is expressed in the central brain, particularly in circadian pacemaker neurons, and has been proposed to mediate non-visual responses to light (27). However, its role in light-induced neurodegeneration remains poorly understood.
Studies in animals with ablated eyes or retinal degeneration show that physiological responses to light—such as pupillary reflexes, adjustments in circadian rhythms, early mortality and brain neurodegeneration (remain when the light source is removed), raising questions about the mechanisms of light perception in the organism (9, 18, 22, 28–30).
Advancements in the field have revealed the involvement of non-visual opsins in a variety of physiological functions, including the regulation of circadian rhythms (31), hormonal secretion (32), thermoregulation (33), and neuronal activity (34). For instance, Opn4 plays a central role in circadian entrainment through light detection in retinal ganglion cells; however, its expression in other tissues suggests the presence of additional functions (35). A similar observation has been made with Opn3 and Opn5, which have been implicated in metabolic regulation and neuroendocrine signaling (33, 36). The precise phototransduction mechanisms of these opsins in extra-retinal tissues remain to be elucidated; however, experimental models have demonstrated that these proteins can respond to light stimuli, even in the absence of ocular input, thereby supporting the hypothesis of peripheral light sensing (37). However, the mechanisms through which these non-visual opsins, particularly in invertebrate models, contribute to the physiological effects of light exposure, especially in the context of neurodegeneration, remain to be elucidated.
Animal models such as the Drosophila melanogaster fly have been used to investigate the role of different opsins due to functional homology with human photoreceptive cells (9, 38). of which we highlight two main ones: rhodopsin 1 (Rh1), encoded by the ninaE gene, present in the outer photoreceptor cells of the eye and orthologous to human OPN4 (39), and rhodopsin 7 (Rh7), present in the central brain in a subset of circadian pacemaker neurons (25, 39). Previous studies have shown that excessive activation of Rh1 by high-intensity or prolonged light exposure can lead to retinal degeneration in Drosophila, characterized by photoreceptor cell death and structural damage (40).
In this investigation, Rh1 and Rh7 were selected as the subjects of study due to their status as the most well-characterized visual and non-visual opsins, respectively, in the Drosophila model. Rh1 is the most abundantly expressed rhodopsin in the retina and is essential for phototransduction in the outer photoreceptor cells. Conversely, Rh7 is uniquely expressed in the brain, particularly in neurons involved in circadian regulation, and is considered the only known non-visual opsin in Drosophila. This makes Rh7 a compelling candidate for evaluating extra-retinal light effects on the nervous system.
In this study, the primary objective was to evaluate the role of visual and non-visual opsins in the central nervous system of Drosophila melanogaster following exposure to blue light. To this end, we employed genetically modified flies lacking Rh1 and Rh7, and we conducted a comprehensive analysis of DNA damage and vacuole formation. These phenomena are well-established indicators of neurodegeneration, and our study sought to elucidate the underlying mechanisms through which these light-sensitive proteins influence the brain’s response to electromagnetic radiation. The study yielded direct evidence for the differential contribution of visual (Rh1) and non-visual (Rh7) opsins to the negative effects of blue light exposure on the nervous system, underscoring their potential as targets in neuroprotection strategies.
2 Methods
The experimental workflow in Figure 1 illustrates the key steps of this study, from fly stock maintenance and experimental group assignment to outcome measurements in Drosophila melanogaster, including DNA damage and vacuole quantification analyses (Figure 1).
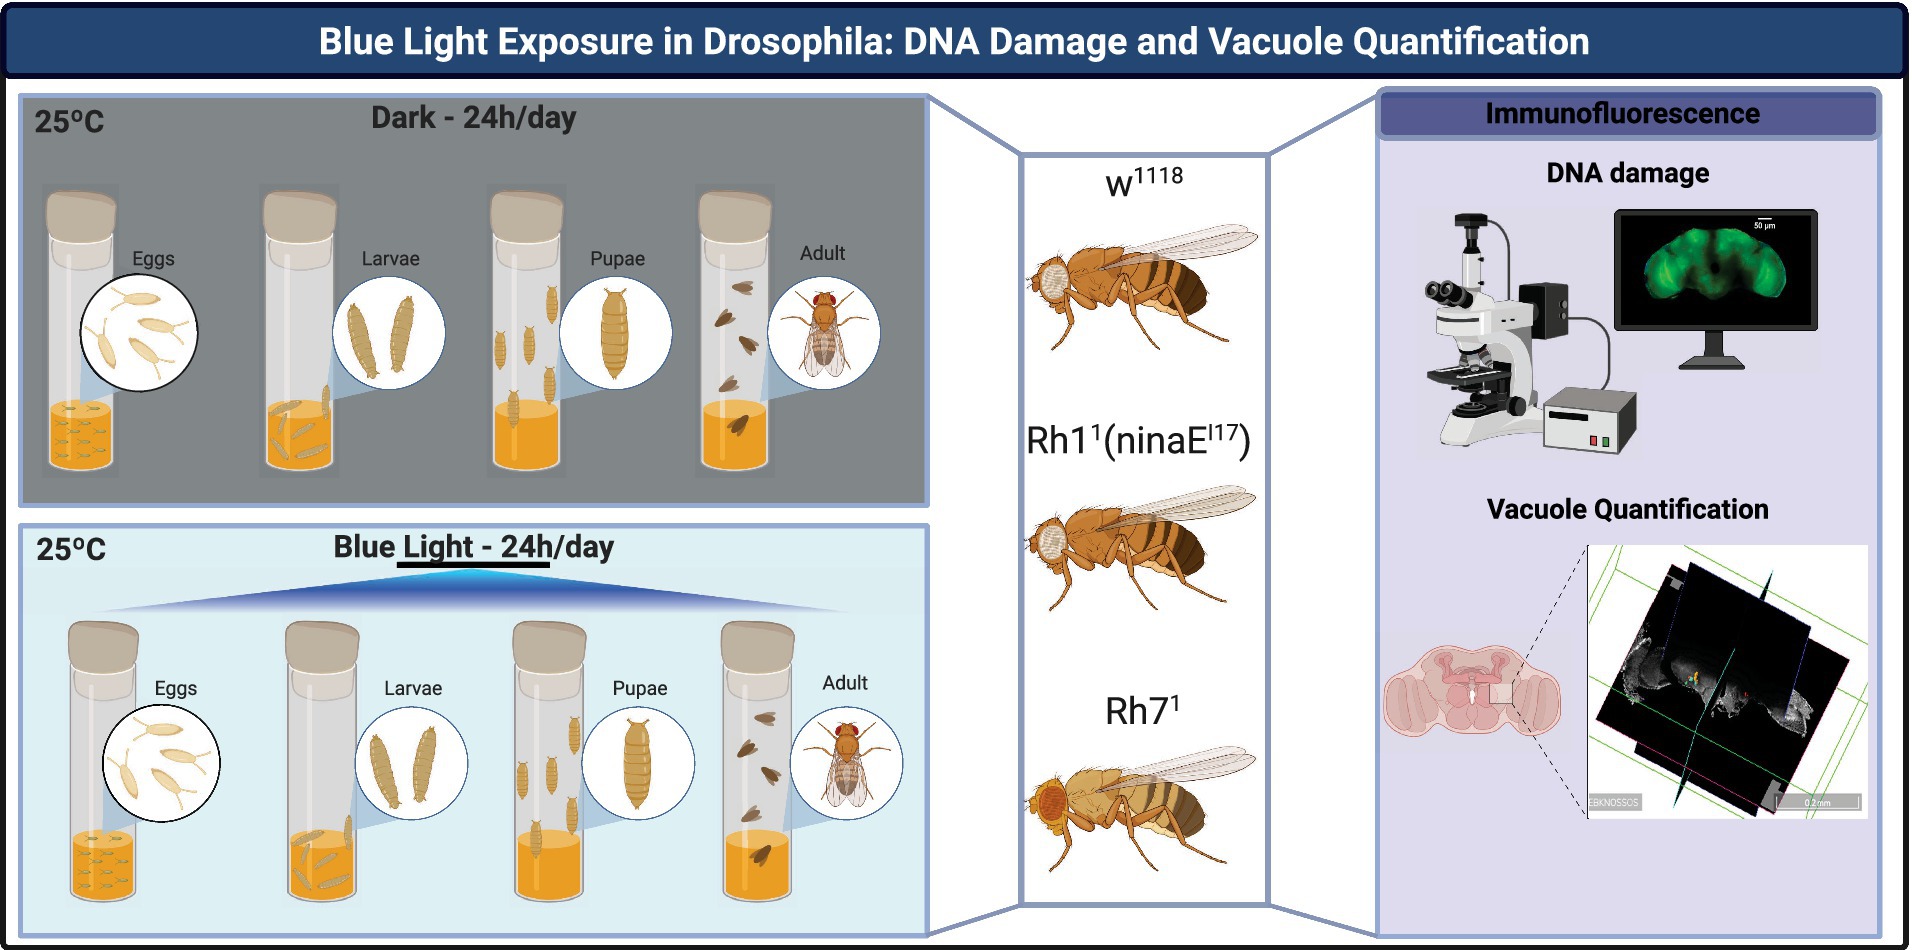
Figure 1. Experimental workflow of blue-light exposure and analysis in Drosophila melanogaster. Flies [w1118, Rh11 (ninaEI17), and Rh71] were reared at 25 °C and 70% relative humidity under either constant darkness or continuous blue light exposure (488 nm, 1,320 lux, 1,120 μW cm−2). Development from egg to adult occurred entirely under the assigned condition. Adult flies were analyzed at 20 days post-eclosion. Experimental outcomes included: (i) immunofluorescence staining to detect DNA damage (γ-H2Av, red), nuclei (Hoechst, blue), and actin fibers (Phalloidin, green); and (ii) volumetric quantification of brain vacuoles using 3D reconstruction software. Created with BioRender https://biorender.com/b4wjkjn.
2.1 Fly stocks and experimental groups
The strains used in this study were: Rh11(ninaEI17)—BDSC#5701; FlyBase ID:FBal0013022; Rh71—BDSC#BL76022; FlyBase ID: FBal0323541; and w1118. Strains Rh11 (ninaEI17) and Rh71, represent flies in which the respective genes (ninaE and Rh7) were ablated with a loss-of-function allele (39). Stock flies were maintained in bottles and vials containing cornmeal agar in an incubator (Tritech Research Inc.—standard DigiTherm) at 25 °C and 70% relative humidity under a 12:12 h light–dark cycle with ambient broad-spectrum white light (400–700 nm; 1,216 lux). The lights were turned on at 9:00 a.m. and turned off at 9:00 p.m. Approximately 10 pairs of adult flies were placed per vial (cornmeal agar) for oviposition and kept in an environmental chamber. After 72 h, parental flies were removed to avoid overlapping generations. From egg deposition (Day 0) onward, vials were assigned to blue-light or dark groups and maintained at 25 °C and 70% relative humidity. The blue-light group was exposed continuously (24 h/day) at 488 nm (1,320 lux; 1.120 μW·cm−2); thus, development from egg to adult occurred entirely under the assigned condition. Upon eclosion, adults were allowed to mate for 48 h and were then separated by sex. Blue-light exposure continued uninterrupted for 20 days. This timeframe is consistent with previous Drosophila studies of chronic blue-light exposure that observed neurodegenerative changes, lifespan reduction and increased neuronal damage over similarly extended periods (18, 41, 42). Blue light exposure was maintained without interruption from day 0 to day 20, resulting in a cumulative dose of approximately 1.94 × 10³ J/cm2 at the sample plane.
Control vials were kept in constant darkness (24 h D/D) under otherwise identical conditions.
We use constant darkness as the control condition to exclude the confounding effects of light exposure and isolate the specific effects of blue light.
2.2 Irradiation system
The blue light irradiation system consisted of eight light-emitting diodes (LED Luxeon Rebels), which were powered by an external source. Intensity, lux, and spectral profile measurements were obtained using a power meter (Thorlabs PM100D), a light meter (Extech LT300), and a spectrometer (Thorlabs CCS200), respectively. The exposure parameters for the blue light (λ = 488 nm) were 1,320 lux and a power of 1,120 μW/cm2. These parameters were chosen based on previous studies (18, 41–45).
2.3 Immunofluorescence
To assess neuromorphological changes, we examined the Drosophila central brain (46–49). After 20 days of light exposure, flies were anaesthetized and fixed in 4% formaldehyde for 3 h at room temperature and washed three times for 20 min with PBS. Brains were dissected and incubated overnight at 4 °C under rotation in PBS/0.5% Triton X-100 + 2% BSA. Subsequently, primary antibodies were incubated at 4 °C with rotation. After ~24 h, brains were washed three times for 20 min with PBS/0.5% Triton X-100 + 2% BSA and incubated with secondary antibodies for 2 h at room temperature with rotation. Tissues were then washed three times for 20 min with PBS and mounted on slides using Vectashield (50). The primary antibody used to detect DNA damage was mouse anti-ɣH2AV (1:40 DSHB). This antibody binds to the phosphorylated variant of histone H2A, i.e., DNA double-strand breaks. The secondary antibody anti-mouse Alexa 647 (1:1000) was used to detect the primary antibody. Hoechst (497 nm—blue) was used for staining nuclei and Phalloidin (546 nm—green) for actin fibers. Images were obtained in 3 μm sections using a Leica SP8 confocal microscope with a 63× oil immersion objective. Approximately 100 sections were taken for each brain, and laser, filter, and gain settings were kept constant for all experiments. On average, 3 biological replicates (n = 3 animals per genotype × condition) were analyzed.
2.4 DNA damage quantification
Quantification of DNA damage in the samples was performed by counting γ-H2Av positive cells in the images. This was performed using Fiji Image J and 3D Slicer software. First, the images for γ-H2Av positive cells were merged with the images of cell nuclei using the merge channels tool in Fiji. Then, in this new image, the γ-H2Av positive cells that overlapped with the nuclear labelling were detected. Segmentation of the coincident cells was performed using the watershed segmentation method. This method is widely used in the analysis of cellular images to segment specific regions, such as nuclei, cells or organelles in an image. In general, the method is based on topography concepts and uses pixel intensity as a three-dimensional representation to partition the image into distinct regions corresponding to cellular objects and thus perform their segmentation (51, 52). Finally, the number of segmented cells was counted and cell damage quantified.
2.5 Vacuole quantification
We quantified vacuoles using an adapted version of the protocol for analyzing 3D neurodegenerative vacuoles in Drosophila (53). Images Z-stacks were first converted into RGB colour using Fiji Image J. The three-dimensional geometric segmentation and analysis was performed using the free software Webknossos. Segmentation was performed for selected layers of the Z-stacks and volume interpolation was performed to record the vacuole regions within the segmentation layers. Unstained areas were identified as vacuoles. Vacuoles located on the retina and any tissue damage resulting from sample processing were not considered. Quantification was performed blinded to genotype and condition. Vacuoles in the central brain were registered, and their qualitative and quantitative information was exported as 3D meshes in CSV files. The total number of sample vacuoles and the percentage of total brain volume occupied by vacuoles were determined using the Python 3.9 (Numpy-STL package).
2.6 Statistical analysis
Statistical analyses were performed using GraphPad Prism 8. Data are presented as mean ± SD. Group comparisons were carried out using a two-way ANOVA followed by a Tukey’s multiple comparisons test for γ-H2Av quantification and a Mann–Whitney or Kruskal–Wallis test followed by a Dunn’s post hoc test for vacuole quantification. Statistical significance was set at p < 0.05.
3 Results
3.1 Blue light exposure leads to increased DNA damage
Representative confocal sections of adult Drosophila brains for the three genotypes are shown in Figures 2–4. Nuclei were labeled with Hoechst (blue), γ-H2Av–positive cells (indicating DNA damage) are shown in red, and actin fibers are stained with Phalloidin (green). Figure 5 illustrates an amplified region highlighting the merged staining.
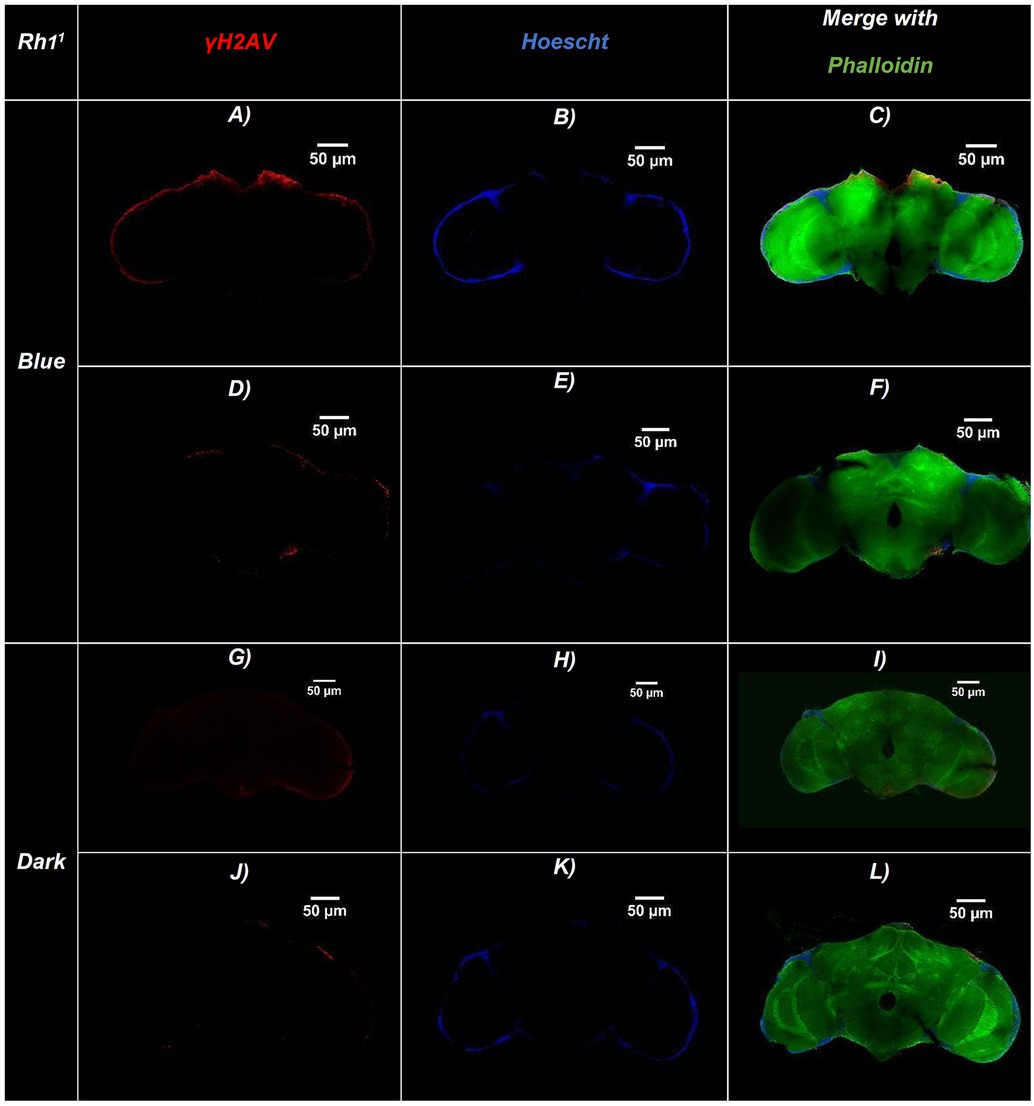
Figure 2. Representative confocal images of adult Drosophila Rh11 (ninaE17) brains exposed to blue light or maintained in darkness. Brains were immunostained for DNA damage (γ-H2Av, red), nuclei (Hoechst, blue), and actin filaments (Phalloidin, green). (A–F) Brains exposed to continuous blue light (24 h/day for 20 days)—(A,D) γ-H2Av channel, (B,E) Hoechst channel, (C,F) Merged. (G–L) Brains maintained in constant darkness (24 h D/D): (G,J) γ-H2Av channel, (H,K) Hoechst channel, (I,L) Merged. Merged panels (C,F,I,L) show colocalization of all three markers, allowing visualization of brain structure and DNA damage. Brains exposed to blue light display a higher number of γ-H2Av–positive nuclei (red), indicating increased DNA damage compared to dark controls. Scale bars: 50 μm (all panels).
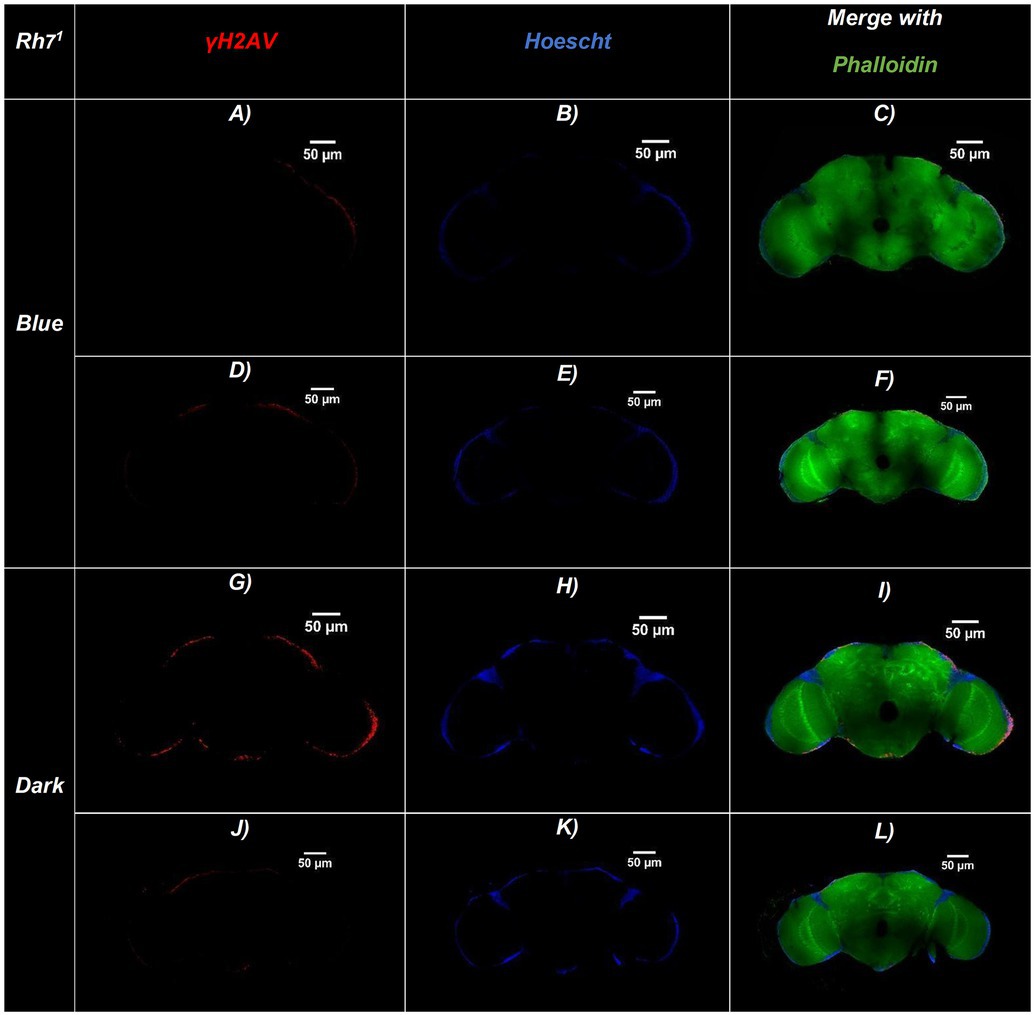
Figure 3. Representative confocal sections of adult Drosophila Rh71 brains under blue-light or dark conditions. Brains were immunostained for DNA damage (γ-H2Av, red), nuclei (Hoechst, blue), and actin filaments (Phalloidin, green). (A–F) Brains exposed to continuous blue light (24 h/day for 20 days)—(A,D) γ-H2Av channel, (B,E) Hoechst channel, (C,F) Merged. (G–L) Brains maintained in constant darkness (24 h D/D): (G,J) γ-H2Av channel, (H,K) Hoechst channel, (I,L) Merged. Merged panels (C,F,I,L) show colocalization of all three markers, allowing visualization of brain structure and DNA damage. Brains exposed to blue light display a higher number of γ-H2Av–positive nuclei (red), indicating increased DNA damage compared to dark controls. Scale bars: 50 μm (all panels).
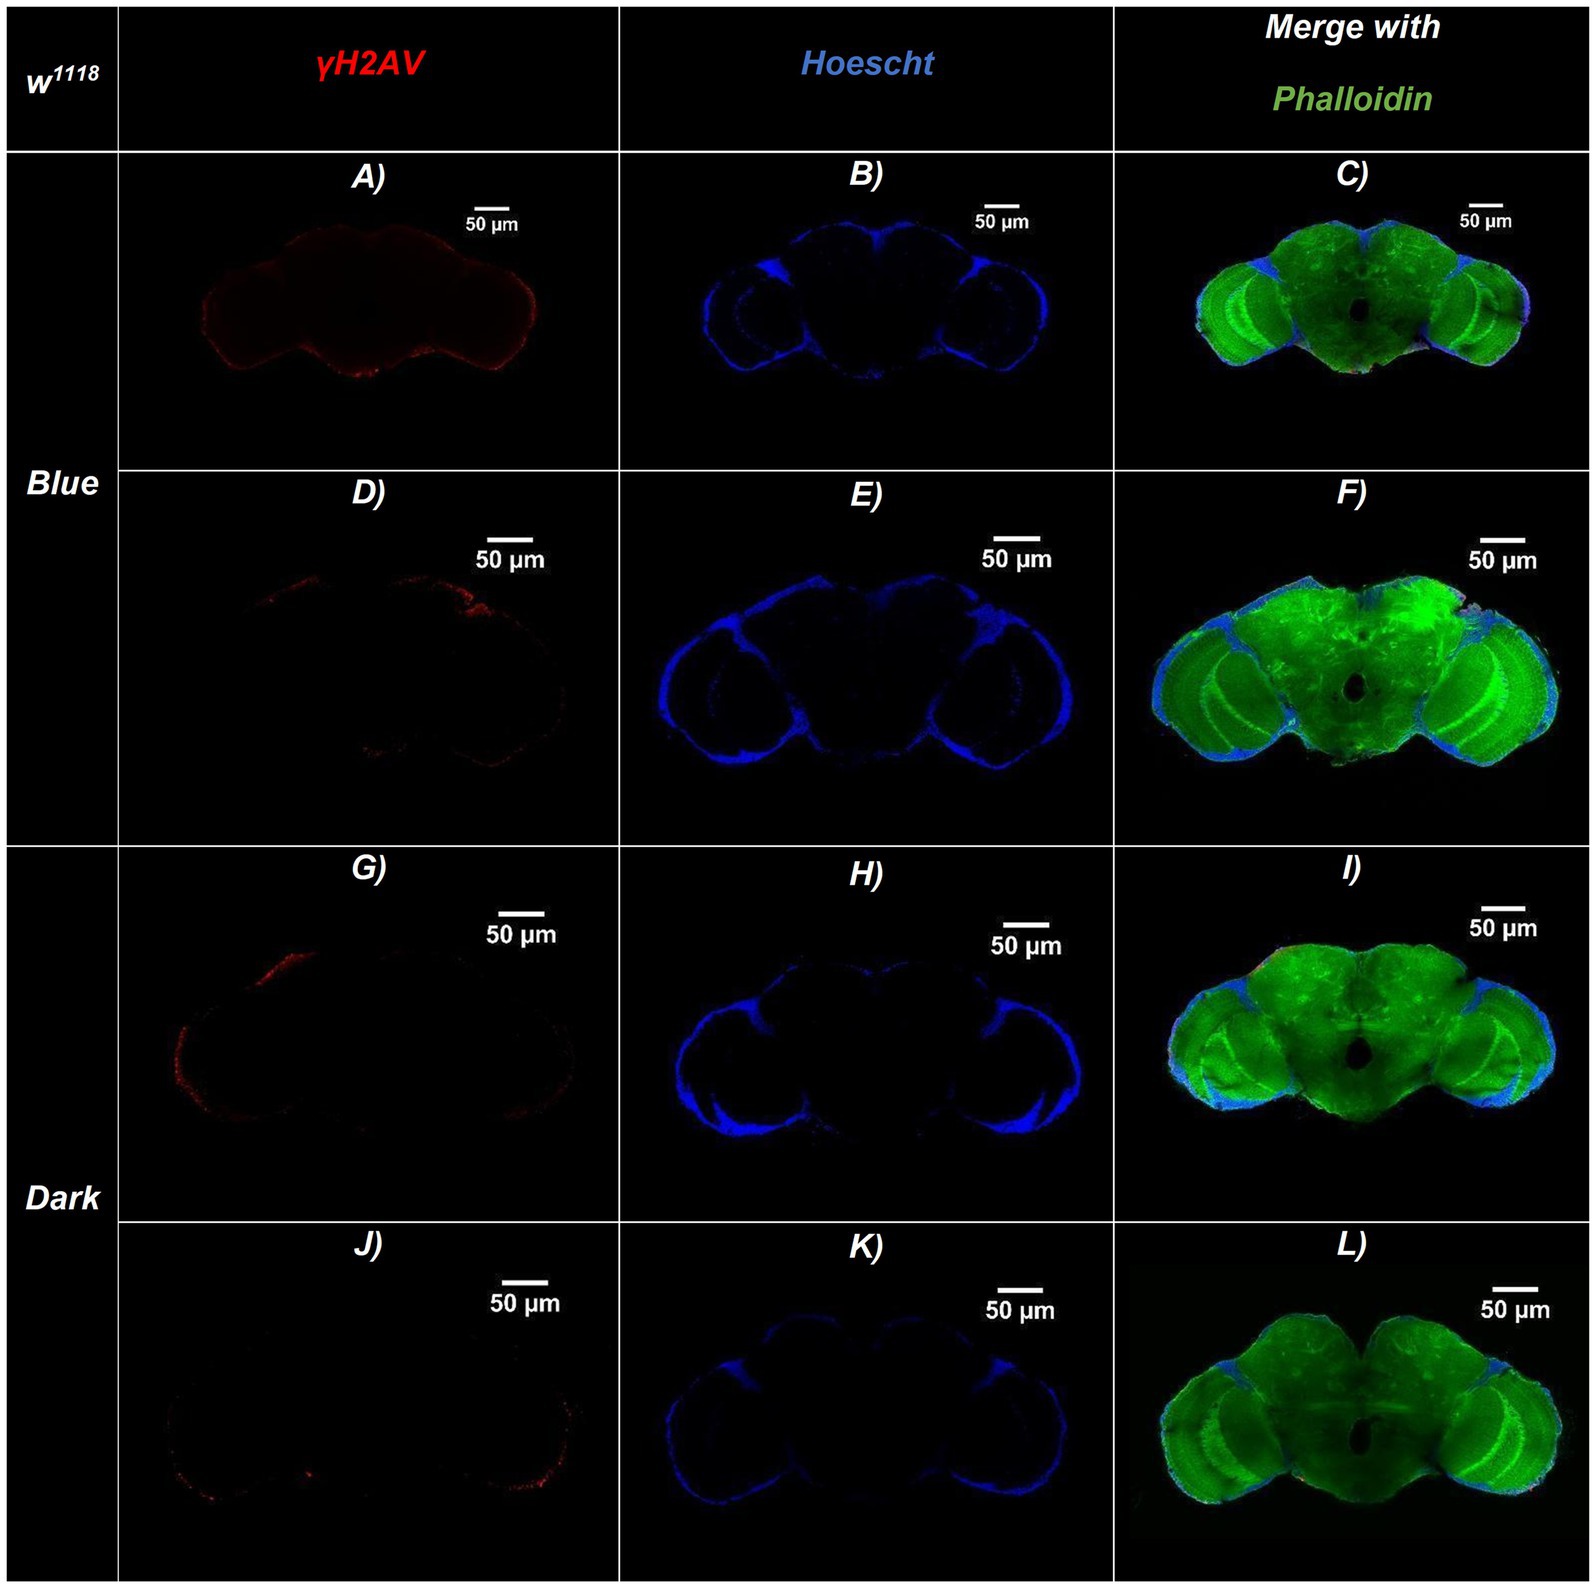
Figure 4. Representative confocal sections of adult Drosophila w1118 (wild-type) brains under blue-light or dark conditions. Brains were immunostained for DNA damage (γ-H2Av, red), nuclei (Hoechst, blue), and actin filaments (Phalloidin, green). (A–F) Brains exposed to continuous blue light (24 h/day for 20 days)—(A,D) γ-H2Av channel, (B,E) Hoechst channel, (C,F) Merged. (G–L) Brains maintained in constant darkness (24 h D/D): (G,J) γ-H2Av channel, (H,K) Hoechst channel, (I,L) Merged. Merged panels (C,F,I,L) show colocalization of all three markers, allowing visualization of brain structure and DNA damage. Brains exposed to blue light display a higher number of γ-H2Av–positive nuclei (red), indicating increased DNA damage compared to dark controls. Scale bars: 50 μm (all panels).
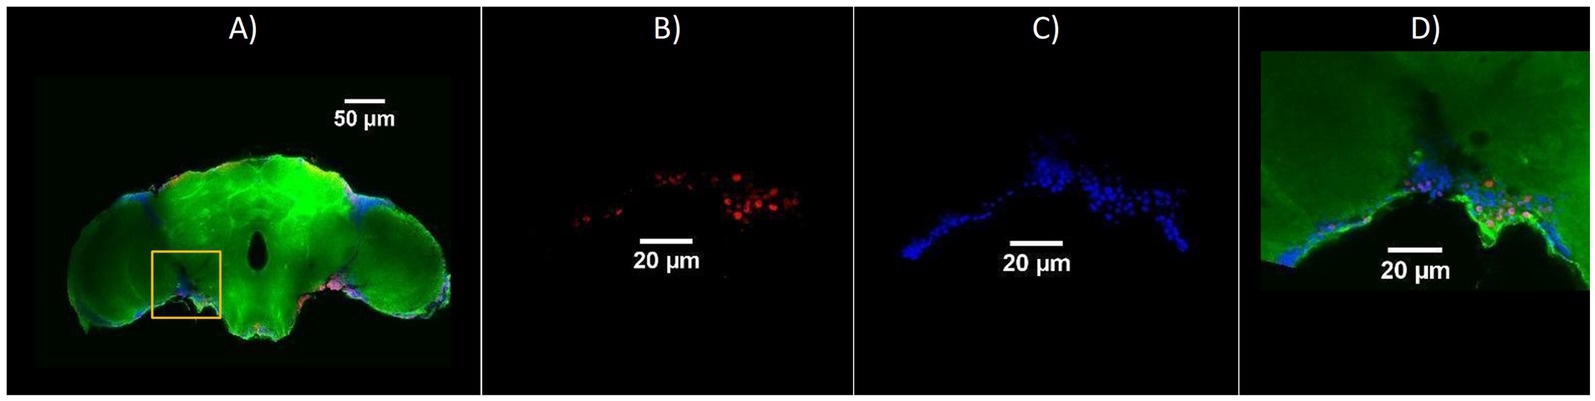
Figure 5. Representative confocal images showing the region of interest used for quantification of cellular staining in adult Drosophila brains. (A) Overview of a brain section with merged channels: γ-H2Av (red), Hoechst (blue), and Phalloidin (green); the yellow box indicates the region selected for analysis. Amplified views of the selected region—(B) γ-H2Av-positive cells (red, DNA damage), (C) Hoechst-stained nuclei (blue), (D) Merged image including Phalloidin (green), showing colocalization of nuclear and cytoskeletal markers with γ-H2Av signal. Scale bars: 50 μm (A), 20 μm (B–D).
The bar chart in Figure 6 shows the number of γ-H2Av-positive cells in blue light-treated groups compared with dark-treated controls across the different genotypes. DNA damage was consistently higher under blue light in all strains, with Rh11 flies showing the greatest increase compared to both w1118 and Rh71. In contrast, under dark conditions, Rh11 and Rh71 flies exhibited similar numbers of γ-H2Av–positive cells, while w1118 flies showed a slight reduction (Figures 2–6).
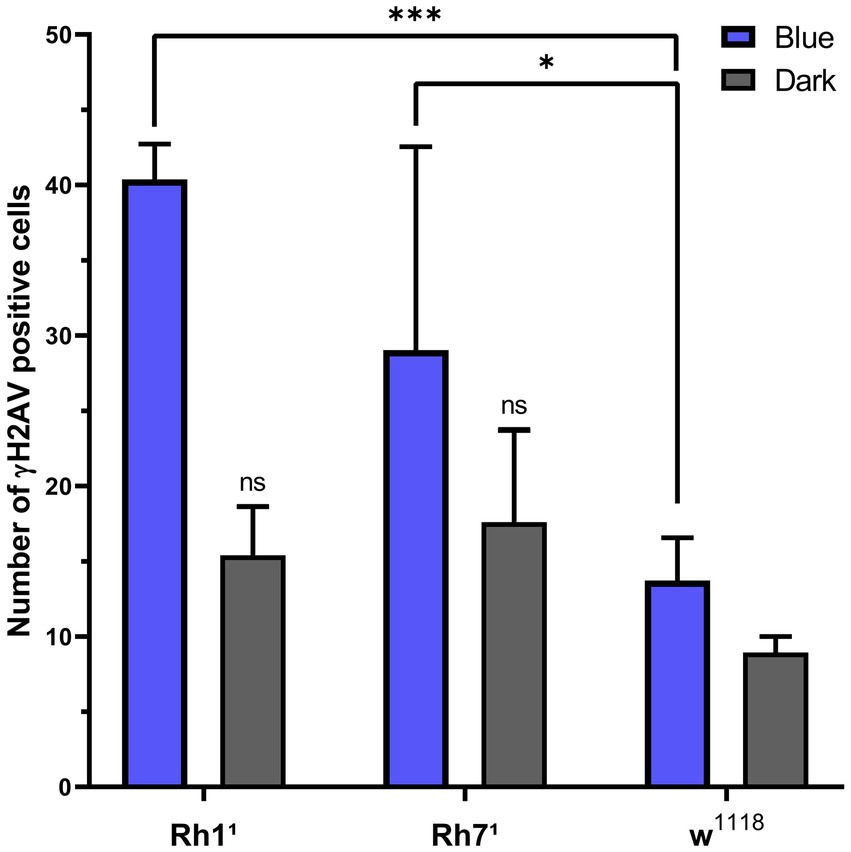
Figure 6. Proportion of γH2Av-positive cells in Drosophila brains under blue-light or dark conditions across genotypes (w1118, Rh11, Rh71). Values are expressed as mean ± SD. Statistical significance was determined by two-way ANOVA followed by Tukey’s multiple comparisons test (n = 3 brains per group). Under blue light, Rh11 showed a significant increase in γ-H2Av–positive cells compared with w1118 (***p < 0.001), and Rh71 also differed from w1118 (*p < 0.05). Only Rh11 showed a significant difference between blue-light and dark conditions (***p < 0.001). ns = non-significant.
3.2 Brain vacuolation is associated to Rh1 visual opsin deficiency
Across the different genotypes, flies lacking the visual rhodopsin (Rh11) exhibited a higher number of vacuoles in the central brain compared to the wild-type w1118 and the variant deprived of non-visual rhodopsin (Rh71). Figure 7 shows grayscale, 3D volumetric images viewed in orthogonal cross-sections using the WebKnossos platform, which allows the identification of vacuoles in the central brain. The green bounding box and the black planes represent the slice views in three perpendicular orientations (XY, YZ, and ZX), allowing multiplane volume inspection. Quantification of all samples revealed a greater presence of vacuoles in flies exposed to blue light (Figures 7, 8).

Figure 7. Grayscale, volumetric (3D) reconstructions of Drosophila brains from different genotypes (w1118, Rh11, Rh71) that were exposed to continuous blue light for 24 h a day for 20 days. Orthogonal cross-sections in the XY, YZ, and ZX planes (shown in green and blue) were generated using WebKnossos to enable volumetric inspection. Colored overlays highlight vacuole regions within the central brain, representing areas of tissue loss associated with neurodegeneration. Vacuoles were absent or sparse in w1118 brains, but were more frequently detected in Rh11 brains and, to a lesser extent, in Rh71 brains.
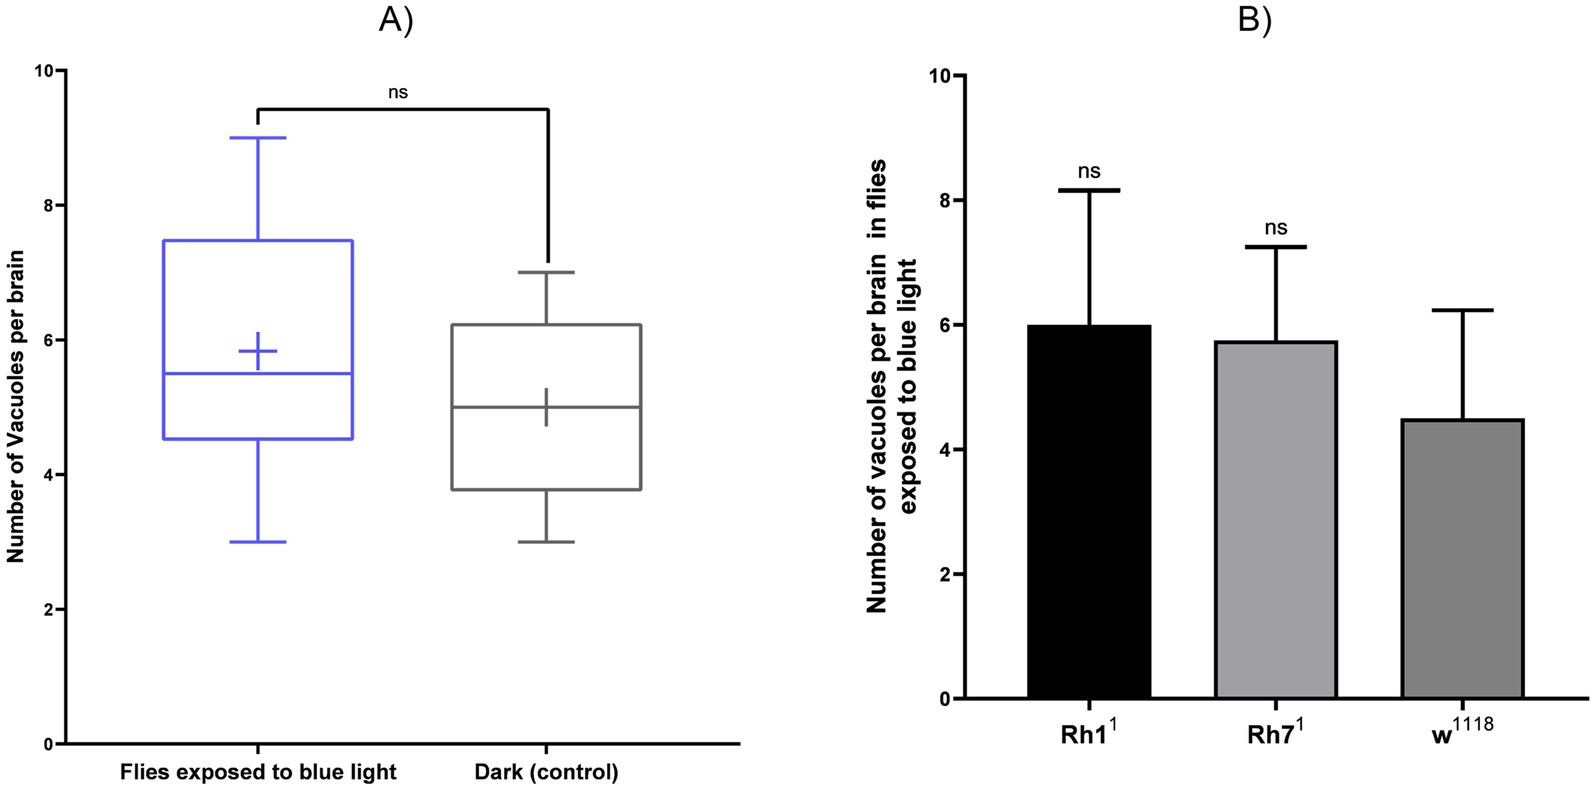
Figure 8. Quantification of brain vacuoles in Drosophila after continuous blue-light exposure (24 h/day, 20 days) compared with constant dark controls (24 h D/D). (A) Number of vacuoles per brain in flies exposed to blue light versus dark controls. (B) Comparison across genotypes (Rh11, Rh71, and w1118) under blue-light exposure. Values are expressed as mean ± SD (n = 3 brains per group). Statistical analysis was performed using the Mann–Whitney test for blue light versus dark (ns, p = 0.59) and Kruskal–Wallis followed by Dunn’s multiple comparisons test across genotypes (ns, p = 0.48). No significant differences were detected (ns).
4 Discussion
The relevance of studying neurodegeneration in Drosophila melanogaster has increased in recent years, as several studies have shown that excessive light exposure, especially at blue wavelength range (~450–490 nm), can induce neuron death. In this work, we investigated the effects of blue light exposure in Drosophila melanogaster flies with loss of function of visual and non-visual opsins. Our analyses show that ablation of different opsins (Rh1, a light-sensitive pigment, and Rh7, typically associated with non-visual functions) leads to distinct profiles of DNA damage (γ-H2Av) and vacuole formation in the brain of Drosophila. These findings support the hypotheses that each opsin contributes to photosensitivity and intracellular signaling in unique ways, culminating in distinct patterns of neurodegeneration under light exposure (25, 38). The Rh11 strains showed increased DNA damage under blue light, compared to w1118 and Rh71, supporting the notion that blocking the classical phototransduction pathway enhances DNA damage. The same pattern is observed across genotypes with respect to vacuole-associated neurodegeneration. The formation of neurodegeneration vacuoles in Drosophila indicates neuronal tissue loss and permanent brain damage (50), which can be assessed through the quantification of actin and synaptic protein filaments.
Quantitative analysis of Figures 6, 8 revealed an increase in γ-H2Av-positive cells and a modest rise in brain vacuolization in Rh11 flies compared to w1118 controls. Compared to Rh71 flies, the Rh11 strain also showed a trend toward higher numbers of γ-H2Av-positive cells and slightly more vacuolization. These results suggest that the absence of the visual opsin Rh11 may increase susceptibility to blue light-induced neurodegeneration, supporting a potential role of Rh11 in mediating light-induced neurodegeneration in the central nervous system. Although the Rh7-ablated flies showed less damage under blue light than the Rh1-ablated ones, it was still greater than the w1118 control.
Based on Figure 7, we identified and listed the Drosophila brain regions in which the vacuoles were observed. The analysis of the brain of Drosophila on the Codex platform (54) allowed us to highlight potential areas that are more vulnerable to neurodegeneration (Figure 9). The input regions represent the connections that transport information from other areas or sensory neurons to the brain. Output regions extend axonal connections from the neuropil to motor neurons or other brain areas.

Figure 9. Characterization of synaptic connectivity in different neuropil regions of the Drosophila brain. Panels (A-G) highlight distinct brain regions: (A) Periesophageal neuropil, (B) Inferior posterior slope (IPS_L), (C) Right antennal lobe, (D) Anterior ventrolateral protocerebrum (AVLP_L), (E) Posterior ventrolateral protocerebrum (PVLP_L), (F) Wedge (WED_L), and (G) Posterior lateral protocerebrum (PLP_L). For each region, predominant neurotransmitter outputs and inputs are indicated, together with the proportion of intrinsic versus afferent connections (based on Codex database, Dorkenwald et al. (60)). Regions with lower intrinsic connectivity (e.g., periesophageal neuropil) are more reliant on afferent inputs and may be more vulnerable to vacuole formation, while highly intrinsic regions (e.g., PVLP_L, PLP_L) show greater local processing capacity and potentially lower vulnerability. Images adapted from codex.flywire.ai (60, 61).
Interestingly, vacuole was not equally distributed throughout the brain, but concentrated in specific regions, such as some ventrolateral regions of the protocerebrum (AVLP—Figure 9D, PVLP—Figure 9E) and periesophageal neuropils (WED—Figure 9F, PLP—Figure 9G), according to our volumetric analysis. Previous studies have linked the occurrence of vacuolization in specific regions of the Drosophila brain to local dysfunction of neurons and glial cells, which can culminate in severe functional impairment (55). When we cross-referenced our vacuole localization findings with the data available on the Codex platform for these regions (such as AVLP, PVLP, WED, PLP), we found an enrichment of excitatory (acetylcholine, glutamate) and inhibitory (GABA) neurotransmitter inputs and outputs, suggesting that these areas may be particularly vulnerable to oxidative stress when light-dependent processes—whether visual or non-visual—are compromised. This is consistent with studies showing that an imbalance between excitatory and inhibitory signaling can exacerbate degenerative processes. There is also evidence that excessive glutamatergic signaling contributes to neurodegenerative disorders in mammals, including Alzheimer’s disease (56). Furthermore, dysregulation of the excitatory/inhibitory balance, in part mediated by GABA, may accelerate neuronal degeneration and potentially contribute to cognitive and motor deficits.
These two groups were then sorted into intrinsic or afferent. Intrinsic connections are formed by local neurons that synapse within the same area without projecting signals to distant regions. A high percentage of intrinsic connectivity indicates strong self-regulation, with internal circuits responsible for processing information locally. In contrast, afferent connections bring sensory or modulatory information from other parts of the nervous system. Therefore, regions with high afferent connections may be more vulnerable to damage caused by light exposure, as connection loss can lead to more severe dysfunctions. The periesophageal neuropil (Figure 9A) has lower intrinsic connectivity among all the evaluated regions (approximately 72–74%), suggesting greater activation by external afferents associated with Rh71 photo sensing.
The formation of vacuoles in the brains of flies possibly affects neurotransmitter balance and, consequently, behavior. The main neurotransmitters listed in the inputs and outputs of Figure 9 are Acetylcholine (ACH), GABA and Glutamate (GLUT), associated with anxious behavior (57), neurodegenerative processes (56), and ageing (58).
The right antennal lobe (Figure 9C) has the highest proportion of afferent connections (~68.4% output and 53.1% input), which may have been compromised by vacuole formation in all groups (Figure 7). Furthermore, regions such as the posterior ventrolateral (PVLP_L—Figure 9E) and posterior lateral protocerebrum (PLP_L—Figure 9E) have high intrinsic connectivity (>96%), indicating more preserved circuits and less vulnerability to external damage. The high number of vacuoles in those regions suggest that areas with greater dependence on external stimuli may be more vulnerable to light-induced neurodegeneration.
The occurrence of vacuolization in areas of high afferent connectivity indicates that the degeneration is affecting circuits that receive external inputs. This affects the sensory response and behavioral modulation of γ-H2Av-positive Rh11 flies more prominently.
One hypothesis for the observed differences between the roles of visual and non-visual opsins is that, in situations of excessive blue light, neural pathways mediated by non-visual opsins (such as Rh7) are disturbed. This interaction could disrupt tissue homeostasis, leading to cumulative DNA damage and subsequent vacuolization. The absence of Rh1 would exacerbate this effect, perhaps due to the loss of protective feedback normally mediated by the retina, such as AMP-activated protein kinase (AMPK) (59), which results in increased vacuolization in the affected regions.
5 Limitations and future directions
This study offers valuable insights, though some limitations must be acknowledged. The limited number of biological replicates reduces statistical power; however, the consistency of results across replicates and methods supports the reliability of our findings.
Also, we employed a continuous exposure paradigm (24 h/day for 20 days), which, while useful to maximize cumulative dose and reveal clear effects, does not capture the potential influence of light–dark cycles, intermittent exposures, or different dose–response regimes. Furthermore, our analyses were focused on γ-H2Av as a marker of DNA damage and vacuolization as a marker of neurodegeneration; other relevant cellular pathways, including oxidative stress, apoptosis, synaptic integrity, and glial responses, were not assessed here. It would also be valuable to assess behavioral outcomes such as locomotor performance, and to explore rescue experiments in which Rh1 or Rh7 expression is restored. These approaches will help refine our understanding of how visual and non-visual opsins differentially modulate the neuronal response to blue light.
Future research should also include more detailed temporal analyses of damage progression throughout development and adulthood of animal models. Additionally, it will be essential to investigate the contribution of specific neural circuits and glial populations in these brain regions to elucidate how the absence of an opsin may activate distinct pathways of neurodegeneration in response to light.
6 Conclusion
Excessive blue light exposure is increasingly recognized as a public health concern, particularly due to widespread use of digital devices. Although the compound eye of Drosophila differs structurally from the camera-type eye of mammals, both systems rely on opsins as light-sensitive G-protein coupled receptors and share conserved downstream signaling cascades.
This study helps to elucidate the mechanisms by which different opsins modulate the cellular response to blue light and supports the idea that classical photoreceptors Rh1 influence processes beyond the retina. Additionally, our data suggests that non-visual opsins such as Rh7 may also participate in mediating photosensitivity within the brain. We show that visual opsins, specifically Rh1, are key mediators of blue light-induced DNA damage in flies’ brains. This aligns with mammalian studies reporting that excessive blue light can impair mitochondrial function, generate reactive oxygen species, and trigger DNA damage in retinal photoreceptors and ganglion cells, ultimately contributing to neurodegeneration and vision-related disorders such as glaucoma and age-related macular degeneration. Therefore, despite anatomical differences, the molecular vulnerability to high-energy blue light is conserved across species, underscoring the translational relevance of our findings and their potential impact on human health.
Data availability statement
The original contributions presented in the study are included in the article/supplementary material, further inquiries can be directed to the corresponding authors.
Author contributions
MP-S: Methodology, Data curation, Conceptualization, Investigation, Writing – review & editing, Writing – original draft, Formal analysis. SM: Writing – original draft, Investigation, Writing – review & editing, Data curation, Conceptualization. HZ: Conceptualization, Writing – review & editing, Investigation, Writing – original draft, Data curation. MO: Writing – original draft, Software, Investigation, Conceptualization. JM: Writing – review & editing, Formal analysis, Visualization, Supervision. CZ: Conceptualization, Resources, Writing – original draft, Project administration, Visualization, Validation, Funding acquisition, Supervision, Writing – review & editing.
Funding
The author(s) declare that financial support was received for the research and/or publication of this article. The authors would like to express their thanks to FAPESP (Grant 2022/02636-9) and the Environmental Health Trust for their financial support.
Acknowledgments
The authors thank Dr. Stephen Ferguson for designing and fabricating the irradiation systems, Professor Craig Montell for kindly providing the Drosophila strains and Professor Dragana Rogulja for providing Lab facilities. We acknowledge the Princeton FlyWire team and members of the Murthy and Seung labs for development and maintenance of FlyWire (supported by BRAIN Initiative grant MH117815 to Murthy and Seung) (https://edit.flywire.ai/credits.html). We also acknowledge the FlyWire consortium for neuron proofreading and annotation.
Conflict of interest
The authors declare that the research was conducted in the absence of any commercial or financial relationships that could be construed as a potential conflict of interest.
Generative AI statement
The authors declare that Gen AI was used in the creation of this manuscript. The authors used OpenAI's ChatGPT and DeepL Write to assist with English language editing and improvement of grammar, structure, and clarity during the manuscript preparation. All scientific content, data interpretation, and conclusions were developed solely by the authors.
Any alternative text (alt text) provided alongside figures in this article has been generated by Frontiers with the support of artificial intelligence and reasonable efforts have been made to ensure accuracy, including review by the authors wherever possible. If you identify any issues, please contact us.
Publisher’s note
All claims expressed in this article are solely those of the authors and do not necessarily represent those of their affiliated organizations, or those of the publisher, the editors and the reviewers. Any product that may be evaluated in this article, or claim that may be made by its manufacturer, is not guaranteed or endorsed by the publisher.
References
1. Ding, M, Zhou, H, Li, Y-M, and Zheng, Y-W. Molecular pathways regulating circadian rhythm and associated diseases. Front Biosci (Landmark Ed). (2024) 29:206. doi: 10.31083/j.fbl2906206
2. Fisk, AS, Tam, SKE, Brown, LA, Vyazovskiy, VV, Bannerman, DM, and Peirson, SN. Light and cognition: roles for circadian rhythms, sleep, and arousal. Front Neurol. (2018) 9:56. doi: 10.3389/fneur.2018.00056
3. The Nielsen Total Audience Report: Q3. Nielsen (2018). Available online at: https://www.nielsen.com/insights/2019/q3-2018-total-audience-report/ (Accessed March 30, 2025).
4. Chang, A-M, Aeschbach, D, Duffy, JF, and Czeisler, CA. Evening use of light-emitting eReaders negatively affects sleep, circadian timing, and next-morning alertness. Proc Natl Acad Sci USA. (2015) 112:1232–7. doi: 10.1073/pnas.1418490112
5. Höhn, C, Schmid, SR, Plamberger, CP, Bothe, K, Angerer, M, Gruber, G, et al. Preliminary results: the impact of smartphone use and short-wavelength light during the evening on circadian rhythm, sleep and alertness. Clocks Sleep. (2021) 3:66–86. doi: 10.3390/clockssleep3010005
6. Cao, M, Xu, T, and Yin, D. Understanding light pollution: recent advances on its health threats and regulations. J Environ Sci. (2023) 127:589–602. doi: 10.1016/j.jes.2022.06.020
7. Lunn, RM, Blask, DE, Coogan, AN, Figueiro, MG, Gorman, MR, Hall, JE, et al. Health consequences of electric lighting practices in the modern world: a report on the National Toxicology Program’s workshop on shift work at night, artificial light at night, and circadian disruption. Sci Total Environ. (2017) 607–608:1073–84. doi: 10.1016/j.scitotenv.2017.07.056
8. Tancredi, S, Urbano, T, Vinceti, M, and Filippini, T. Artificial light at night and risk of mental disorders: a systematic review. Sci Total Environ. (2022) 833:155185. doi: 10.1016/j.scitotenv.2022.155185
9. Yang, J, Hendrix, DA, and Giebultowicz, JM. The dark side of artificial light. Biochemist. (2020) 42:32–5. doi: 10.1042/BIO20200060
10. Cougnard-Gregoire, A, Merle, BMJ, Aslam, T, Seddon, JM, Aknin, I, Klaver, CCW, et al. Blue light exposure: ocular hazards and prevention—a narrative review. Ophthalmol Ther. (2023) 12:755–88. doi: 10.1007/s40123-023-00675-3
11. Hipólito, V, and Coelho, JMP. Blue light of the digital era: a comparative study of devices. Photonics. (2024) 11:93. doi: 10.3390/photonics11010093
12. Hatori, M, Gronfier, C, van Gelder, RN, Bernstein, PS, Carreras, J, Panda, S, et al. Global rise of potential health hazards caused by blue light-induced circadian disruption in modern aging societies. NPJ Aging Mech Dis. (2017) 3:9. doi: 10.1038/s41514-017-0010-2
13. Salceda, R. Light pollution and oxidative stress: effects on retina and human health. Antioxidants. (2024) 13:362. doi: 10.3390/antiox13030362
14. Karska, J, Kowalski, S, Gładka, A, Brzecka, A, Sochocka, M, Kurpas, D, et al. Artificial light and neurodegeneration: does light pollution impact the development of Alzheimer’s disease? GeroScience. (2024) 46:87–97. doi: 10.1007/s11357-023-00932-0
15. Burns, AC, Windred, DP, Rutter, MK, Olivier, P, Vetter, C, Saxena, R, et al. Day and night light exposure are associated with psychiatric disorders: an objective light study in >85,000 people. Nat Ment Health. (2023) 1:853–62. doi: 10.1038/s44220-023-00135-8
16. Dautovich, ND, Schreiber, DR, Imel, JL, Tighe, CA, Shoji, KD, Cyrus, J, et al. A systematic review of the amount and timing of light in association with objective and subjective sleep outcomes in community-dwelling adults. Sleep Health. (2019) 5:31–48. doi: 10.1016/j.sleh.2018.09.006
17. Uğurlu, AK, Bideci, A, Demirel, AM, Kaplanoğlu, GT, Dayanır, D, Gülbahar, Ö, et al. Is blue light exposure a cause of precocious puberty in male rats? Front Endocrinol. (2023) 14:1190445. doi: 10.3389/fendo.2023.1190445
18. Nash, TR, Chow, ES, Law, AD, Fu, SD, Fuszara, E, Bilska, A, et al. Daily blue-light exposure shortens lifespan and causes brain neurodegeneration in Drosophila. Npj Aging Mech Dis. (2019) 5:1–8. doi: 10.1038/s41514-019-0038-6
19. Shichida, Y, and Matsuyama, T. Evolution of opsins and phototransduction. Philos Trans R Soc Lond Ser B Biol Sci. (2009) 364:2881–95. doi: 10.1098/rstb.2009.0051
21. Moraes, MN, De Assis, LVM, Provencio, I, and Castrucci, AMDL. Opsins outside the eye and the skin: a more complex scenario than originally thought for a classical light sensor. Cell Tissue Res. (2021) 385:519–38. doi: 10.1007/s00441-021-03500-0
22. Guido, ME, Marchese, NA, Rios, MN, Morera, LP, Diaz, NM, Garbarino-Pico, E, et al. Non-visual opsins and novel photo-detectors in the vertebrate inner retina mediate light responses within the blue Spectrum region. Cell Mol Neurobiol. (2022) 42:59–83. doi: 10.1007/s10571-020-00997-x
23. Provencio, I, Rodriguez, IR, Jiang, G, Hayes, WP, Moreira, EF, and Rollag, MD. A novel human opsin in the inner retina. J Neurosci. (2000) 20:600–5. doi: 10.1523/JNEUROSCI.20-02-00600.2000
24. Provencio, I, Jiang, G, De Grip, WJ, Hayes, WP, and Rollag, MD. Melanopsin: an opsin in melanophores, brain, and eye. Proc Natl Acad Sci. (1998) 95:340–5. doi: 10.1073/pnas.95.1.340
25. Leung, NY, and Montell, C. Unconventional roles of opsins. Annu Rev Cell Dev Biol. (2017) 33:241–64. doi: 10.1146/annurev-cellbio-100616-060432
26. Sharkey, CR, Blanco, J, Leibowitz, MM, Pinto-Benito, D, and Wardill, TJ. The spectral sensitivity of Drosophila photoreceptors. Sci Rep. (2020) 10:18242. doi: 10.1038/s41598-020-74742-1
27. Au, DD, Liu, JC, Park, SJ, Nguyen, TH, Dimalanta, M, Foden, AJ, et al. Drosophila photoreceptor systems converge in arousal neurons and confer light responsive robustness. Front Neurosci. (2023) 17:1160353. doi: 10.3389/fnins.2023.1160353
28. Foster, RG, and Hankins, MW. Non-rod, non-cone photoreception in the vertebrates. Prog Retin Eye Res. (2002) 21:507–27. doi: 10.1016/S1350-9462(02)00036-8
29. Freedman, MS, Lucas, RJ, Soni, B, Von Schantz, M, Muñoz, M, David-Gray, Z, et al. Regulation of mammalian circadian behavior by non-rod, non-cone, ocular photoreceptors. Science. (1999) 284:502–4. doi: 10.1126/science.284.5413.502
30. Valdez, DJ, Nieto, PS, Garbarino-Pico, E, Avalle, LB, Díaz-Fajreldines, H, Schurrer, C, et al. A nonmammalian vertebrate model of blindness reveals functional photoreceptors in the inner retina. FASEB J. (2009) 23:1186–95. doi: 10.1096/fj.08-117085
31. Pan, D, Wang, Z, Chen, Y, and Cao, J. Melanopsin-mediated optical entrainment regulates circadian rhythms in vertebrates. Commun Biol. (2023) 6:1054. doi: 10.1038/s42003-023-05432-7
32. Poletini, MO, Ramos, BC, Moraes, MN, and Castrucci, AML. Nonvisual opsins and the regulation of peripheral clocks by light and hormones. Photochem Photobiol. (2015) 91:1046–55. doi: 10.1111/php.12494
33. Zhang, KX, D’Souza, S, Upton, BA, Kernodle, S, Vemaraju, S, Nayak, G, et al. Violet-light suppression of thermogenesis by opsin 5 hypothalamic neurons. Nature. (2020) 585:420–5. doi: 10.1038/s41586-020-2683-0
34. Kawano-Yamashita, E, Koyanagi, M, Wada, S, Saito, T, Sugihara, T, Tamotsu, S, et al. The non-visual opsins expressed in deep brain neurons projecting to the retina in lampreys. Sci Rep. (2020) 10:9669. doi: 10.1038/s41598-020-66679-2
35. Karthikeyan, R, Davies, WIL, and Gunhaga, L. Non-image-forming functional roles of OPN3, OPN4 and OPN5 photopigments. J Photochem Photobiol. (2023) 15:100177. doi: 10.1016/j.jpap.2023.100177
36. Nayak, G, Zhang, KX, Vemaraju, S, Odaka, Y, Buhr, ED, Holt-Jones, A, et al. Adaptive thermogenesis in mice is enhanced by opsin 3-dependent adipocyte light sensing. Cell Rep. (2020) 30:672–686.e8. doi: 10.1016/j.celrep.2019.12.043
37. Kelley, JL, and Davies, WIL. The biological mechanisms and behavioral functions of opsin-based light detection by the skin. Front Ecol Evol. (2016) 4:106. doi: 10.3389/fevo.2016.00106
38. Ni, JD, Baik, LS, Holmes, TC, and Montell, C. A rhodopsin in the brain functions in circadian photoentrainment in Drosophila. Nature. (2017) 545:340–4. doi: 10.1038/nature22325
39. FlyBase gene report: Dmel\ninaE. Available online at: https://flybase.org/reports/FBgn0002940 (Accessed January 20, 2025).
40. Zhang, Z, Shan, X, Li, S, Chang, J, Zhang, Z, Dong, Y, et al. Retinal light damage: from mechanisms to protective strategies. Surv Ophthalmol. (2024) 69:905–15. doi: 10.1016/j.survophthal.2024.07.004
41. Yang, J, Song, Y, Law, AD, Rogan, CJ, Shimoda, K, Djukovic, D, et al. Chronic blue light leads to accelerated aging in Drosophila by impairing energy metabolism and neurotransmitter levels. Front Aging. (2022) 3:983373. doi: 10.3389/fragi.2022.983373
42. Song, Y, Yang, J, Law, AD, Hendrix, DA, Kretzschmar, D, Robinson, M, et al. Age-dependent effects of blue light exposure on lifespan, neurodegeneration, and mitochondria physiology in Drosophila melanogaster. NPJ Aging. (2022) 8:11. doi: 10.1038/s41514-022-00092-z
43. Au, DD, Foden, AJ, Park, SJ, Nguyen, TH, Liu, JC, Tran, MD, et al. Mosquito cryptochromes expressed in Drosophila confer species-specific behavioral light responses. Curr Biol. (2022) 32:3731–3744.e4. doi: 10.1016/j.cub.2022.07.021
44. Helfrich-Förster, C, Winter, C, Hofbauer, A, Hall, JC, and Stanewsky, R. The circadian clock of fruit flies is blind after elimination of all known photoreceptors. Neuron. (2001) 30:249–61. doi: 10.1016/S0896-6273(01)00277-X
45. Krittika, S, and Yadav, P. Alterations in lifespan and sleep:wake duration under selective monochromes of visible light in Drosophila melanogaster. Biol Open. (2022) 11:bio059273. doi: 10.1242/bio.059273
46. Awasaki, T, Lai, S-L, Ito, K, and Lee, T. Organization and postembryonic development of glial cells in the adult central brain of Drosophila. J Neurosci. (2008) 28:13742–53. doi: 10.1523/JNEUROSCI.4844-08.2008
47. Lessing, D, and Bonini, NM. Maintaining the brain: insight into human neurodegeneration from Drosophila melanogaster mutants. Nat Rev Genet. (2009) 10:359–70. doi: 10.1038/nrg2563
48. Mühlig-Versen, M, da Cruz, AB, Tschäpe, JA, Moser, M, Büttner, R, Athenstaedt, K, et al. Loss of Swiss cheese/neuropathy target esterase activity causes disruption of phosphatidylcholine homeostasis and neuronal and glial death in adult Drosophila. J Neurosci. (2005) 25:2865–73. doi: 10.1523/JNEUROSCI.5097-04.2005
49. Rival, T, Soustelle, L, Strambi, C, Besson, MT, Iché, M, and Birman, S. Decreasing glutamate buffering capacity triggers oxidative stress and neuropil degeneration in the Drosophila brain. Curr Biol. (2004) 14:599–605. doi: 10.1016/j.cub.2004.03.039
50. Behnke, JA, Ye, C, Moberg, KH, and Zheng, JQ. A protocol to detect neurodegeneration in Drosophila melanogaster whole-brain mounts using advanced microscopy. STAR Protoc. (2021) 2:100689. doi: 10.1016/j.xpro.2021.100689
51. Wen, T, Tong, B, Liu, Y, Pan, T, du, Y, Chen, Y, et al. Review of research on the instance segmentation of cell images. Comput Methods Prog Biomed. (2022) 227:107211. doi: 10.1016/j.cmpb.2022.107211
52. Pinter, C, Lasso, A, and Fichtinger, G. Polymorph segmentation representation for medical image computing. Comput Methods Prog Biomed. (2019) 171:19–26. doi: 10.1016/j.cmpb.2019.02.011
53. Liu, G, Bandyadka, S, and McCall, K. Protocol to analyze 3D neurodegenerative vacuoles in Drosophila melanogaster. STAR Protoc. (2024) 5:103017. doi: 10.1016/j.xpro.2024.103017
54. Matsliah, A, Sterling, A, Dorkenwald, S, Kuehner, K, Morey, R, Seung, H, et al. Codex: connectome data explorer (2023). doi: 10.13140/RG.2.2.35928.67844 (preprint).
55. Lee, KH, Cha, M, and Lee, BH. Crosstalk between neuron and glial cells in oxidative injury and neuroprotection. Int J Mol Sci. (2021) 22:13315. doi: 10.3390/ijms222413315
56. Hascup, ER, Sime, LN, Peck, MR, and Hascup, KN. Amyloid-β42 stimulated hippocampal lactate release is coupled to glutamate uptake. Sci Rep. (2022) 12:2775. doi: 10.1038/s41598-022-06637-2
57. Mohammad, F, Aryal, S, Ho, J, Stewart, JC, Norman, NA, Tan, TL, et al. Ancient anxiety pathways influence Drosophila defense behaviors. Curr Biol. (2016) 26:981–6. doi: 10.1016/j.cub.2016.02.031
58. Showell, SS, Martinez, Y, Gondolfo, S, Boppana, S, and Lawal, HO. Overexpression of the vesicular acetylcholine transporter disrupts cognitive performance and causes age-dependent locomotion decline in Drosophila. Mol Cell Neurosci. (2020) 105:103483. doi: 10.1016/j.mcn.2020.103483
59. Spasić, MR, Callaerts, P, and Norga, KK. Drosophila alicorn is a neuronal maintenance factor protecting against activity-induced retinal degeneration. J Neurosci. (2008) 28:6419–29. doi: 10.1523/JNEUROSCI.1646-08.2008
60. Dorkenwald, S, McKellar, CE, Macrina, T, Kemnitz, N, Lee, K, Lu, R, et al. FlyWire: online community for whole-brain connectomics. Nat Methods. (2022) 19:119–28. doi: 10.1038/s41592-021-01330-0
Keywords: blue light, environmental stress, rhodopsins, neurodegeneration, mental health, model systems
Citation: Piacenti-Silva M, de Mattos Alves S, Zaparoli HH, de Oliveira M, Morimoto J and Zilli Vieira CL (2025) Role of visual and non-visual opsins in blue light–induced neurodegeneration in Drosophila melanogaster. Front. Public Health. 13:1644780. doi: 10.3389/fpubh.2025.1644780
Edited by:
Paul Ben Ishai, Ariel University, IsraelReviewed by:
Sareesh Naduvil Narayanan, University of Central Lancashire, United KingdomPere Garriga, Universitat Politecnica de Catalunya, Spain
Copyright © 2025 Piacenti-Silva, de Mattos Alves, Zaparoli, de Oliveira, Morimoto and Zilli Vieira. This is an open-access article distributed under the terms of the Creative Commons Attribution License (CC BY). The use, distribution or reproduction in other forums is permitted, provided the original author(s) and the copyright owner(s) are credited and that the original publication in this journal is cited, in accordance with accepted academic practice. No use, distribution or reproduction is permitted which does not comply with these terms.
*Correspondence: Marina Piacenti-Silva, bWFyaW5hLnBpYWNlbnRpQHVuZXNwLmJy; Hulder Henrique Zaparoli, aHVsZGVyLnphcGFyb2xpQHVuZXNwLmJy; Carolina L. Zilli Vieira, Y2F6aWxsaUBoc3BoLmhhcnZhcmQuZWR1