 Kayla E. Tate
 Angel Bassett2
 Kristina S. Petersen
- 1Department of Nutritional Sciences, The Pennsylvania State University, University Park, PA, United States
- 2American Heart Association, Dallas, TX, United States
Introduction: The present study aimed to quantify differences in barriers and facilitators to healthy eating experienced in a U.S. census-representative sample of the general population and a sample of low-income individuals.
Methods: A cross-sectional survey was administered to U.S. adults. Barriers and facilitators to healthy eating were assessed with survey questions pertaining to important and influential attributes for food purchasing, attitudes about food purchasing, and barriers and facilitators to choosing healthy foods. Two samples were recruited: (1) a general sample that was census-representative for age, income, gender, and geographic region approximated from the 2022 US census data (n = 1,182); (2) a low-income sample that reported an income of less than $34,000 per year and participating in federal food or healthcare assistance programs (n = 506). Differences between samples for barriers and facilitators to healthy eating were assessed using chi-square tests for proportions.
Results: Taste and cost were identified as key barriers to healthy eating across all survey questions, and nutritional value of foods was not found to be a priority. Facilitators to healthy eating included having access to budget friendly and good tasting recipes and preparing grocery lists in advance.
Discussion: Future interventions seeking to improve diet quality may benefit from emphasizing flavor and taste as necessary components of healthy eating.
1 Introduction
Cardiometabolic diseases (CMDs) are among the leading causes of death globally and in the US (1), and poor diet quality is a key modifiable risk factor for CMDs (2). Poor diet quality is defined by inadequate intakes of nutrient-dense foods and overconsumption of saturated fat, added sugars and/or sodium (3). While diet quality is sub-optimal across income, race and ethnicity, gender, and age groups in the U.S. (4), disparities in diet quality exist by income (5), race and ethnicity (6), gender identity (7), and age (8). Given these well-established disparities in diet quality, it is important to investigate the unique barriers and facilitators to healthy eating for each demographic group. Understanding these barriers and facilitators may help to inform programs and policies to facilitate a food system that promotes adequate diet quality for all (9).
To understand barriers and facilitators to healthy eating, it is first necessary to consider the determinates of food choice. Food choice is highly complex and is influenced by a wide variety of factors both within and outside of individual control. Determinants of food choice can operate across multiple levels of influence, ranging from systemic and structural factors, including policies and the resulting food environments, to individual factors, such as the physiological experience of hunger (10). A broad framework characterizing the determinates of food choice suggests that factors including the features of foods (i.e., taste, nutritional value, availability), differences between individuals (i.e., nutrition knowledge, preferences, and attitudes), and the effects of societal-level features (i.e., food prices, socioeconomic status) are key determinates driving food choices (11). Determinates of food choice may be barriers or facilitators to choosing and consuming healthy foods. Much work to date has been done to characterize barriers and facilitators to healthy eating in a wide variety of populations, including healthcare workers (12), cancer survivors (13), college students (14), low-income populations (15), and others. Constructs such as food costs, flavor/taste, preparation time, and lack of available healthy options coupled with an abundance of unhealthy options, have all been identified as barriers to healthy eating in several populations (12, 16, 17). Conversely, constructs such as nutrition knowledge, skills, and social support have been identified as facilitators to healthy eating (18).
Many of the prior studies investigating barriers and facilitators to healthy eating have been conducted within specific communities, and may lack generalizability to the US population as a whole, or may lack generalizability to the low-income populations at greatest risk of poor diet quality. Furthermore, much of the evidence base is comprised of studies that have qualitatively investigated barriers and facilitators to healthy eating (15, 17, 19). While qualitative methods provide deeply nuanced perspectives and insights within specific populations, they do not allow for quantitative comparisons of demographic groups within or between populations. As such, there is a current gap in the understanding of what proportion of the US population may be experiencing specific barriers or facilitators for healthy eating, and how these proportions may differ between demographic groups. In addition, it is also not clear how high- and low-income populations differ in terms of the relative proportion of each group facing specific barriers and facilitators to healthy eating. Thus, the present study aims to explore the differences in the proportions of barriers and facilitators to healthy eating reported in a US census-representative sample of the general population and in a sample of low-income individuals. This study also aims to explore the proportions of barriers and facilitators to healthy eating reported by different age groups, races and ethnicities, and gender identities within each sample. Understanding the barriers and facilitators to healthy eating (i.e., the consumption of a high-quality diet) and how they differ across income, race and ethnicity, gender identity, and age groups is expected to assist with the development of interventions for improving diet quality.
2 Methods
2.1 Study overview and participants
A cross-sectional survey of U.S. adults was conducted. Participants were recruited by a market research company (Hanover Research, VA) from a pre-established market research panel between May and June 2023. Participants were asked to complete a 10–12 min online survey provided in English about barriers and facilitators to healthy eating. To prevent duplicate responses or bots, IP addresses were tracked and hidden questions designed to catch bots were included in the survey. The survey began with items assessing eligibility criteria, and if participants were determined ineligible, the survey ended. Participants were eligible if they were at least 18 years old and were the primary or shared decision maker for household food choices. Participants were excluded if they worked in an industry that was believed to influence responses, which is standard practice in market research (20). Industries that were exclusionary were healthcare, nutrition, advertising, public relations, marketing, or market research jobs. Two participant samples were recruited: (1) a general sample (GEN) that was approximately census-representative for age, income, gender, and U.S. geographic region approximated from the 2022 US census data (21) (n = 1,182); (2) a low-income sample (LI) that reported an income of less than $34,000 per year and reported participating in federal food or healthcare assistance programs (n = 506). $34,000 per year was selected as the threshold for defining low-income because this number approximately aligns with census poverty thresholds for a family of four (22). Participants were compensated $2.80 and $4.50 for the GEN and LI samples, respectively. A larger compensation was provided to the LI sample to facilitate participation given the lower response rates for this demographic within the panel system. Study materials were reviewed by Advarra IRB (Columbia, MD) and classified as exempt, under federal regulations [45 CFR 46.104(d)(2)] (23), from IRB oversight.
2.2 Measures
Participants were asked to report demographic characteristics including their race and ethnicity, gender identity, and age group. Race and ethnicity responses included White or Caucasian, Black or African American, Hispanic, Asian, American Indian or Alaska Native, Native Hawaiian or another Pacific Islander, or prefer not to share. Those selecting American Indian or Alaska Native, Native Hawaiian or Pacific Islander, or prefer not to share were grouped together due to low response rates in these categories. Any participants selecting more than one race or ethnicity were categorized as multiracial. Gender identity responses included male, female, non-binary and not listed/prefer to self-describe. Those identifying as non-binary or who indicated a preference to self-describe were grouped into one category due to low response rates in each category. Age was analyzed as a categorical variable (18–24, 25–34, 35–44, 45–54 and ≥55 years) to allow for subgroup analyses. Additional demographic and descriptive questions included level of education (e.g., some high school, high school diploma/GED, some college or post-secondary technical training, 2-year degree, 4-year degree, some graduate school, graduate degree), marital status (e.g., single/never married, married or living as married, separated or divorced, widowed), number of people in the household (e.g., 1 person, 2 people, 3 people, 4 people, 5 or more people), residential area type (e.g., urban area, suburban area, rural area), perceived diet quality (e.g., poor fair, good, very good, excellent) and amount of money spent on groceries per month (e.g., less than $25, $25–$49, $50–$74, $75 to $100, more than $100). For these descriptive questions, participants were presented with a number of responses and instructed to select one option.
Due to a paucity of survey instruments in alignment with the study aims, a novel survey instrument was developed in collaboration with Hanover Research. This instrument was developed through conducting non-systematic literature reviews to identify common barriers and facilitators to healthy eating and incorporating identified barriers into multiple survey domains and items. Expert opinion from authors AB, HG, and CD was also utilized to develop the survey. Barriers and facilitators to healthy eating were assessed with several survey domains, including important attributes for food purchasing, influential attributes for food purchasing, attitudes about food purchasing, healthy eating behaviors, and barriers and facilitators to choosing healthy foods in general (Table 1).
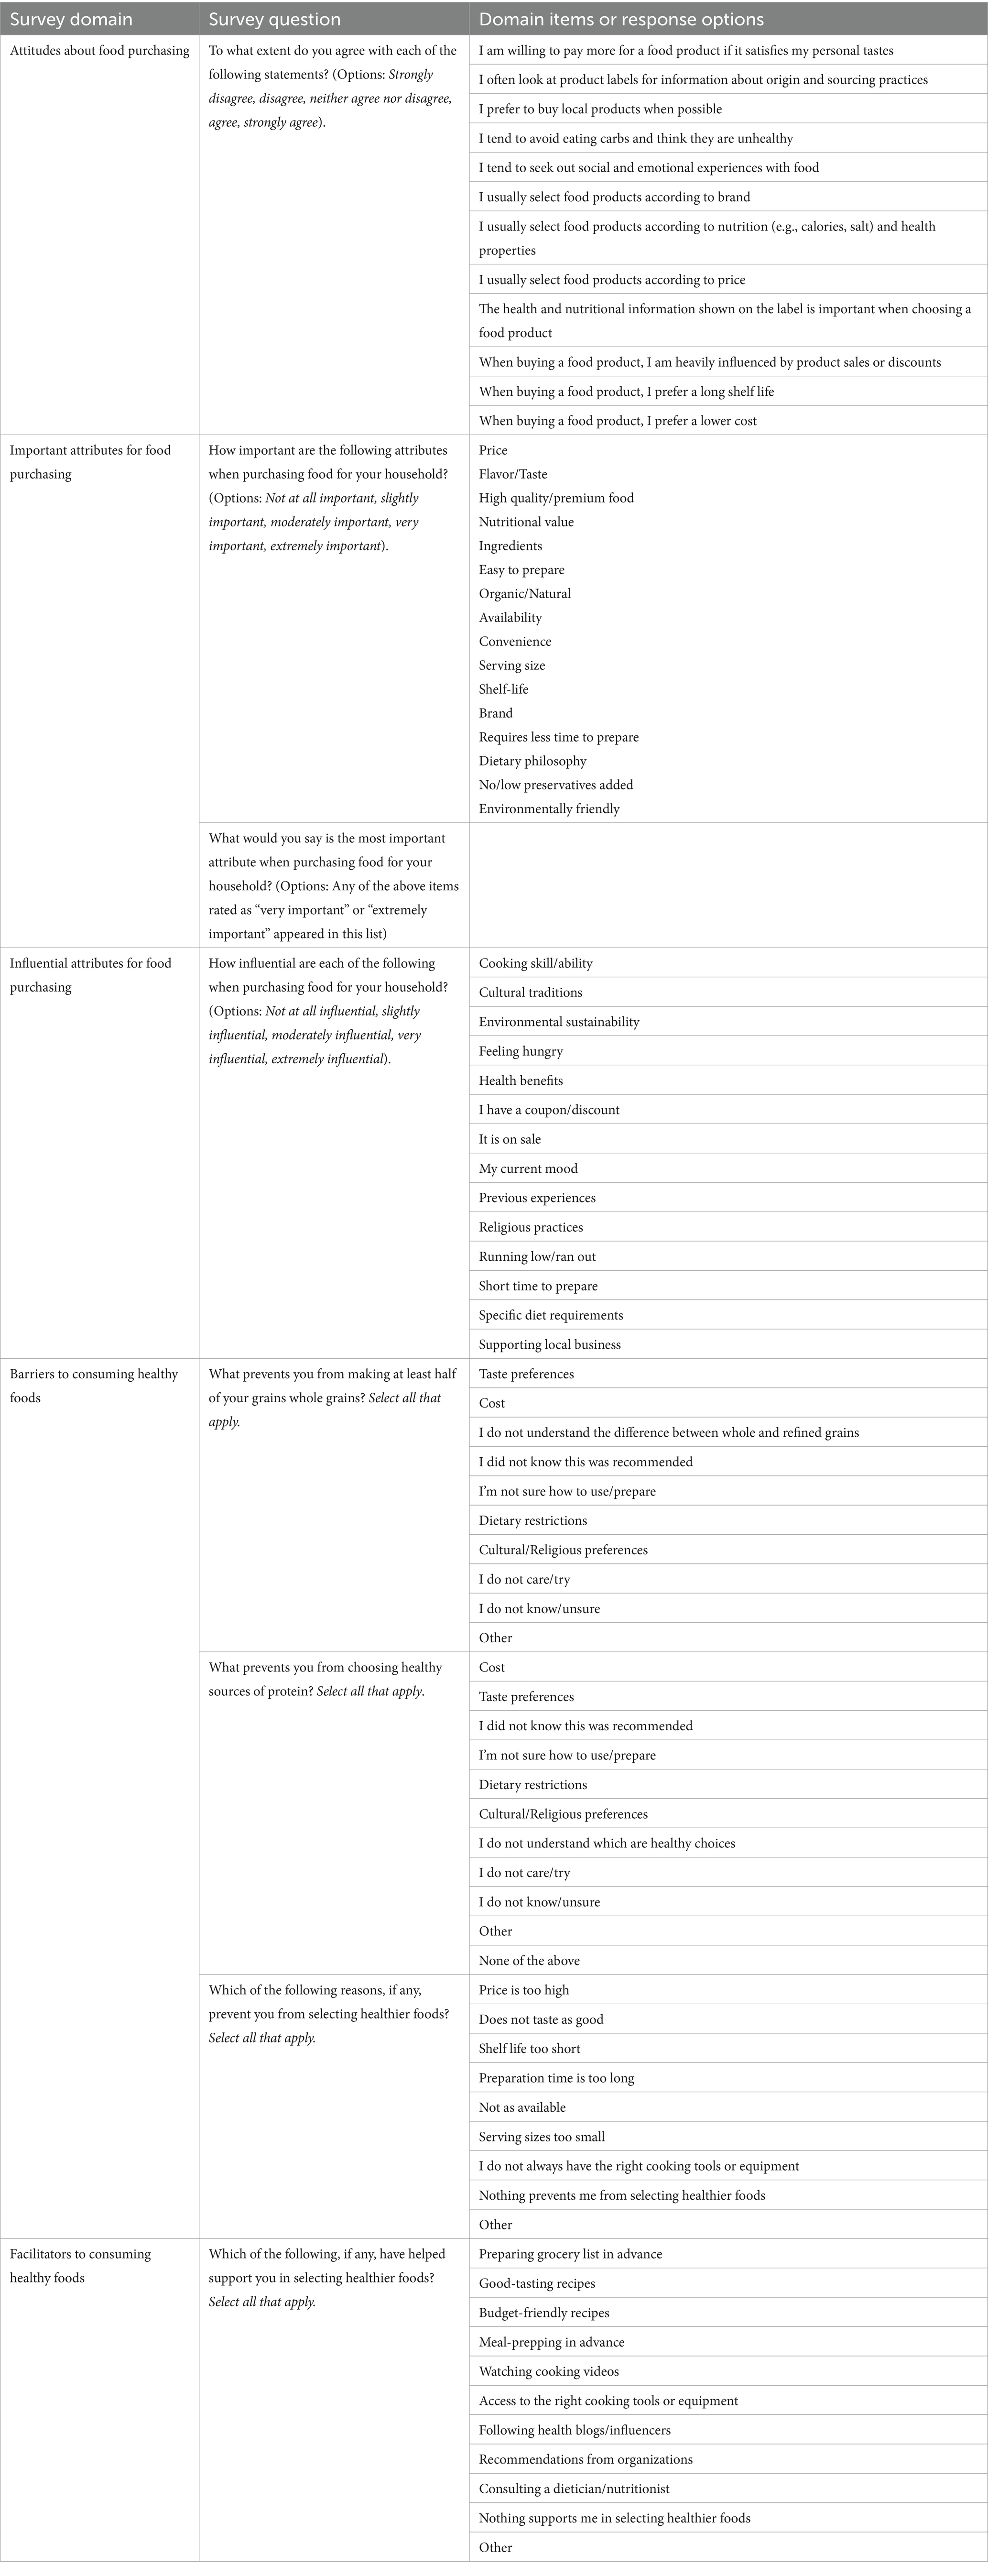
Table 1. Descriptions of survey domains, domain items, and item response options.
Survey domains assessing important and influential attributes for food purchasing and attitudes about food purchasing were each presented as a question (i.e., “How influential/important are each of the following when purchasing food for your household?”) with several items to be rated individually on a 5-point Likert type scale. The important attributes for food purchasing survey domain predominately included items relevant to specific food products (i.e., “brand,” “serving size,” “shelf life” etc.). If participants selected “important” or “very important” for an item under the important attribute’s domain, the item was presented as a response option in the next survey question that asked participants to select the single most important attribute for food purchasing. The influential attributes for food purchasing survey domain included items relevant to how a consumer may make decisions about food purchases, such as consumer beliefs or values (i.e., “health benefits,” “cultural traditions,” “supporting local business” etc.) or current state of the consumer (e.g., “feeling hungry,” “my current mood,” etc.). The attitudes about food purchasing domain asked participants to what extent they agreed with various statements about food purchasing with responses following a 5-point Likert scale. The healthy eating behaviors domain included items relevant for understanding consumer perceptions of and purchasing behaviors, with a focus on whole grains and healthy protein foods as under-consumed food categories in the U.S. The barriers and facilitators to choosing healthy foods in general domain included items relevant for understanding consumer perceptions of barriers and facilitators to choosing healthy foods. The healthy eating behaviors and the barriers and facilitators to healthy eating domains were each presented as multiple items (i.e., “Which of the following, if any, have helped support you in selecting healthier foods?” etc.) with a list of several response options (i.e., “preparing grocery lists in advance” etc.) where participants were instructed to select all responses that applied for each item. See Table 1 for a description of each survey domain, including items with each domain and the response options for each item.
2.3 Statistical analyses
Differences between samples for each survey domain, including descriptive and demographic survey questions, were assessed with chi-square tests for proportions. For survey domains with multiple items (i.e., Likert and Likert-type scales) or multiple response options within each item (i.e., barriers and facilitators to healthy eating), to reduce the total number of statistical tests conducted, only the three items or responses selected by the largest proportions of the samples were assessed for statistical differences. For Likert and Likert-type survey questions (e.g., attitudes, important and influential attributes for food purchasing), responses for each item within the survey domains were converted to binary variables such that one category indicated agreement with or importance/influence of the item, and the other category indicated neutrality/disagreement with or unimportance/noninfluence of the item. Next, the three items within each domain that had the largest proportion of affirmative responses (i.e., agreement or importance/influence) within each sample were identified. Chi-square tests for proportions were used to assess differences in the proportions between each sample for these items. Binary variables were used for the Chi-square tests to assist with meeting cell-count assumptions. For all statistical comparisons, Fisher’s exact tests were used if expected cell count assumptions were not met for chi-square tests. Results were considered statistically significant at α < 0.01 to reduce type I error. Response frequencies for each variable set were also cross-tabulated by sample, age group, race and ethnicity, and gender identity to identify trends between demographics within each sample.
3 Results
3.1 Sample description
In total, 7,546 individuals from the market research panel entered the survey tool, 4,195 were determined to be eligible, and 1,688 completed the survey and were included in the data analysis (GEN: n = 1,182; LI: n = 506). The mean age was similar across the samples (GEN: 48 ± 17.6 y; LI: 48 ± 17.6 y) and both samples were predominately White (Table 2). Samples differed with regard to gender identity, race and ethnicity, level of education, marital status, number of people in the household, residential area type, income level, and benefits, money spent on groceries, and perceived diet quality.
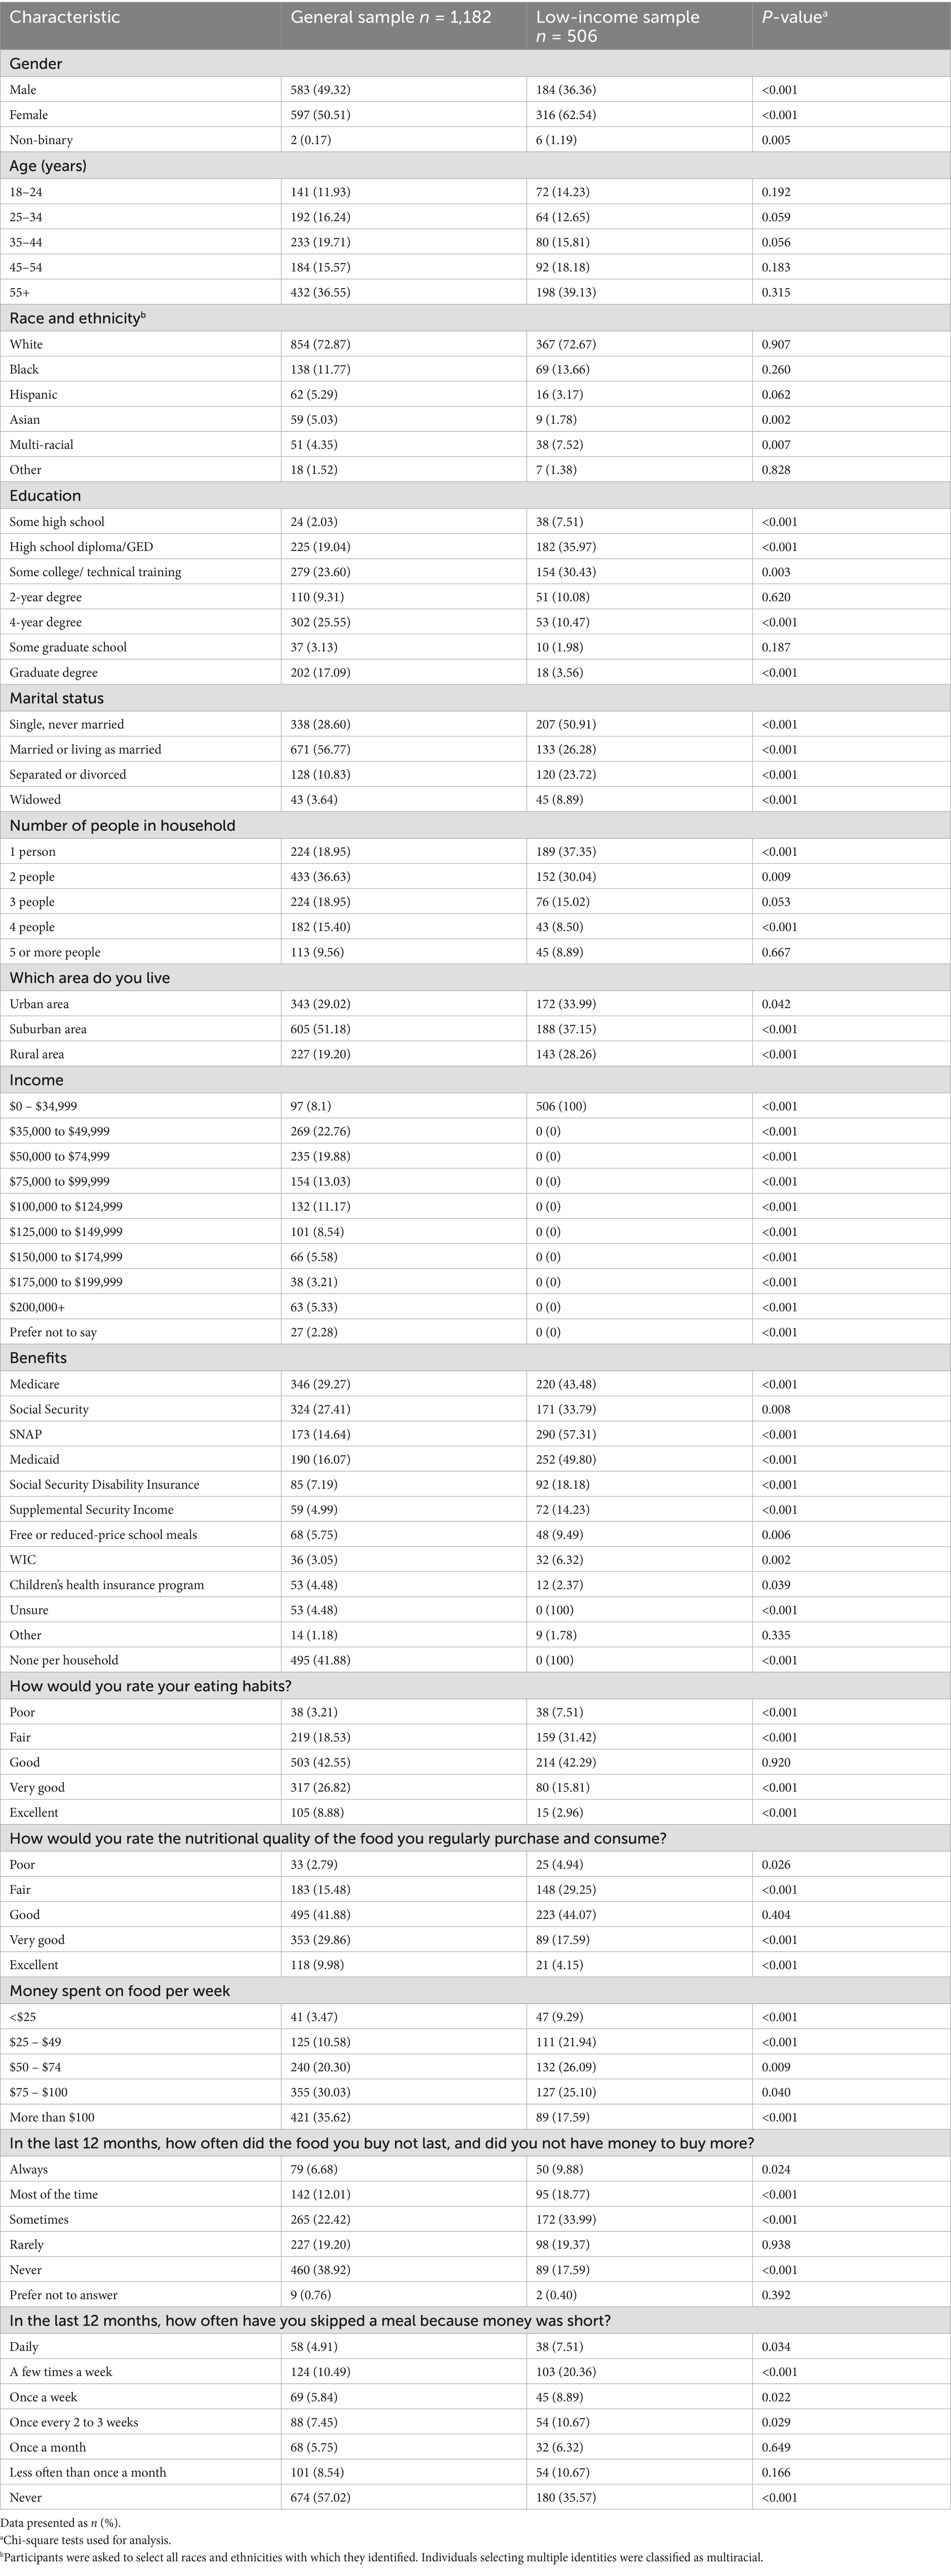
Table 2. Demographic characteristics of the survey respondents by sample.
3.2 Sample comparison results
Important attributes for food purchasing: When asked to rate the importance of food purchasing attributes, the attributes most frequently rated as “very” or “extremely important” for food purchasing in both samples were flavor/taste (GEN: 87.06%; LI: 85.18%), price (GEN: 71.32%; 78.26%), and availability (GEN: 72.25%; LI: 67.19%) (Figure 1). Compared to the general sample, a higher proportion of the low-income sample rated price as an important attribute for food purchasing (+6.94%; p = 0.003). There were no differences between the proportions of each sample that rated availability, or flavor/taste as “very” or “extremely important” for food purchasing. In both samples, across race and ethnicity, gender identity, and age groups, price, flavor/taste, and availability were rated as “very” or “extremely important” for food purchasing by the majority of each demographic (Supplementary Table 1). When asked to select the single most important attribute for food purchasing from the items previously rated as “very” or “extremely important,” the three most frequently selected attributes for food purchasing in the general sample were price (23.51%), flavor/taste (23.08%), and high-quality premium food (13.14%) (Figure 2). For the low-income sample, price (41.87%), flavor/taste (20.52%), and nutritional value (5.89%) were the three most frequently selected attributes (Figure 2).
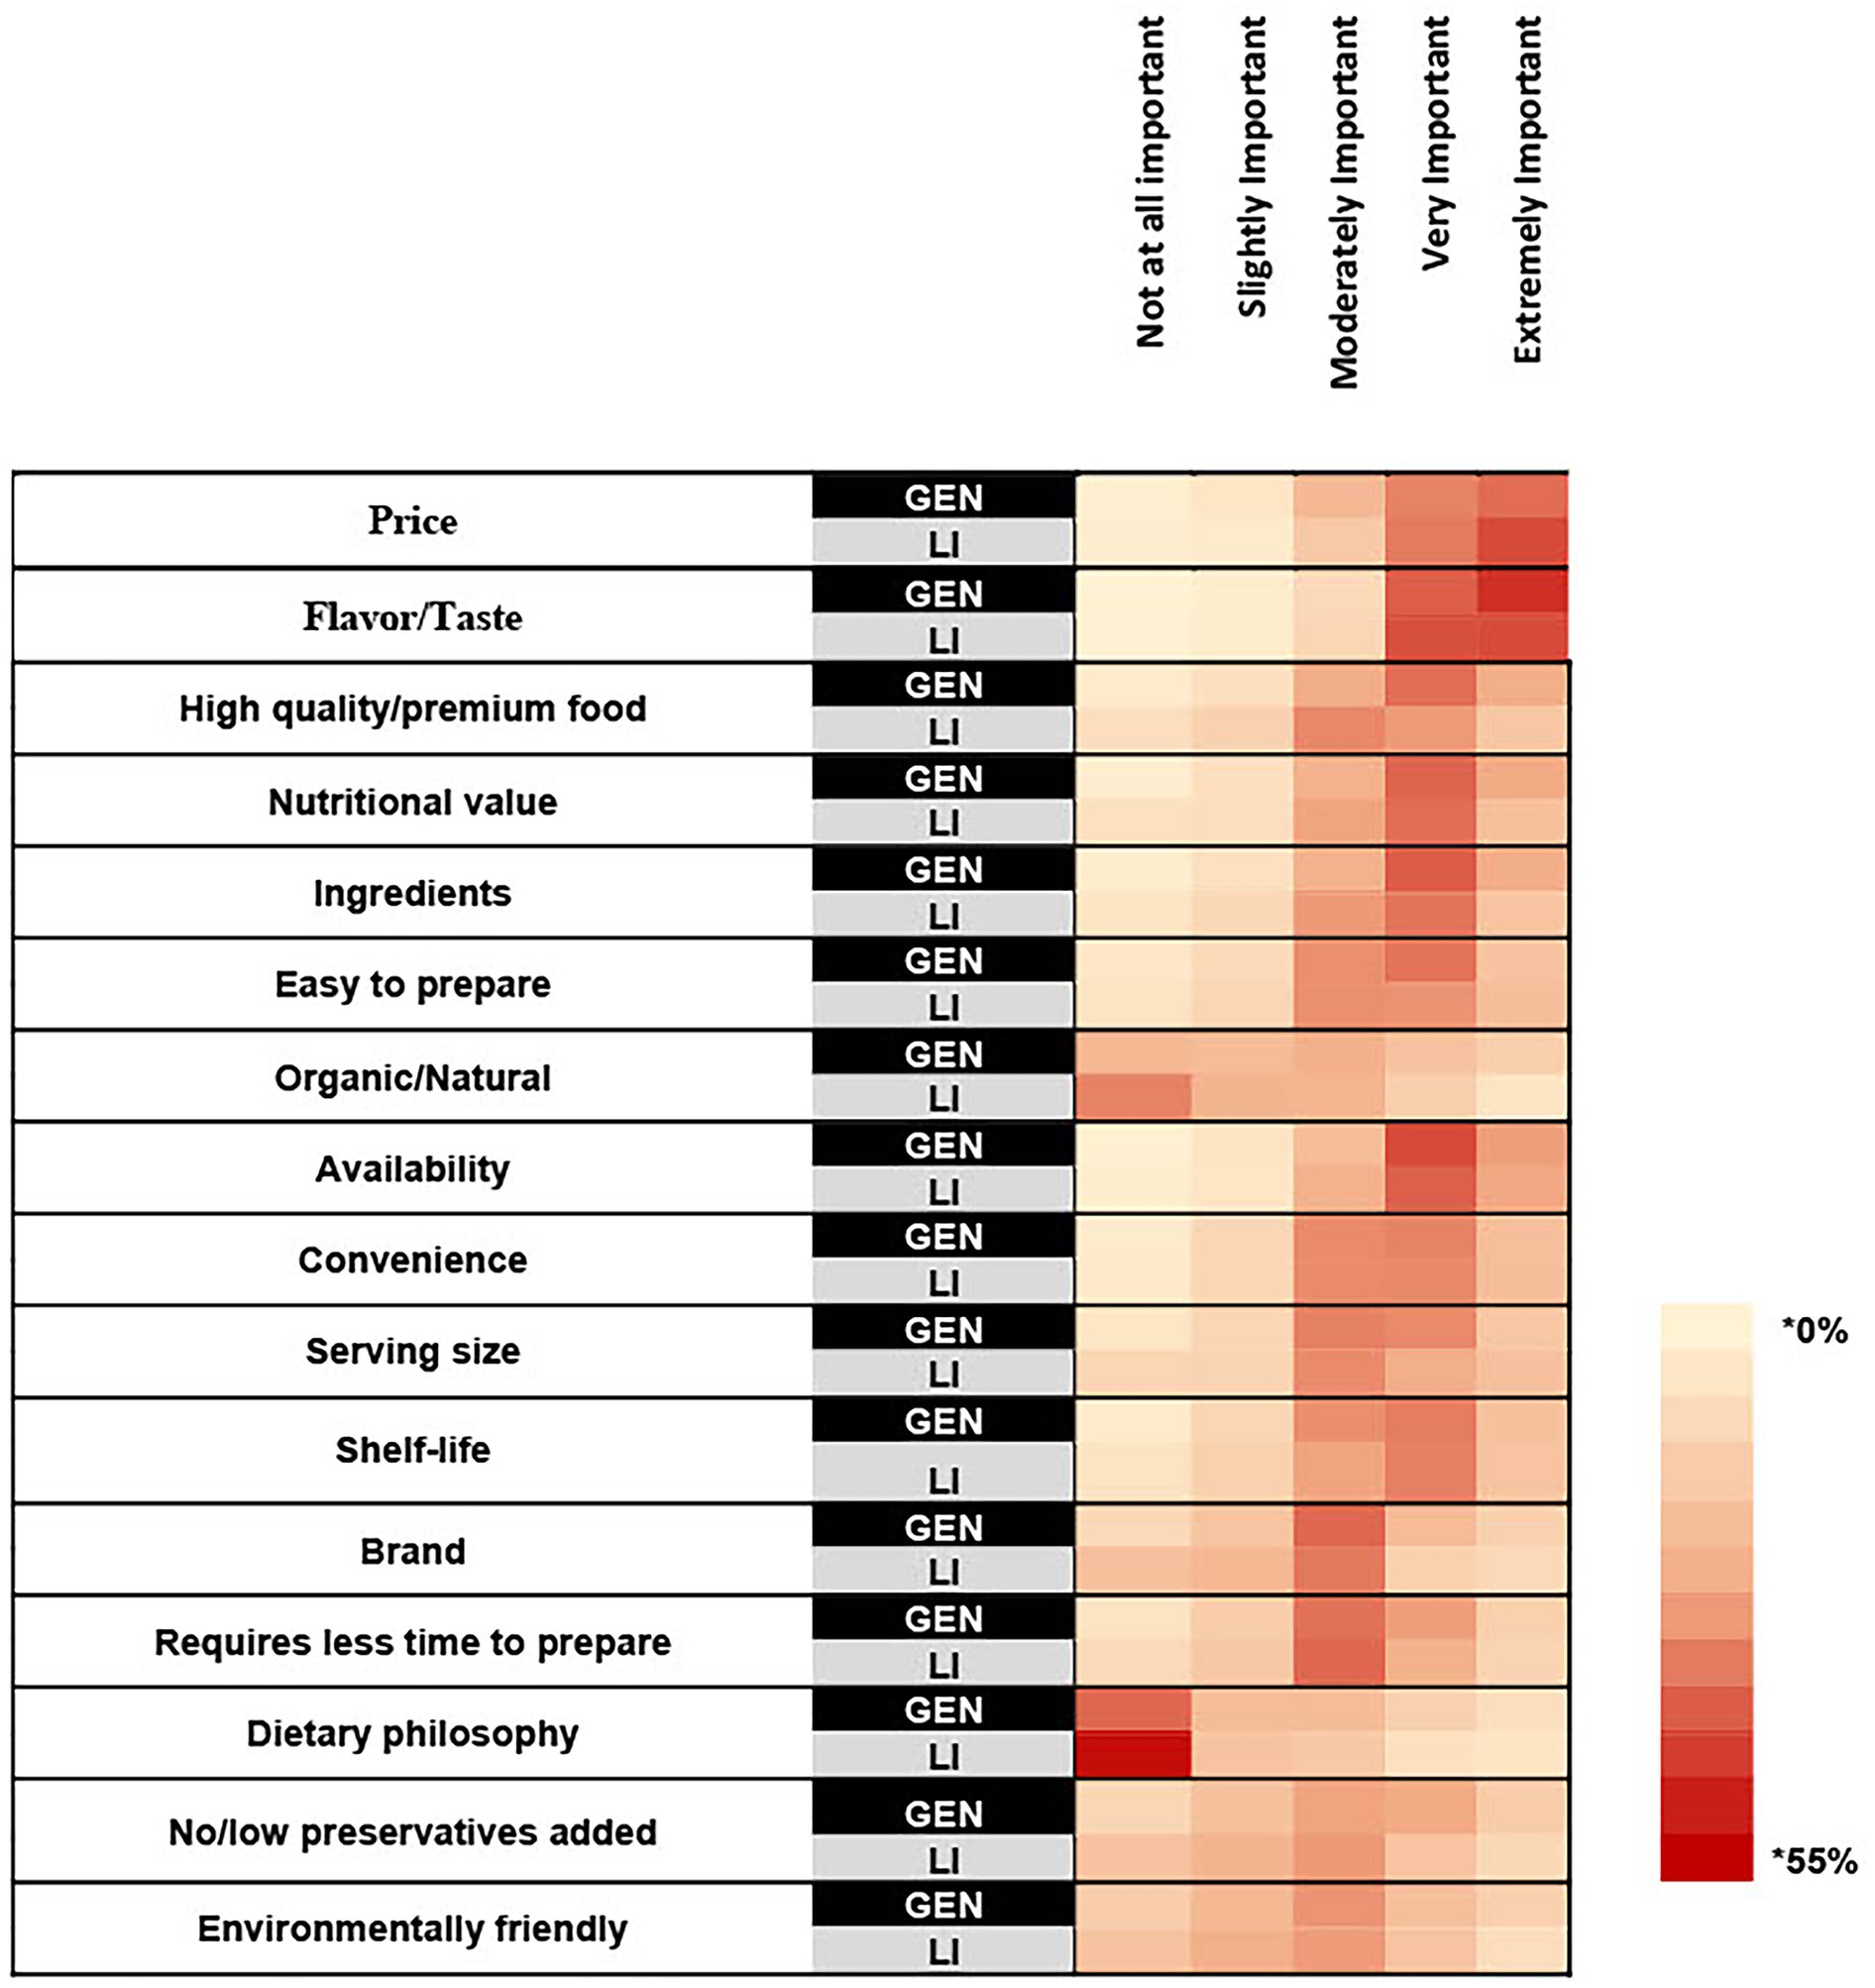
Figure 1. A heat map showing the percentage of respondents within each sample that selected each rating for how important the listed attributes are for household food purchasing. Survey question: How important are the following attributes when purchasing food for your household? * Cell color intensity represents the percentage of respondents within each sample who selected a given importance rating for each attribute. Darker shades indicate higher percentages.
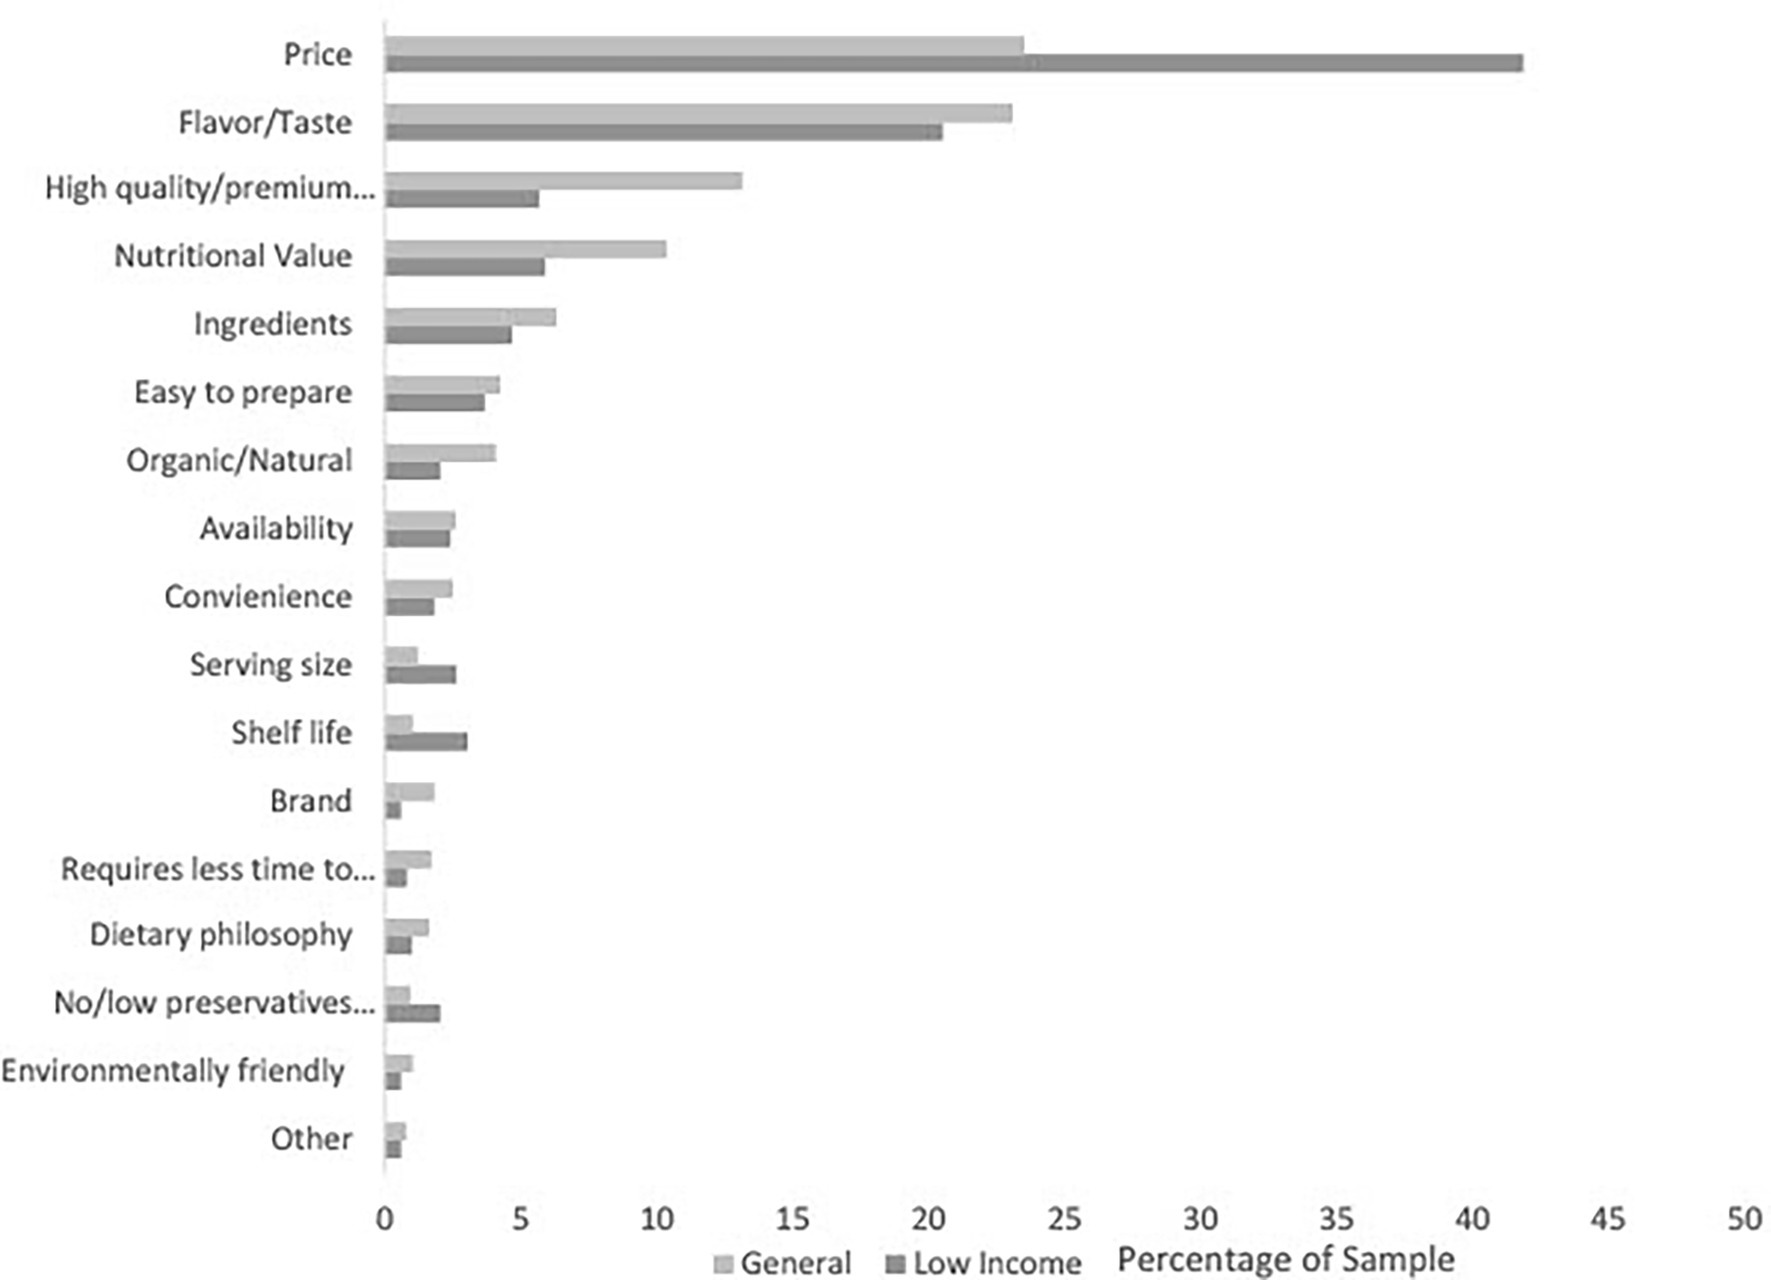
Figure 2. The percentage of respondents who selected each attribute as the most important for household food purchasing by sample.
3.3 Influential attributes for food purchasing
In the general sample, the top three most influential attributes for household food purchasing were “previous experience” (65.40%), “running low/ran out” (63.37%), and “it is on sale” (54.48%) (Figure 3). In the low-income sample, the top three most influential attributes for household food purchasing were “running low/ran out” (60.87%), “it is on sale” (57.71%), and “feeling hungry” (54.94%). A higher proportion of the general sample selected “previous experience,” than the low-income sample, as an influential attribute for household food purchasing (+11.65%; p < 0.001). There were no differences between the proportions of each sample selecting “running low/ran out,” “it is on sale,” and “feeling hungry” as influential attributes for household food purchasing.
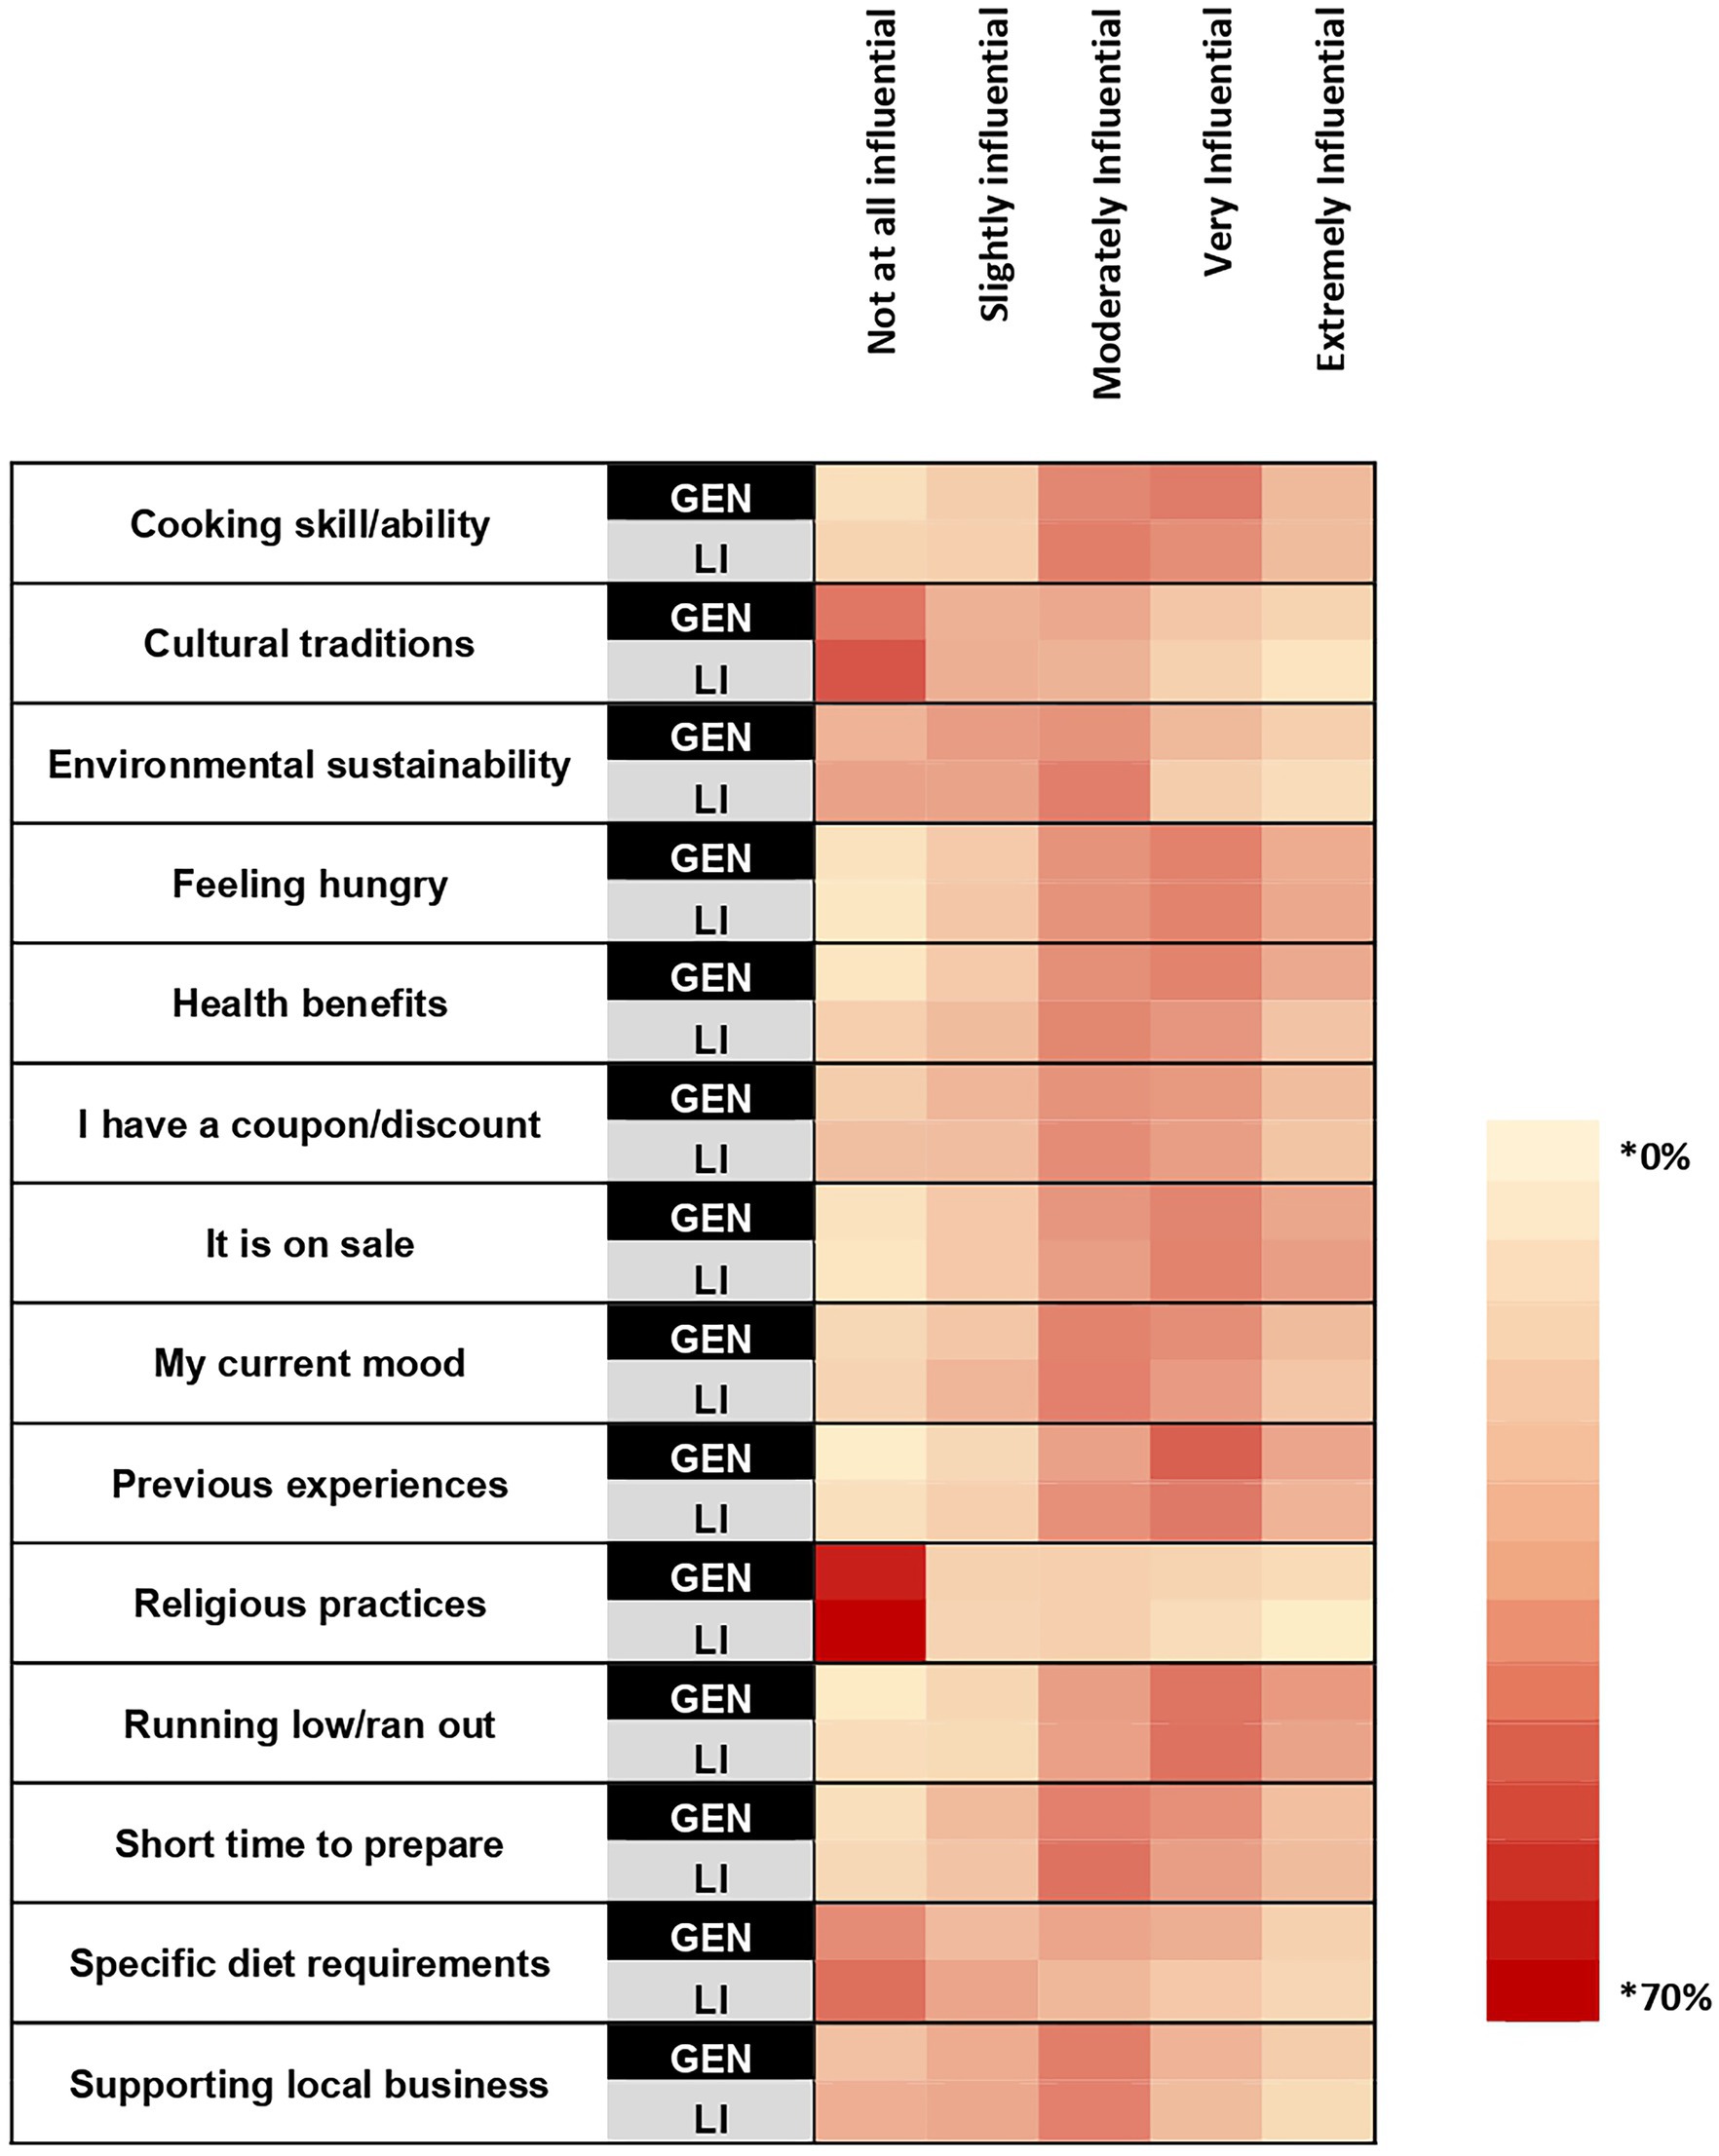
Figure 3. A heat map showing the percentage within each sample that selected each rating for how influential the listed attributes are for household food purchasing. Survey question: How influential are each of the following when purchasing food for your household? * Cell color intensity represents the percentage of respondents within each sample who selected a given importance rating for each attribute. Darker shades indicate higher percentages.
In the general sample, across race and ethnicities, gender identities, and age groups, “previous experience” and “running low/ran out” of a food item were rated by the majority of each group as influential attributes for food purchasing. On the other hand, “it is on sale” was rated as influential by the majority of every demographic, but was not rated as influential by the majority of individuals identifying as American Indian or Alaska Native, Native Hawaiian or another Pacific Islander (Supplementary Table 2). In the low-income sample, the item “it is on sale” was rated as influential by the majority of every demographic group. The item “feeling hungry,” was rated as influential by the majority of every demographic except the 55 or older age group and those identifying as American Indian or Alaska Native, Native Hawaiian or another Pacific Islander. The item “running low/ran out” was rated as influential by the majority of every demographic group except for those identifying as Hispanic (Supplementary Table 2).
3.4 Attitudes about food purchasing
The three most frequently agreed with items in the general sample were “I am willing to pay more for a product if it satisfies my personal tastes” (73.35%), “when buying a food product, I prefer a lower cost” (67.85%), “the health and nutritional information shown on the label is important when choosing a food product” (66.67%) (Figure 4). The three most frequently agreed with items in the low-income sample were “when buying a food product, I prefer a lower cost” (74.31%), “I usually select foods according to price,” (68.58%), and “when buying a food product, I am heavily influenced by product sales or discounts” (65.02%). Higher proportions of the general sample, compared with the low-income sample, agreed with the statements “I am willing to pay more for a product if it satisfies my personal tastes” (+13.86%; p < 0.001) and “The health and nutrition information shown on the label is important when choosing a food product” (+11.93%; p < 0.001). A higher proportion of the low-income sample agreed with the statement “I usually select food products according to price” (+6.82%; p = 0.008). There was no difference between samples for “when buying a food product, I am heavily influenced by product sales or discounts.”
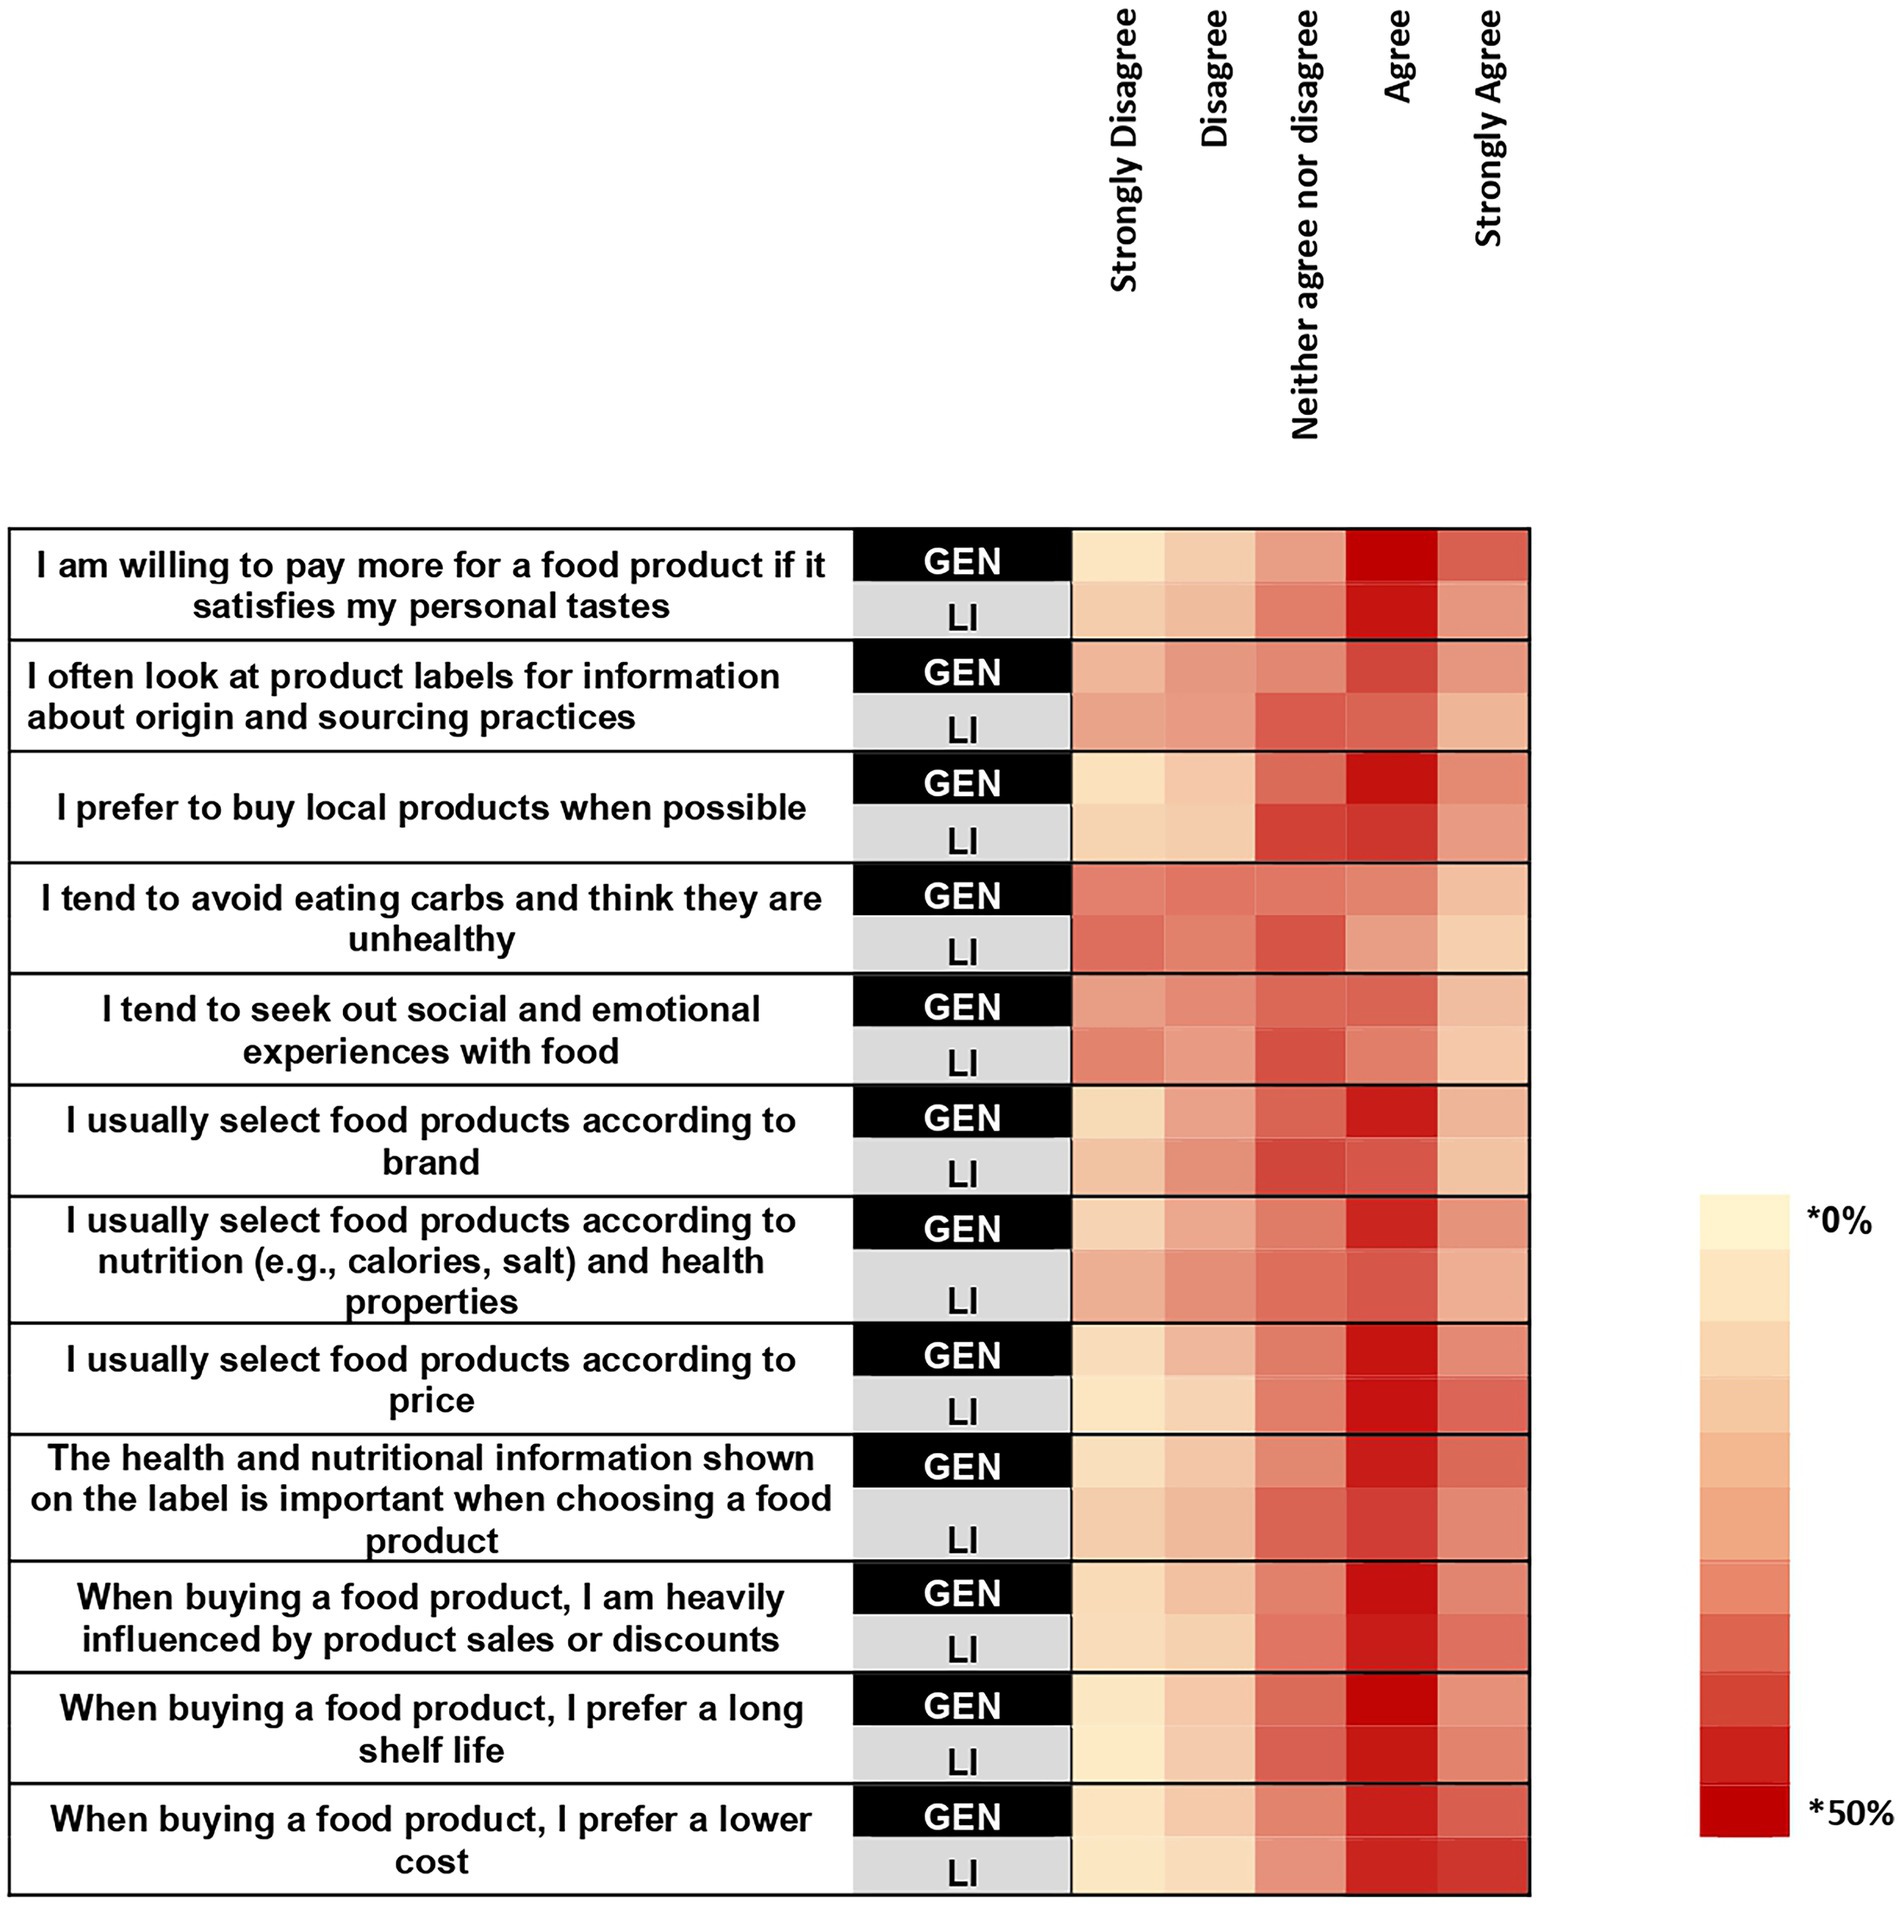
Figure 4. A heat map showing the percentage within each sample that selected each rating for how much they agree with the listed statements. Survey question: To what extent do you agree with each of the following statements? * Cell color intensity represents the percentage of respondents within each sample who selected a given importance rating for each attribute. Darker shades indicate higher percentages.
In the general sample, the items “I am willing to pay more for a product if it suits my personal tastes,” “The health and nutritional information shown on the label is important when choosing a food product,” and “The health and nutritional information shown on the label is important when choosing a food product” were agreed with by the majority of participants within each demographic group (Supplementary Table 3). In the low-income sample, the items “I usually select food products according to price” and “When buying a food product, I prefer a lower cost” were selected by the majority of participants in each demographic group (Supplementary Table 3). The item “When buying a food product, I am heavily influenced by product sales or discounts” was selected by the majority of every demographic group with the exception of those identifying as American Indian or Alaska Native, Native Hawaiian or Pacific Islander (Supplementary Table 3).
3.5 Barriers to healthy eating
In both the general sample and low-income samples, “price too high” (GEN: 53.13%; LI: 69.96%) and “does not taste as good” (GEN: 25.63%; LI: 24.11%) were the top two most frequently selected responses for barriers to healthy eating (Table 3). Reporting that “nothing prevents me from selecting healthier foods” was the third most frequently reported barrier for the general sample (24.37%), and “not as available” was the third for the low-income sample (16.60%). A higher proportion of the low-income sample, than the general sample reported price (+16.83%; p < 0.001) as barriers to choosing healthy foods whereas a higher proportion of the general sample reported nothing as a barrier (+9.15%; p < 0.001). There were no differences between samples in the proportion of each sample selecting “not as available.” Across most age groups, races and ethnicities, and gender identities in both samples, “price is too high” and “does not taste as good” were among the top three most frequently selected barriers (Supplementary Table 4). Within the general sample, the response option “nothing prevents me from selecting healthier foods” was not a top response in each demographic group, and there was variation across age, race and ethnicity, and gender identity groups for other commonly selected barriers.
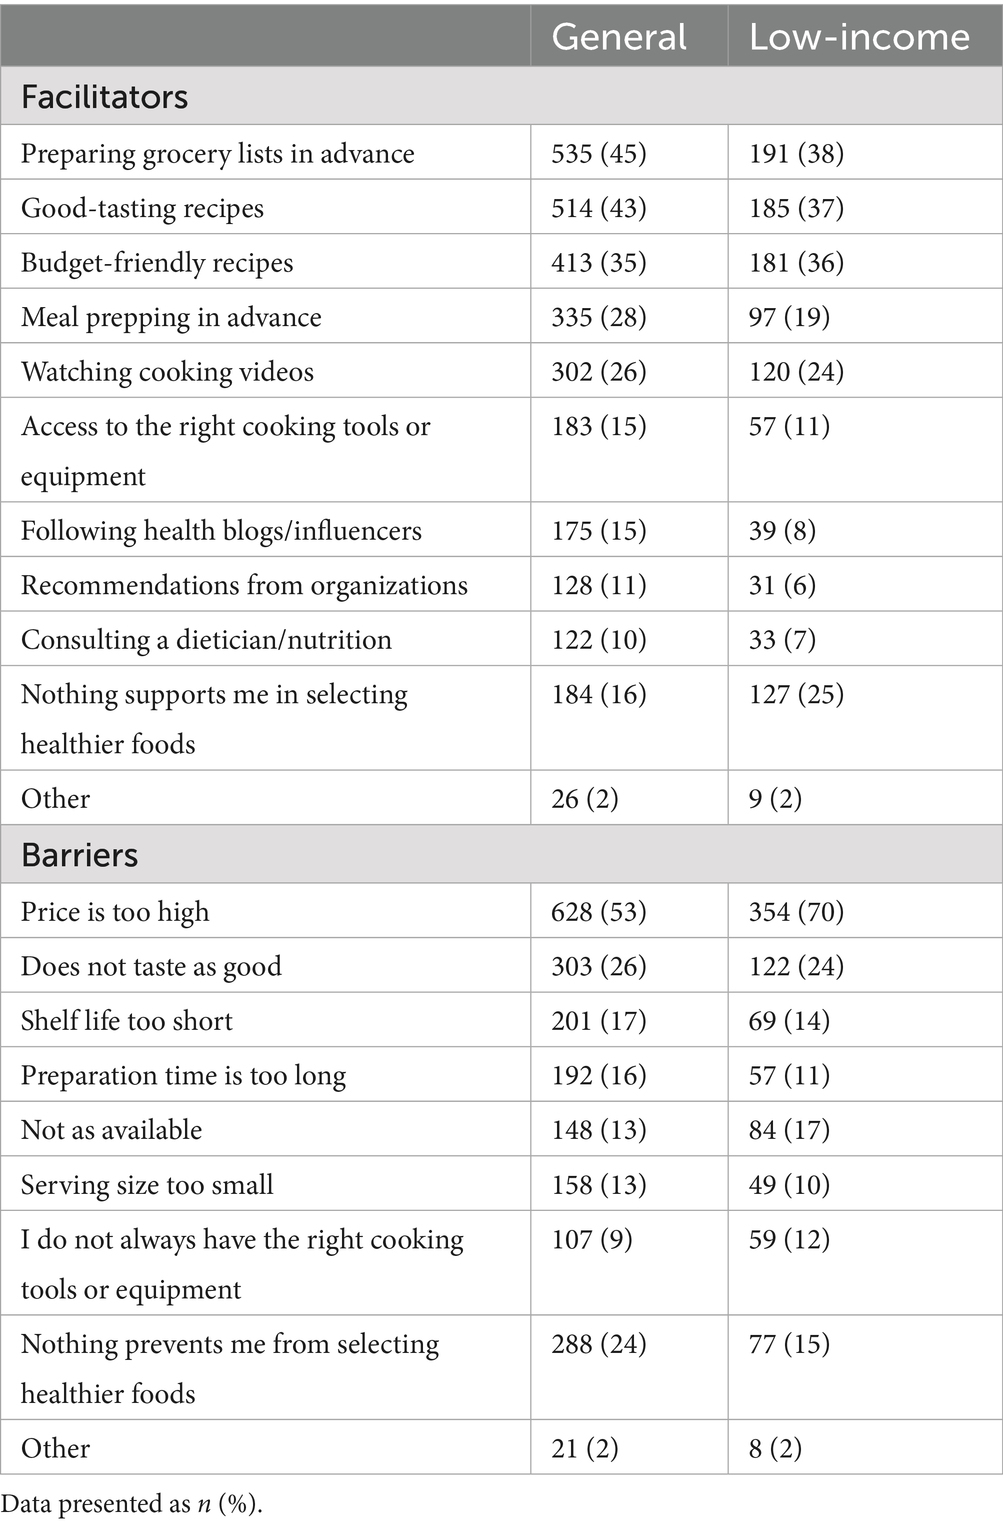
Table 3. Frequency of selecting barriers and facilitators to healthy eating in each sample.
The top three most frequently selected barriers to selecting whole grains in the general sample were taste (19.63%), cost (17.01%), and “I did not know this was recommended” (10.49%) (Table 4). In the low-income sample, the three most frequently selected barriers to choosing whole grains were cost (25.30%), taste (23.32%), and “I do not understand the difference” (13.04%). The top three most frequently selected barriers to selecting healthy proteins in the general sample were taste (19.37%), cost (17.60%), and “I do not care/try” (6.26%). In the low-income sample, the three most frequently selected barriers were cost (29.05%), taste (23.12%), “I do not understand the difference” (8.89%) and “I do not care” (8.89%). Higher proportions of the low-income sample selected cost as a barrier to selecting whole grains (+8.2%; p < 0.001) and proteins (+11.45%; p < 0.001), and not understanding which proteins are healthy choices as a barrier to choosing healthy proteins (+4.32%; p < 0.001). There were no differences between samples for selecting taste, not understanding the difference, and not knowing this was a recommendation as barriers to choosing whole grains. There were no differences for selecting taste or “I do not care/try” as barriers to choosing proteins. In both samples, across most age, race and ethnicity, and gender categories, cost and taste were among the top three most frequently selected barriers to selecting whole grains and healthy proteins (Supplementary Table 5). There was variation between demographic groups for other top barriers identified by each group in each sample.
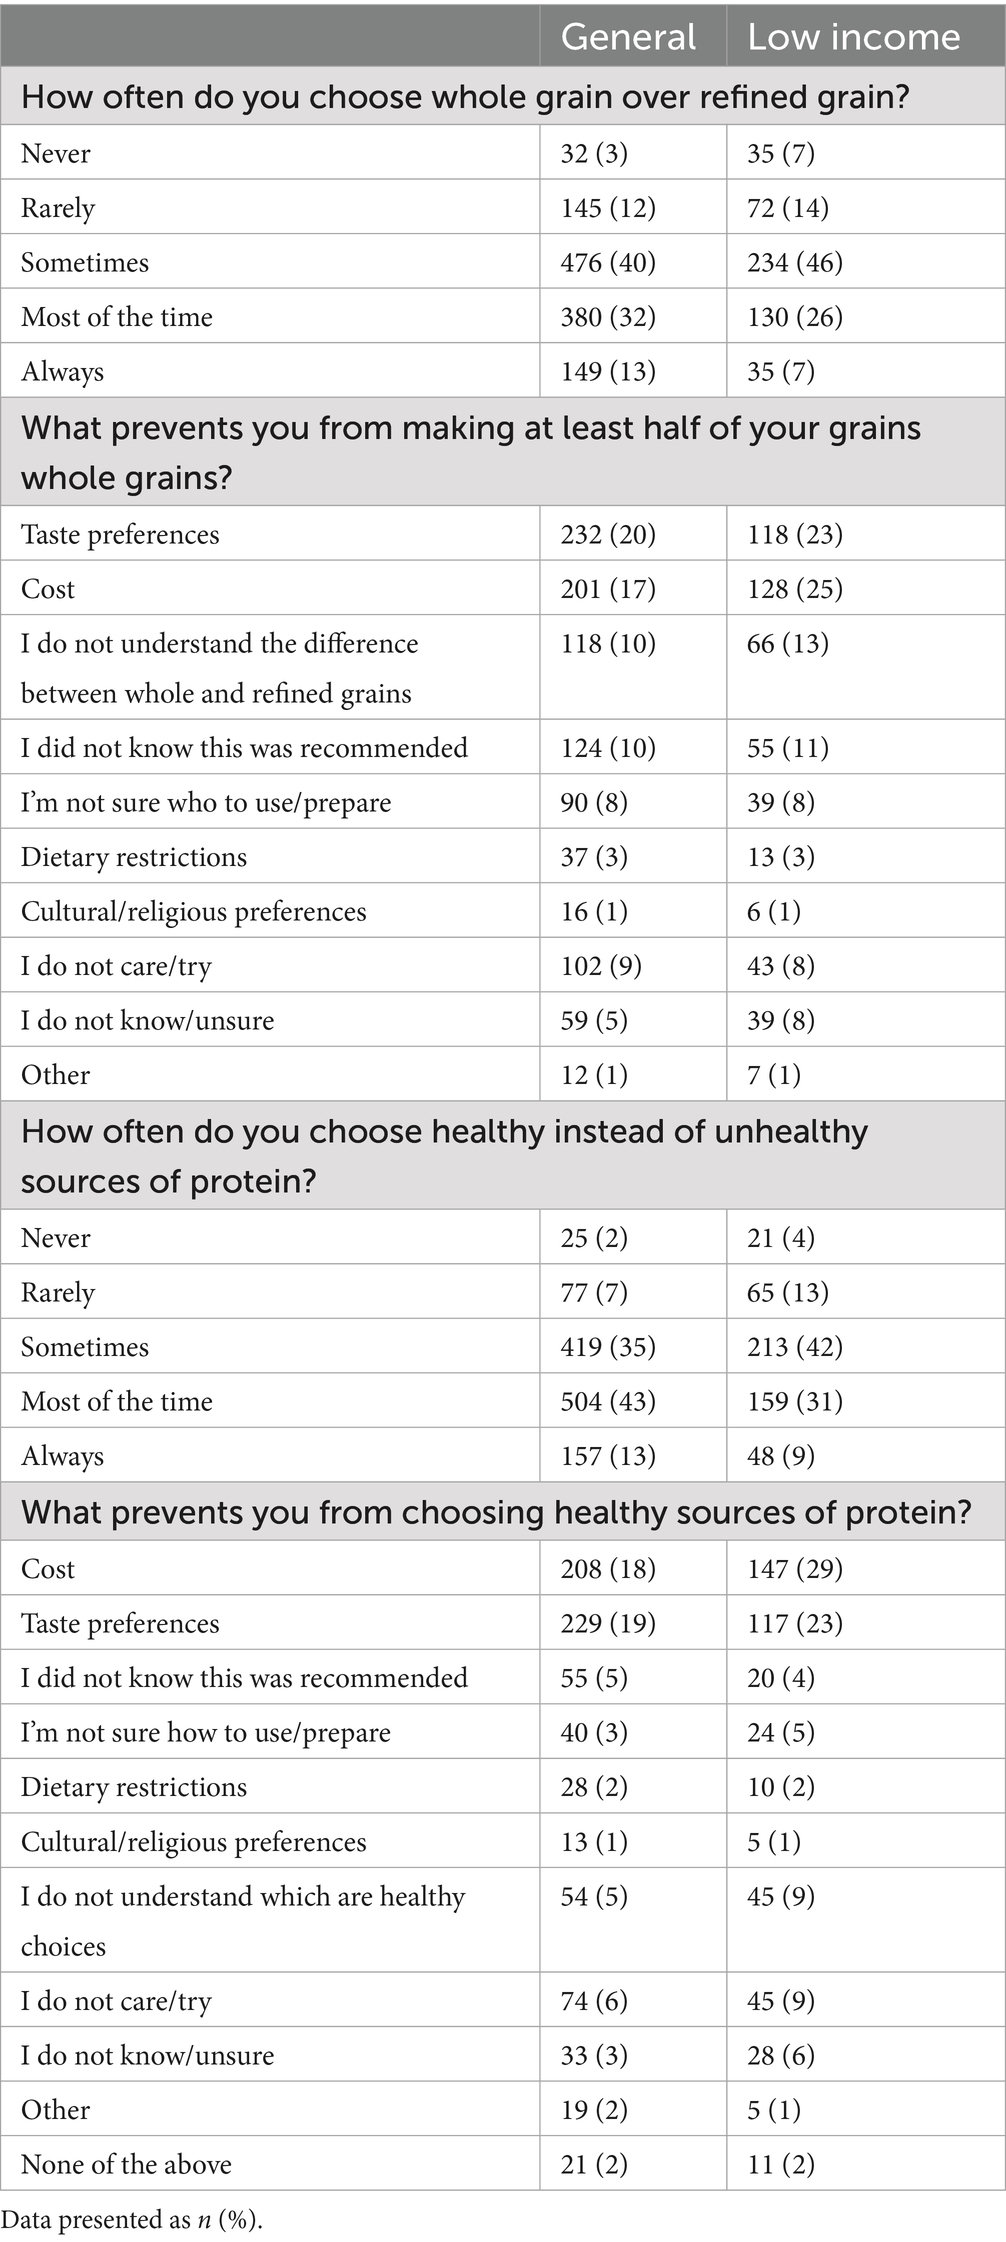
Table 4. Frequency of and barriers to practicing healthy eating behaviors in each sample.
3.6 Facilitators to healthy eating
The top three selected facilitators for healthy eating in both samples were “preparing grocery lists in advance” (GEN 45.26%; LI 37.75%), “good tasting recipes” (GEN 43.49%; LI 36.56%), and “budget friendly recipes” (GEN 34.94%; LI 35.77%) (Table 3). A higher proportion of the general sample selected “preparing lists in advance” (+7.51%; p = 0.004) and “good tasting recipes” (+6.93%; p = 0.008) as supports and there were no differences between samples in the proportion selecting “budget friendly recipes” as a support. For facilitators to healthy eating, in the general sample, “preparing grocery lists in advance” was a top response in all demographic groups except for individuals identifying as multi-racial. The response “good tasting recipes,” was a top response in every demographic group except those identifying as non-binary, and “budget friendly recipes” was a top response for all demographic groups except for those identifying as multi-racial or those identifying as American Indian or Alaska Native, Native Hawaiian or Pacific Islander (Supplementary Table 4). In the low-income sample, “preparing grocery lists in advance” was a top response among most demographics, except the 18–24 age group, and those identifying as Hispanic, Asian, or Men. The response “Good tasting recipes” was a top response for all demographics except those identifying as American Indian or Alaska Native, Native Hawaiian or Pacific Islanders, and the response “budget-friendly recipes was a support among all demographics except for individuals identifying as Black.
4 Discussion
This study aimed to explore differences in barriers and facilitators to healthy eating between a US census-representative sample of the general population and a sample of low-income individuals receiving federal benefits, and to explore barriers and facilitators to healthy eating between demographic groups within each sample. Taste and cost constraints were consistently identified as barriers to choosing healthy foods in both the general and low-income samples and between all demographic groups within each sample. Larger proportions of participants in the low-income sample than the general sample reported cost as a barrier to healthy eating whereas there were no differences between the samples for reporting taste as a barrier to healthy eating. The availability of healthy foods was also found to be a barrier to healthy eating in both samples. Furthermore, while the majority of both samples agreed that the health and nutritional information on food labels is important, the overall percentage of each sample selecting nutritional value as the most important attribute for food purchasing was small. In addition, it was found that preparing grocery lists in advance and having access to good tasting and budget friendly recipes were supports to healthy eating in both samples. Taken together, these findings suggest food purchasing priorities for consumers are centered on the cost and taste of foods, are not centered on nutritional value, and may be influenced by healthy food availability.
The findings that cost and taste are top food purchasing priorities and barriers (real or perceived) to healthy eating are consistent with other studies in a wide variety of populations (17, 24–27). Furthermore, in the yearly Food and Health Survey completed by the International Food Information Council (IFIC) that assesses consumer attitudes toward food, nutrition and health, taste and food price have been ranked as the top two most important drivers for food purchasing decisions since 2006 (28). Additionally, it is also important to note that cost and taste priorities have been consistently rated as more important than priorities such as healthfulness, convenience, and environmental sustainability (28). In the present study, although cost was identified as a barrier to healthy eating in both samples and across all demographic groups, it was selected by a larger proportion of the low-income sample. This finding is consistent with other studies that suggest cost is a barrier of critical significance for those with a low-income receiving federal benefits, such as SNAP (29). Furthermore, the importance of cost as a determinate of food choice can also be observed when considering diet quality or nutrition security trends by socioeconomic status. Specifically, although diet quality is low across all socioeconomic gradients in the U.S., it is considerably worse in lower socioeconomic status households relative to higher socioeconomic status households (30).
In addition to cost, the taste and availability of healthy foods were also identified as key barriers to healthy eating. A large body of evidence suggests that taste preference is a key determinate of food choice (31–33). Although there are a wide variety of tasty healthy food options, healthy foods are thought to be “less tasty” than unhealthy foods (34), which may reduce consumption of healthy options, such as fruits and vegetables (35), whole grains (36), and lean proteins (37). Thus, it is unsurprising that taste was identified as a barrier to choosing healthy foods across samples, age groups, race and ethnicities, and gender identities. Perceptions that unhealthy foods are tasty, and healthy foods are not, may be directly related to the ubiquitous presence of foods that are both unhealthy and tasty in the food environment (38). Thus, the proportional availability of unhealthy relative to healthy foods in the current food environment is likely a driver of taste preferences and thus food choice. Indeed, perceptions of the taste-health relationship can be altered by more frequent exposures to healthy tasty foods (38).
Beyond cost, taste, and availability, there are other barriers that may make consuming a healthy diet difficult or unachievable in low-income populations receiving federal benefits. One such example is the time constraints associated with meal preparation (26, 29, 39, 40). While previous literature has identified time constraints associated with food preparation as a barrier to healthy eating (17, 41), this was not a barrier identified by the present study. Specifically, items related to time constraints for meal preparation, such as “short preparation time,” or “convenience,” were not found to be top ranked attributes of influence for household food purchasing in either sample or across demographic categories. One potential explanation for the discrepancy in these findings is that this survey was not validated. Thus, the items designed to capture the importance of time constraints in meal preparation may not reflect participants’ true beliefs or attitudes about the influences of this barrier on healthy food choices.
In addition to identifying barriers to healthy eating, the present study also identified facilitators to selecting healthy foods. Specifically, having access to good tasting and budget-friendly recipes in addition to planning grocery lists in advance were identified as supports to choosing healthy foods in both samples. In other populations, supports to healthy eating often center on increased availability of healthy food options (42–45). Although (lack of) availability was assessed as a barrier to choosing healthy foods, increased availability was not a construct assessed as a facilitator to choosing healthy foods in the present study. While recipes for tasty and budget-friendly foods are not increasing the physical presence of food items in communities, providing examples of meals that are tasty, healthy, and budget-friendly may increase perceived accessibility of healthy eating through promoting self-efficacy. In a recent systematic review investigating the effects of culinary education interventions on dietary intake and behavior it was found that culinary focused interventions increased self-efficacy and attitudes around healthy eating, which translated to improved diet quality (46). Taken together, more research is needed to confirm that providing good tasting and budget friendly recipes increases the perceived accessibility of healthy eating and thus serves to facilitate healthy eating and improved diet quality.
Collectively, the findings of this study add to the literature by confirming and quantifying taste, cost and availability as barriers to healthy eating. As such, focusing interventions on addressing concerns regarding taste, cost and availability may be promising directions for future studies seeking to improve diet quality. Specifically, emphasizing the taste of healthy foods rather than their health benefits, and focusing on reducing the costs and increasing the availability of healthy foods may be beneficial intervention targets to improve diet quality. In alignment, an intervention designed to increase vegetable intake in a food buffet found that taste-focused labels increased vegetable intake by 29 and 14% when compared with health-focused or basic labels, respectively (47). Regarding cost and availability as barriers to healthy diets, it is currently not clear how to best address these barriers from an intervention perspective. While monetary food assistance programs are known to improve food security, evidence is mixed for their effects on diet quality (48), which may be in part because the food environment is characterized by an over-abundance of energy-dense, nutrient-poor foods (49). In contrast, limited evidence suggests diet quality may be modestly increased through providing subsidized subscriptions to community supported agriculture programs (50), or through providing fruit and vegetable vouchers (51) or prescriptions (52). Taken together, more research is needed to best understand how to effectively address the cost and availability of healthy foods as barriers to healthy eating within the context of the current food environment.
The present study must be considered in light of its strengths and limitations. In terms of its strengths, this study had a large sample size that allowed for quantitative comparisons between a general and a low-income sample of US adults. This is a strength because through providing quantitative comparisons between these populations, this study offers novel contributions to an evidence base largely comprised of qualitative findings. Specifically, this study highlights that cost and taste are critical barriers to healthy eating across multiple levels of income, and across multiple demographic groups in the US. Thus, quantifying the proportion of individuals experiencing cost and taste as barriers to healthy eating within these demographics highlights the utility of cost and taste as critical intervention targets for improving population-level diet quality.
This study has several limitations. First, the survey instrument used in this study has not been validated for the constructs assessed, and it is unclear if the questions were received as intended. In addition, there may have been constructs, such as time constraints and availability, that were not adequately assessed with this instrument. However, the strong emergence of cost and taste as barriers to healthy eating across all survey items and the concordance between these findings and the larger body of literature in this area indicate that the constructs of taste and cost were adequately assessed by this survey instrument. Second, while the general sample was census representative for some characteristics, both the general and low-income samples were predominately White, which limits the generalizability of these results to other racial and ethnic groups. Next, the criteria used to define the low-income population may not have adequately captured individuals experiencing poverty, because census poverty thresholds are determined by income in addition to family size. Thus, selecting one income threshold for all individuals regardless of family size is a limitation. This limitation was mitigated through the additional requirement of receiving federal benefits to be classified as low-income in the present study. Lastly, it is a limitation that frequency of skipping a meal was used as a proxy for food insecurity in place of using a validated food insecurity assessment tool.
In conclusion, taste and cost were frequently reported barriers to choosing healthy foods in both a general and a low-income sample of U.S. adults, although cost was a barrier to a larger proportion of the low-income sample than the general sample. Future interventions focusing on improving diet quality may benefit from considering cost and taste as critical barriers to healthy eating.
Data availability statement
The original data will be shared upon reasonable request to the corresponding author.
Ethics statement
The requirement of ethical approval was waived by Advarra IRB (Columbia, MD) under federal regulations [45 CFR 46.104(d)(2)]. The study was conducted in accordance with the local legislation and institutional requirements. The participants provided their written informed consent to participate in this study.
Author contributions
KT: Formal analysis, Visualization, Writing – original draft, Writing – review & editing. AB: Conceptualization, Project administration, Writing – original draft, Writing – review & editing. HG: Writing – original draft, Writing – review & editing. CT: Writing – original draft, Writing – review & editing. KP: Formal analysis, Supervision, Visualization, Writing – original draft, Writing – review & editing.
Funding
The author(s) declare that financial support was received for the research and/or publication of this article. This work was supported by the American Heart Association and the Pennsylvania State University.
Acknowledgments
The authors would like to thank the following individuals for their contribution to the conceptualization of the consumer research study: Kristen Dammann, PhD, RD, Cargill, Inc.; Hamed Faridi, PhD, McCormick Science Institute; Mickey Rubin, PhD, Egg Nutrition Center.
Conflict of interest
The authors declare that the research was conducted in the absence of any commercial or financial relationships that could be construed as a potential conflict of interest.
Generative AI statement
The authors declare that no Gen AI was used in the creation of this manuscript.
Publisher’s note
All claims expressed in this article are solely those of the authors and do not necessarily represent those of their affiliated organizations, or those of the publisher, the editors and the reviewers. Any product that may be evaluated in this article, or claim that may be made by its manufacturer, is not guaranteed or endorsed by the publisher.
Supplementary material
The Supplementary material for this article can be found online at: https://www.frontiersin.org/articles/10.3389/fpubh.2025.1648218/full#supplementary-material
References
1. GBD 2021 Causes of Death Collaborators. Global burden of 288 causes of death and life expectancy decomposition in 204 countries and territories and 811 subnational locations, 1990–2021: a systematic analysis for the global burden of disease study 2021. Lancet. (2024) 403:2100–32. doi: 10.1016/S0140-6736(24)00367-2
2. GBD 2017 Diet Collaborators. Health effects of dietary risks in 195 countries, 1990-2017: a systematic analysis for the global burden of disease study 2017. Lancet. (2019) 393:1958–72. doi: 10.1016/S0140-6736(19)30041-8
3. Dietary Guidelines Advisory Committee. Scientific report of the 2020 dietary guidelines advisory committee: Advisory report to the secretary of agriculture and the secretary of health and human services. Washington, DC: U.S. Department of Agriculture, Agricultural Research Service (2020).
4. Liu, J, and Mozaffarian, D. Trends in diet quality among U.S. adults from 1999 to 2020 by race, ethnicity, and socioeconomic disadvantage. Ann Intern Med. (2024) 177:841–50. doi: 10.7326/M24-0190
5. Arjvand, F, Moeeni, M, Najafi, B, and Nosratnejad, S. Factors affecting inequality in the quality diets: a scoping review. Value Health Reg Issues. (2023) 37:105–12. doi: 10.1016/j.vhri.2023.05.003
6. Tao, MH, Liu, JL, and Nguyen, UDT. Trends in diet quality by race/ethnicity among adults in the United States for 2011-2018. Nutrients. (2022) 14:4178. doi: 10.3390/nu14194178
7. Fenton, S, Ashton, LM, Lee, DCW, and Collins, CE. Gender differences in diet quality and the association between diet quality and BMI: an analysis in young Australian adults who completed the healthy eating quiz. J Hum Nutr Diet. (2024) 37:943–51. doi: 10.1111/jhn.13309
8. Hiza, HA, Casavale, KO, Guenther, PM, and Davis, CA. Diet quality of Americans differs by age, sex, race/ethnicity, income, and education level. J Acad Nutr Diet. (2013) 113:297–306. doi: 10.1016/j.jand.2012.08.011
9. Biden-Harris Administration. Biden-Harris administration National Strategy on hunger. Washington, D.C: Nutrition and Health (2022).
10. Symmank, C, Mai, R, Hoffmann, S, Stok, FM, Renner, B, Lien, N, et al. Predictors of food decision making: a systematic interdisciplinary mapping (SIM) review. Appetite. (2017) 110:25–35. doi: 10.1016/j.appet.2016.11.023
11. Chen, PJ, and Antonelli, M. Conceptual models of food choice: influential factors related to foods, individual differences, and society. Foods. (2020) 9:1898. doi: 10.3390/foods9121898
12. Marko, S, Wylie, S, and Utter, J. Enablers and barriers to healthy eating among hospital nurses: a systematic review. Int J Nurs Stud. (2023) 138:104412. doi: 10.1016/j.ijnurstu.2022.104412
13. Keaver, L, Douglas, P, and O’Callaghan, N. Perceived barriers and facilitators to a healthy diet among Cancer survivors: a qualitative exploration using the TDF and COM-B. Dietetics. (2023) 2:123–39. doi: 10.3390/dietetics2010010
14. Drzal, N, Kerver, JM, Strakovsky, RS, Weatherspoon, L, and Alaimo, K. Barriers and facilitators to healthy eating among college students. Nutr Res. (2025) 133:161–71. doi: 10.1016/j.nutres.2024.06.001
15. Briazu, RA, Masood, F, Hunt, L, Pettinger, C, Wagstaff, C, and McCloy, R. Barriers and facilitators to healthy eating in disadvantaged adults living in the UK: a scoping review. BMC Public Health. (2024) 24:1770. doi: 10.1186/s12889-024-19259-2
16. Grady, A, Jackson, JK, Lum, M, Delaney, T, Jones, J, Kerr, J, et al. Barriers and facilitators to the implementation of healthy eating, physical activity and obesity prevention policies, practices or programs in family day care: a mixed method systematic review. Prev Med. (2022) 157:107011. doi: 10.1016/j.ypmed.2022.107011
17. Zorbas, C, Palermo, C, Chung, A, Iguacel, I, Peeters, A, Bennett, R, et al. Factors perceived to influence healthy eating: a systematic review and meta-ethnographic synthesis of the literature. Nutr Rev. (2018) 76:861–74. doi: 10.1093/nutrit/nuy043
18. Kelly, S, Martin, S, Kuhn, I, Cowan, A, Brayne, C, and Lafortune, L. Barriers and facilitators to the uptake and maintenance of healthy Behaviours by people at mid-life: a rapid systematic review. PLoS One. (2016) 11:e0145074. doi: 10.1371/journal.pone.0145074
19. Deslippe, AL, Soanes, A, Bouchaud, CC, Beckenstein, H, Slim, M, Plourde, H, et al. Barriers and facilitators to diet, physical activity and lifestyle behavior intervention adherence: a qualitative systematic review of the literature. Int J Behav Nutr Phys Act. (2023) 20:14. doi: 10.1186/s12966-023-01424-2
20. Nilsson, J. Producing consumers: market researchers’ selection and conception of focus group participants. Consum Mark Cult. (2018) 23:376–89. doi: 10.1080/10253866.2018.1549548
21. U.S. Census Bureau. Explore Census Data 2022. Available online at: https://data.census.gov/table (Accessed October 03, 2025).
22. United States Census Bureau. Poverty Tresholds 2023 Available online at: https://www.census.gov/data/tables/time-series/demo/income-poverty/historical-poverty-thresholds.html (Accessed October 03, 2025).
23. Department of Health and Human Services. 45 CFR 46.104. Available online at: https://www.ecfr.gov/current/title-45/subtitle-A/subchapter-A/part-46/subpart-A/section-46.104 (Accessed June 25, 2025).
24. Hardcastle, SJ, Thøgersen-Ntoumani, C, and Chatzisarantis, NL. Food choice and nutrition: a social psychological perspective. Nutrients. (2015) 7:8712–5. doi: 10.3390/nu7105424
25. Daniel, C. Economic constraints on taste formation and the true cost of healthy eating. Soc Sci Med. (2016) 148:34–41. doi: 10.1016/j.socscimed.2015.11.025
26. Daniel, C. Is healthy eating too expensive?: how low-income parents evaluate the cost of food. Soc Sci Med. (2020) 248:112823. doi: 10.1016/j.socscimed.2020.112823
27. Beck, AL, Iturralde, E, Haya-Fisher, J, Kim, S, Keeton, V, and Fernandez, A. Barriers and facilitators to healthy eating among low-income Latino adolescents. Appetite. (2019) 138:215–22. doi: 10.1016/j.appet.2019.04.004
28. International Food Information Council. Food & Health Survey. (2024). Available online at: https://ific.org/wp-content/uploads/2025/07/2024-IFIC-Food-Health-Survey.pdf (Accessed October 03, 2025).
29. Gearing, M, Lewis, M, Wilson, C, Bozzolo, C, and Hansen, D. Barriers that constrain the adequacy of supplemental nutrition assistance program (SNAP) allotments: In-depth interview findings. Report prepared by Westat, Inc. for the U.S. Department of Agriculture, Food and Nutrition Service, June 2021. Project Officer Rosemarie Downer. (2021). Available online at: www.fns.usda.gov/research-and-analysis
30. Darmon, N, and Drewnowski, A. Contribution of food prices and diet cost to socioeconomic disparities in diet quality and health: a systematic review and analysis. Nutr Rev. (2015) 73:643–60. doi: 10.1093/nutrit/nuv027
31. Clark, JE. Taste and flavour: their importance in food choice and acceptance. Proc Nutr Soc. (1998) 57:639–43. doi: 10.1079/PNS19980093
32. Drewnowski, A, and Monsivais, P. Chapter 10- taste, cost, convenience, and food choices. In: BP Marriott, DF Birt, VA Stallings, and AA Yates, editors. Present knowledge in nutrition (eleventh edition) : Academic Press (2020). 185–200.
33. Steptoe, A, Pollard, TM, and Wardle, J. Development of a measure of the motives underlying the selection of food: the food choice questionnaire. Appetite. (1995) 25:267–84. doi: 10.1006/appe.1995.0061
34. Raghunathan, R, Naylor, RW, and Hoyer, WD. The unhealthy = tasty intuition and its effects on taste inferences, enjoyment, and choice of food products. J Mark. (2006) 70:170–84. doi: 10.1509/jmkg.70.4.170
35. Briers, B, Huh, YE, Chan, E, and Mukhopadhyay, A. The unhealthy = tasty belief is associated with BMI through reduced consumption of vegetables: a cross-national and mediational analysis. Appetite. (2020) 150:104639. doi: 10.1016/j.appet.2020.104639
36. McMackin, E, Dean, M, Woodside, JV, and McKinley, MC. Whole grains and health: attitudes to whole grains against a prevailing background of increased marketing and promotion. Public Health Nutr. (2013) 16:743–51. doi: 10.1017/S1368980012003205
37. Corbin, CH, O'Quinn, TG, Garmyn, AJ, Legako, JF, Hunt, MR, Dinh, TTN, et al. Sensory evaluation of tender beef strip loin steaks of varying marbling levels and quality treatments. Meat Sci. (2015) 100:24–31. doi: 10.1016/j.meatsci.2014.09.009
38. Kunz, S, Haasova, S, Pivecka, N, Schmidt, J, and Florack, A. Food is all around: how contexts create misbeliefs about the health-taste relationship. Psychol Sci. (2023) 34:568–80. doi: 10.1177/09567976231158288
39. Davis, GC, and You, W. The thrifty food plan is not thrifty when labor cost is considered. J Nutr. (2010) 140:854–7. doi: 10.3945/jn.109.119594
40. Rose, D. Food stamps, the thrifty food plan, and meal preparation: the importance of the time dimension for US nutrition policy. J Nutr Educ Behav. (2007) 39:226–32. doi: 10.1016/j.jneb.2007.04.180
41. Cavallo, M, Morgana, G, Dozzani, I, Gatti, A, Vandoni, M, Pippi, R, et al. Unraveling barriers to a healthy lifestyle: understanding barriers to diet and physical activity in patients with chronic non-communicable diseases. Nutrients. (2023) 15:3473. doi: 10.3390/nu15153473
42. Shepherd, J, Harden, A, Rees, R, Brunton, G, Garcia, J, Oliver, S, et al. Young people and healthy eating: a systematic review of research on barriers and facilitators. Health Educ Res. (2006) 21:239–57. doi: 10.1093/her/cyh060
43. Nicholls, R, Perry, L, Duffield, C, Gallagher, R, and Pierce, H. Barriers and facilitators to healthy eating for nurses in the workplace: an integrative review. J Adv Nurs. (2017) 73:1051–65. doi: 10.1111/jan.13185
44. Stern, D, Blanco, I, Olmos, LA, Valdivia, JJ, Shrestha, A, Mattei, J, et al. Facilitators and barriers to healthy eating in a worksite cafeteria: a qualitative study. BMC Public Health. (2021) 21:973. doi: 10.1186/s12889-021-11004-3
45. Shrestha, A, Pyakurel, P, Shrestha, A, Gautam, R, Manandhar, N, Rhodes, E, et al. Facilitators and barriers to healthy eating in a worksite cafeteria: a qualitative study from Nepal. Heart Asia. (2017) 9:e010956. doi: 10.1136/heartasia-2017-010956
46. Hasan, B, Thompson, WG, Almasri, J, Wang, Z, Lakis, S, Prokop, LJ, et al. The effect of culinary interventions (cooking classes) on dietary intake and behavioral change: a systematic review and evidence map. BMC Nutr. (2019) 5:29. doi: 10.1186/s40795-019-0293-8
47. Turnwald, BP, and Crum, AJ. Smart food policy for healthy food labeling: leading with taste, not healthiness, to shift consumption and enjoyment of healthy foods. Prev Med. (2019) 119:7–13. doi: 10.1016/j.ypmed.2018.11.021
48. Poole, MK, Lee, MM, Bleich, SN, and Kenney, EL. Understanding and comparing economic assistance models to improve food security and diet quality: a rapid review. Health Aff. (2025) 44:449–57. doi: 10.1377/hlthaff.2024.01352
49. Leung, CW, Hoffnagle, EE, Lindsay, AC, Lofink, HE, Hoffman, VA, Turrell, S, et al. A qualitative study of diverse experts' views about barriers and strategies to improve the diets and health of supplemental nutrition assistance program (SNAP) beneficiaries. J Acad Nutr Diet. (2013) 113:70–6. doi: 10.1016/j.jand.2012.09.018
50. Berkowitz, SA, O'Neill, J, Sayer, E, Shahid, NN, Petrie, M, Schouboe, S, et al. Health center–based community-supported agriculture: an RCT. Am J Prev Med. (2019) 57:S55–64. doi: 10.1016/j.amepre.2019.07.015
51. Basu, S, Akers, M, Berkowitz, SA, Josey, K, Schillinger, D, and Seligman, H. Comparison of fruit and vegetable intake among urban low-income US adults receiving a produce voucher in 2 cities. JAMA Netw Open. (2021) 4:e211757-e. doi: 10.1001/jamanetworkopen.2021.1757
52. Hager, K, Du, M, Li, Z, Mozaffarian, D, Chui, K, Shi, P, et al. Impact of produce prescriptions on diet, food security, and Cardiometabolic health outcomes: a multisite evaluation of 9 produce prescription programs in the United States. Circ Cardiovasc Qual Outcomes. (2023) 16:e009520. doi: 10.1161/CIRCOUTCOMES.122.009520
Keywords: food choice, healthy eating, barriers & facilitators, diet quality, food purchasing practices
Citation: Tate KE, Bassett A, Gavras H, Toner CD and Petersen KS (2025) Household barriers and facilitators to healthy eating in a U.S. census-representative sample of the general population and a low-income sample: a cross-sectional survey. Front. Public Health. 13:1648218. doi: 10.3389/fpubh.2025.1648218
Edited by:
Suman Chakrabarty, West Bengal State University, IndiaReviewed by:
Hui Liew, University of Nebraska at Kearney, United StatesHolly Huye, University of Southern Mississippi, United States
Copyright © 2025 Tate, Bassett, Gavras, Toner and Petersen. This is an open-access article distributed under the terms of the Creative Commons Attribution License (CC BY). The use, distribution or reproduction in other forums is permitted, provided the original author(s) and the copyright owner(s) are credited and that the original publication in this journal is cited, in accordance with accepted academic practice. No use, distribution or reproduction is permitted which does not comply with these terms.
*Correspondence: Kristina S. Petersen, a3VwNjNAcHN1LmVkdQ==