 Yongjian Su
 Zhengqin Su
 Zixiu Huang
 Shan Yang
 Zhongyou Li
 Hai Li
- 1School of Public Health and Management, Guangxi University of Chinese Medicine, Nanning, China
- 2Ruikang Hospital Affiliated with Guangxi University of Chinese Medicine, Nanning, China
- 3College of Computer Science and Electronic Engineering, Hunan University, Changsha, China
- 4School of Innovation and Entrepreneurship, Guangxi University of Traditional Chinese Medicine, Nanning, China
A Correction on
Long-term trends in rubella incidence across various regions and age groups in China, 2004–2021
by Su, Y., Su, Z., Huang, Z., Yang, S., Li, Z., and Li, H. (2025). Front. Public Health. 13:1566999. doi: 10.3389/fpubh.2025.1566999
The reference for [15] was erroneously written as “Zhu Z, Wang HL, Zhang Y. Analysis of serum IgM antibody and viral nucleic acid detection results in measles and rubella cases in China from 2014 to 2023. Chinese J Prev Med. (2024) 8:1318–23. doi: 10.3760/cma.j.cn112150-20240306-00191”. It should be “Zhu Z, Wang HL, Zhang Y. Analysis of serum IgM antibody and viral nucleic acid detection results in measles and rubella cases in China from 2014 to 2023. Chin J Prev Med. (2024) 8:1318–23. doi: 10.3760/cma.j.cn112150-20240306-00191”.
There was a mistake in Figures 1, 4, 5, 6, 7 and 8 as published. To ensure academic rigor, we have rechecked the data and performed additional analyses using the latest procedures, providing more accurate data and higher-resolution figures. The corrected Figures 1, 4, 5, 6, 7 and 8 appear below.
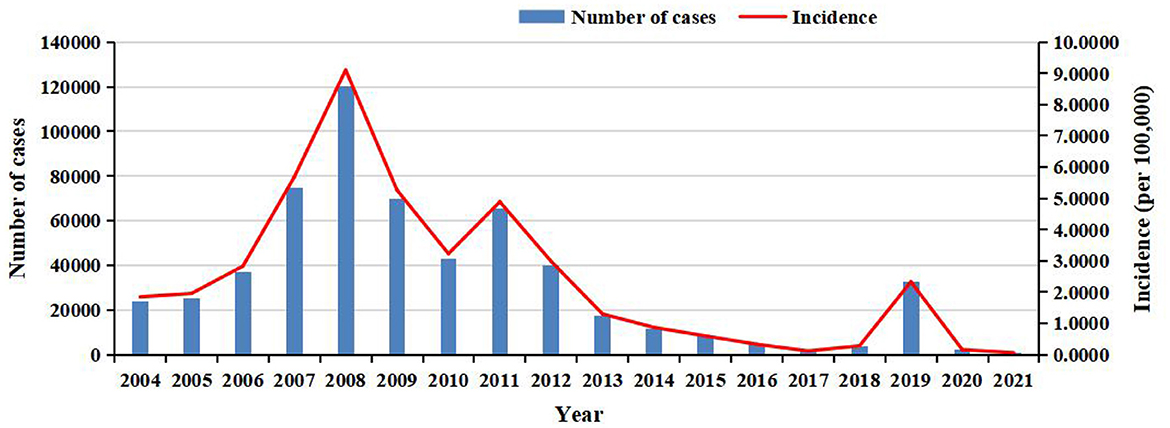
Figure 1. The annual number of cases and incidence of rubella in China from 2004 to 2021.
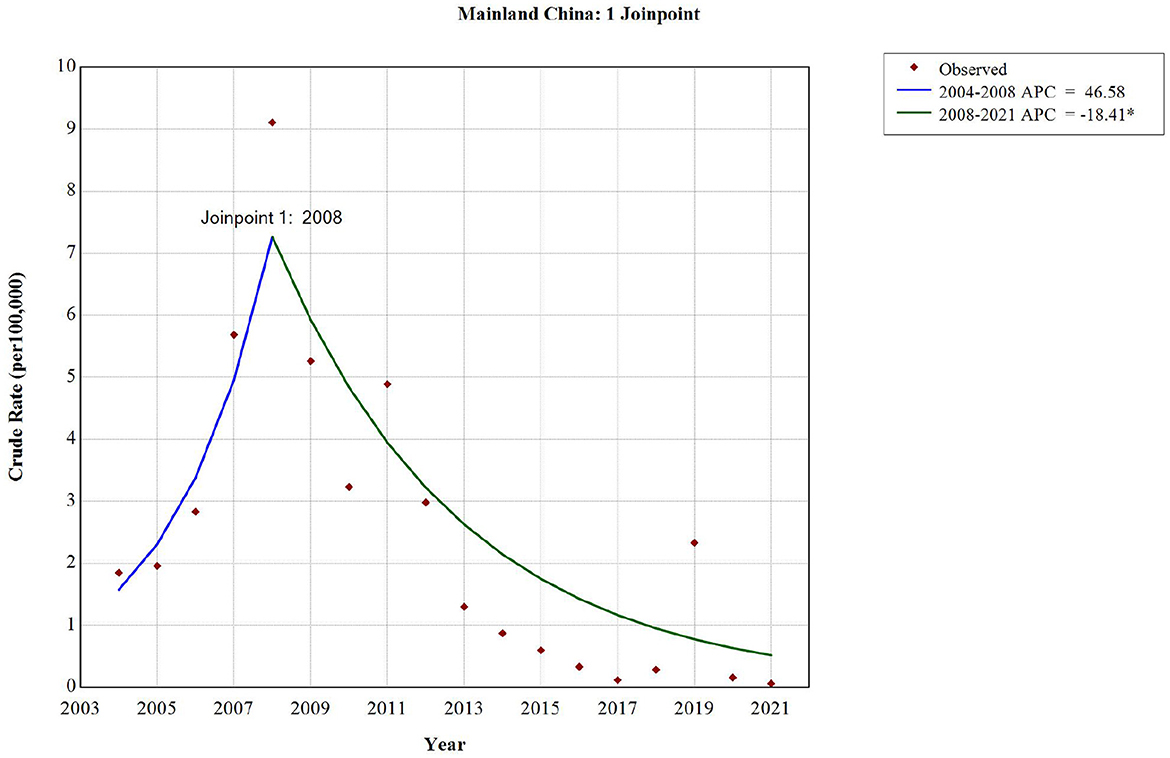
Figure 4. The long-term trend of rubella incidence in China from 2004 to 2021.
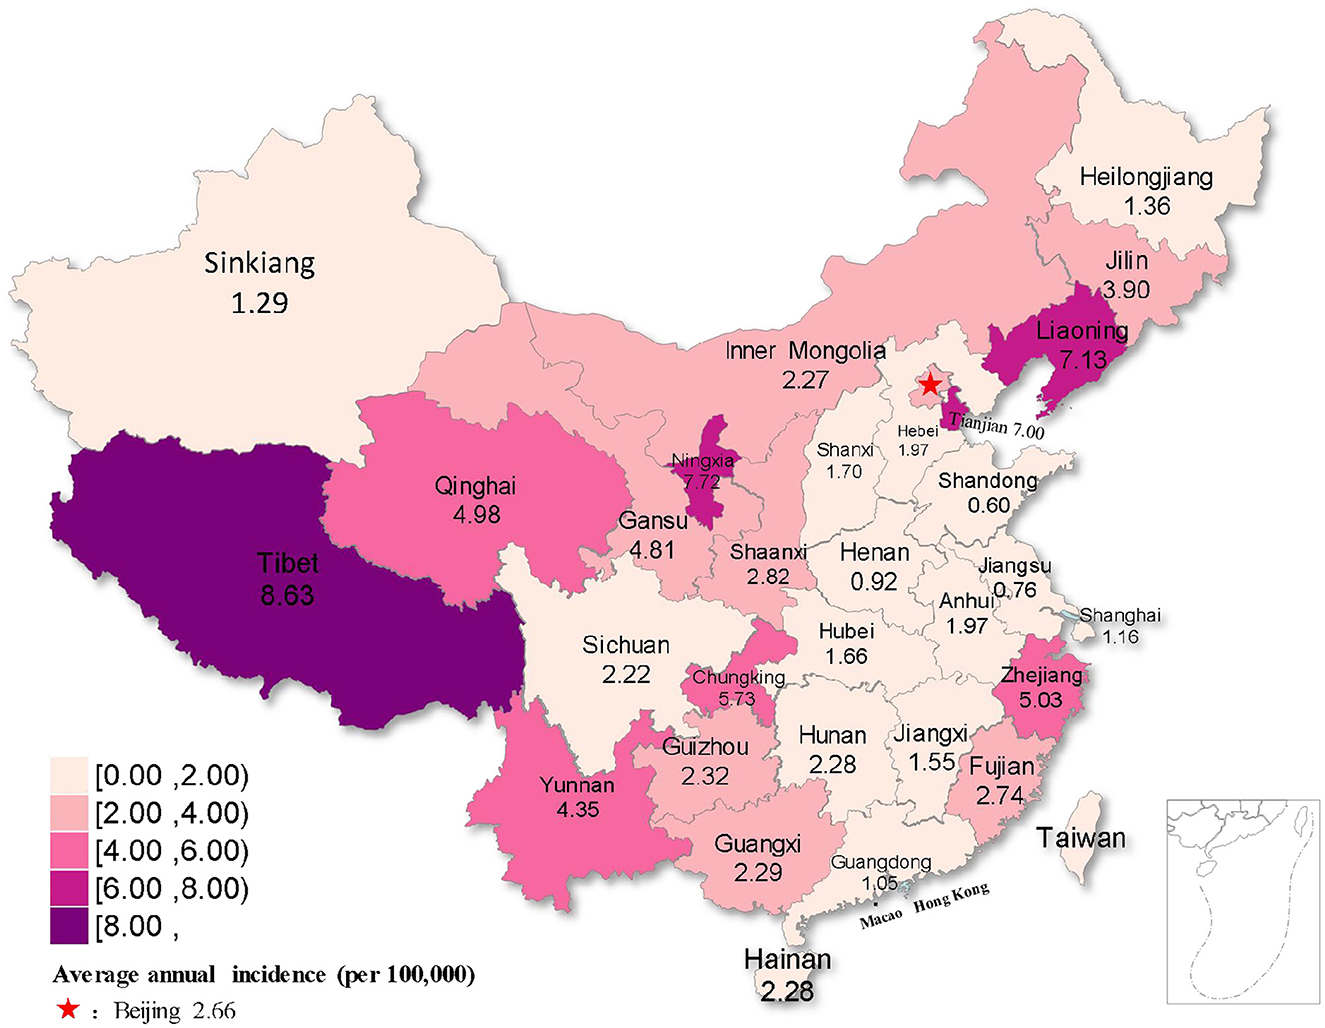
Figure 5. Distribution map of rubella incidence in different regions of China from 2004 to 2021.
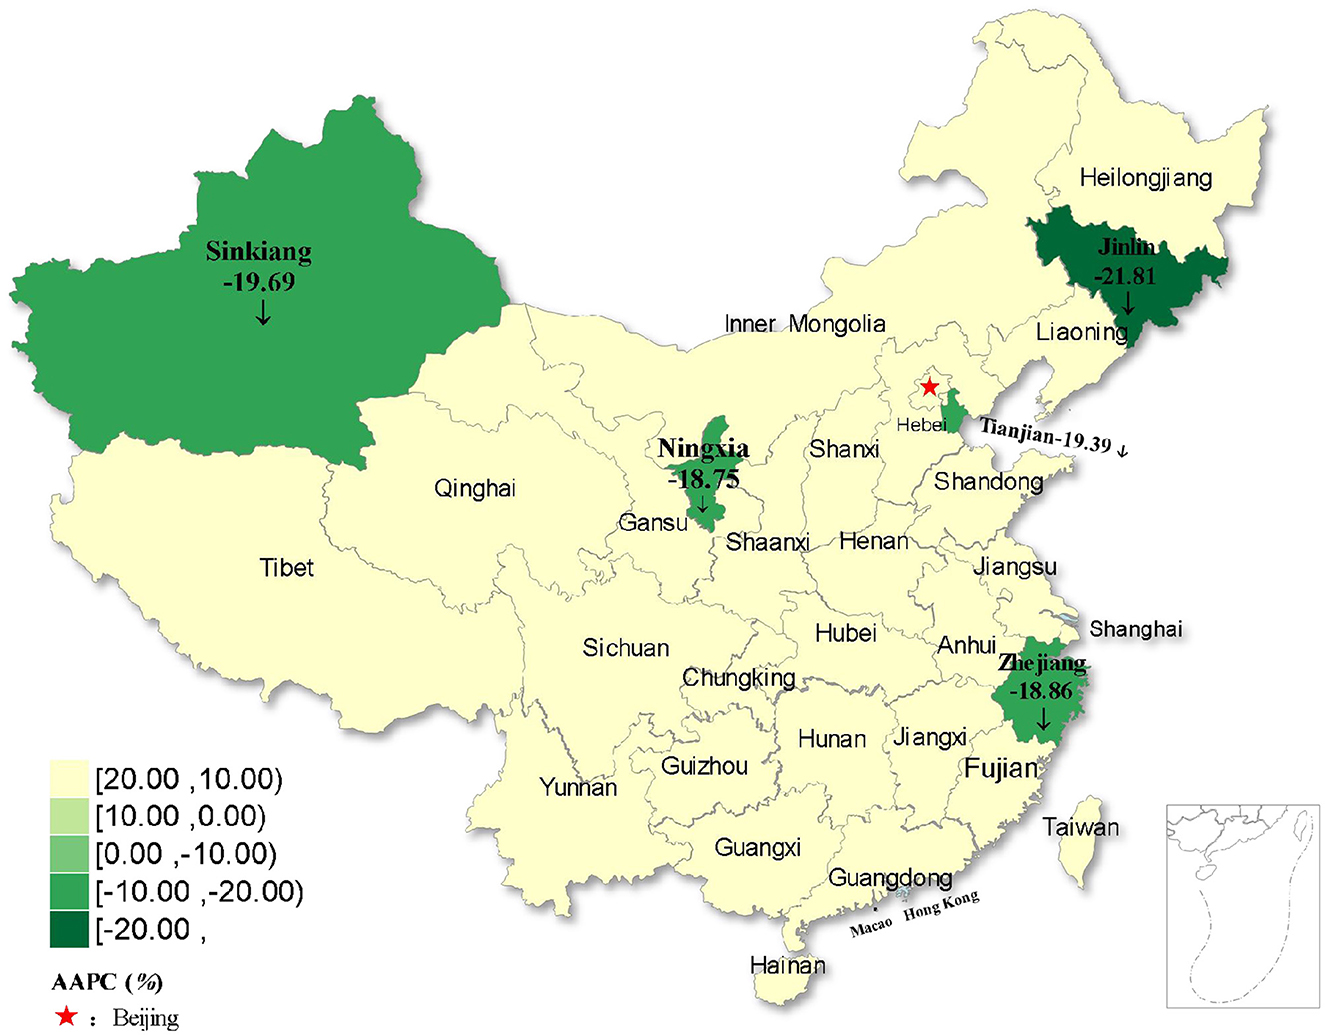
Figure 6. Distribution of rubella incidence with decreasing trends in five regions of China from 2004 to 2021.
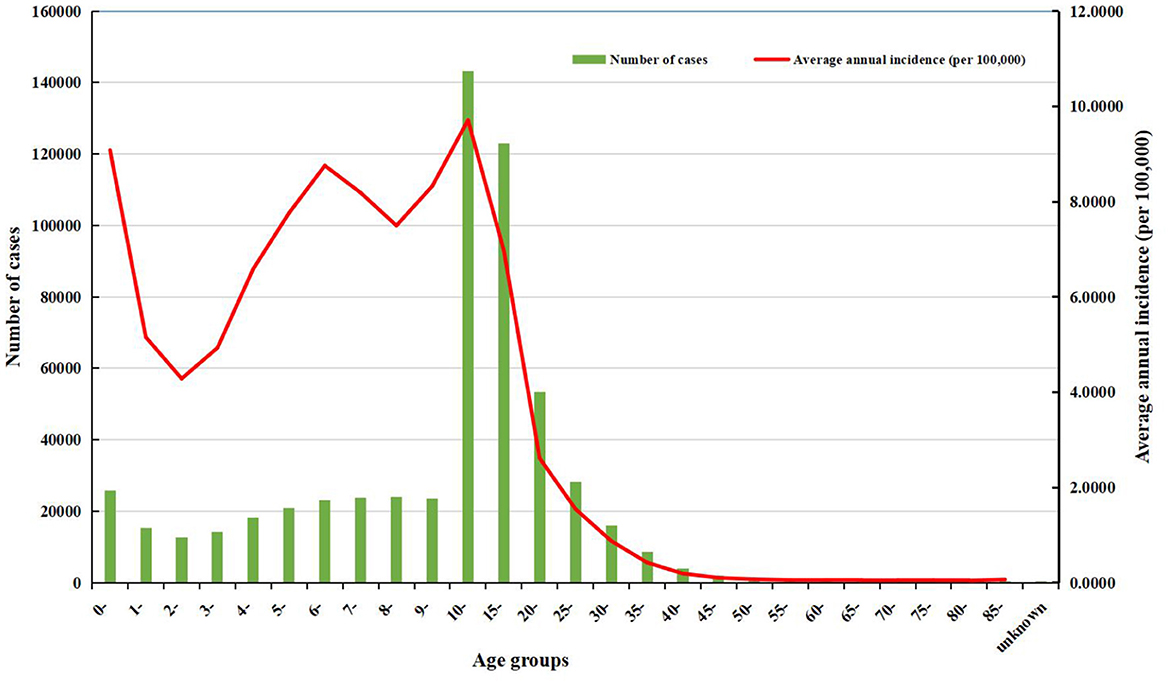
Figure 7. The number of cases and the average annual incidence of rubella in different age groups from 2004 to 2021.
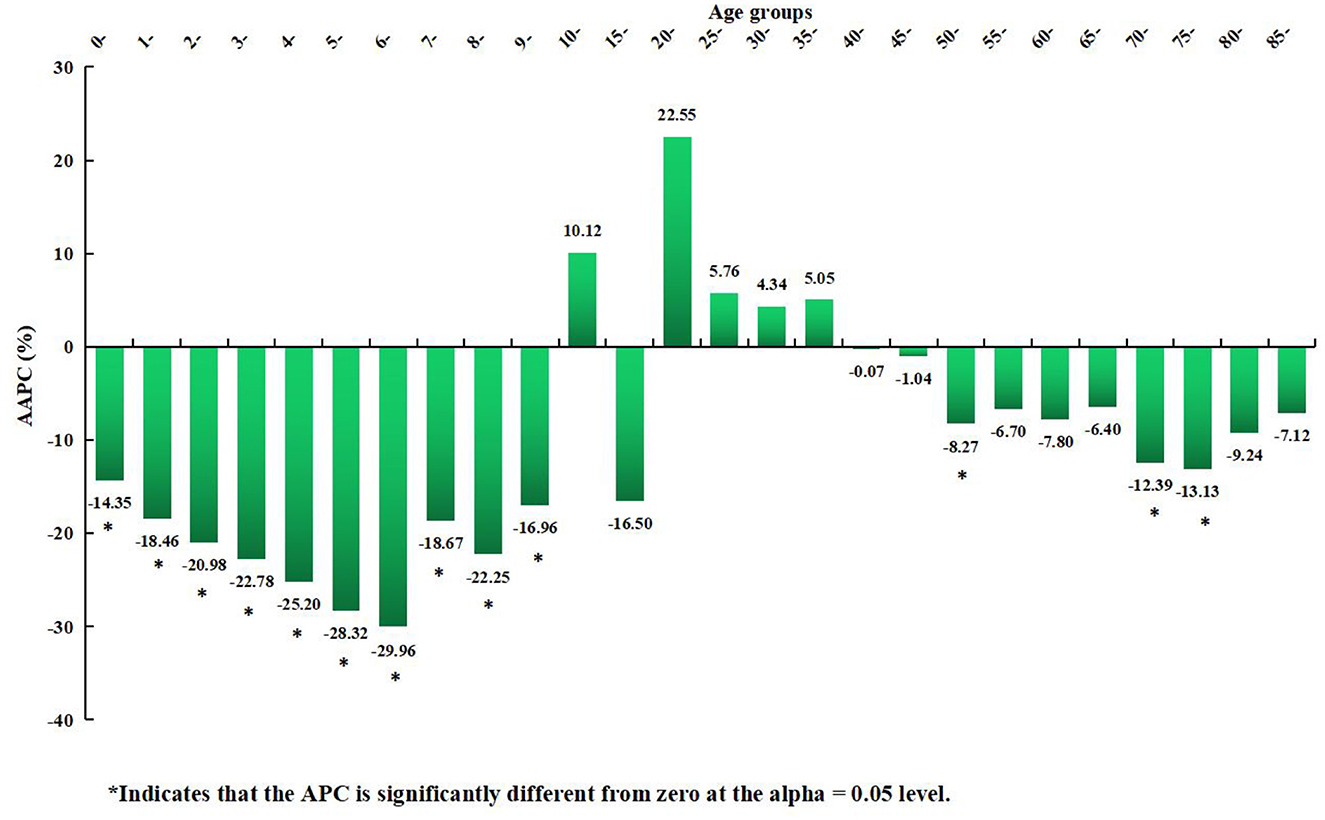
Figure 8. Distribution of the long-term trends of rubella incidence in different age groups from 2004 to 2021.
There was a mistake in Tables 1 and 2 as published. To ensure academic rigor, we have rechecked the data and performed additional analyses using the latest procedures, providing more accurate data. The corrected Tables 1 and 2 appear below.
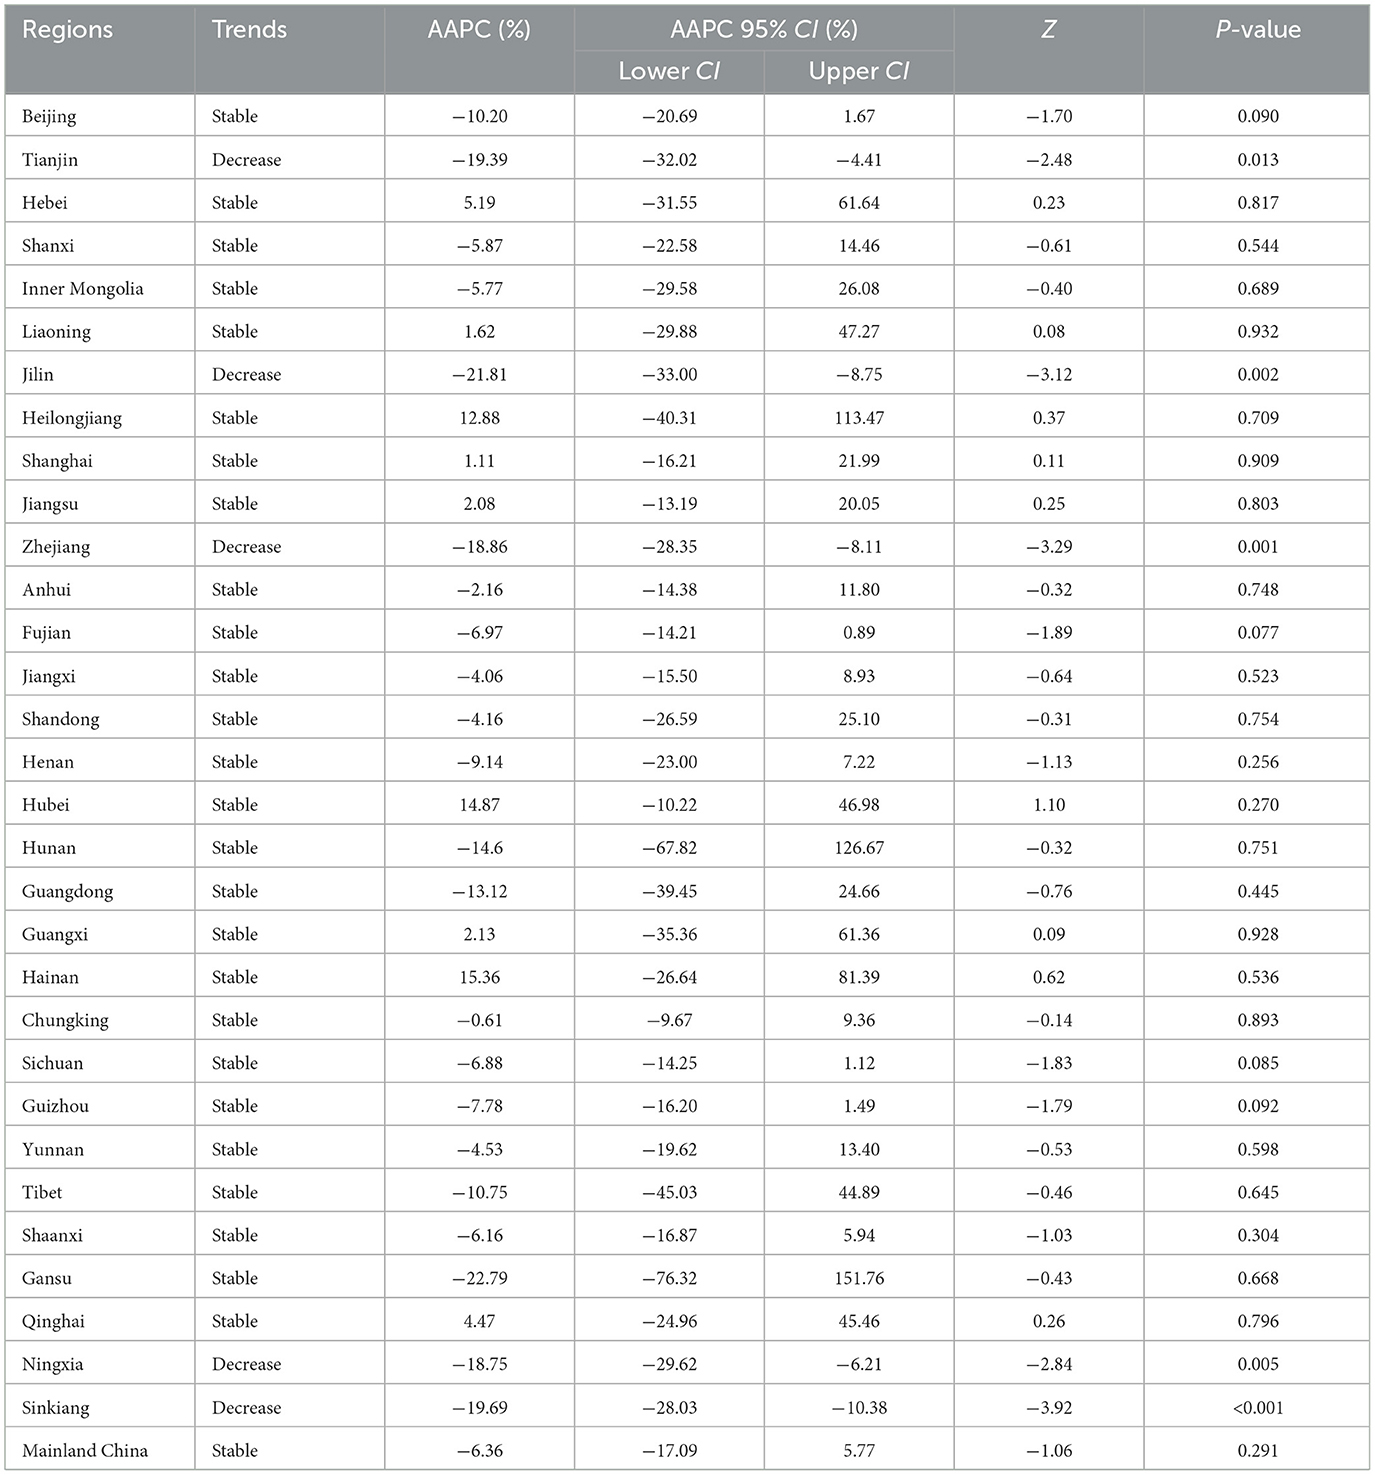
Table 1. The long-term trends of rubella incidence in the whole country and 31 regions from 2004 to 2021.
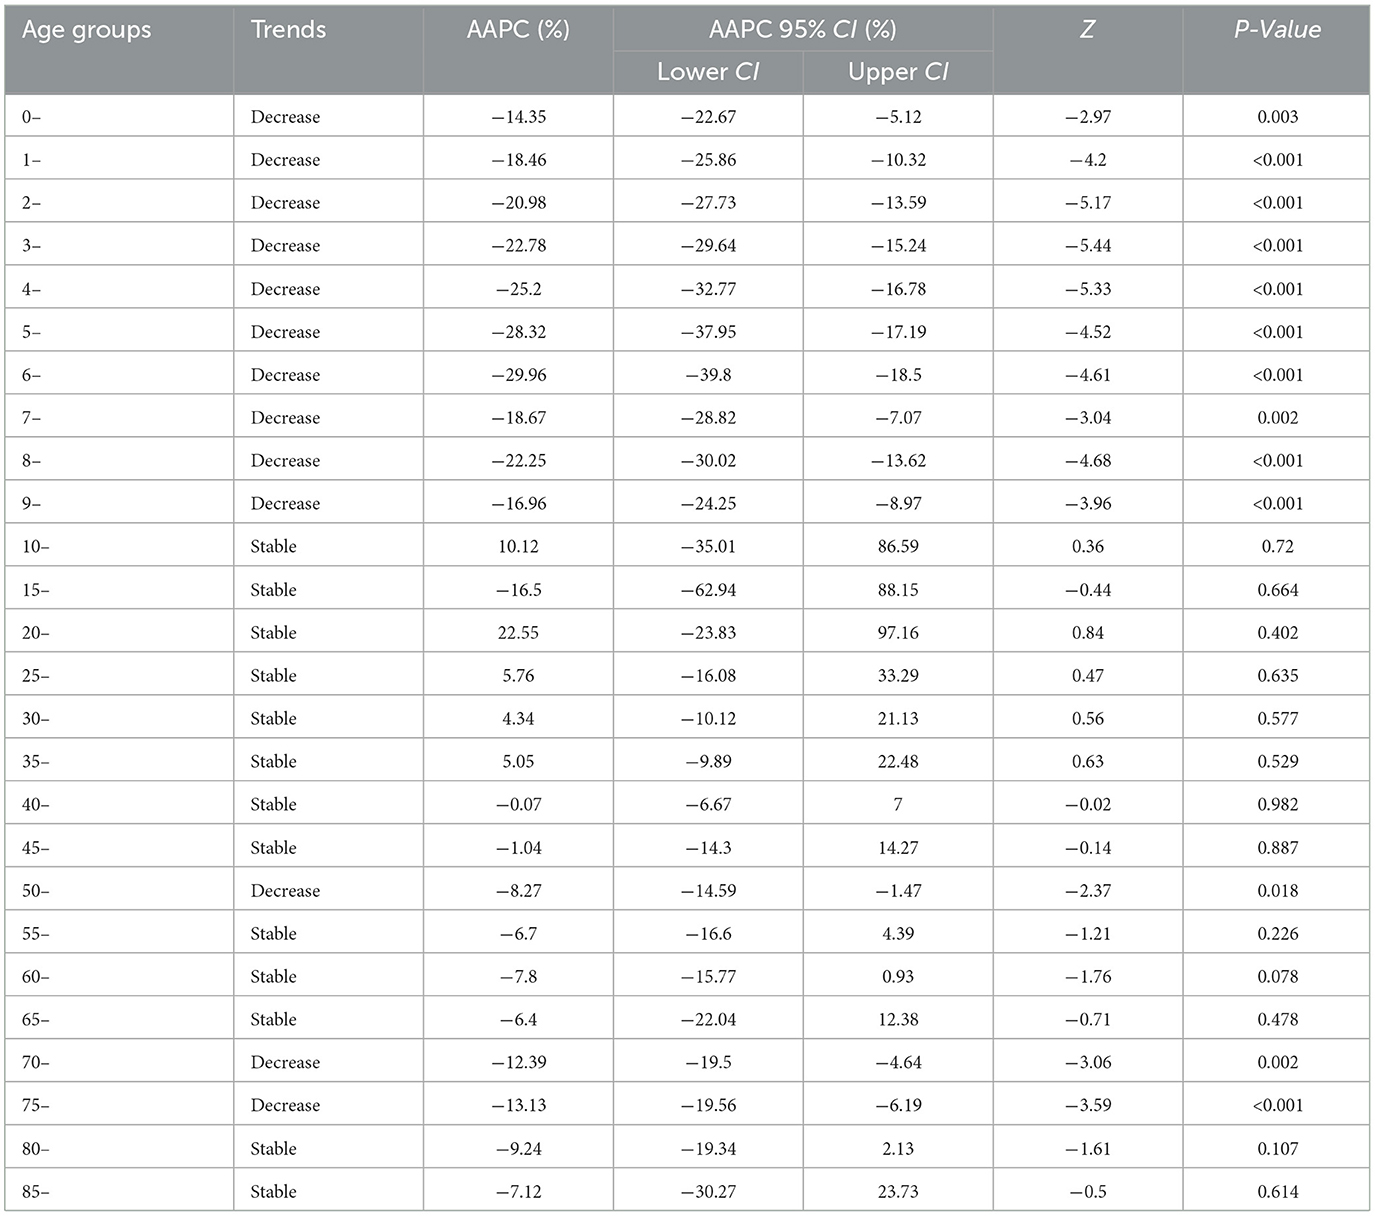
Table 2. The long-term trends of rubella incidence in 26 age groups from 2004 to 2021.
A correction has been made to Section 2.2 Research methods, 2.2.1 Basic statistical description, paragraph 1. The text “(incidence = number of cases/number of exposed population *100,000%)” has been changed to “(incidence = number of cases/number of exposed population *100,000).”
The original version of this article has been updated.
Publisher's note
All claims expressed in this article are solely those of the authors and do not necessarily represent those of their affiliated organizations, or those of the publisher, the editors and the reviewers. Any product that may be evaluated in this article, or claim that may be made by its manufacturer, is not guaranteed or endorsed by the publisher.
Keywords: rubella, incidence, descriptive study, joinpoint regression model, China
Citation: Su Y, Su Z, Huang Z, Yang S, Li Z and Li H (2025) Correction: Long-term trends in rubella incidence across various regions and age groups in China, 2004–2021. Front. Public Health 13:1650142. doi: 10.3389/fpubh.2025.1650142
Received: 19 June 2025; Accepted: 23 June 2025;
Published: 09 July 2025.
Edited and reviewed by: Marc Jean Struelens, Université libre de Bruxelles, Belgium
Copyright © 2025 Su, Su, Huang, Yang, Li and Li. This is an open-access article distributed under the terms of the Creative Commons Attribution License (CC BY). The use, distribution or reproduction in other forums is permitted, provided the original author(s) and the copyright owner(s) are credited and that the original publication in this journal is cited, in accordance with accepted academic practice. No use, distribution or reproduction is permitted which does not comply with these terms.
*Correspondence: Shan Yang, MTQwMjY1MEBxcS5jb20=; Zhongyou Li, NTgyODkzMTU2QHFxLmNvbQ==; Hai Li, bGloYWk2NjA5QGhvdG1haWwuY29t
†These authors share first authorship