 Qinglian Li
 Siyuan Zheng1
 Zhengwei Jing
 Kun Chen
 Yingjun Li
- 1Department of Epidemiology and Health Statistics, School of Public Health, Hangzhou Medical College, Hangzhou, China
- 2Department of Social Medicine and Health Services Management, School of Public Health, Hangzhou Medical College, Hangzhou, China
- 3Department of Zhejiang, University School of Public Health, Hangzhou, China
Background: To analyze the equity of the current allocation of health human resources using statistical data on health resources in the Yangtze River Delta region.
Methods: The Gini coefficient quantifies the level of distributional equality, the Theil index assesses the source of inequality, and the health resource agglomeration degree (HRAD) measures the accessibility of health resources, combining the three methods to evaluate the equity of the current allocation of health human resources in the Yangtze River Delta region. Furthermore, trend analysis of fairness indicators was conducted using regression models.
Results: Human resources for health in the Yangtze River Delta region have been increasing between 2014 and 2022. The Gini coefficient and Theil index in the Yangtze River Delta region are more equitable in terms of the distribution of healthcare resources based on population and gross domestic product (GDP) rather than geographical region. In Anhui Province, HRAD and HRAD/PAD (population agglomeration degree) were both less than 1. In Zhejiang Province, HRAD for health technicians and registered nurses was less than 1.
Conclusion: Human resources for health and healthcare ratios in the Yangtze River Delta region have continued to grow. However, the equity of health resources allocated based on population and economic factors is superior to that allocated based on geographical factors, and the equity of health resource concentration remains to be improved. To address this equity issue, it is necessary to comprehensively consider various factors such as population, geography, and GDP, and formulate corresponding measures accordingly.
1 Background
The World Health Organization (WHO) health policy explicitly urges governments to take effective measures to reduce health disparities among different populations, especially for vulnerable groups, and to ensure equitable access to health services (1). In view of this global consensus, China has established a national strategy for the balanced distribution of high-quality healthcare resources through the ‘Healthy China 2030’ initiative and the ‘14th Five-Year National Health Plan’ (2).
Compared to western regions, the Beijing-Tianjin-Hebei region, and the Pearl River Delta, the Yangtze River Delta region faces unique challenges: within this highly developed economic region, significant development disparities and geographical barriers have led to an uneven distribution of healthcare human resources (3, 4). Specifically, as the Yangtze River Delta experiences rapid socio-economic development, residents’ healthcare needs continue to rise. However, significant disparities exist within the region: core areas such as Shanghai, southern Jiangsu, and northern Zhejiang are highly developed, while some peripheral regions are constrained by terrain and transportation limitations (5). This dual economic-geographical influence has led to an imbalance in the allocation of healthcare human resources, creating a major challenge in coordinating population health needs with healthcare service supply. This not only hinders the formation of a fair, convenient, and systematic healthcare service system but also limits the comprehensive implementation of the ‘people-centred healthcare’ strategy (6, 7).
Therefore, in order to implement national strategic goals and take the lead in achieving health modernization in the region, promoting the balanced development of health technicians is a fundamental guarantee for ensuring health equity. Based on the current state of health resource development, providing targeted recommendations for the allocation of health resources in the Yangtze River Delta is crucial for promoting the sustainable development of healthcare and optimizing resource allocation in the region.
This study uses the Gini coefficient (G), the Health Resource Agglomeration Degree (HRAD), and the Theil index (T) to comprehensively assess the fairness of public health human resource allocation in the Yangtze River Delta from 2014 to 2022 (8–10). The design of this indicator combination is based on the principle of multidimensional complementarity: the Gini coefficient excels at quantifying the overall inequality of resource allocation and effectively identifying global imbalances, but it has limitations in analysing spatial structures and the sources of differences; HRAD integrates population density and geographical area parameters to precisely capture spatial accessibility bottlenecks in health services, addressing the Gini coefficient’s blind spots in the geographical dimension, and the Theil index, through its decomposable characteristics, precisely identifies the contribution rates of differences between and within regions, revealing the underlying structural causes of inequality (11). The three indicators cross-validate each other from multiple dimensions, breaking through the cognitive boundaries of a single indicator.
2 Methods
2.1 Data source
In this research, ‘health workers’ refers to employees working in hospitals, primary health care institutions, professional public health organizations, and other health care institutions, using the classification standards of the China Health Statistics Yearbook: health technicians include practising (assistant) physicians, registered nurses, pharmacists, and other clinical service positions; other health technicians refer to professional and technical positions other than health technicians, village doctors, labourers, and management personnel. The distribution of health personnel and the relevant statistics per 10,000 people in the Yangtze River Delta region were primarily obtained from the China Statistical Yearbook (2015–2023) on the official website of the National Bureau of Statistics. Additionally, data on the gross domestic product, healthcare personnel, permanent population, and geographical areas of prefecture-level cities in the Yangtze River Delta region are sourced from the Statistical Yearbooks and Statistical Bulletins on National Economic and Social Development (2015–2023) of Jiangsu Province, Zhejiang Province, Shanghai Municipality, and Anhui Province.
2.2 Measuring tools
2.2.1 Gini coefficients
The G is a statistical indicator calculated based on the Lorenz curve, reflecting the fairness of social income distribution (10, 12). Currently, the G is widely used to assess the fairness of medical resource allocation. The G takes values ranging from 0 to 1, with 0.4 as the warning line. Generally, 0 ~ 0.2 indicates high fairness, 0.2 ~ 0.3 indicates comparative fairness, 0.3 ~ 0.4 indicates relative fairness, and greater than 0.4 indicates unfairness (10, 13). In this study, the G was used to analyze the equity of health human resource allocation among regions in the Yangtze River Delta based on population, GDP and geographical area. The formula for calculating G is as shown in Equation 1:
Where G is the Gini coefficient, n represents the number of geographic regions, and i takes values from 1 to n. The provinces are sorted in ascending order by the number of health personnel per 10,000 population (100 million yuan or per square kilometer). Yi denotes the cumulative proportion of health human resources in the ith region, while Xi represents the cumulative proportion of the population (GDP or geographic area) in the ith region.
2.2.2 Theil index
The Theil index, derived from the concept of entropy in information theory, is used to measure the equity of health resource allocation in a region (10, 13). The Theil index has good decomposition capabilities and is a commonly used method for assessing the balance of resource allocation and analysing the causes of uneven health resource allocation in the Yangtze River Delta region. It can reflect the magnitude of differences within and between regions, and the calculation of contribution rates can intuitively show the extent to which regions within and between regions contribute to overall differences. The value of the Theil index ranges from 0 to 1, with smaller values indicating greater fairness (14, 15). Its calculation formula is as the following Equations 2–5.
Where T denotes the Theil index, Pi is the percentage of the resident population (GDP or geographic area) of each prefecture-level city to the total population (GDP or geographic area) of the four provinces in the Yangtze River Delta region (Jiangsu, Zhejiang, Shanghai, and Anhui); Fi is the percentage of the number of human resources for health in each prefecture-level city to the number of human resources for health in the four provinces in the Yangtze River Delta region; i denotes the province, and n denotes the total number of provinces, and the method of calculating the decomposition of the Theil index:
Ttotal denotes the total Theil index, Tinter refers to the differences in resource allocation between provinces in the Yangtze River Delta region; Tintra denotes the differences in resource allocation within provinces in the Yangtze River Delta region; Pk is the percentage of the resident population (GDP or geographic area) of each province to the total population (GDP or geographic area) of the Yangtze River Delta region, Fk is the number of human resources for health in each province to the number of human resources for health in the Yangtze River Delta region, and Tk denotes each regional Theil index, k denotes prefecture-level cities, and m denotes the total number of prefecture-level cities.
The intra-group contribution rate is calculated as Tintra/Ttotal × 100%, while the inter-group contribution rate is calculated as Tinter/Ttotal × 100%.
2.2.3 Health resource agglomeration degree
Agglomeration is an indicator of the degree to which health resources are clustered in a region relative to a larger regional scale, and is categorized into health resource agglomeration degree (HRAD) and population agglomeration degree (PAD) (16). HRAD is used to measure the extent to which human resources for health are clustered in a given region and how this varies across regions; HRAD/PAD is used to measure whether regional health resources meet the needs of the local population (17). The degree of agglomeration is calculated as shown in Equations 6, 7.
HRADi denotes the agglomeration of human resources for health in area i, where HRi is the number of health personnel in area i, Ai is the land area of area i, An is the total land area of the country, and HRn is the total number of health personnel in the country. PADi denotes the population density of area i, where Pi is the number of people in area i, and Pn is the total population of the country.
When HRADi = 1, it means that the human resources in the region are absolutely fair by geographic allocation; when HRADi > 1, it means that the fairness of human resources in the region is better by geographic allocation; on the contrary, HRADi < 1 means that the fairness is worse. When HRAD and PAD are combined to evaluate the equity of health resources, the evaluation criteria are as follows: when HRADi/PADi = 1, it indicates that the human resources in the region are allocated absolutely equitably according to the population, and the accessibility of health resources is better; when the ratio of the two is >1, it indicates that the human resources in the region are allocated equitably according to the population is better; and vice versa, <1 indicates that the poor equity (18).
2.2.4 Statistical analysis
To quantify the temporal trends and statistical significance of the aforementioned fairness indicators, this research constructed univariate linear regression models with year as the independent variable and each fairness indicator as the dependent variable. Details of the linear regression results are provided in Supplementary Tables 23–28. The slope of each regression model was tested using a t-test, and its 95% confidence interval was calculated. All data analyses were performed using R (version 4.4.1).
3 Results
3.1 Situation of the scale of health technology personnel in the Yangtze River Delta region
Numbers of all types of health technicians and health care ratios show an upward trend from 2014 to 2022. In terms of human resources for health, the growth rate of health technicians, licensed (assistant) physicians, registered nurses, pharmacists and other health technicians is 60.58, 63.08, 75.33, 34.67, 68.82%, respectively, the fastest for registered nurses and the slowest for pharmacists.
Besides, from 2014 to 2022, the medical staff ratio in the Yangtze River Delta region will generally increase. However, by 2022, the medical staff ratio in Zhejiang, Jiangsu, and Anhui provinces will still be less than 1:2, with only Shanghai reaching a ratio of more than 1:2. The specific numbers are shown in Table 1.
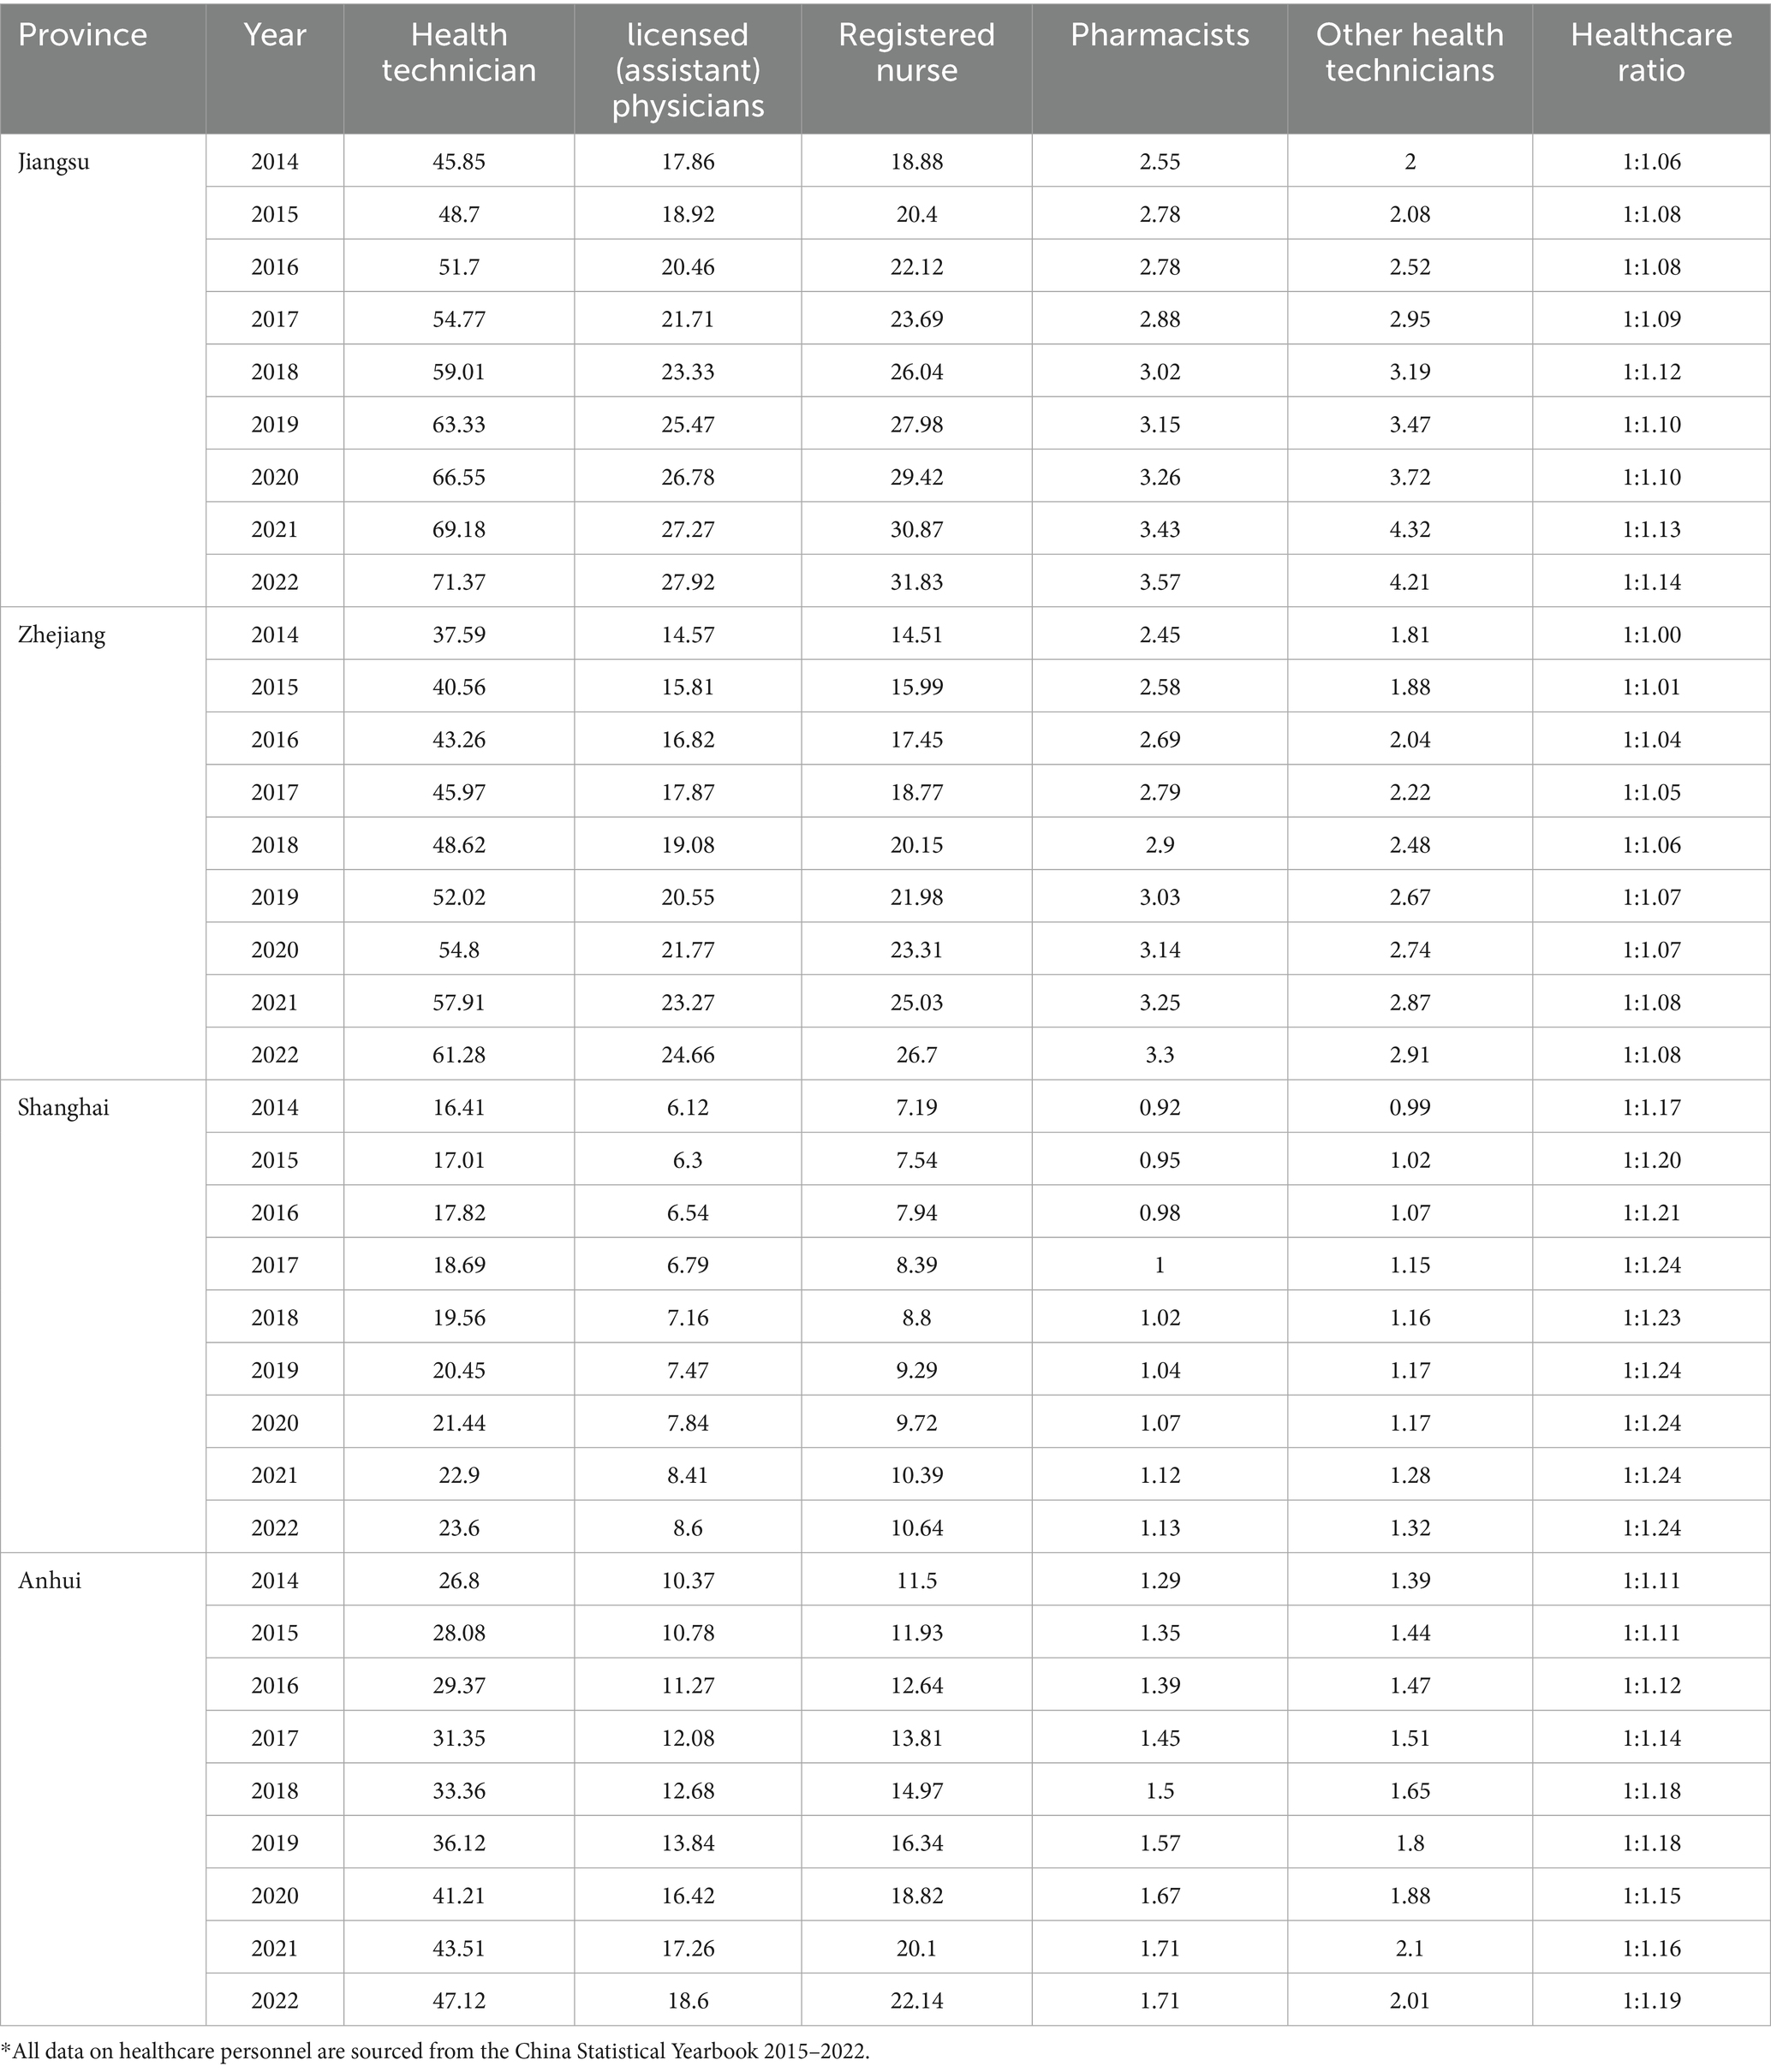
Table 1. Number of human resources for health (unit: 10,000 persons) and healthcare ratio* in the Yangtze River Delta region, 2014–2022.
3.2 Variation in health technology personnel per 10,000 persons in the Yangtze River Delta region
The Yangtze River Delta data on health technicians, licensed (assistant) physicians and registered nurses per 10,000 people from 2014 to 2022 are shown in Figure 1. Overall, the number of health technicians, licensed (assistant) physicians and registered nurses per 10,000 people from 2014 to 2022 in Jiangsu, Zhejiang, Shanghai and Anhui provinces are all increasing. In Anhui Province, there is a noticeable gap between the number of health technicians, licensed (assistant) physicians, and registered nurses per 10,000 people compared to those in Jiangsu, Zhejiang, and Shanghai; however, this gap is gradually narrowing.
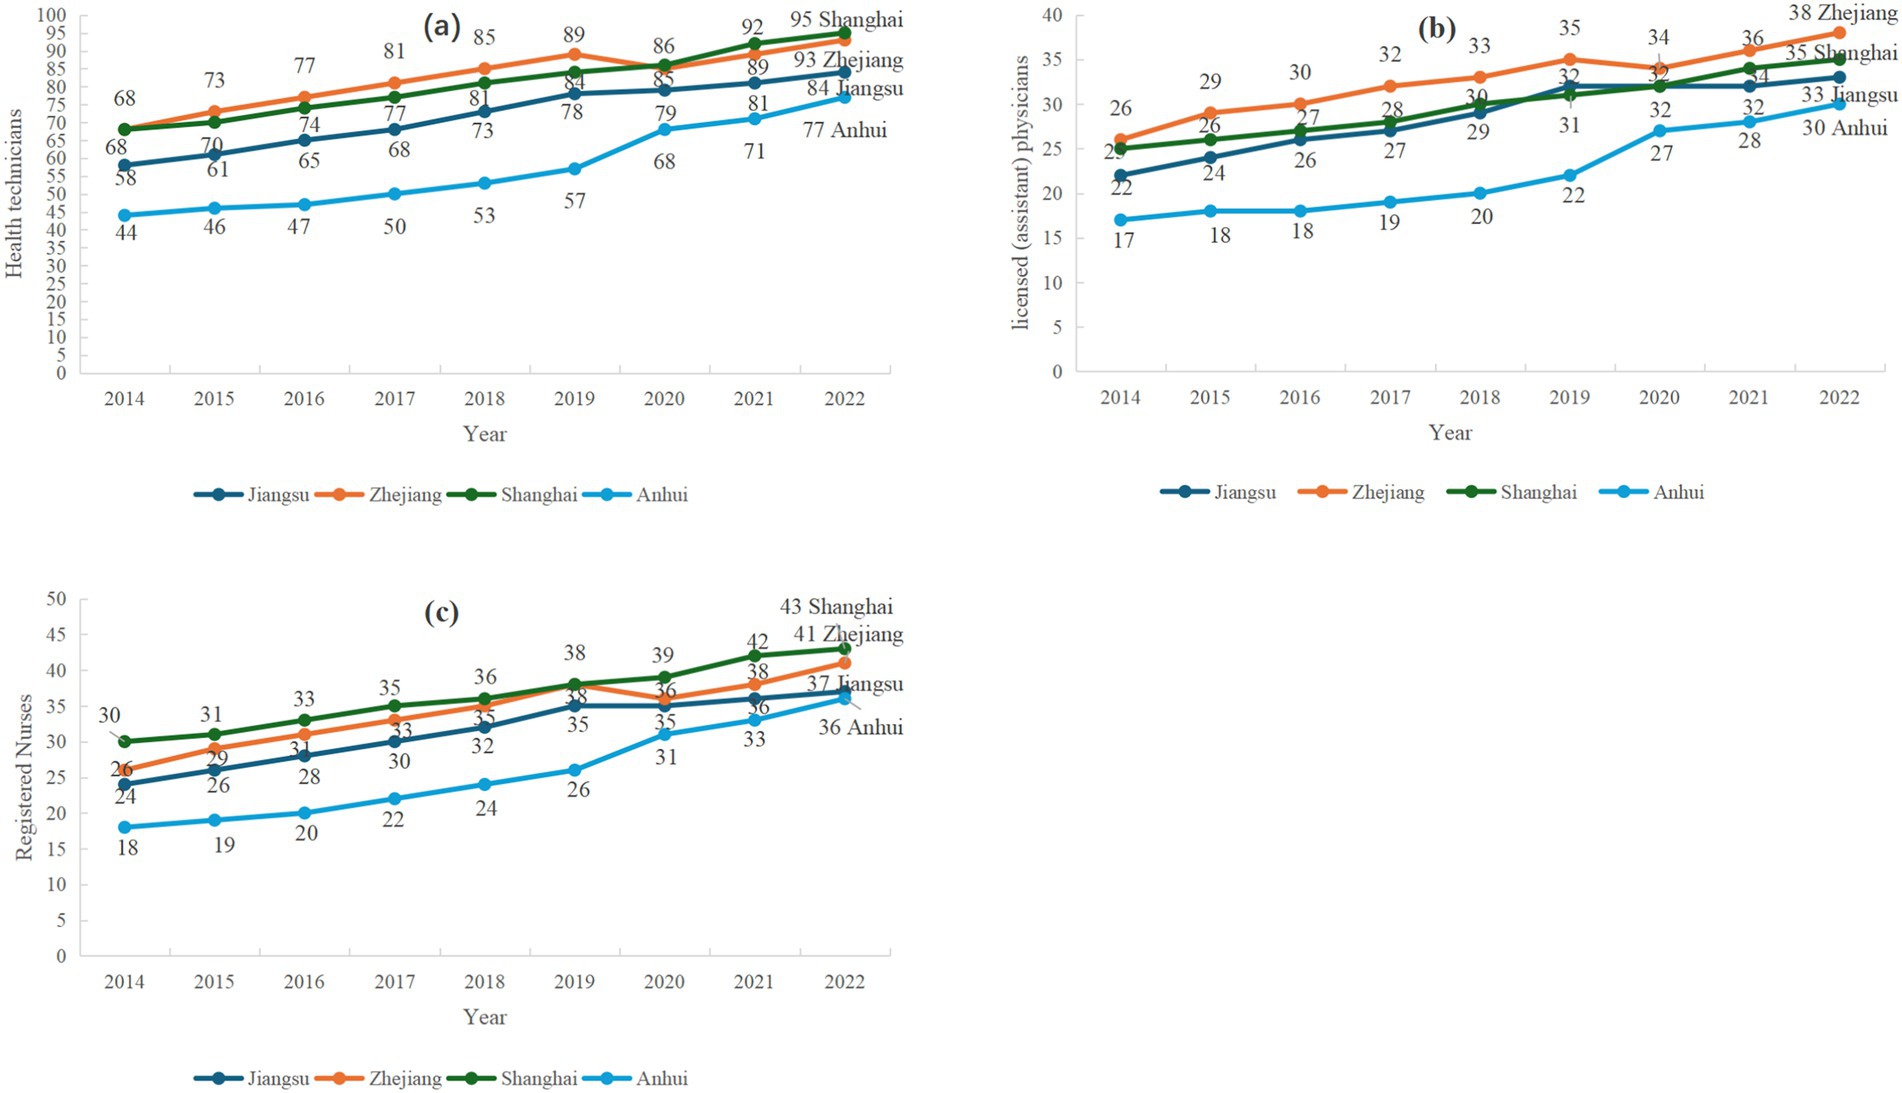
Figure 1. Trends in the Number of Three Categories of Healthcare Personnel per 10,000 Population in the Yangtze River Delta region from 2014 to 2022. (a) Health Technicians, (b) Registered nurses, (c) Licensed (Assistant) Physicians. *Provincial Health Statistical Yearbooks (Jiangsu, Zhejiang, Shanghai, Anhui) 2015–2023.
3.3 The Gini coefficient-based equity analysis
According to the Gini coefficient fairness analysis by population configuration, the Gini coefficients of health technicians, licensed (assistant) physicians, and registered physicians in Jiangsu, Zhejiang, and Anhui provinces are all less than 0.2, indicating a highly equitable state, reflecting the high match between the permanent resident population and medical resources; the Gini coefficients of the three categories of human resources for health in Shanghai city are located in the range of 0.3–0.4, which is in a relatively fair state. This may be attributed to Shanghai’s status as a developed city, where population mobility significantly influences the distribution of healthcare human resources.
According to the Gini coefficient fairness analysis of geographic area configuration, the Gini coefficient of the three types of health human resources in Jiangsu Province and Anhui Province is located between 0.2–0.4, in a relatively fair and relatively fair state; the Gini coefficient of the three types of health human resources in Zhejiang Province is located between 0.3–0.4, in a relatively fair state. This may be due to geographical constraints within these regions. Both transportation and healthcare services have an impact on this distribution. However, the Gini coefficients for the three types of healthcare human resources in Shanghai exceed 0.5, indicating an unfair state. This may be due to Shanghai’s healthcare distribution potentially forming a “concentric circle” pattern, where resources are more abundant closer to the center.
Based on GDP, the Gini coefficient analysis shows that the G for the three categories of healthcare human resources in Zhejiang and Jiangsu are all below 0.2; the G for the three categories in Shanghai are in the range of 0.3–0.4; Anhui shows a differentiation—the G for healthcare technicians and licensed physicians fluctuates around 0.2, while the G for nurses remains consistently below 0.2. This reflects relatively lower economic pressure, but none of the four provinces have achieved a highly equitable state, indicating that underdeveloped regions within these provinces still require improvements in the allocation of healthcare resources. The fairness status of the Gini coefficient for Zhejiang is shown in Table 2, and the Gini coefficients for Jiangsu, Shanghai, and Anhui are shown in Supplementary Tables 1–9, respectively. The trend charts for the Gini coefficients are detailed in Supplementary Figures 2–5.
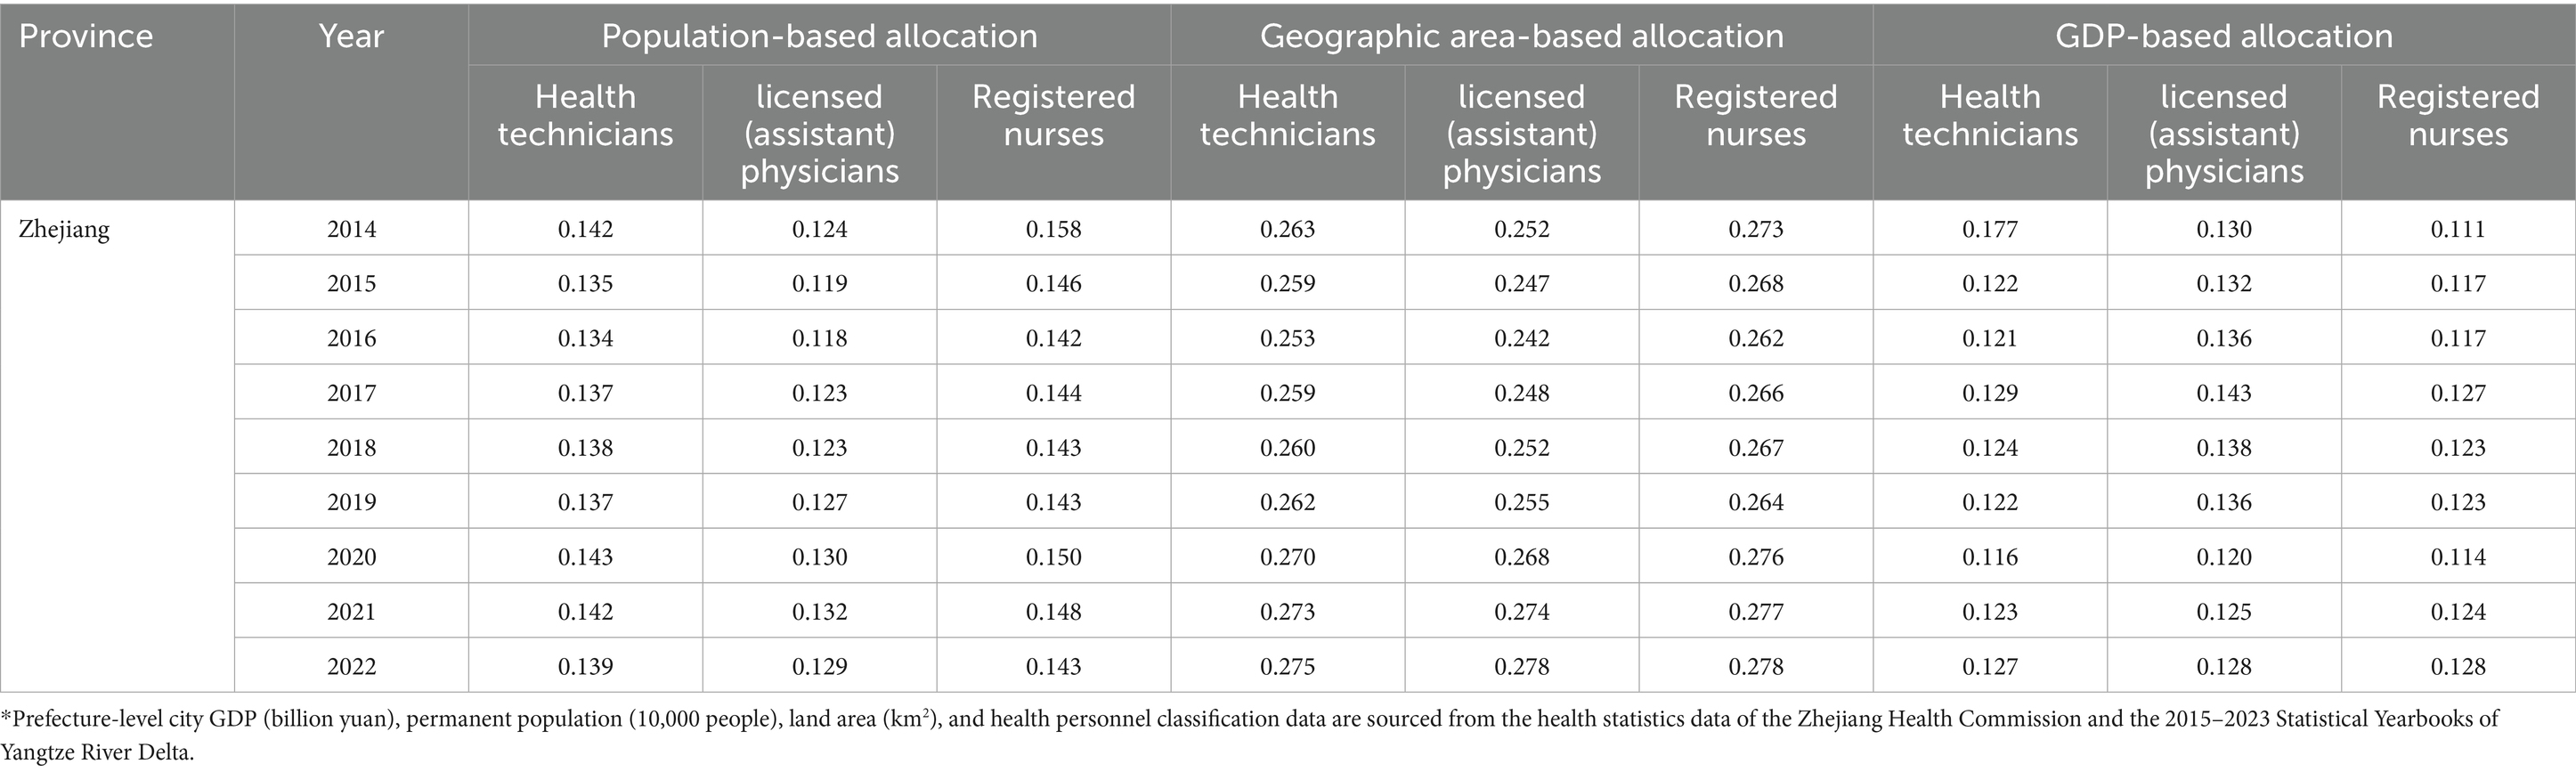
Table 2. The Gini coefficients for the three categories of human resources for health in Zhejiang, 2014–2022.
3.4 The Theil index based fairness analysis
According to the equity analysis of the Theil index of population allocation, the Theil index of health technicians, licensed (assistant) physicians, and registered nurses in the Yangtze River Delta region is less than 0.04. The contribution rate of intra-regional differences has consistently exceeded 59%, with internal regional differences contributing significantly more to the overall index than inter-regional differences.
Equity analysis of the Theil index of geographic configuration shows that the total Theil index of the three types of health human resources from 2014 to 2022 is mainly concentrated in the range of 0.177–0. 226, with little overall fluctuation, but the Theil index of the geographic configuration is larger than the Theil index of the population configuration, and the smallest Theil index of licensed (assistant) physicians in 2020, at 0.177, with the best configuration equity; the Theil index for registered nurses in 2018 is the largest, 0.226, with the worst configuration equity. The contribution rate of intra-regional differences ranged from 54.21 to 63.76%.
The Theil index analysis based on GDP allocation (2014–2022) shows that the Theil index range for the three categories of healthcare human resources is 0.028 to 0.040, with the contribution rate of regional differences stabilising above 62.92%. Among these, the Theil index for medical technical personnel was the lowest in 2019 (0.028), indicating the highest fairness in distribution. Further analysis indicates that geographical distribution differences in the Theil index are most significant in the Yangtze River Delta region, followed by GDP distribution differences, while population distribution differences are the smallest. As shown in Table 3.
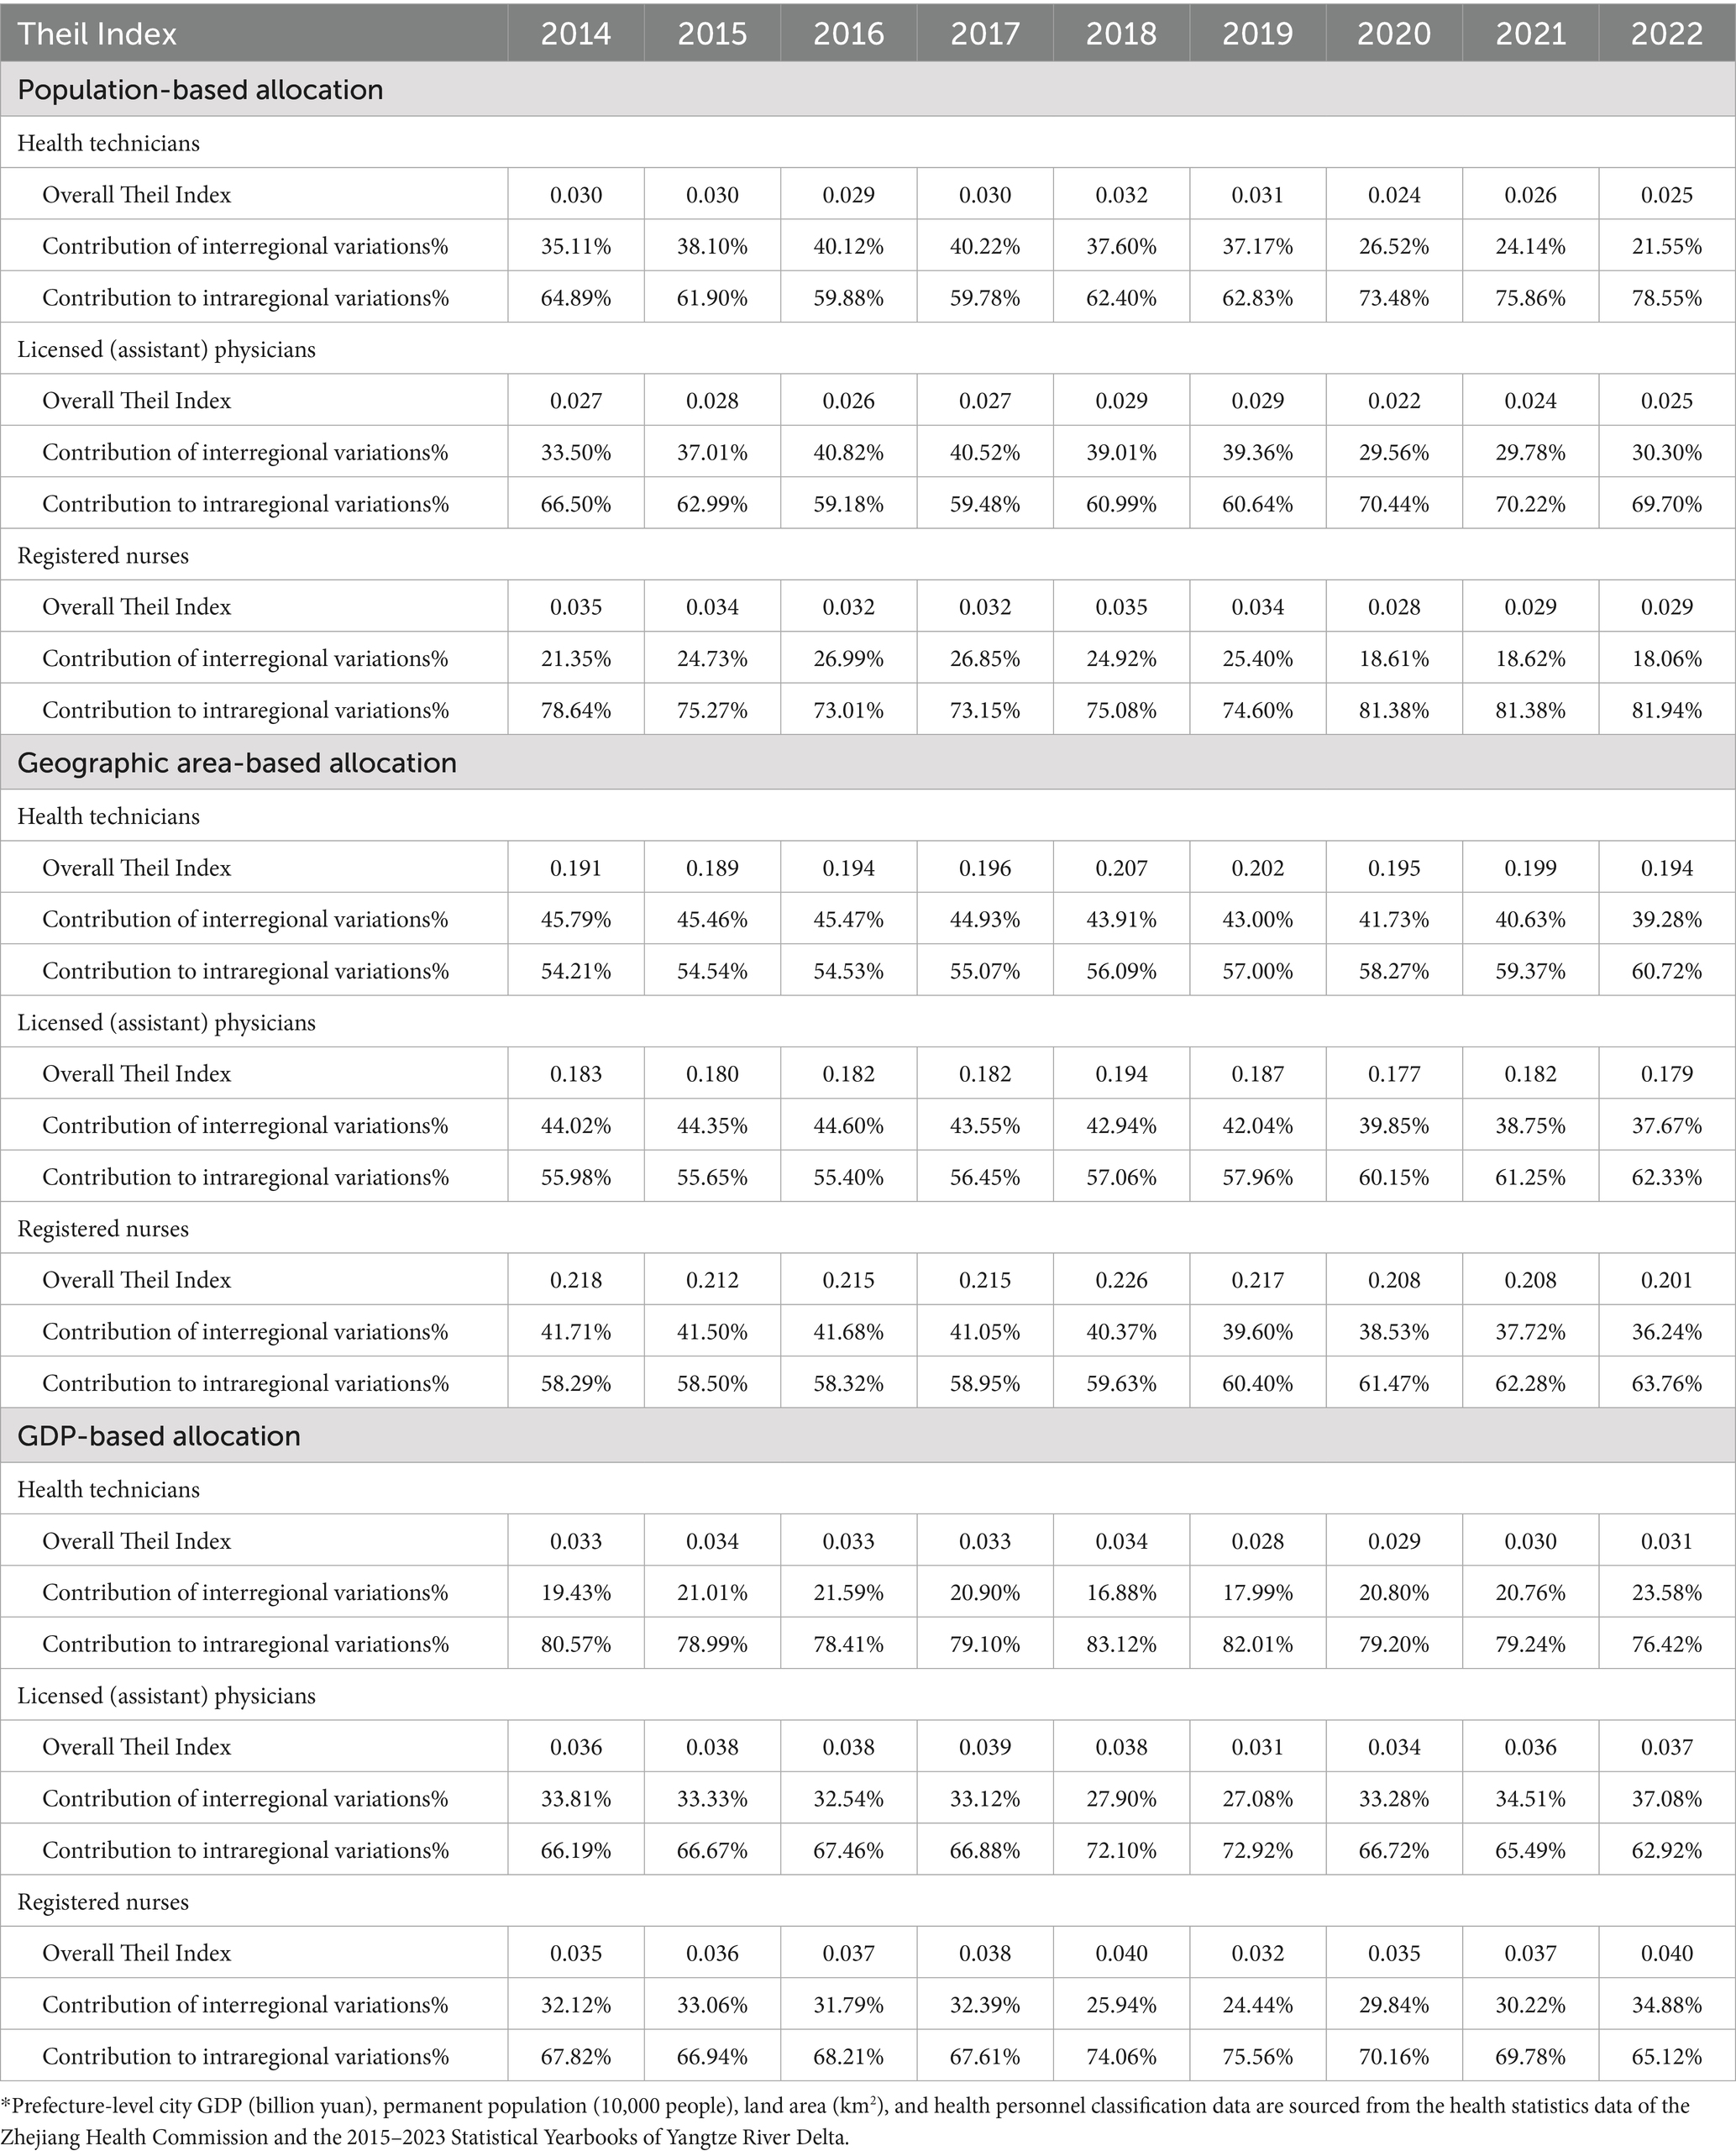
Table 3. The Theil Index for the three categories of human resources for health, 2014–2022.
Research data indicates that intra-regional variations significantly exceed inter-regional variations across the three dimensions. This pattern likely stems from the potent ‘siphon effect’ exerted by economic hubs such as Shanghai, Hangzhou, and Nanjing, which attract high-quality medical resources through their generous remuneration packages and career opportunities. Conversely, regions including most of Anhui, northern Jiangsu, and southwestern Zhejiang face structural disadvantages in talent competition due to constraints on local fiscal capacity and geographical conditions.
3.5 Health resource agglomeration degree-based equity analysis
From the HRAD perspective, Anhui Province has an HRAD of less than 1, indicating that the fairness of health resource allocation among its geographical regions is relatively poor. In Zhejiang Province, the HRAD for healthcare professionals and registered nurses is less than 1, while the HRAD for licensed (assistant) physicians is greater than 1, suggesting that the fairness of health human resource allocation related to healthcare professionals and registered nurses across Zhejiang Province’s geographical regions needs improvement. Jiangsu Province and Shanghai Municipality have HRAD values above 1, indicating that the distribution of health resources among different geographical regions in these areas is more equitable. The equity in the distribution of health resources among different geographical regions in Shanghai Municipality is superior to that in other regions.
According to the distribution of the population, HRAD/PAD shows that Shanghai and Zhejiang have a relatively good distribution of health human resources. The proportion of health technicians in Jiangsu Province is greater than 1, while the proportions of licensed (assistant) physicians and registered nurses are between 0.9 and 1, indicating that Jiangsu Province needs to improve its fairness. The HRAD/PAD in Anhui Province is less than 1, indicating that Anhui Province still has considerable room for improvement in terms of fairness. This may be due to the contradiction between the development disparities among prefecture-level cities within Jiangsu Province and the allocation of health resources (see Tables 4–6 and Supplementary Tables 10–18).
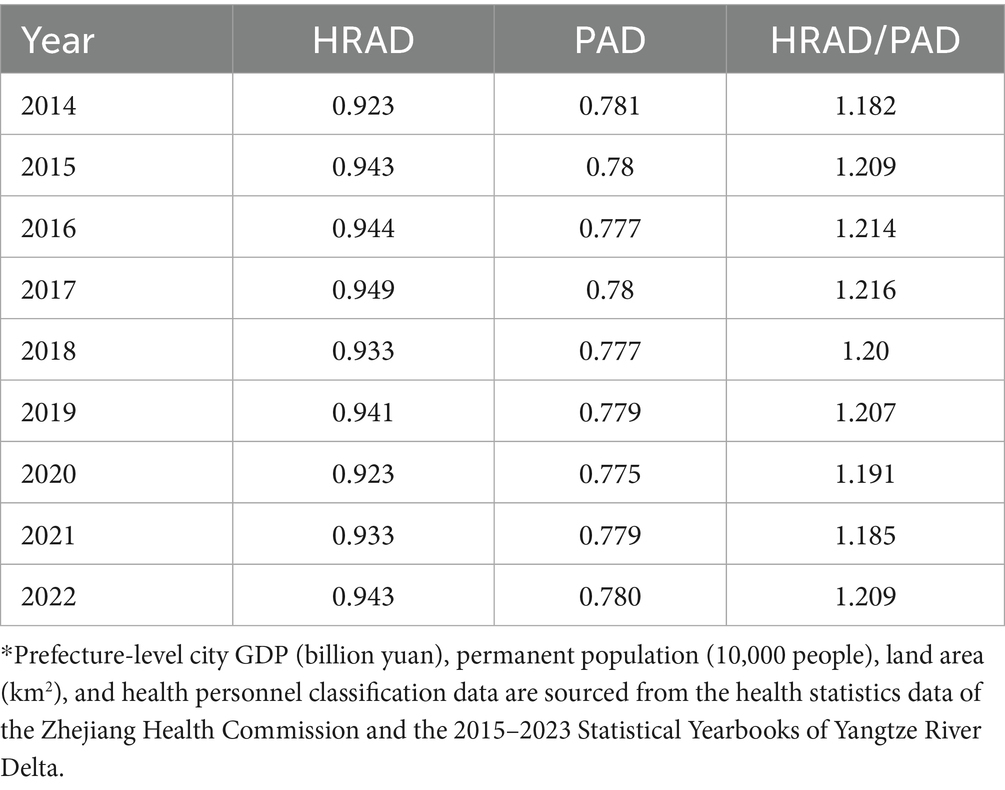
Table 4. The health resource agglomeration degree of health technicians staffing by population in Zhejiang, 2014–2022.
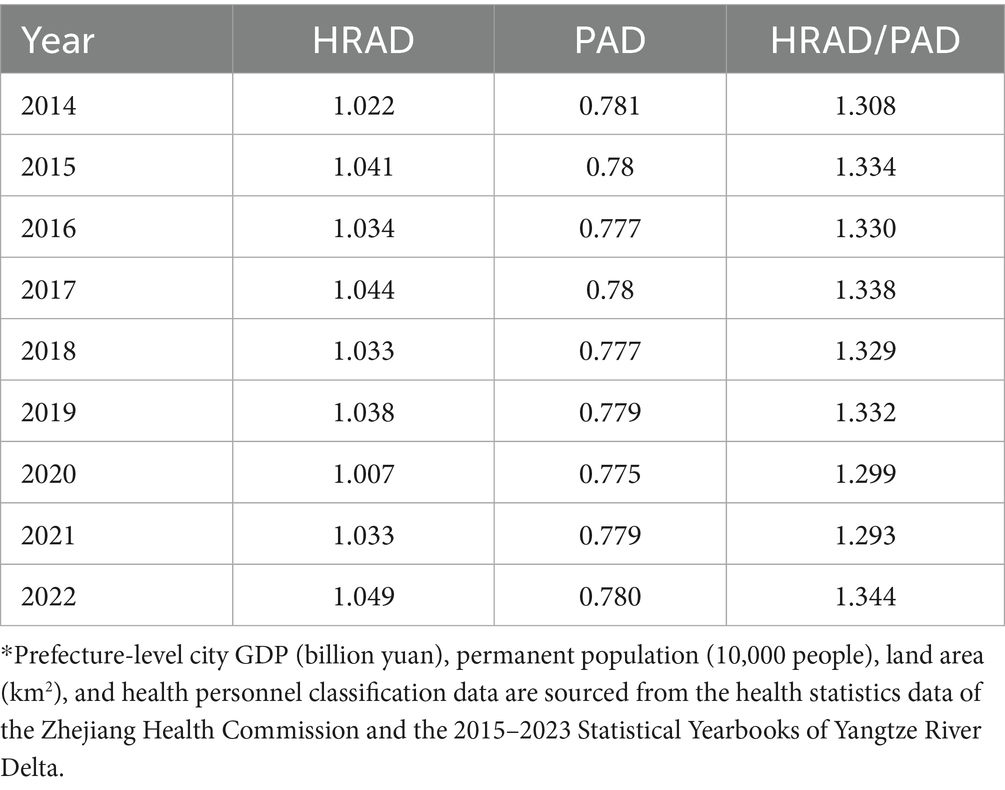
Table 5. The health resource agglomeration degree of licensed (assistant) physicians by population in Zhejiang, 2014–2022.
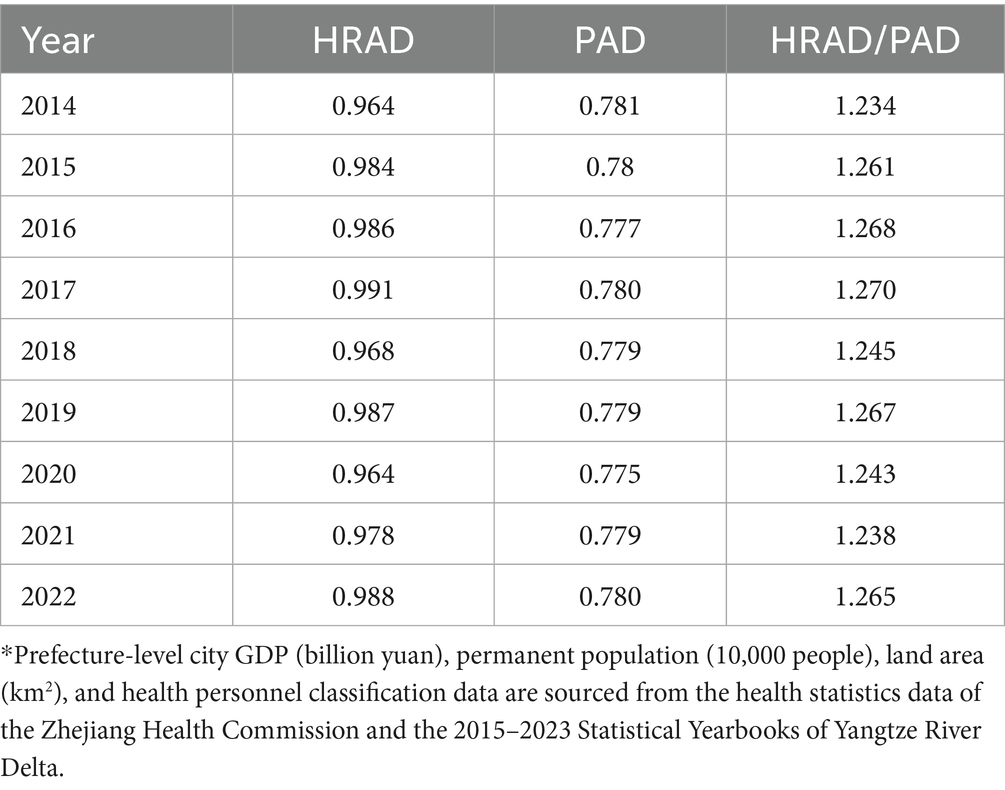
Table 6. The health resource agglomeration degree of registered nurses by population in Zhejiang, 2014–2022.
We have constructed a comprehensive comparison table across regions and resource types (see Supplementary Tables 19–22).
3.6 Fairness trend analysis
Trend analysis indicates that Zhejiang Province has seen slight improvements in the geographical distribution of licensed physicians. Jiangsu Province has experienced significant changes in geographical distribution (e.g., the Theil index for medical personnel β = 0.0034, p < 0.001), and there have been fluctuations in GDP distribution equity, necessitating attention to the structure of resource allocation. Shanghai has maintained relatively stable trends across various indicators. Anhui Province has seen a significant improvement in fairness in population distribution (e.g., the Gini coefficient for registered nurses, β = −0.0124, p < 0.001), but its geographical fairness still faces challenges. Detailed data can be found in Supplementary Tables 23–28.
4 Discussion
Research indicates that the allocation of healthcare human resources in the Yangtze River Delta region exhibits the typical characteristics of “overall growth, structural imbalance, geographical disparity, and intra-regional variation as the dominant factor.” Specifically, the total amount of health human resources in the Yangtze River Delta region has been improving, and the number of health technicians, licensed (assistant) physicians, registered nurses and the healthcare ratio per 10,000 people have been increasing, indicating that the growing demand for multi-level and diversified healthcare services from the people has been gradually met. However, the Opinions on Promoting the High-Quality Development of Public Hospitals clearly stated that the healthcare ratio should reach 1:2 (19, 20), and the current healthcare ratio in the Yangtze River Delta region still has a certain gap according to this, indicating that the internal structure of health resources needs to be further adjusted. The reason for this situation may be that with the ageing of China’s population (21, 22).
In view of the above reasons, the Yangtze River Delta region must adopt a dual-pronged strategy: firstly, leveraging its educational strengths (23), it should expand the scale of talent cultivation and enhance professional standards to optimise the overall calibre of its workforce; secondly, it must reform remuneration systems and broaden career progression pathways, thereby establishing a robust foundation for the coordinated and optimised development of healthcare professionals.
Meanwhile, geographic inequity has been found in previous studies to remain an unavoidable problem in the allocation of health human resources (24). This problem exists not only in China but also in other developing countries. For example, in India (25) and Mexico (26), inequality also exists in the geographical distribution of health workers. The World Health Organization’s report also notes that the healthcare industry is facing severe human resource challenges due to the impact of the COVID-19 pandemic. According to a 2023 report, at least 55 countries/regions are currently experiencing severe shortages of healthcare personnel. This issue is particularly severe in Africa, where 37 countries are struggling to address this shortage, which threatens their ability to achieve universal health coverage by 2030 (27, 28). This article comprehensively assesses the equity of health human resource allocation in the Yangtze River Delta region from different perspectives by integrating three methods to provide data support and theoretical basis for optimizing health resource allocation. Research findings indicate that when categorised by geographical region, the Gini coefficient and Theil index results for healthcare human resource allocation exceed those derived from population and GDP-based divisions. Moreover, intra-regional variation proves predominant, a conclusion robustly supported by substantial statistical evidence. Additionally, this result is consistent with the research findings of Ma (29), Shao (27), and Zhou (30). This provides greater confirmation of the effectiveness of the current distribution policy, which is primarily based on demographic factors, in achieving fundamental fairness. However, it also highlights that relying alone on population indicators may prove insufficient to overcome inequalities stemming from geographical and economic factors.
The health resource agglomeration degree not only reflects the efficiency of human resource allocation, but also directly affects the accessibility and equity of medical services. Research shows that there is an imbalance in the distribution of health resources in the Yangtze River Delta region. The reasons for this may include: insufficient accessibility of medical services (31) and the slowing effect of external shocks such as the COVID-19 pandemic on balanced development (32). An example is Anhui Province, where the healthcare human resource concentration (HRAD) has remained at less than 1, reflecting that equity still needs to be improved. This situation is related to the province’s relatively underdeveloped economic status within the Yangtze River Delta region. At the same time, the complex terrain of southern Anhui Province limits the development of transportation networks, further restricting the accessibility of resources. A deeper reason lies in the differences in provincial financial investment between regions, and the lack of attractiveness of grassroots healthcare positions, which exacerbates the outflow of healthcare workers. In contrast, Zhejiang Province prioritises universal healthcare coverage in its allocation of healthcare human resources but has relatively insufficient consideration of geographical factors, This focus may weaken service accessibility in remote areas and impact local capacity to respond to public health emergencies. Additionally, the outbreak of the COVID-19 pandemic has further exacerbated challenges in resource allocation. The pandemic may have reinforced the resource concentration effect in core cities such as Shanghai, Hangzhou, and Nanjing, while also accelerating the outflow of healthcare talent from economically underdeveloped regions, making regional imbalances more complex.
Therefore, it is recommended that the government take into account factors such as population, GDP, and geographical region when allocating resources in order to improve the accessibility of medical personnel services. Specifically, the most pressing priority at present is addressing geographical equity, with particular emphasis on alleviating inadequate access to healthcare resources caused by complex terrain and poor transport links (33). To mitigate this contradiction of ‘the worst geographical equity’, the requirements outlined in the ‘Opinions on Further Improving the Medical and Health Service System’ and other policy documents should be implemented, driving the establishment of urban medical consortiums and county-level healthcare communities. Optimise the spatial distribution of healthcare and health service institutions at all levels and categories. Implement policies to ‘sink’ high-quality medical resources and facilitate the free movement of medical personnel (34). Establish a support mechanism primarily based on ‘one-to-one’ partnerships supplemented by ‘one-to-many’ arrangements. Prioritise the deployment of highly qualified, specialised management and medical personnel to provide administrative and technical support to lower-tier institutions. This will drive the sinking of quality medical resources and enable rational spatial planning of medical and human resources (35). For example, in view of geographical imbalances, Shanghai has adopted the ‘15-min healthcare access zone’ approach to facilitate the sinking of medical resources, based on its own characteristics. Zhejiang Province’s ‘Mountain-Sea’ Healthcare Enhancement Project, by strengthening collaborative support between the province’s developed regions and mountainous and island counties, has also alleviated to some extent the resource allocation imbalance. Secondly, To address the intra-regional variation identified in the research, leveraging the establishment of the National Regional Medical Centres, a regional talent linkage network centred on core cities such as Shanghai, Hangzhou, and Nanjing shall be established. This will enhance mechanisms for two-way talent mobility and multi-site practice across regions (36), thereby facilitating the orderly flow and balanced distribution of high-quality medical human resources within provincial boundaries. Furthermore, the government should progressively leverage modern technologies such as artificial intelligence to empower telemedicine services. Establishing online medical diagnosis platforms would mitigate the impact of economic and geographical factors, optimise resource allocation, and enhance the coverage and efficiency of healthcare services (37).
Although this paper analyses health human resources, it has some limitations. First, the paper mainly focuses on local Chinese data and does not sufficiently discuss international cutting-edge equity assessment frameworks. Second, the paper does not discuss in detail the specific circumstances of establishment, redundancy, contract systems, and labour dispatch. This limits the formulation of policy recommendations on job allocation in health human resource allocation to a certain extent. Third, the classification of the research population is relatively vague, failing to distinguish between employed and unemployed personnel, which may obscure the internal structural inequality of health resources. Fourth, although using the permanent population as the denominator is consistent with planning practices, it does not quantify the impact of cross-city medical treatment. As a highly integrated region, the Yangtze River Delta sees widespread cross-city medical treatment among patients. This means that the HRAD value of a city may overestimate the accessibility of its resources to local residents or underestimate the actual service burden of its resources. In addition, the calculation of HRAD is susceptible to confounding factors such as economic indicators and transportation accessibility. Finally, the fairness of health human resources in the Yangtze River Delta region is related to the level of economic development in each region, but this point is not further researched in this article. As a next step, we can consider collecting data on health human resources and staffing, and fully consider the impact of factors such as population and economy on fairness, in order to more accurately propose countermeasures to promote the distribution of health resources in the Yangtze River Delta region.
5 Conclusion
The study shows that the allocation of healthcare human resources in the Yangtze River Delta region is influenced by three overlapping factors: population density, economic development gradients, and geographical accessibility. This has led to a concentration of resources, highlighting shortcomings in regional equity. In response to ‘Healthy China 2030’, the Yangtze River Delta region should establish pilot programmes for the mutual exchange of healthcare professionals among provinces, supplementing policies to accommodate local characteristics, promoting the mobility of local healthcare professionals, overcoming geographical and economic barriers, and promoting the balanced development of resources within the region. The experiences gained from the Yangtze River Delta should be transformed into a governance model that can be replicated nationwide.
Data availability statement
The original contributions presented in the study are included in the article/Supplementary material, further inquiries can be directed to the corresponding author.
Ethics statement
Ethical approval was not required for the study involving humans in accordance with the local legislation and institutional requirements. Written informed consent to participate in this study was not required from the participants or the participants’ legal guardians/next of kin in accordance with the national legislation and the institutional requirements.
Author contributions
QL: Writing – original draft, Writing – review & editing. SZ: Writing – original draft. ZJ: Writing – review & editing. DC: Writing – review & editing. KC: Writing – review & editing. YL: Writing – review & editing.
Funding
The author(s) declare that financial support was received for the research and/or publication of this article. This study was supported by Noncommunicable Chronic Diseases - National Science and Technology Major Project (2023ZD0509800, 2023ZD0509804).
Acknowledgments
The authors acknowledge the valuable advice and assistance provided by researcher Runlong Xu during the pre-conceptualization and revision of the article.
Conflict of interest
The authors declare that the research was conducted in the absence of any commercial or financial relationships that could be construed as a potential conflict of interest.
Generative AI statement
The authors declare that no Gen AI was used in the creation of this manuscript.
Any alternative text (alt text) provided alongside figures in this article has been generated by Frontiers with the support of artificial intelligence and reasonable efforts have been made to ensure accuracy, including review by the authors wherever possible. If you identify any issues, please contact us.
Publisher’s note
All claims expressed in this article are solely those of the authors and do not necessarily represent those of their affiliated organizations, or those of the publisher, the editors and the reviewers. Any product that may be evaluated in this article, or claim that may be made by its manufacturer, is not guaranteed or endorsed by the publisher.
Supplementary material
The Supplementary material for this article can be found online at: https://www.frontiersin.org/articles/10.3389/fpubh.2025.1650147/full#supplementary-material
Abbreviations
G, The Gini Coefficient; T, The Theil index; GDP, Gross Domestic Product; HRAD, Health Resource Agglomeration Degree; PAD, Population Agglomeration Degree; WHO, The World Health Organization.
References
1. Zhu, L, Gao, W, Zhang, S, Yu, F, Li, J, Feng, J, et al. Equality of healthcare resource allocation between impoverished counties and non-impoverished counties in Northwest China: a longitudinal study. BMC Health Serv Res. (2024) 24:830. doi: 10.1186/s12913-024-11312-5
2. Wang, X, Guo, Y, Qin, Y, Nicholas, S, Maitland, E, and Liu, C. Regional catastrophic health expenditure and health inequality in China. Front Public Health. (2023) 11:1193945. doi: 10.3389/fpubh.2023.1193945
3. Zhang, T, Sun, L, Li, S, Zhu, Y, and Ren, J. Analysis of equity and efficiency of public health resource allocation in China: based on HRAD and DEA. Chin J Health Policy. (2017) 10:57–62. doi: 10.3969/j.issn.1674-2982.2017.09.008
4. Shen, Y, and Sun, Z. Estimating the spatial correlation and convergence of China's healthcare resources allocation: evidence from the Yangtze River Delta region. Arch Public Health. (2022) 80:207. doi: 10.1186/s13690-022-00958-4
5. Chen, Y, Li, Q, Zhang, Y, Zhang, X, and Zheng, H. Investigating the efficiency of medical and health resources and its influencing factors in the Yangtze River delta urban agglomerations: based on the undesirable super-efficiency SBM-malmquist-tobit model. Front Public Health. (2025) 13:1527424. doi: 10.3389/fpubh.2025.1527424
6. Yip, W, and Hsiao, WC. What drove the cycles of Chinese health system reforms? Health Syst Reform. (2015) 1:52–61. doi: 10.4161/23288604.2014.995005
7. Ni, X, Li, Z, Li, X, Zhang, X, Bai, G, Liu, Y, et al. Socioeconomic inequalities in cancer incidence and access to health services among children and adolescents in China: a cross-sectional study. Lancet. (2022) 400:1020–32. doi: 10.1016/S0140-6736(22)01541-0
8. Yu, H, Yu, S, He, D, and Lu, Y. Equity analysis of Chinese physician allocation based on Gini coefficient and Theil index. BMC Health Serv Res. (2021) 21:455. doi: 10.1186/s12913-021-06348-w
9. Dai, G, Li, R, and Ma, S. Research on the equity of health resource allocation in TCM hospitals in China based on the Gini coefficient and agglomeration degree: 2009-2018. Int J Equity Health. (2022) 21:145. doi: 10.1186/s12939-022-01749-7
10. Li, Z, Yang, L, Tang, S, and Bian, Y. Equity and efficiency of health resource allocation of Chinese medicine in mainland China: 2013-2017. Front Public Health. (2020) 8:579269. doi: 10.3389/fpubh.2020.579269
11. Fu, Y, Wang, J, Sun, J, Zhang, S, and Huang, D. Equity in the allocation of general practitioner resources in mainland China from 2012 to 2019. Health Care. (2023) 11:398. doi: 10.3390/healthcare11030398
12. Wagstaff, A, Paci, P, and van Doorslaer, E. On the measurement of inequalities in health. Soc Sci Med. (1991) 33:545–57. doi: 10.1016/0277-9536(91)90212-u
13. Yu, Z, Li, X, Mu, F, Meng, Q, Wu, T, and He, L. Comparison of different calculation formulas for the Theil index. Chin J Health Stat. (2020) 37:124–6.
14. Wang, Z, He, H, Liu, X, Wei, H, Feng, Q, and Wei, B. Health resource allocation in Western China from 2014 to 2018. Arch Public Health. (2023) 81:30. doi: 10.1186/s13690-023-01046-x
15. Yao, H, Zhan, C, and Sha, X. Current situation and distribution equality of public health resource in China. Arch Public Health. (2020) 78:86. doi: 10.1186/s13690-020-00474-3
16. Kou, R, Mei, K, Bi, Y, Huang, J, Yang, S, Chen, K, et al. Equity and trends in general practitioners' allocation in China: based on ten years of data from 2012 to 2021. Hum Resour Health. (2023) 21:61. doi: 10.1186/s12960-023-00841-5
17. Yu, Q, Yin, W, Huang, D, Sun, K, Chen, Z, Guo, H, et al. Trend and equity of general practitioners' allocation in China based on the data from 2012-2017. Hum Resour Health. (2021) 19:20. doi: 10.1186/s12960-021-00561-8
18. Wang, Y, Li, Y, Qin, S, Kong, Y, Yu, X, Guo, K, et al. The disequilibrium in the distribution of the primary health workforce among eight economic regions and between rural and urban areas in China. Int J Equity Health. (2020) 19:28. doi: 10.1186/s12939-020-1139-3
19. Pu, W, Yue, X, Xiong, Q, Jia, K, and Zou, Y. The analysis of GM (1, 1) grey model to predict the health resource allocation in Jilin Province, China: an observational study. Medicine. (2024) 103:e39298. doi: 10.1097/MD.0000000000039298
20. Yang, J, Guo, A, Wang, Y, Zhao, Y, Yang, X, Li, H, et al. Human resource staffing and service functions of community health services organizations in China. Ann Fam Med. (2008) 6:421–7. doi: 10.1370/afm.888
21. Li, X, Su, M, He, L, Yang, J, and Wu, F. Spatial distribution patterns of human resources allocation in maternal and child healthcare institutions in China from 2016 to 2021. BMC Health Serv Res. (2024) 24:726. doi: 10.1186/s12913-024-11153-2
22. Liang, Z, Zhou, Q, Liu, H, Zhan, S, Yu, Y, and Qian, Y. The fairness of human resource allocation of geriatric general practitioners in China under the background of population aging. Chin Gen Pract. (2025) 28:3507. doi: 10.12114/j.issn.1007-9572.2024.0110
23. Zhang, H, Luo, D, Lu, Y, Zhu, H, Zhang, G, and Li, M. Growth and challenges of China's nursing workforce from 1998 to 2018: a retrospective data analysis. Int J Nurs Stud. (2021) 124:104084. doi: 10.1016/j.ijnurstu.2021.104084
24. Yan, W, Qin, C, Tao, L, Guo, X, Liu, Q, Du, M, et al. Association between inequalities in human resources for health and all cause and cause specific mortality in 172 countries and territories, 1990-2019: observational study. BMJ. (2023) 381:e073043. doi: 10.1136/bmj-2022-073043
25. Balarajan, Y, Selvaraj, S, and Subramanian, SV. Health care and equity in India. Lancet. (2011) 377:505–15. doi: 10.1016/S0140-6736(10)61894-6
26. Garcia-Diaz, R, Sosa-Rubí, SG, Lozano, R, and Serván-Mori, E. Equity in out-of-pocket health expenditure: evidence from a health insurance program reform in Mexico. J Glob Health. (2023) 13:04134. doi: 10.7189/jogh.13.04134
27. Shao, S, Niu, K, Qi, X, Li, F, Wang, L, Sheng, Y, et al. Human resource allocation status and equity research of centers for disease control and prevention in China from 2016 to 2020. Front Public Health. (2024) 12:1382343. doi: 10.3389/fpubh.2024.1382343
28. WHO (2023). 55 countries face a health worker crunch linked to COVID-19: WHO | UN news. Available online at: https://news.un.org/en/story/2023/03/1134562 (accessed August 8, 2025).
29. Ma, Y, Xiao, P, Yu, L, Ni, H, Huang, S, Wang, M, et al. The allocation and fairness of health human resources in Chinese maternal and child health care institutions: a nationwide longitudinal study. BMC Health Serv Res. (2023) 23:151. doi: 10.1186/s12913-023-09076-5
30. Zhou, M. Human resources allocation of the Centers for Disease Control and Prevention in China. Risk Manag Healthc Policy. (2024) 17:341–53. doi: 10.2147/RMHP.S452475
31. Wang, D, Cao, X, and Huang, X. Equity of accessibility to health care services and identification of underserved areas. Chin Geogr Sci. (2021) 31:167–80. doi: 10.1007/s11769-021-1181-0
32. Nie, P, Ding, L, Chen, Z, Liu, S, Zhang, Q, Shi, Z, et al. Income-related health inequality among Chinese adults during the COVID-19 pandemic: evidence based on an online survey. Int J Equity Health. (2021) 20:106. doi: 10.1186/s12939-021-01448-9
33. Chen, M, Chen, X, Tan, Y, Cao, M, Zhao, Z, Zheng, W, et al. Unraveling the drivers of inequality in primary health-care resource distribution: evidence from Guangzhou, China. Heliyon. (2024) 10:e37969. doi: 10.1016/j.heliyon.2024.e37969
34. Wei, H, Jiang, K, Zhao, Y, and Pu, C. Equity of health resource allocation in Chongqing, China, in 2021: a cross-sectional study. BMJ Open. (2024) 14:e078987. doi: 10.1136/bmjopen-2023-078987
35. Osiobe, SA. Use of information resources by health professionals: a review of the literature. Soc Sci Med 1982. (1985) 21:965–73. doi: 10.1016/0277-9536(85)90418-6
36. Wang, Y, Zhai, D, Xie, W, and Huang, S. Spatial optimization of hierarchical healthcare facilities driven by multi-source data: a case study of Shenyang, China. Front Public Health. (2025) 13:1640070. doi: 10.3389/fpubh.2025.1640070
Keywords: Yangtze River Delta region, health technicians, the Gini coefficient, the Theil index, health resource agglomeration degree
Citation: Li Q, Zheng S, Jing Z, Chen D, Chen K and Li Y (2025) Research on the equity of health manpower resource allocation in the Yangtze River Delta region. Front. Public Health. 13:1650147. doi: 10.3389/fpubh.2025.1650147
Edited by:
Chao Ma, Southeast University, ChinaReviewed by:
Gui Jin, China University of Geosciences Wuhan, ChinaKimiya Gohari, Tarbiat Modares University, Iran
Copyright © 2025 Li, Zheng, Jing, Chen, Chen and Li. This is an open-access article distributed under the terms of the Creative Commons Attribution License (CC BY). The use, distribution or reproduction in other forums is permitted, provided the original author(s) and the copyright owner(s) are credited and that the original publication in this journal is cited, in accordance with accepted academic practice. No use, distribution or reproduction is permitted which does not comply with these terms.
*Correspondence: Yingjun Li, MjAxNjAzNDAzNkBobWMuZWR1LmNu