 Megu Ohtaki1*
 Keiko Otani
 Hiroshi Yasuda
- 1The Center for Peace, Hiroshima University, Hiroshima, Japan
- 2Department of Radiation Biophysics, Research Institute for Radiation Biology and Medicine, Hiroshima University, Hiroshima, Japan
Purpose: Exposure of atomic bomb (A-bomb) survivors to non-initial (residual) radiation and consequent health effects has not yet been reliably estimated. This study aimed to quantify the contribution of non-initial radiation to the increase in solid cancer mortality risk among A-bomb survivors in Hiroshima through a comparative analysis considering geographical factors.
Data: We analyzed the data of 43,056 (17,603 men and 25,453 women) A-bomb survivors registered in the A-bomb Survivor Cohort Database (ABS) at Hiroshima University. These subjects were aged <50 years old at the time of the bombing and lived in Hiroshima Prefecture as of 1 January 1970, after being exposed within 5.0 km of the hypocenter.
Methods: The radiation doses and excess deaths from all solid cancers of the A-bomb survivors were estimated for districts geographically divided by distance and direction from the hypocenter. The dose was defined as the sum of the initial and non-initial radiation doses, and district-averaged non-initial doses were calculated. The excess relative risks (ERRs) of all solid cancer deaths were estimated using multivariate survival analysis with an additive parametric hazard model under the linear no-threshold (LNT) hypothesis. The γ-ray equivalent doses (Sv) from non-initial radiation were estimated based on the estimated ERRs.
Results: Estimated ERRs were notably higher west of the hypocenter than in the other directions. This trend increased with increasing distance from the hypocenter, and the ERRs in men were higher than those in women. Significantly higher ERR values of 52% (p < 0.01) for men and 29% (p < 0.05) for women were obtained at a distance of 2.0–2.5 km west of the hypocenter. The γ-ray equivalent doses estimated from these ERRs exceeded 2 Sv of the effective dose in men west of the hypocenter. This level was notably higher than the estimated initial radiation dose.
Conclusion: The findings of this study highlight the considerable contribution of non-initial radiation to the health consequences of the A-bomb survivors. These effects are attributable to the radionuclides generated by the A-bomb detonation, which were assumed to be carried by the wind to the west and deposited with rain in the western region from the hypocenter.
Introduction
Three large cohort studies on the health effects of atomic bomb survivors have been conducted independently by the Radiation Effects Research Foundation (RERF) (1–3), Hiroshima University (4, 5), and Nagasaki University (6). In many of these studies, chronic disease risks as mortality and incidence, were examined in relation to doses from the atomic bomb (called hereafter “A-bomb”), based on a linear no-threshold (LNT) model (7) or modified models. In the RERF studies, so-called “Life Span Study (LSS),” radiation doses of the A-bomb survivors were calculated using a dosimetry system, known as DS86 (8) or DS02 (9). These dosimetry systems provide only the initial radiation produced directly by the A-bomb detonation, but do not involve the non-initial (residual) radiation from the neutron-activated radionuclides in the surrounding materials and fallout particles. One of the reasons for this omission in the LSS was that the integrated dose from non-initial radiation was estimated to be 20–30 mGy in Hiroshima (10), which was much smaller than the initial radiation dose.
However, soon after the atomic bombing, clinicians and researchers focused their attention on the occurrence of acute radiation sickness (called hereafter “acute symptoms”) among A-bomb survivors, which could not be explained solely by the initial radiation dose (11, 12). Although it is highly difficult to accurately estimate the doses from radioactive microparticles immediately after the A-bomb detonation because reliable relevant data are lacking (13), few studies have attempted to determine the non-initial radiation doses. For example, Oho, a town doctor in Hiroshima, became suspicious of the possible existence of health effects of non-initial radiation during his practice, and conducted a 6-month health study of A-bomb survivors beginning in 1957 (14). He interviewed 3,946 A-bomb survivors and 692 entrants (those who entered the affected area near the hypocenter immediately after the A-bomb detonation in Hiroshima) and asked them about their exposure status, the presence and extent of acute radiation sickness, and behavior during the first 3 months after the bombing. The results showed that entrants had a higher incidence of acute symptoms than those who did not enter the affected area, and this tendency became more pronounced at a closer distance from the hypocenter (14–16). Matsuura et al. used Cox regression with a proportional hazards model to examine the risk of death from malignant neoplasms among early entrants, and found that only survivors who entered the affected area on the day of the atomic bombing (6 August 1945) had a significantly higher risk of death than the control group who entered on 9 August or later (17). Kamada et al. reported that the risk of leukemia among A-bomb survivors during 1970–1990 was 3.7 times (p < 0.05) higher for both sexes when the entry date was 6 August than among Japanese individuals in the same period (18). Otani et al. analyzed all solid cancer mortality among survivors who entered Hiroshima early by sex and age group at the time of the bombing (19), based on the multistage carcinogenesis hypothesis (20, 21). They considered the date of entry as a surrogate variable for the non-initial radiation dose and incorporated it into the model of excess relative risk (ERR) for comparison with the mortality risk of controls who entered Hiroshima City after 9 August. As a result, solid cancer mortality risks were significantly higher among persons who entered the City on the day of the bombing than among those who entered the City three or more days later. In addition, it was assumed that middle-aged people who entered the city on the day of the bombing were exposed to higher levels of non-initial radiation than younger people. A possible reason for this trend is presumed to be more engagement of middle-aged people in rescue and search activities for a longer period than other age groups immediately after the A-bomb detonation. Related to this issue, Sawada proposed that exposure to radioactive fallout can be largely attributed to the acute symptoms observed in A-bomb survivors (22).
As another subject related to non-initial radiation exposure, the geographical asymmetrical skew in cancer mortality risk is also difficult to explain in connection with the initial radiation dose alone. This non-circular symmetry in cancer mortality risk was identified through the Cox regression analysis of the LSS data (23). Tonda et al. conducted a semiparametric analysis of solid cancer deaths among A-bomb survivors in Hiroshima and visualized the non-circular symmetry of the mortality risk around the hypocenter (24).
Following these relevant findings and the knowledge that radioactive microparticles produced by the A-bomb in Hiroshima were carried by wind and rain soon after the bombing (25–28), we attempt in this study to conduct a more comprehensive analysis of the health effects attributed to non-initial radiation exposure, for which the distance and direction from the hypocenter can be critical factors.
Data and methods
Attributes of the subjects analyzed
In this study, we used data from the A-bomb Survivors Cohort Database, known as ABS, which was developed and managed by the Research Institute for Radiation Biology and Medicine (RIRBM), Hiroshima University (4, 5). The data registered in the ABS were issued by the Atomic Bomb Health Certificate from Hiroshima City or Hiroshima Prefecture. The subjects targeted in this study were A-bomb survivors who lived in the affected area in Hiroshima City at the time of the bombing and were confirmed to be Hiroshima residents on 1 January 1970. Therefore, those who temporarily stayed in Hiroshima City on 6 August 1945, and those who entered the affected area after the bombing were excluded. On the other hand, the A-bomb survivors who moved out of Hiroshima Prefecture after 1 January 1970 and remained contactable were included. The number of subjects fitting for the purpose was 43,056 (17,603 men and 25,453 women), who were in Hiroshima Prefecture as of 1 January 1970 (the year when their first interviews were conducted), aged < 50 years old at the A-bomb detonation, and received the initial radiation exposure within 5.0 km of the hypocenter. The maximum follow-up period was 41 years up to 31 December 2010.
The records of all solid cancer deaths of the people included in the ABS were based on the death certificates prepared by doctors and medical institutions, which were officially collected and organized by the Japanese government (currently the Ministry of Health, Labor and Welfare) as part of the Atomic Bomb Survivors Relief Project, a governmental project for providing relief to A-bomb survivors. Information on these deaths is included in the Vital Statistics Death Schedules released by the Prime Minister's Office. The mortality data of the Hiroshima A-bomb survivors, including the cause of death and migration status (going in or out of Hiroshima City), have been updated on a yearly basis according to the dynamic population statistics provided by Hiroshima City and Hiroshima Prefecture. Deaths due to any causes other than solid cancer were treated as mid-course termination, and those who moved out of Hiroshima Prefecture were excluded. Table 1 summarizes the attributes of these subjects, categorized by sex and age at the time of bombing, and the number of solid cancer deaths for the two age groups who died at < 80 and ≥ 80 years old. To maintain diagnostic accuracy on the death certificate and to avoid the risk of conflicts with other causes of death, the age of death was censored at 80 years in this study.

Table 1. Number of male and female subjects who died of solid cancer during the period of 1970 to 2010, classified by age at death and age at the bombing.
Evaluation of radiation dose
Hiroshima University developed a series of dosimetry systems for ABS to assess the health effects of exposure to A-bomb radiation (5). The first version called “ABS93D” (29) was revised to the latest version “ABS16D” by replacing the free-in-air kerma values of initial radiation, following the update of the RERF dosimetry system from DS86 to DS02 (30). In this ABS16D, radiation doses in cases of complicated shielding conditions other than in wooden houses in Japan are treated as missing, and the frequency of such cases is 32% within 2.0 km, although it varies slightly depending on the exposure distance, sex, and age at the time of the A-bomb detonation. Even when radiation doses were calculated according to shielding conditions, there were some discrepancies in the estimated doses due to differences between the ABS and LSS dosimetry systems regarding the methods used to collect information on the location and shielding conditions at the time of exposure. With regard to uncertainty, DS86 assumes that the magnitude of uncertainty for individual doses is generally 30–45%, which increases the risk estimates by 10–15% when such uncertainty is considered (30). In this analysis, we employed a single value of 10 for the relative biological effectiveness (RBE) of neutrons, as used in the original Life Span Study (LSS), and did not analyze separate contributions of neutrons and γ-rays. An upper limit of 4 Gy was set to minimize the effect of anomalous initial dose data on the estimation of dose-response parameters for some individuals exposed near the hypocenter, where the initial dose estimates were unusually high. Similar considerations have been made in recent analyses of cancer mortality and morbidity data in the LSS (1–3).
It should be noted that no system directly measured the non-initial (residual) radiation generated by the A-bombs in Hiroshima and Nagasaki. Therefore, we originally performed a semi-parametric survival regression analysis of the risk of all solid cancer deaths as objective variables, and initial radiation dose and exposure situations (combination of distance and direction from the hypocenter) as explanatory variables, using the data of ABS16D. Such a systematic analysis has not been performed quantitatively in previous studies.
Locations of survivors at the time of the atomic bombing
The area affected by the Hiroshima atomic bomb (Figure 1A) was divided into four ring regions, RA, RB, RC, and RD, in the order of proximity to the hypocenter, and each region was subdivided according to eight azimuthal districts (N, NE, E, SE, S, SW, W, and NW) centered on the hypocenter, as shown in Figure 1B. In addition, circular arc areas located in three directions (northeast, east, and southeast) between 2.5 km and 5.0 km from the hypocenter were added as a control district, resulting in a final set of 33 districts. The rationale for establishing such a control region was that a weak easterly wind blew over the central part of Hiroshima City, including the hypocenter, before and after the A-bomb detonation, and the dust produced by the explosion was carried mainly to the west of the hypocenter (22–25). The location at the time of the bombing can be characterized by the distance and direction from the hypocenter. The following five categories: RA (with the distance less than 1.2 km), RB (between 1.2 km and 1.6 km), RC (between 1.6 km and 2.0 km), RD (between 2.0 km and 2.5 km), and RE (greater than 2.5 km) were established for investigating the location effects of the A-bomb radiation. The RE region was selected as the control region where a hill, named “Hijiyama,” which has an altitude of approximately 100 m above sea level, was expected to have largely prevented non-initial radiation exposure attributed to the A-bomb detonation.
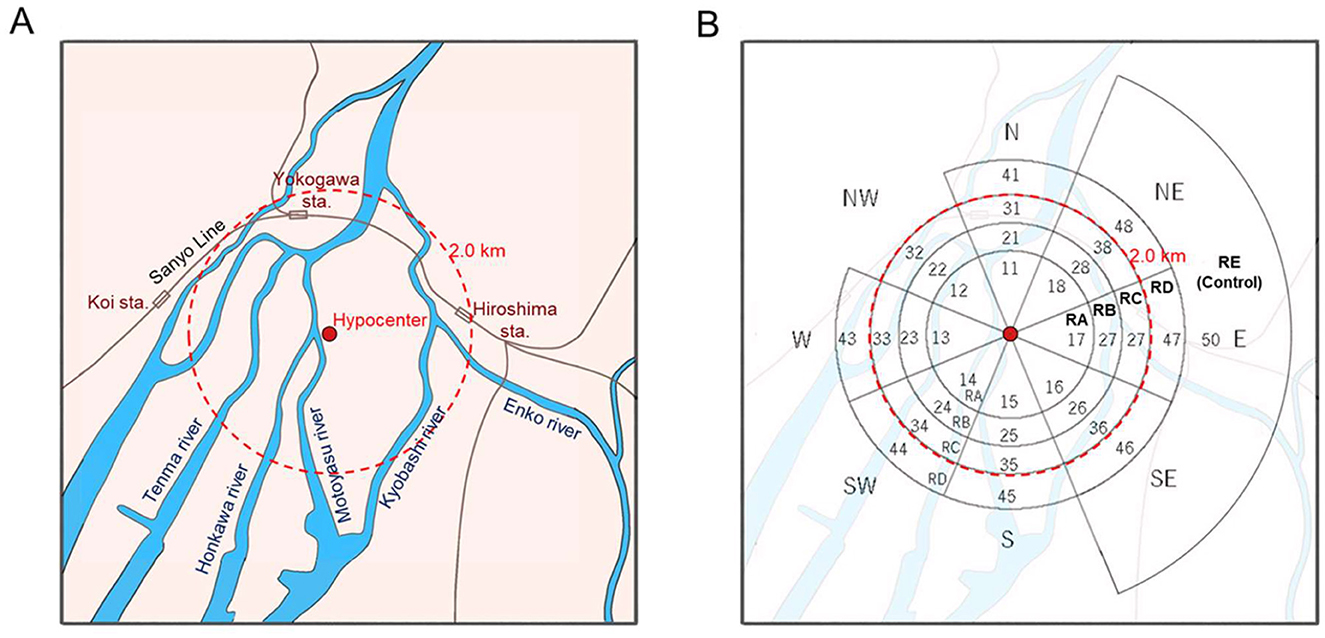
Figure 1. (A) A schematic map of the area mainly affected by the Hiroshima atomic bomb, and (B) the dividend districts with their codes allocated for the analysis in this study. The code numbers were given to circular arc areas classified by the following distances: less than 1.2 km (RA), between 1.2 km and 1.6 km (RB), between 1.6 km and 2.0 km (RC), between 2.0 km and 2.5 km (RD), and greater than 2.5 km (RE). The RE region was selected as the control.
Overview of the data on solid cancer deaths
Recordings were performed for solid cancer deaths and person-time using sex, age at exposure, attained age, duration of exposure, controls exposed beyond 2.5 km ground distance from hypocenter, DS02R1-weighted colon absorbed dose, and “high dose” index (4.0 Gy as total shielded kerma). The primary outcome was the solid cancer death rate. For reference, person-years of observation (PY) from January 1970 to the earlier date of death, 80th birthday, or December 31, 2010, were also obtained. The exposure distance on the ground from the hypocenter to the location of exposure, direction of the hypocenter, and initial radiation dose (Gy) were treated as exposure status factors, and sex and age at exposure were treated as exposure modifying factors. The relevant data are summarized in Tables 2, 3.
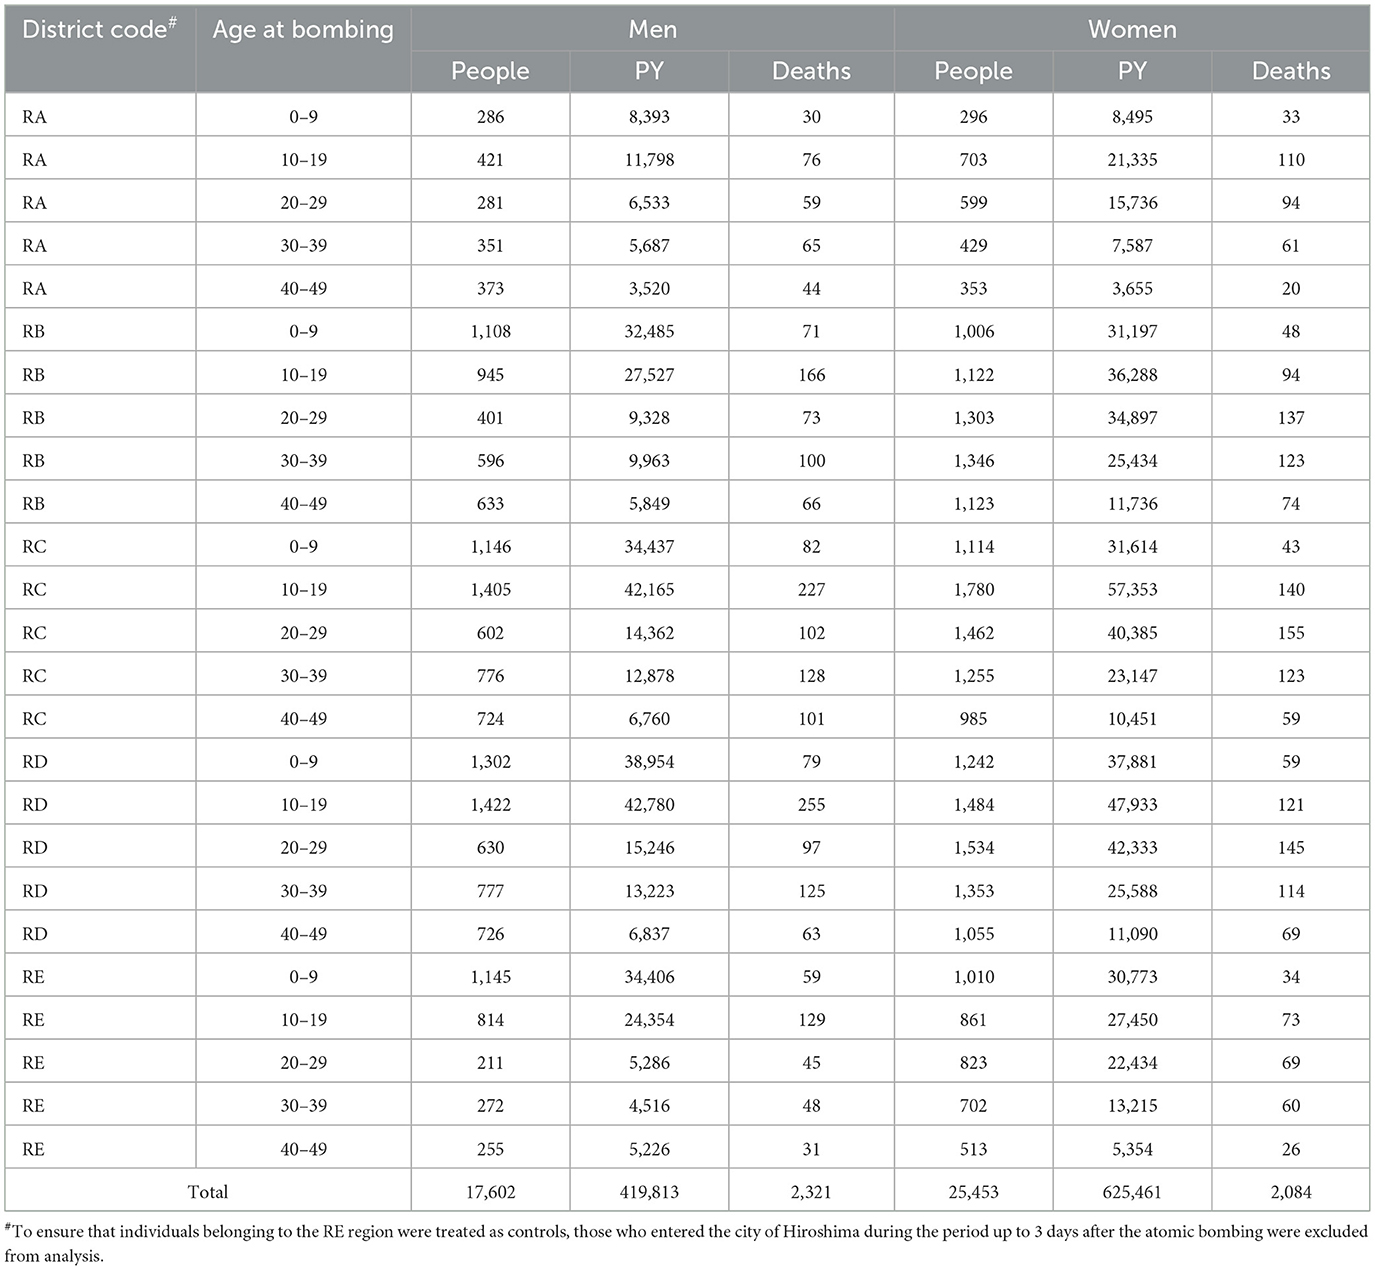
Table 2. Number of people by sex, person-years (PY), and solid cancer deaths categorized by district and age.
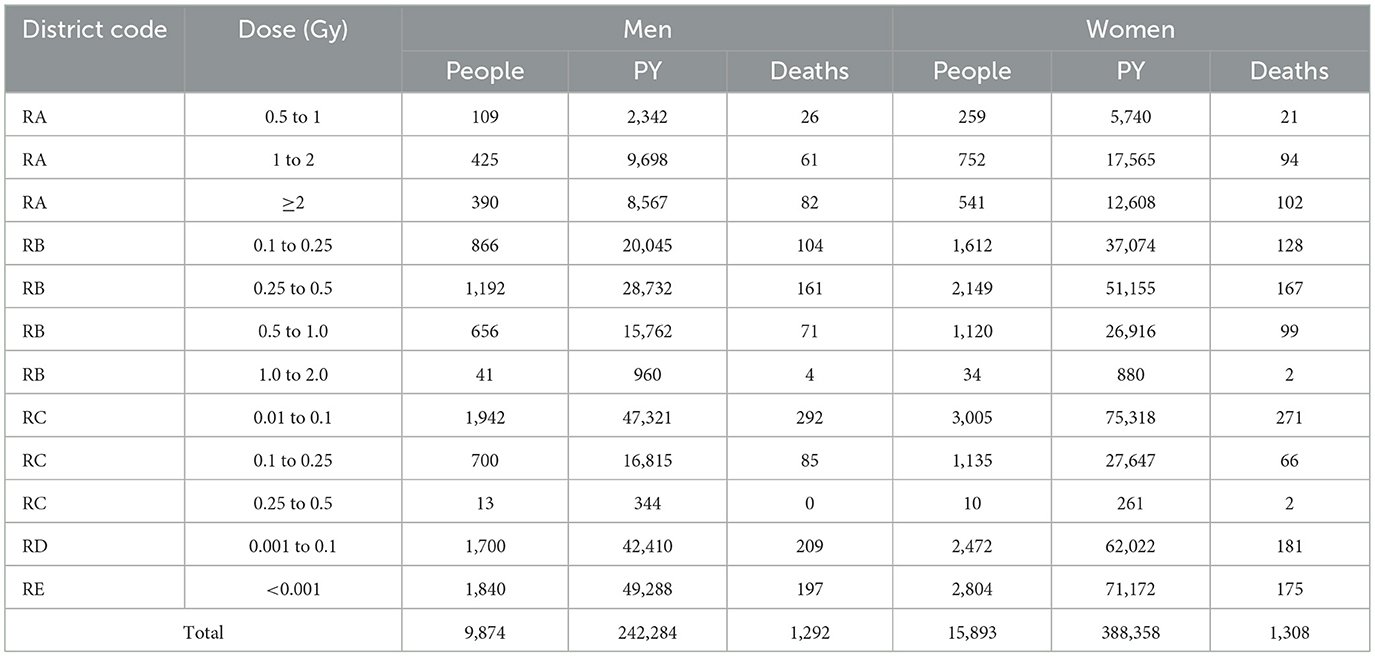
Table 3. Number of people by sex, person-years (PY), and solid cancer deaths categorized by initial radiation level.
To provide an overview of the geographical distribution of the risk of solid cancer mortality by location at the time of the atomic bombing, district-specific standardized mortality ratios (SMRs) were obtained, with the direction defined by the distance from the hypocenter. For each ring region, the observed number and expected number of deaths were calculated based on the data of all Japanese as the reference population (31) for 41 years from 1970 to 2010 for each age by sex, and the SMRs were calculated, as presented in Table A1 in Appendix.
Survival analysis for cancer mortality with a single point additional exposure
In the cohort treated in this study, the hazard function for solid cancer mortality in those of sex s (1: men, 2: women) exposed to initial radiation dose D and non-initial radiation dose R at age a at the time of exposure is assumed to be represented by a linear dose-response model based on the multistage hypothesis of radiation carcinogenesis as follows (1, 2),
where is a correction term that considers the beneficial health effects of the certified A-bomb survivors who have the A-bomb Survivors' Health Handbook issued by the Japanese government, and h0(t|s, a) is a spline function that represents the baseline for the solid cancer mortality rate for the entire country of Japan. The ERR of solid cancer deaths was assumed to be represented by a modification of the radiation effect by a and attained age t, using the following multiplicative log-linear model,
where τs is a parameter that expresses the dependence of sensitivity to radiation exposure on age-at-exposure, and φ(a) = (a − 30/10). As any analysis in this study was conducted separately for each sex, sex-related notations in the relevant equations were omitted. For individuals followed from the starting age to the ending age at a time point higher than the age at exposure, the cumulative hazard can be expressed from Equations 1, 2 as follows:
The distribution of non-initial radiation dose was considered to be a composite of a factor R(R) that depends only on the exposure distance and a factor R(W) with east-west deviation due to the east wind effect. Thus, it was assumed that R = R(R)+R(W),
where are the parameters to be estimated. These values cannot be directly obtained through measurements, but can be formulated as surrogate quantities using indicator functions of exposure distance, which are denoted by indicator variables IA, …, ID and the axis of the exposed location (x, y) with
Logarithmic function of likelihood
The data on deaths from all solid cancers among atomic bomb survivors in Hiroshima from January 1970 to December 2010 were given by (ai, ui, vi, , Di, Ri), i = 1, …, n. If the number of deaths from all solid cancers was the realized value of the random variable indicating the presence or absence of deaths from all solid cancers among A-bomb survivors, the log likelihood is expressed as follows,
where ui is the age of individual i at the beginning of the observation period; vi is the age at the end of the observation period; and h0(t|a) is the hazard of mortality at age t for a person whose age was a in August 1945 in the reference population (Japanese national average). The expected number (rate) of deaths of individual i during the entire observation period is given by
The second term of Equation 8 is expressed as follows,
where m1 = #{i|yi = 1}. Therefore, the maximum likelihood estimate of the unknown parameters is given by maximizing the following function:
The unknown parameters, ψ, τ, β and θ in Equation 11 were estimated using an algorithm for optimization with the limited memory Broyden–Fletcher–Goldfarb–Shanno method (32). These analyses were performed by using the function “optim” in the statistical computing software “R” ver. 4.4.1 (The R Foundation).
Results
SMR of solid cancers
The geographic distribution of the calculated SMRs for solid cancers in the Hiroshima A-bomb location at the time of bombing is plotted in Figure 2. The SMR values are summarized in Table A1 in Appendix, where the point estimates and 95% confidence intervals for each district's SMR are listed along with the numbers of deaths and expected deaths. The point estimates of SMR for the control (RE) region were 0.828 and 0.838, for men and women, respectively. It was found that the SMR of solid cancer deaths among Hiroshima A-bomb survivors varied with distance from the hypocenter, showing notably different patterns from those of the initial radiation dose. The SMR values did not show a monotonically decreasing trend with distance from the hypocenter, but became higher on the west side of the hypocenter than on the east side, and this tendency was more pronounced in men than in women.
![Two polar plots showing Standardized Mortality Ratios (SMR) for men and women across different regions RA, RB, RC, RD, and RE. Both plots use colored segments to represent SMR ranges: purple [0.00, 0.70], green [0.70, 0.90], cyan [0.90, 1.10], yellow [1.10, 1.30], and red [1.30, 9.99]. The X and Y axes indicate kilometers, ranging from -3 to 3.](https://www.frontiersin.org/files/Articles/1651887/fpubh-13-1651887-HTML-r1/image_m/fpubh-13-1651887-g002.jpg)
Figure 2. Geographical distributions of standard mortality ratios (SMRs) of solid cancers estimated for men (Left) and women (Right).
Goodness of fit of candidate models
Table 4 shows the results of calculating the log likelihood and AIC as indicators of goodness of fit to the data for several models. The table shows that models with ring indicator variables for RB, RC, and RD regions, which represent the distance dependence of excess risk in regions 1.2 km or more from the hypocenter, had a lower goodness of fit than models without these indicator variables. This result suggests that the ground-distance effects of non-initial radiation exposure on the ERR were minor. Nevertheless, the models using ring-direction interaction variables (JC, JD) related to the RC and RD regions for the trends of the east-west difference improved the goodness of fit. Among the candidate models, Model 10 was selected as the optimal model minimizing AIC, which did not use ring area indicators (IB, IC, ID) but used ring-direction interaction variables (JC, JD). Model 12, which used only initial radiation exposure, had the lowest goodness of fit.
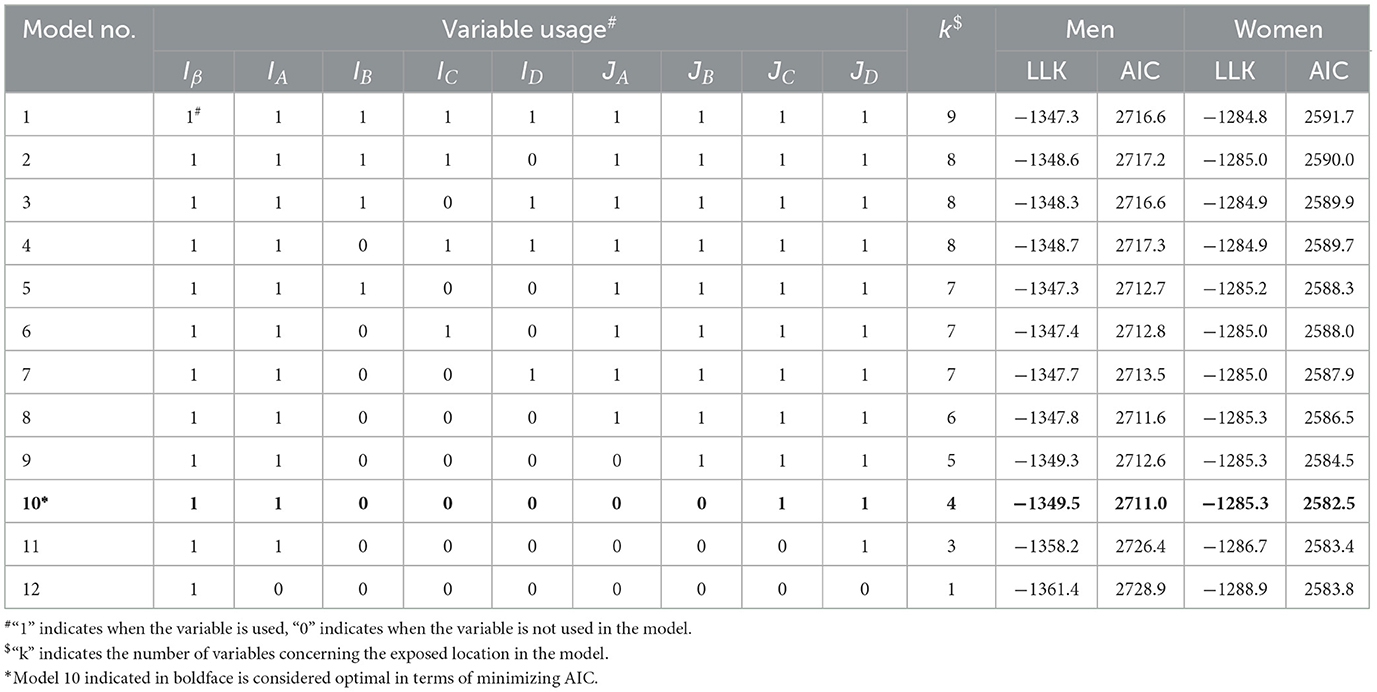
Table 4. Goodness of fit for candidate models, Likelihood (LLK) and AIC with 12 models.
Estimates of parameters for the ERR of solid cancer mortality among A-bomb survivors
The properties of the parameter estimates were inspected based on Model 9, which included the optimal model (Model 10) as one of the closest submodels. Table 5 shows the point estimates of β, θ(R), θ(W), ψ and τ, standard errors, 95% confidence intervals and statistical significance resulting from fitting with Model 9 (see Table 4). For men, the point estimate of the ERR due to non-initial radiation was 0.191 in the RA region adjacent to the hypocenter, which was much higher than 0.120 because of the initial radiation exposure of approximately 1 Gy, although it was not statistically significant. Regarding the west high effect (R(W)), a highly significant excess risk of more than 30% is detected on the west side of the RC and RD regions, with a significance of p < 0.01. For women, except for the west side of the RD region, no location dependence with a statistical significance was detected. Table 6 shows the results of the analysis when only the effect of the initial radiation dose was modeled, which were almost identical to those in the LSS report (1).
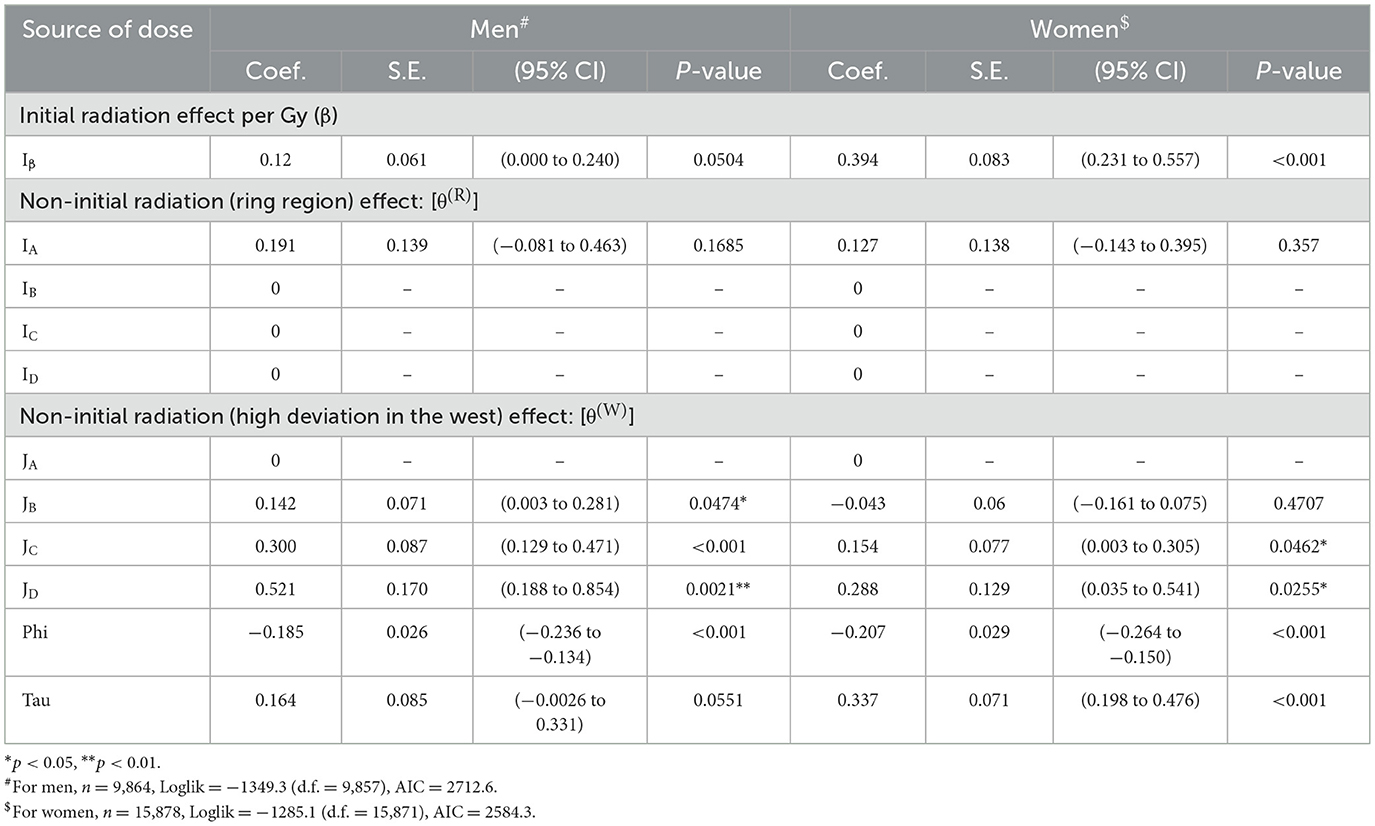
Table 5. Estimated regression coefficients and relevant data for an optimized model with initial radiation and non-initial radiation exposures.
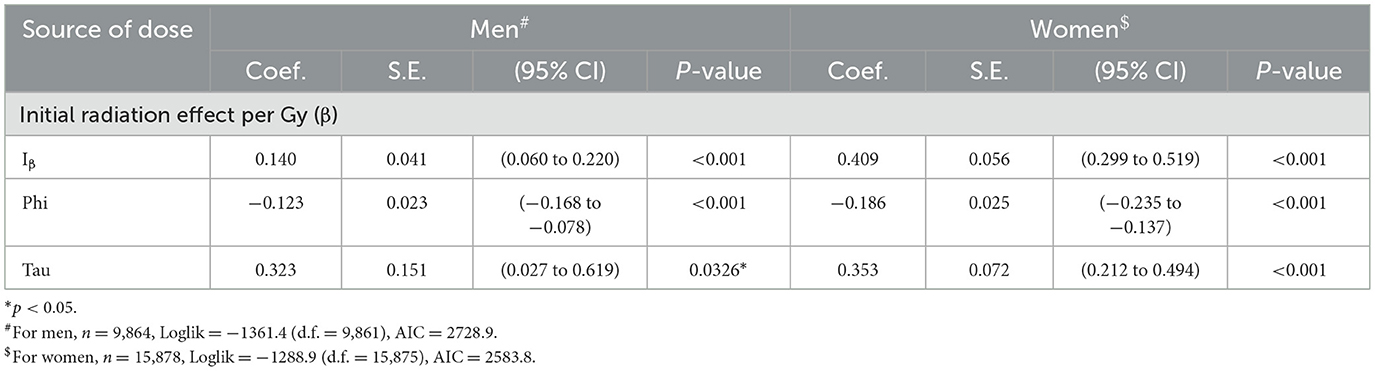
Table 6. Estimated regression coefficient and relevant data for the model with only initial radiation exposure.
According to the point estimates of the ERRs of all solid cancer deaths among A-bomb survivors in the control (RE) region, anti-log of phi (eψ) was 0.831 for men and 0.813 for women, both of which were significantly lower than 1.0. This implies that A-bomb survivors treated as controls in this analysis had a lower risk of solid cancer death than the Japanese national average general population. When the optimal model was applied, the age-at-exposure-dependent coefficient of radiosensitivity (τ) was estimated as 0.167 for men and 0.337 for women.
Parallel boxplots of estimated ERRs for persons of the attained age of 70 years old after exposure at the age of 30 years old, simplifying the calculation of Equation 2, by the western and eastern semi-annular regions and sex are shown in Figure 3. The top panel (A), which presents the parallel boxplots of the ERR distribution due to total (initial and non-initial) radiation, shows a difference between the western and eastern semi-annular area (RB, RC, and RD regions) by sex. The middle panel (B), which presents similar boxplots for initial radiation, shows no difference between the western and eastern semi-annular regions in each common ring region. The bottom panel (C), which presents the ERRs due to non-initial radiation exposure, shows that the western semi-annular area (RC and RD regions) had much higher ERRs than the eastern semi-annular regions. This trend was more pronounced for men, noting that the ERRs for men became higher west of the hypocenter (RC and RD regions) beyond 1.6 km from the hypocenter, and were almost the same at the area adjacent to the hypocenter (RA region).

Figure 3. Boxplots of estimated excess relative risks (ERRs) in the circular arc areas categorized by direction from the hypocenter (see Figure 1B) for men (left) and women (right): (A) estimated ERRs attributed to total radiation exposures, (B) estimated ERRs attributed to initial radiation exposure, and (C) estimated ERRs attributed to non-initial (residual) radiation exposure. AW, BW, CW, and DW are the western half areas of the RA, RB, RC, and RD, respectively, and AE, BE, CE, and DE are the eastern half areas of the RA, RB, RC, and RD, respectively.
Based on the district-specific ERRs of all solid cancer deaths attributed to non-initial radiation, we estimated the dose due to non-initial radiation in sieverts by district by calculating the ratio of the increase in ERR due to initial radiation exposure per Gy to the estimated value. For example, the ERR from non-initial radiation within 1.2 km of the hypocenter (RA region) was calculated as 0.191 for men and 0.127 for women. Since the ERR per 1 Gy of initial dose is 0.120 for men and 0.394 for women, the average non-initial dose (in Sv) in the RA region was estimated to be 0.191/0.120 = 1.59 (Sv) for men and 0.127/0.394 = 0.32 (Sv) for women. These non-initial radiation doses include the chronic exposures of the A-bomb survivors registered in the Hiroshima University cohort database (ABS) as of 1970, that is, the accumulated doses for approximately 25 years from August 6, 1945. However, according to the half-lives of the major radionuclides produced by the A-bomb neutrons (33), it is presumed that these survivors received most of the non-initial doses within several days after the A-bomb detonation.
The estimated district-specific doses (Sv) attributed to non-initial radiation exposure are shown in Figure 4. Detailed numerical data are summarized in Table A2 in Appendix. For both men and women, while non-initial radiation doses were notably high near the hypocenter (RA region) as expected (34), high doses were similarly obtained west of the hypocenter. Particularly for men, the radiation doses in the area 2 km west of the hypocenter exceeded 2 Sv, which was higher than that near the hypocenter (RA region). In contrast, the estimated doses east of the hypocenter were remarkably low (less than 0.01 Sv) at distances greater than 1.2 km.
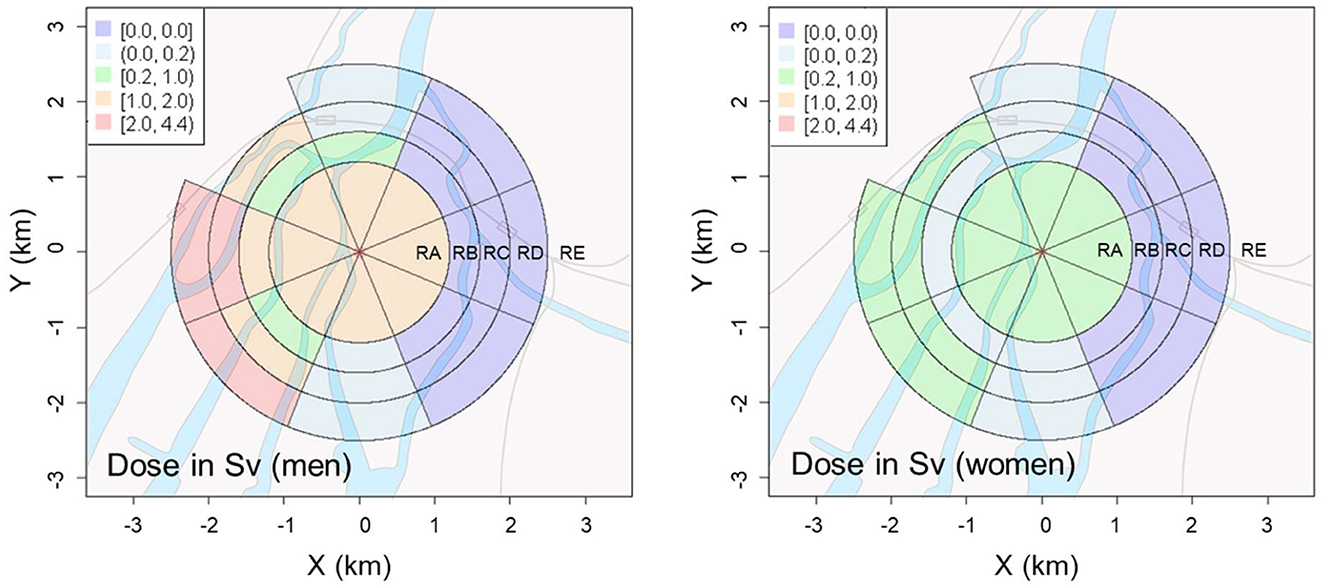
Figure 4. Geographical distributions of radiation dose from non-initial radiation induced by the A-bomb in Hiroshima City for men (Left) and women (Right).
Discussion
Background of solid cancer risks in Japan
According to estimates from the National Cancer Center Japan (31), the SMR of Hiroshima Prefecture from 2009 to 2013 was 0.971 for men and 0.911 for women. In our analysis using the data of the Japanese population (35) as reference, the SMR of the control (RE) region, where all people were the Health Handbook holders (i.e., certified A-bomb survivors), was 0.831 (e−0.185) for men and 0.813 (e−0.207) for women. While the initial and non-initial radiation doses of the A-bomb survivors in the control region were both nearly zero, this observation should not be interpreted simply as hormesis effects (19, 36), because this can be partially explained by the beneficial effects of holding the A-bomb Survivor (Hibakusha) Certificate, which may have outweighed the adverse effects of A-bomb radiation exposure, as these certified survivors were able to receive free medical checkups and treatments that could effectively have reduced the risk of solid cancer death. Future studies should cautiously discuss whether this phenomenon is specific to solid cancer deaths or is observable in cancer incidence and other chronic diseases.
Factors contributing to the geographical distribution of ERRs
We found that the risk of solid cancer deaths increased in the western suburbs of the hypocenter for both men and women. Because a weak easterly wind blowing to the west over the city of Hiroshima was observed on the day of the atomic bombing (25, 27), it was probable that radioactive microparticles produced by neutron activation near the hypocenter were carried by the easterly winds to the west of the hypocenter, and caused radioactive contamination due to the rain (known as “black rain”) in these regions.
The point estimates of the ERRs for all solid cancer deaths in the hypocenter area suggest that the contribution of the non-initial radiation dose (Figure 3C) was as large as that of the initial radiation dose (Figure 3B) (11, 12, 36). It should be noted that statistically significant differences were not found (Table 5) owing to the small number of subjects exposed in the vicinity of the hypocenter and the multicollinearity problem caused by the large (negative) correlation between initial dose and distance from the hypocenter. Although the upward deviation of ERR near the hypocenter below 1.2 km may be explained by applying a non-linear (higher-order) dose-response model or by assuming a higher value (>10) of neutron RBE (37–39), the issue regarding the upward deviation of ERR confined to the west of the hypocenter above 1.2 km remains unsolved. This result may be due to the non-negligible effect of secondary radiation from the radionuclides that would have been produced in large quantities owing to the neutron activation.
Individual differences in non-initial radiation dose
As the non-initial radiation dose is dependent on the time period of exposure, the post-detonation behavior that could affect the exposure time is considered to be an important factor in individual dose assessments. The age and sex (gender) of the exposed person are major factors related to their behavior. Figure 4 and Table A2 in Appendix indicate that the non-initial radiation dose for men was several times higher than that for women in most areas. Thus, it is assumed that men were likely to have remained more active than women soon after the A-bomb detonation through urgent work, such as rescue and searching. Although a more precise analysis considering age at exposure is expected to reveal this association, such a comprehensive analysis is currently difficult owing to insufficient data.
As a rare relevant study, Oho compared the incidence of acute symptoms among those who went to the hypocenter immediately after the A-bomb detonation with those who did not (14). They attempted to explain the status of non-initial radiation exposure and related the observed health effects to immediate post-bombing behaviors. This finding indicates that the health effects of non-initial radiation are dependent on individual behaviors, rather than the distance from the hypocenter, that is, the initial radiation dose.
Possible source of non-initial radiation
According to a few previous studies regarding the contribution of non-initial radiation, the estimated initial radiation doses to A-bomb survivors who were exposed at distances greater than 2.5 km from the hypocenter or who entered the city were at most several tens of mGy (10, 40, 41). In contrast, the doses estimated in this study (>300 mSv for women and >1.5 Sv for men in the vicinity of the hypocenter, and >400 mSv for women and 2.0 Sv for men in a large area 2 km west of the hypocenter) were significantly higher than the previously reported doses (10, 40, 41). This difference can be explained by the fact that the previous dose estimates did not consider exposure from inhalation of airborne radioactive dust (mostly microparticles), whereas our dose estimates did. The results of this study imply that the contribution of such inhaled radioactive particles to the radiation exposure of A-bomb survivors was notably higher than previously thought, although further research is needed to verify this implication.
Tanaka et al. examined stable chromosome aberration in peripheral blood lymphocytes of 17 crew members of eight fishing vessels and two crew members of one cargo ship in detail by the G banding method 60 years after the nuclear tests conducted by the United States at the “Bravo” hypocenters on Bikini Atoll and Eniwetok Atoll in the Marshall Islands (42). The crew of tuna fishing boats and cargo ships operated approximately 150–1,200 km from the test sites at the time of hydrogen bomb detonation and received exposures to radioactive fallout. Compared to nine age-matched controls, they found that the percentage of stable-type abnormalities was 3.35% in the exposed group, which was significantly higher (by 2.45%) than that in the control group (42). After a comparison of the half-lives of the major radionuclides, 56Mn (half-life: 2.6 h) and 28Al (half-life: 2.2 min) have emerged as essential sources. Although the effect of 24Na (half-life 15.0 h) cannot be ruled out, the results of the ABS-based study by Matsuura et al. (17) and by Otani et al. (19) showed that the excess relative risk for those who entered the city on 6 August was significantly higher than that for those who entered on 9 August, as the dependence of the risk of shape cancer among A-bomb survivors on the date of entry, and those who entered after 10 August, and the excess relative risk for those who entered the market after 10 August was reduced to a few percent. Thus, it is unlikely that exposure to 24Na, which has a relatively long half-life of 15 h, brought a significant effect. In the case of the A-bomb detonation in Hiroshima, fine particles containing 28Al and 56Mn may have caused considerable radiation exposure and the resultant increase of cancer risk, as suggested in previous studies (43, 44). In a recent experimental study on this subject using rats by Hoshi et al., the magnitude of the health effects of hot particles was 20 times higher than that of uniform exposure to the same absorbed dose of gamma-rays in terms of pathology and gene expression (45).
Limitations of this study
Because the development of this cohort began in 1970, the death records for the period immediately after the bombing (1945–1969) were not included in this study. Accordingly, the causal relationship between mortality and radiation dose may be distorted for cancers with a short latency period, such as thyroid cancer (latency period: 15–20 years), although this effect is considered small, as many radiation-induced solid cancers normally require more than 25 years after exposure to appear. However, we should recognize that various types of biases emerged for 25 years or more after the end of World War II.
Our analysis suggests that the dose rate and duration of non-initial radiation exposure of A-bomb survivors were largely affected by their behavior soon after the bombing, which could greatly vary depending on individual situations. Although the estimated cumulative non-initial radiation dose was reported to be several tens of mGy in previous studies (10, 40, 41), these estimates were likely underestimated because they did not consider possible changes in individual behavior. Unfortunately, it is almost impossible to precisely calculate the individual doses based on their behavior, owing to the chaotic situation immediately after the A-bomb detonation. Further efforts are required to achieve more accurate assessments of the doses and risks of A-bomb radiation on an individual basis.
Conclusion
In this study, we pointed out that the geographic and sex differences in solid cancer deaths among the A-bomb survivors who lived in the affected area cannot be explained by initial radiation alone, and implied that the non-initial (residual) radiation, which was attributable to radioactive microparticles carried by the east wind and rain, was likely to have contributed to the observed increase in the excess relative risk (ERR) in the western region from the hypocenter. Our analysis indicates the additional health effects of late exposure to non-initial radiation generated by A-bomb detonation. These findings should be useful for more reliable evaluations of the potential risks of nuclear weapons and for discussing effective measures to minimize the medical consequences in a possible nuclear emergency situation in the future. Further efforts are required to precisely determine the dose distribution of non-initial radiation and to explain the dose-dependent excess mortality risk due to a specific cancer on an individual basis. In parallel, it is desirable to further develop relevant epidemiological and animal studies to clarify the biological effects of inhalation and ingestion of A-bomb-induced radioactive microparticles, which are still poorly understood.
Data availability statement
The original contributions presented in the study are included in the article/supplementary material, further inquiries can be directed to the corresponding author.
Author contributions
MO: Conceptualization, Data curation, Formal analysis, Investigation, Methodology, Software, Writing – original draft, Writing – review & editing. KO: Data curation, Investigation, Validation, Writing – original draft, Writing – review & editing. MH: Investigation, Project administration, Supervision, Writing – review & editing. HY: Funding acquisition, Investigation, Resources, Validation, Visualization, Writing – original draft, Writing – review & editing.
Funding
The author(s) declare that financial support was received for the research and/or publication of this article. This study was financially supported by JSPS KAKENHI (Grant number: 19H01149) in Japan.
Conflict of interest
The authors declare that the research was conducted in the absence of any commercial or financial relationships that could be construed as a potential conflict of interest.
Generative AI statement
The author(s) declare that no Gen AI was used in the creation of this manuscript.
Any alternative text (alt text) provided alongside figures in this article has been generated by Frontiers with the support of artificial intelligence and reasonable efforts have been made to ensure accuracy, including review by the authors wherever possible. If you identify any issues, please contact us.
Publisher's note
All claims expressed in this article are solely those of the authors and do not necessarily represent those of their affiliated organizations, or those of the publisher, the editors and the reviewers. Any product that may be evaluated in this article, or claim that may be made by its manufacturer, is not guaranteed or endorsed by the publisher.
Supplementary material
The Supplementary Material for this article can be found online at: https://www.frontiersin.org/articles/10.3389/fpubh.2025.1651887/full#supplementary-material
References
1. Ozasa K, Shimizu Y, Suyama A, Kasagi F, Soda M, Grant EJ, et al. Studies of the mortality of atomic bomb survivors, report 14, 1950–2003: an overview of cancer and noncancer diseases. Radiat Res. (2012) 177:229–43. doi: 10.1667/RR2629.1
2. Grant EJ, Brenner A, Sugiyama H, Sakata R, Sadakane A, Utada M, et al. Solid cancer incidence among the life span study of atomic bomb survivors: 1958–2009. Radiat Res. (2017) 187:513–37. doi: 10.1667/RR14492.1
3. Brenner AV, Preston DL, Sakata R, Cologne J, Sugiyama H, Utada M, et al. Comparison of all solid cancer mortality and incidence dose-response in the Life Span Study of atomic bomb survivors, 1958–2009. Radiat Res. (2022) 97:491–508. doi: 10.1667/RADE-21-00059.1
4. Matsuura M, Hoshi M, Hayakawa N, Shimokata H, Ohtaki M, Ikeuchi M, et al. Analysis of cancer mortality among atomic bomb survivors registered at Hiroshima University. Int J Radiat Biol. (1997) 71:603–11. doi: 10.1080/095530097143932
5. Hirota S, Yasuda H, Kawakami H, Yoshinaga S. Prospects and status of the dosimetry system for atomic bomb survivor cohort study conducted at Research Institute for Radiation Biology and Medicine of Hiroshima University. J Radiat Res. (2021) 62:i107–13. doi: 10.1093/jrr/rrab020
6. Yokota K, Mine M, Honda S, Tomonaga M. Cancer mortality in Nagasaki atomic bomb survivors with epilation. Acta Med Nagasaki. (2005) 50:73–6.
7. International Commission on Radiological Protection (ICRP). ICRP Publication 103: the 2007 recommendations of the international commission on radiological protection. Ann. ICRP. (2007) 37:2–4.
8. Roesch WC, editor. US-Japan Joint Reassessment of Atomic Bomb Radiation Dosimetry in Hiroshima and Nagasaki. Final Report. Hiroshima: Radiation Effects Research Foundation (1987).
9. Young RW, Kerr, GD, editors. Reassessment of the Atomic Bomb Radiation Dosimetry for Hiroshima and Nagasaki – Dosimetry System 2002 (DS02). Hiroshima: Radiation Effects Research Foundation (2002).
10. Kato H, Schull WJ. Studies of the mortality of A-bomb survivors 7. Mortality, 1950–78: part 1. Cancer mortality. Radiat Res. (1982) 90:395–432. doi: 10.2307/3575716
11. Tsuzuki M. The Atomic Bomb Disaster From a Medical Standpoint. Tokyo: Igaku-Shoin (1954). Japanese.
12. Nagai T. Report on Atomic Bomb Relief Efforts (Report to the President of Nagasaki University on Rescue Activities From August to October 1945). Nagasaki: Nagasaki Association for Hibakushas' Medical Care (NASHIM) (1945).
13. Imanaka T. Residual radiation data and methods to draw the graphs used in NHK Special “Atomic bomb initial investigation: hidden truth”. Hiroshima Peace Sci. (2022) 44:45–63.
14. Oho G. Statistical observation of residual radioactivity disorders of the atomic bomb. Jpn Med J. (1957) 1746:21–5.
15. Ohtaki M, Otani K. Radioactive particles exposure is a major cause of health problems among Hiroshima A-bomb survivors. Kagaku (2016) 86:819–30. Japanese.
16. Sutou S. Rediscovery of an old article reporting that the area around the epicenter in Hiroshima was heavily contaminated with residual radiation, indicating that exposure doses of A-bomb survivors were largely. J Radiat Res. (2017) 58:745–54. doi: 10.1093/jrr/rrx029
17. Matsuura M, Hayakawa N, Shimokata H. Survival analyses of atomic bomb survivors in Hiroshima Prefecture, Japan, 1968-1892 –Cancer mortality risk among early entrants–. Hiroshima J Med Sci. (1995) 44:29–38.
18. Kamada N, Ohkita T, Kuramoto A. Increased incidence of leukemia among atomic bomb survivors entering Hiroshima City on August 6, 1945. Nagasaki Med J. (2006) 81:245–249. Japanese.
19. Otani K, Ohtaki M, Yasuda H. Solid cancer mortality risk among a cohort of Hiroshima early entrants after the atomic bombing, 1970–2010: implications regarding health effects of residual radiation. J Radiat Res. (2022) 63:i45–53. doi: 10.1093/jrr/rrac036
20. Pierce DA, Væth M. Age–time patterns of cancer to be anticipated from exposure to general mutagens. Biostatistics. (2003) 4:231–48. doi: 10.1093/biostatistics/4.2.231
21. Ohtaki, M, Tonda, T, Aihara, K. A two-phase Poisson process model and its application to analysis of cancer mortality among A-bomb survivors. Math Biosci. (2015) 268: 31–7. doi: 10.1016/j.mbs.2015.07.004
22. Sawada S. Estimation of residual nuclear radiation effects on survivors of Hiroshima atomic bombing from incidence of acute radiation disease. Bull Social Med. (2011) 29:47–62.
23. Peterson A, Prentice R, Ishimaru T, Kato H, Mason M. Investigation of circular asymmetry in cancer mortality of Hiroshima and Nagasaki A-bomb survivors. Radiat Res. (1983) 93:184–99. doi: 10.2307/3575953
24. Tonda T, Satoh K, Otani K, Sato Y, Maruyama H, Kawakami H, et al. Investigation on circular asymmetry of geographical distribution in cancer mortality of Hiroshima atomic bomb survivors based on risk maps: analysis of spatial survival data. Radiat Environ Biophys. (2012) 51:133–41. doi: 10.1007/s00411-012-0402-4
25. Uda M, Sugawara H, Kita I. Report on Hiroshima atomic bomb disaster concerning meteorology. In: The Committee for the Publication of the Investigation Reports, , editor. Collection of Investigation Reports on the Atomic Bomb Disaster, Vol. 1. Tokyo: Japanese Science Promotion Society (1953). p. 98–135. Japanese.
26. Masuda Y. Re-investigation about “Black Rain” after Hiroshima A-bomb. Tenki. (1989) 35:69–79. Japanese.
27. Ohtaki M. Reconstruction of spatial-time distribution of black rain in Hiroshima based on statistical analysis of witness of survivors from atomic bomb. In: Aoyama M, Oochi Y, , editors. Revisit the Hiroshima A-Bomb With a Database. Hiroshima City (2011). p. 131–44.
28. Sutou S. Black rain in Hiroshima: a critique to the Life Span Study of A-bomb survivors, basis of the linear no-threshold model. Genes Environ. (2020) 42:1. doi: 10.1186/s41021-019-0141-8
29. Hoshi M, Matsuura M, Hayakawa N, Ito C, Kamada N. Estimation of radiation dose for atomic-bomb survivors in the Hiroshima University Registry. Health Phys. (1996) 70:735–40. doi: 10.1097/00004032-199605000-00017
30. Cullings HM, Fujita S, Funamoto S, Grant EJ, Kerr GD, Preston DL. Dose estimation for atomic bomb survivor studies: its evolution and present status. Radiat Res. (2006) 166:219–54. doi: 10.1667/RR3546.1
31. National Cancer Center Japan. Cancer Mortality From Vital Statistics in Japan (1958-2023), Tabulated by Cancer Information Service. Available online at: https://ganjoho.jp/reg_stat/statistics/data/dl/en.html32 (Accessed August 1, 2025).
32. Byrd RH, Lu P, Nocedal J, Zhu C, A. limited memory algorithm for bound constrained optimization. SIAM J Sci Comput. (1995) 16:1190–208. doi: 10.1137/0916069
33. Tanaka K, Endo S, Imanaka T, Shizuma K, Hasai H, Hoshi M. Skin dose from neutron-activated soil for early entrants following the A-bomb detonation in Hiroshima: contribution from β and γ rays. Radiat Environ Biophys. (2008) 47:323–30. doi: 10.1007/s00411-008-0172-1
34. Ohtaki M, Otani K, Yasuda H. Contribution of radioactive particles to the post-explosion exposure of atomic bomb survivors implied from their stable chromosome aberration rates. Front Public Health. (2024) 12:1335097. doi: 10.3389/fpubh.2024.1335097
35. Katanoda K, Horiga H, Matsuda T, Shibata A, Nishimoto H. Prefectural data of five-year averag cancer mortality. JACR Monogr. (2015) 21:161–2. Japanese.
36. Sutou S. Low-dose radiation from A-bombs elongated lifespan and reduced cancer mortality relative to un-irradiated individuals. Genes Environ. (2018): 40:26. doi: 10.1186/s41021-018-0114-3
37. Satoh K, Yasuda H, Kawakami H, Tashiro S. Relative biological effectiveness of neutrons derived from the excess relative risk model with the atomic bomb survivors' data managed by Hiroshima University. Radiat Prot Dosim. (2018) 180:346–50. doi: 10.1093/rpd/ncx173
38. Rühm W, Walsh L. Current risk estimates based on the A-bomb survivors' data – a discussion in terms of the ICRP recommendations on the neutron weighting factor. Radiat Prot Dosim. (2007) 126:423–31. doi: 10.1093/rpd/ncm087
39. Hafner L, Walsh L, Rühm W. Assessing the impact of different neutron RBEs on the all-solid cancer radiation risks obtained from the Japanese A-bomb survivors' data. Int J Radiat Biol. (2023) 99:629–43. doi: 10.1080/09553002.2022.2117871
40. Okajima S, Fujita S, Harley JH. Radiation doses from residual radioactivity. In: William CR, , editor. Reassessment of Atomic Bomb Radiation Dosimetry—Dosimetry System 1986, vol. 1. Hiroshima: Radiation Effects Research Foundation (1986). p. 209–30.
41. Imanaka T, Endo S, Tanaka K. Shizuma K. Gamma-ray exposure from neutron-induced radionuclides in soil in Hiroshima and Nagasaki based on DS02 calculations. Radiat Environ Biophys. (2008) 47:331–36. doi: 10.1007/s00411-008-0164-1
42. Tanaka K, Ohtaki M, Hoshi M. Chromosome aberrations in Japanese fishermen exposed to fallout radiation 420-1200 km distant from the nuclear explosion test site at Bikini Atoll: report 60 years after the incident. Radiat Environ Biophys. (2016) 55:329–37. doi: 10.1007/s00411-016-0648-3
43. Tamplin A, Cochran T. Radiation Standard for Hot Particle. Washington, DC: Natural Resources Defense Council (1974).
44. Charles MW, Mill AJ, Daly PJ. Carcinogenic risks of hot particle exposure. J Radiol Prot. (2003) 23:5–28. doi: 10.1088/0952-4746/23/1/301
Keywords: atomic bomb survivor, non-initial radiation, residual radiation, solid cancer mortality, wind effect, black rain
Citation: Ohtaki M, Otani K, Hoshi M and Yasuda H (2025) Effects of non-initial radiation exposure on solid cancer mortality risk among Hiroshima A-bomb survivors. Front. Public Health 13:1651887. doi: 10.3389/fpubh.2025.1651887
Received: 22 June 2025; Accepted: 18 August 2025;
Published: 10 September 2025.
Edited by:
Frank de Vocht, University of Bristol, United KingdomReviewed by:
Dimitris Emfietzoglou, University of Ioannina, GreeceLiqiu Ma, National Institutes for Quantum Science and Technology, Japan
Richard J. Q. McNally, Newcastle University, United Kingdom
Copyright © 2025 Ohtaki, Otani, Hoshi and Yasuda. This is an open-access article distributed under the terms of the Creative Commons Attribution License (CC BY). The use, distribution or reproduction in other forums is permitted, provided the original author(s) and the copyright owner(s) are credited and that the original publication in this journal is cited, in accordance with accepted academic practice. No use, distribution or reproduction is permitted which does not comply with these terms.
*Correspondence: Megu Ohtaki, b2h0YWtpQGhpcm9zaGltYS11LmFjLmpw; Hiroshi Yasuda, aHlhc3VkYUBoaXJvc2hpbWEtdS5hYy5qcA==