 Chao Yang1†
 Pengfei Zhu
 Chuncheng Lu
 Xinliang Ding
- 1The Affiliated Wuxi Center for Disease Control and Prevention of Nanjing Medical University, Wuxi Center for Disease Control and Prevention, Wuxi Medical Center, Nanjing Medical University, Wuxi, China
- 2Statistics and Information Center of Wuxi Health Commission, Wuxi, China
- 3Key Laboratory of Modern Toxicology of Ministry of Education, School of Public Health, Nanjing Medical University, Nanjing, China
Inappropriate apparent temperature (AT) is a major global threat to human health. Although the association between temperature and health has been studied extensively, limited evidence regarding emergency ambulance calls (EACs) is available. Daily emergency department visit records, meteorological data, and air pollutant data were obtained from 1 January 2014 to 31 December 2019. A distributed lag non-linear model was applied to examine the interaction between AT and lagged effects. The analysis was stratified according to disease aetiology, sex, and age. The proportion of EACs attributable to AT was calculated as an indicator of associated burden. A non-linear U-shaped relationship was observed between AT and non-accidental, cardiovascular, and circulatory EACs, with the lowest risk AT occurring at 22.54 °C, 17.12 °C, and 12.74 °C, respectively. High AT effects manifested immediately, whereas low AT effects were delayed. Stratified analysis indicated that males and individuals aged ≥65 years demonstrated heightened sensitivity to both extreme heat (97.5th percentile, 35.98 °C) and cold (2.5th percentile, −1.27 °C), whereas females displayed greater vulnerability to extreme heat [relative risks = 1.16, 95% confidence intervals (CI): 1.04–1.29]. The attributable fraction (AF) for non-accidental EACs in Wuxi was 6.88% (95% CI: 4.09–9.26%), with higher AFs observed for cardiovascular (10.37%) and respiratory (4.94%) emergencies. Moderate thermal variations substantially affected the EACs more than extreme AT conditions. These findings underscore the necessity of implementing early warning mechanisms targeting thermal extremes and developing temperature-regulated public facilities to safeguard vulnerable groups, particularly older citizens, during extreme temperature events.
1 Introduction
Global climate change has increased the number of extreme weather events and significantly affected public health. Heatwaves, intensified by human activity, cause over one-third of global heat-related deaths, primarily from cardiovascular and respiratory diseases (1–3). Annually, 1.8 million cardiovascular deaths (CVDs) constitute 8.86% of total CVDs and are temperature-related (4).
Temperature-cardiorespiratory relationships typically follow U-, V-, or J-shaped curves, indicating increased cardiopulmonary risk at temperature extremes (5–7). These non-linear relationships manifested differently across climatic regions. For example, in Mediterranean climates, such as Spain, extreme heat elevates mortality risks from hypertension, heart failure, and pneumonia (8). Summer heat accounts for 16.2 and 22.3% of respiratory deaths in Madrid and Barcelona, respectively (9). Globally, non-optimal temperatures account for 8.86% of CVDs, with increased heat-related mortality (4). In Beijing, extreme cold showed prolonged effects (21 days) on respiratory-related emergency visits, whereas extreme heat had immediate effect (7 days), particularly affecting older males with respiratory conditions (10).
Existing research predominantly relies on mortality and hospitalisation data (11, 12). These outcomes fail to detect early-stage temperature-related symptoms that precede fatal events. Mortality-based assessments suffer from delayed reporting and capture only a subset of temperature-health impacts. Hospitalisation records face challenges in timely access and precise symptom onset determination. In contrast, data from emergency ambulance calls (EACs) integrate regional health indicators with ambulance dispatch records, demonstrating superior temporal sensitivity in identifying acute disease onset (13).
Several studies have assessed the association between extreme temperatures and EACs; however, the results of these studies are conflicting. One study demonstrated that CVD-related EACs did not significantly increase at high temperatures (14). In contrast, another study revealed that a 5 °C increase in average temperature was associated with a 2% increase in all-cause CVD EACs (15). In addition, the association between extreme temperatures and EACs varies according to sex (16) and age (49). The lag effects of the EACs caused by extreme temperatures are also inconsistent. The results of a meta-analysis showed that the combined risk of all ambulance calls peaked at a lag of 16–18 h when hourly temperatures were in the 99th percentile (50). A single temperature indicator may not be sufficient to describe the true relationship because human comfort depends on temperature and other meteorological factors, such as humidity and wind speed. Therefore, it is necessary to use composite indicators of temperature along with other meteorological factors when studying the effects of temperature on health. Apparent temperature (AT), as a composite index of ambient temperature, wind speed, and humidity, reflects the thermal sensation of the human body more objectively than the temperature itself (17). Previous studies on the relationship between AT and EACs have focused on Europe (18, 19), whereas few have focused on Asia. This integrated approach addresses a key limitation in prior studies using singular meteorological parameters, particularly relevant in humid subtropical climates such as that in Wuxi, where summer relative humidity routinely exceeds 80% (20).
In this study, we evaluated the association between non-optimal AT and non-accidental EACs, including cardiovascular and respiratory EACs, using records from Wuxi City between 2014 and 2019. Furthermore, we examined the potential effect of modifications by sex and age on the AT-EACs relationship. The analytical pipeline integrates distributed lag non-linear modelling (DLNM) with attributable fraction (AF) calculations, using a three-stage approach: (1) Exposure-response curve estimation; (2) Lag-effect decomposition; (3) Population-attributable risk stratification. These findings will directly inform the development of tiered early warning systems in the Yangtze Delta megalopolis.
2 Materials and methods
2.1 Study area
Wuxi is geographically located in the southern region of Jiangsu Province, China, within the core of the Yangtze River Delta. The city spans from approximately 31°33’N to 32°08’N latitudes and 119°48′E to 120°23′E longitudes. Situated between the Yangtze river and Taihu lake, Wuxi is characterised by predominantly flat terrain with relatively low elevation. The region exhibits a typical subtropical humid monsoon climate characterised by four distinct seasons, including hot humid summers and cold damp winters.
2.2 EAC data
Hourly EAC data for Wuxi, from 1 January 2014 to 31 December 2019, were obtained from the Wuxi Emergency Center. The dataset encompasses comprehensive patient-related information, including the timestamp of the call, geographic location, demographic characteristics (age and sex), provisional diagnosis, and associated clinical symptoms. All emergency calls initiated during the study period were documented systematically. To ensure data confidentiality, sensitive personal identifiers, such as patient names, residential addresses, and contact numbers, were encrypted before data extraction. Subsequently, EACs attributable to natural causes were extracted, whereas those associated with external events, including accidents, poisoning, and obstetric emergencies, were excluded from the final analysis. Additionally, records lacking date information or originating outside the jurisdictional boundaries of Wuxi City were omitted to maintain data integrity. Furthermore, primary diagnoses were categorised based on the International Classification of Diseases, Tenth Revision (ICD-10), with particular emphasis on conditions related to the cardiovascular (I00–I99) and respiratory (J00–J99) systems to enable targeted analysis.
2.3 Meteorological and air pollutants data
Air pollutant data were collected from a network of nine monitoring stations operated by the Wuxi Municipal Ecological Environment Bureau. The dataset included the daily average concentrations of six major air pollutants: fine particulate matter (PM2.5), respirable particulate matter, sulfur dioxide, nitrogen dioxide, carbon monoxide, and ozone (O3), from January 2014 to December 2019.
Meteorological data, including average temperature, relative humidity, and wind speed, were obtained from daily monitoring records provided by the Wuxi Meteorological Bureau from January 2014 to December 2019. AT was calculated as an exposure variable based on these three meteorological parameters following established methodologies (18, 21, 22) (Equations 1 and 2).
where T is the average temperature (°C), Pv is the vapour pressure (hPa) estimated using formula (2), w is the wind speed (m/s) 10 m above the ground, and rh is the relative humidity (%).
2.4 Statistical analysis
To evaluate the distributed lag effect of AT on EACs, a quasi-Poisson generalised additive model (GAM) integrated with a DLNM was used. Through the application of “cross-basis” functions, DLNM can effectively capture both the non-linear exposure-response relationship and lagged effects. The structure of the constructed model was as follows (Equation 3) (23):
where is the EACs; α is the intercept; and are regression model coefficients of week and holiday variables, respectively; cb(Tempt,l) refers to the cross-basis matrix with AT and lag days; ns is the natural cubic spline function; humidity and pollutants represent relative humidity and air pollutants, both included in the natural cubic spline function with degrees of freedom (df) equal to 3; time is the time variable to control for long-term trend; Holiday is the Chinese public holidays; DOW denotes the day of week.
This study determined the maximum number of lag days to be 14 days, with df for relative humidity and time being 3 and 7, respectively. The optimal model based on Akaike Information Criterion (AIC) index selected O3 and PM2.5 to be included in the model.
Consistent with the established concept of minimum mortality temperature in prior research (24), the AT associated with the lowest risk of EACs was identified as the optimal AT in this study. Extremely high and low ATs were operationally defined as ATs corresponding to the 2.5th and 97.5th percentiles, respectively (25). The optimal lag period for AT was determined to be 14 days based on the AIC values derived from the lag days model. To elucidate the exposure-response relationship, we quantified the associations between specific AT thresholds (2.5th, 5th, 7.5th, 10th, 90th, 92.5th, 95th, and 97.5th percentiles) and EACs. AT-related effects were expressed as relative risks (RRs) with corresponding 95% confidence intervals (CIs). In addition, further exploration of potential variations in risk was conducted using a subgroup analysis stratified by sex and age.
The total AF was calculated to estimate the cumulative effects of non-optimal AT on the EACs, using the optimum AT as the reference point. The formula is expressed as follows (Equation 4):
where RRi is the relative risk at each exposure level compared to the baseline level, l0 and L represent the minimum and maximum lag days, respectively, is the effect parameter at exposure level i.
Using optimum AT as the central reference point, four distinct thermal exposure categories were established (26): extreme cold (AT ≤ P2.5), moderate cold (P2.5 < AT < minimum AT), moderate heat (minimum AT < AT < P97.5) and extreme heat (AT ≥ P97.5). To quantify the uncertainty associated with AF estimates, Monte Carlo simulation methods were used to derive 95% empirical confidence intervals. Demographic stratification analyses were subsequently performed across sex and age groups (0–65 vs. 66 years) to assess the differential vulnerability patterns in temperature-associated morbidity risks (27).
All statistical analyses were conducted using the “mgcv” and “dlnm” software packages in R version 4.3.2.
2.5 Sensitivity analysis
To evaluate the robustness of the model, a sensitivity analysis was performed by assessing alternative lag periods (7 and 21 days), adjusting the degrees of freedom for time trends (range, 6–9) and relative humidity (range, 4–6). Additionally, potential confounding by NO2 and SO2 was evaluated through separate pollutant-adjusted models.
3 Results
3.1 Descriptive analysis
Table 1 presents the baseline information on daily EACs, meteorological factors, and air pollutants in Wuxi from 2014 to 2019, covering 2,191 days. During the study period, 141,031 EAC records were collected, averaging 55.15 ± 14.1 EACs daily. Among these records, approximately 54.6% were males, and 45.4% were females. The proportion of individuals aged 65 and above was higher than those aged 0–65 years (58.62% vs. 41.38%). The average daily AT was 16.53 ± 8.93 °C, slightly lower than the average ambient temperature (17.35 ± 8.9 °C). During the study period, the meteorological conditions were characterised by the following daily averages: relative humidity was 73.28% (±13.32%), wind speed averaged 2.16 m/s (±0.83 m/s), O3 concentration was 100.19 μg/m3 (±49.98 μg/m3), and PM2.5 concentration averaged 49.11 μg/m3 (±30.2 μg/m3).
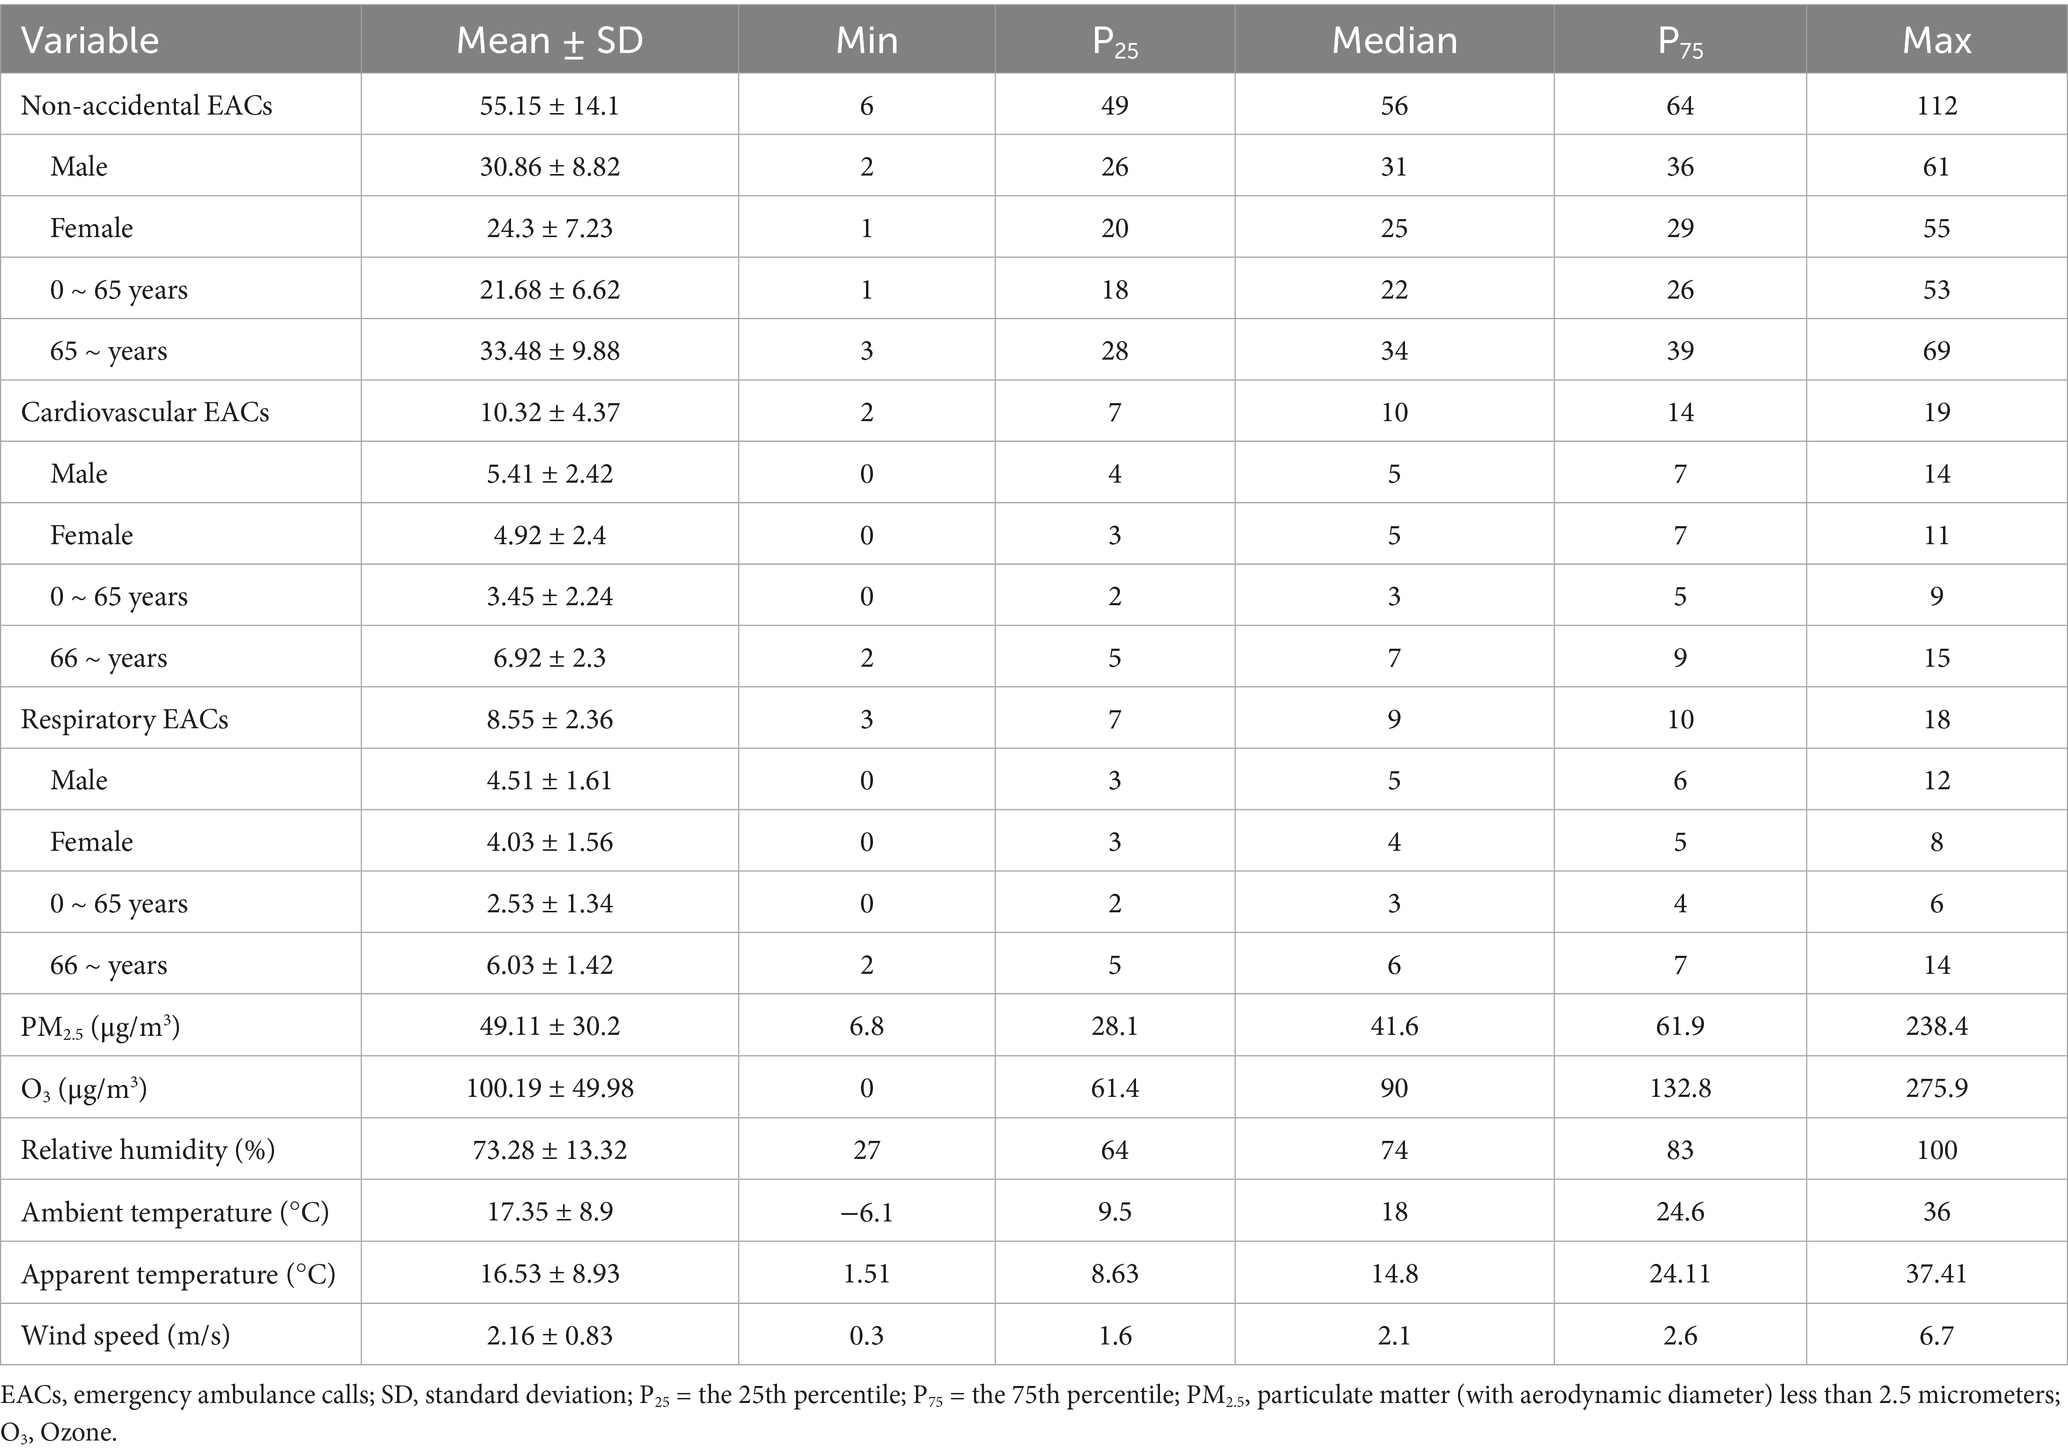
Table 1. Descriptive statistics for daily EACs, meteorological variables and air pollutants from 2014 to 2019 in Wuxi, China.
Average ambient temperature, relative humidity, wind speed, AT, PM2.5 and O3 exhibited seasonal variations. The average ambient temperature, AT, and O3 trends were similar, maximizing maximum in summer and minimizing in winter. In contrast, PM2.5 peaked in winter and showed the opposite trend (Supplementary Figure S1).
3.2 Overall effects of AT on EACs
Figure 1 presents the overall exposure-response relationships between AT and EACs, along with the lag effects in the population. The calculated optimal ATs were 22.54 °C, 17.12 °C and 12.74 °C for non-accidental, cardiovascular and respiratory EAC, respectively. Both extreme cold (2.5th percentile) and extreme heat (97.5th percentile) demonstrated significant risk effects on EACs (Supplementary Tables S1–S3).
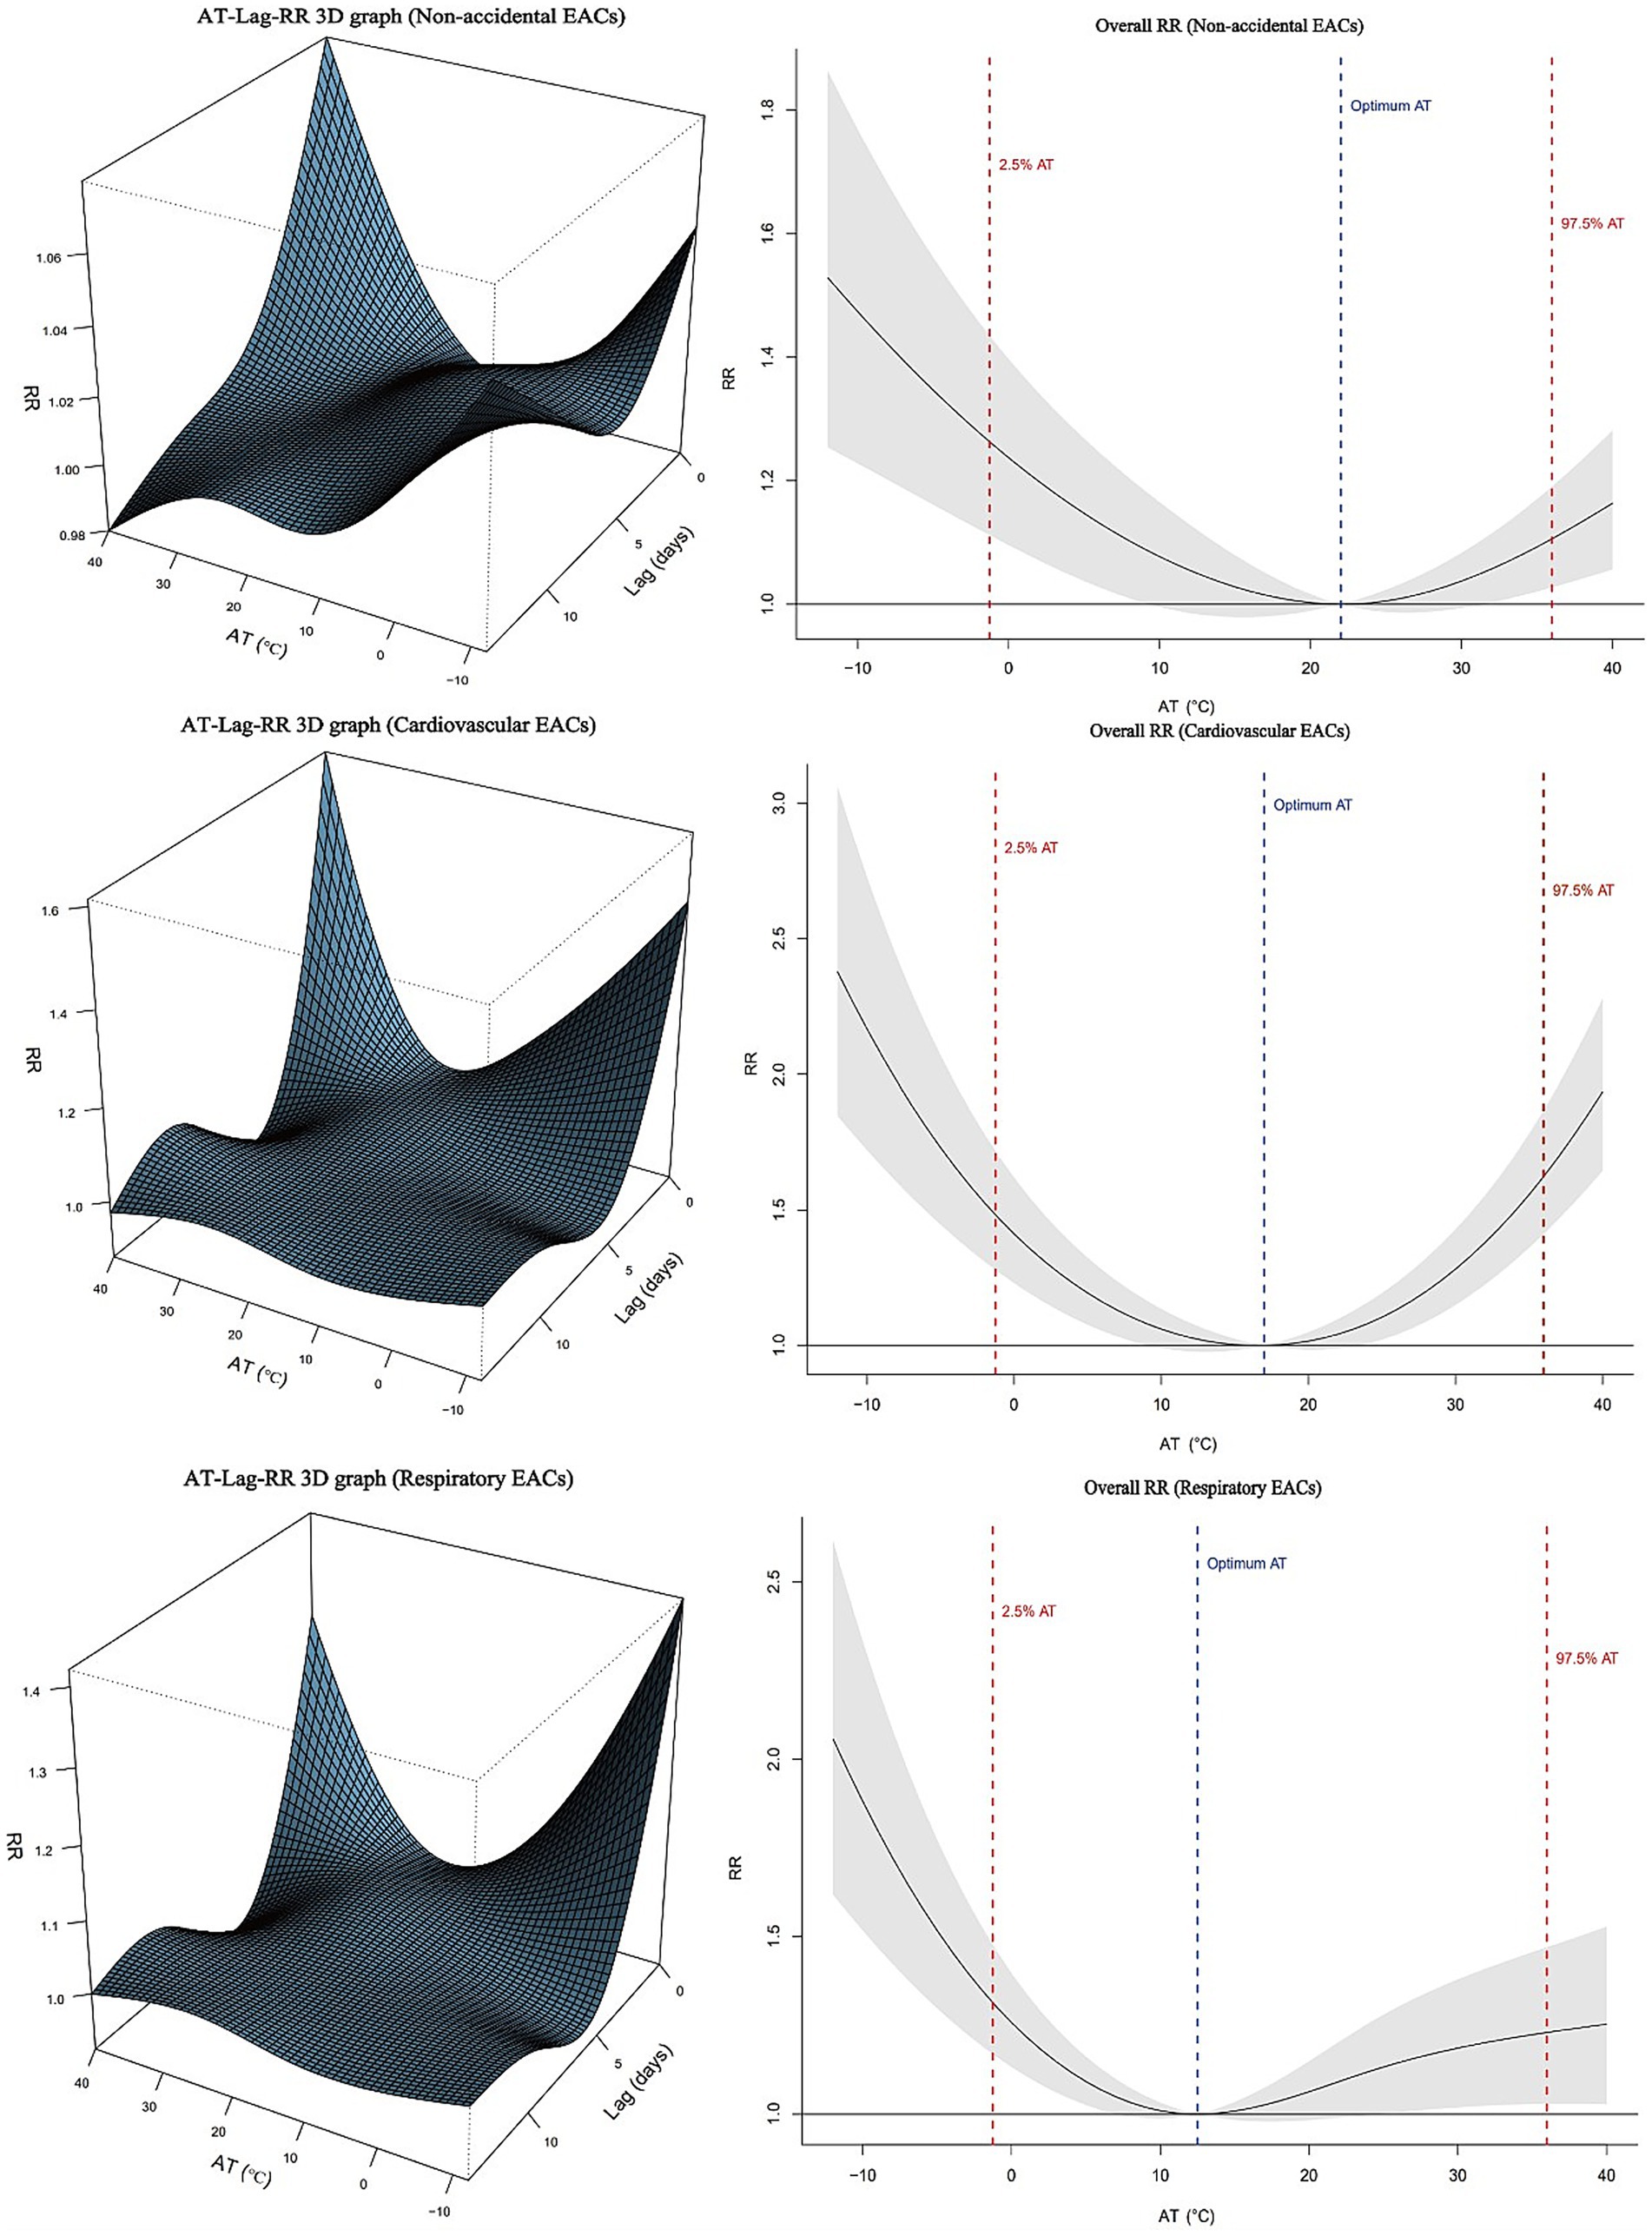
Figure 1. Association between apparent temperature (AT) and emergency ambulance calls (EACs) in Wuxi, 2014–2019. Left panels: Three-dimensional exposure-lag-response risk surfaces. Right panels: Overall relative risks with 95% confidence intervals.
Figure 2 illustrates the exposure-response relationship between AT and EACs across different subgroups with reference to the optimal AT. With an increase in AT degree polarisation (cold: 10th, 7.5th, 5th, and 2.5th percentiles; heat: 90th, 92.5th, 95th, and 97.5th percentiles), the risks of non-accidental, cardiovascular, and respiratory EACs showed an upward trend. For males and individuals aged >65 years, both extreme heat and cold exhibited significant associations with non-accidental, cardiovascular, and respiratory EACs. In females, no statistically significant associations were observed between extreme cold and any EAC category (p > 0.05), whereas extreme heat significantly increased risks of non-accidental (RR = 1.16, 95% CI: 1.04–1.29) and respiratory EACs (RR = 1.31, 95% CI: 1.13–1.52). Among the 0–65 year age group, extreme cold showed significant respiratory EAC risks (RR = 1.80, 95% CI: 1.45–2.25), whereas extreme heat was associated with elevated risks of non-accidental (RR = 1.36, 95% CI: 1.24–1.49) and respiratory EACs (RR = 1.47, 95% CI: 1.17–1.86). Notably, cardiovascular EACs demonstrated no significant temperature-associated risks in the 0–65 year age group (Supplementary Tables S1–S3).
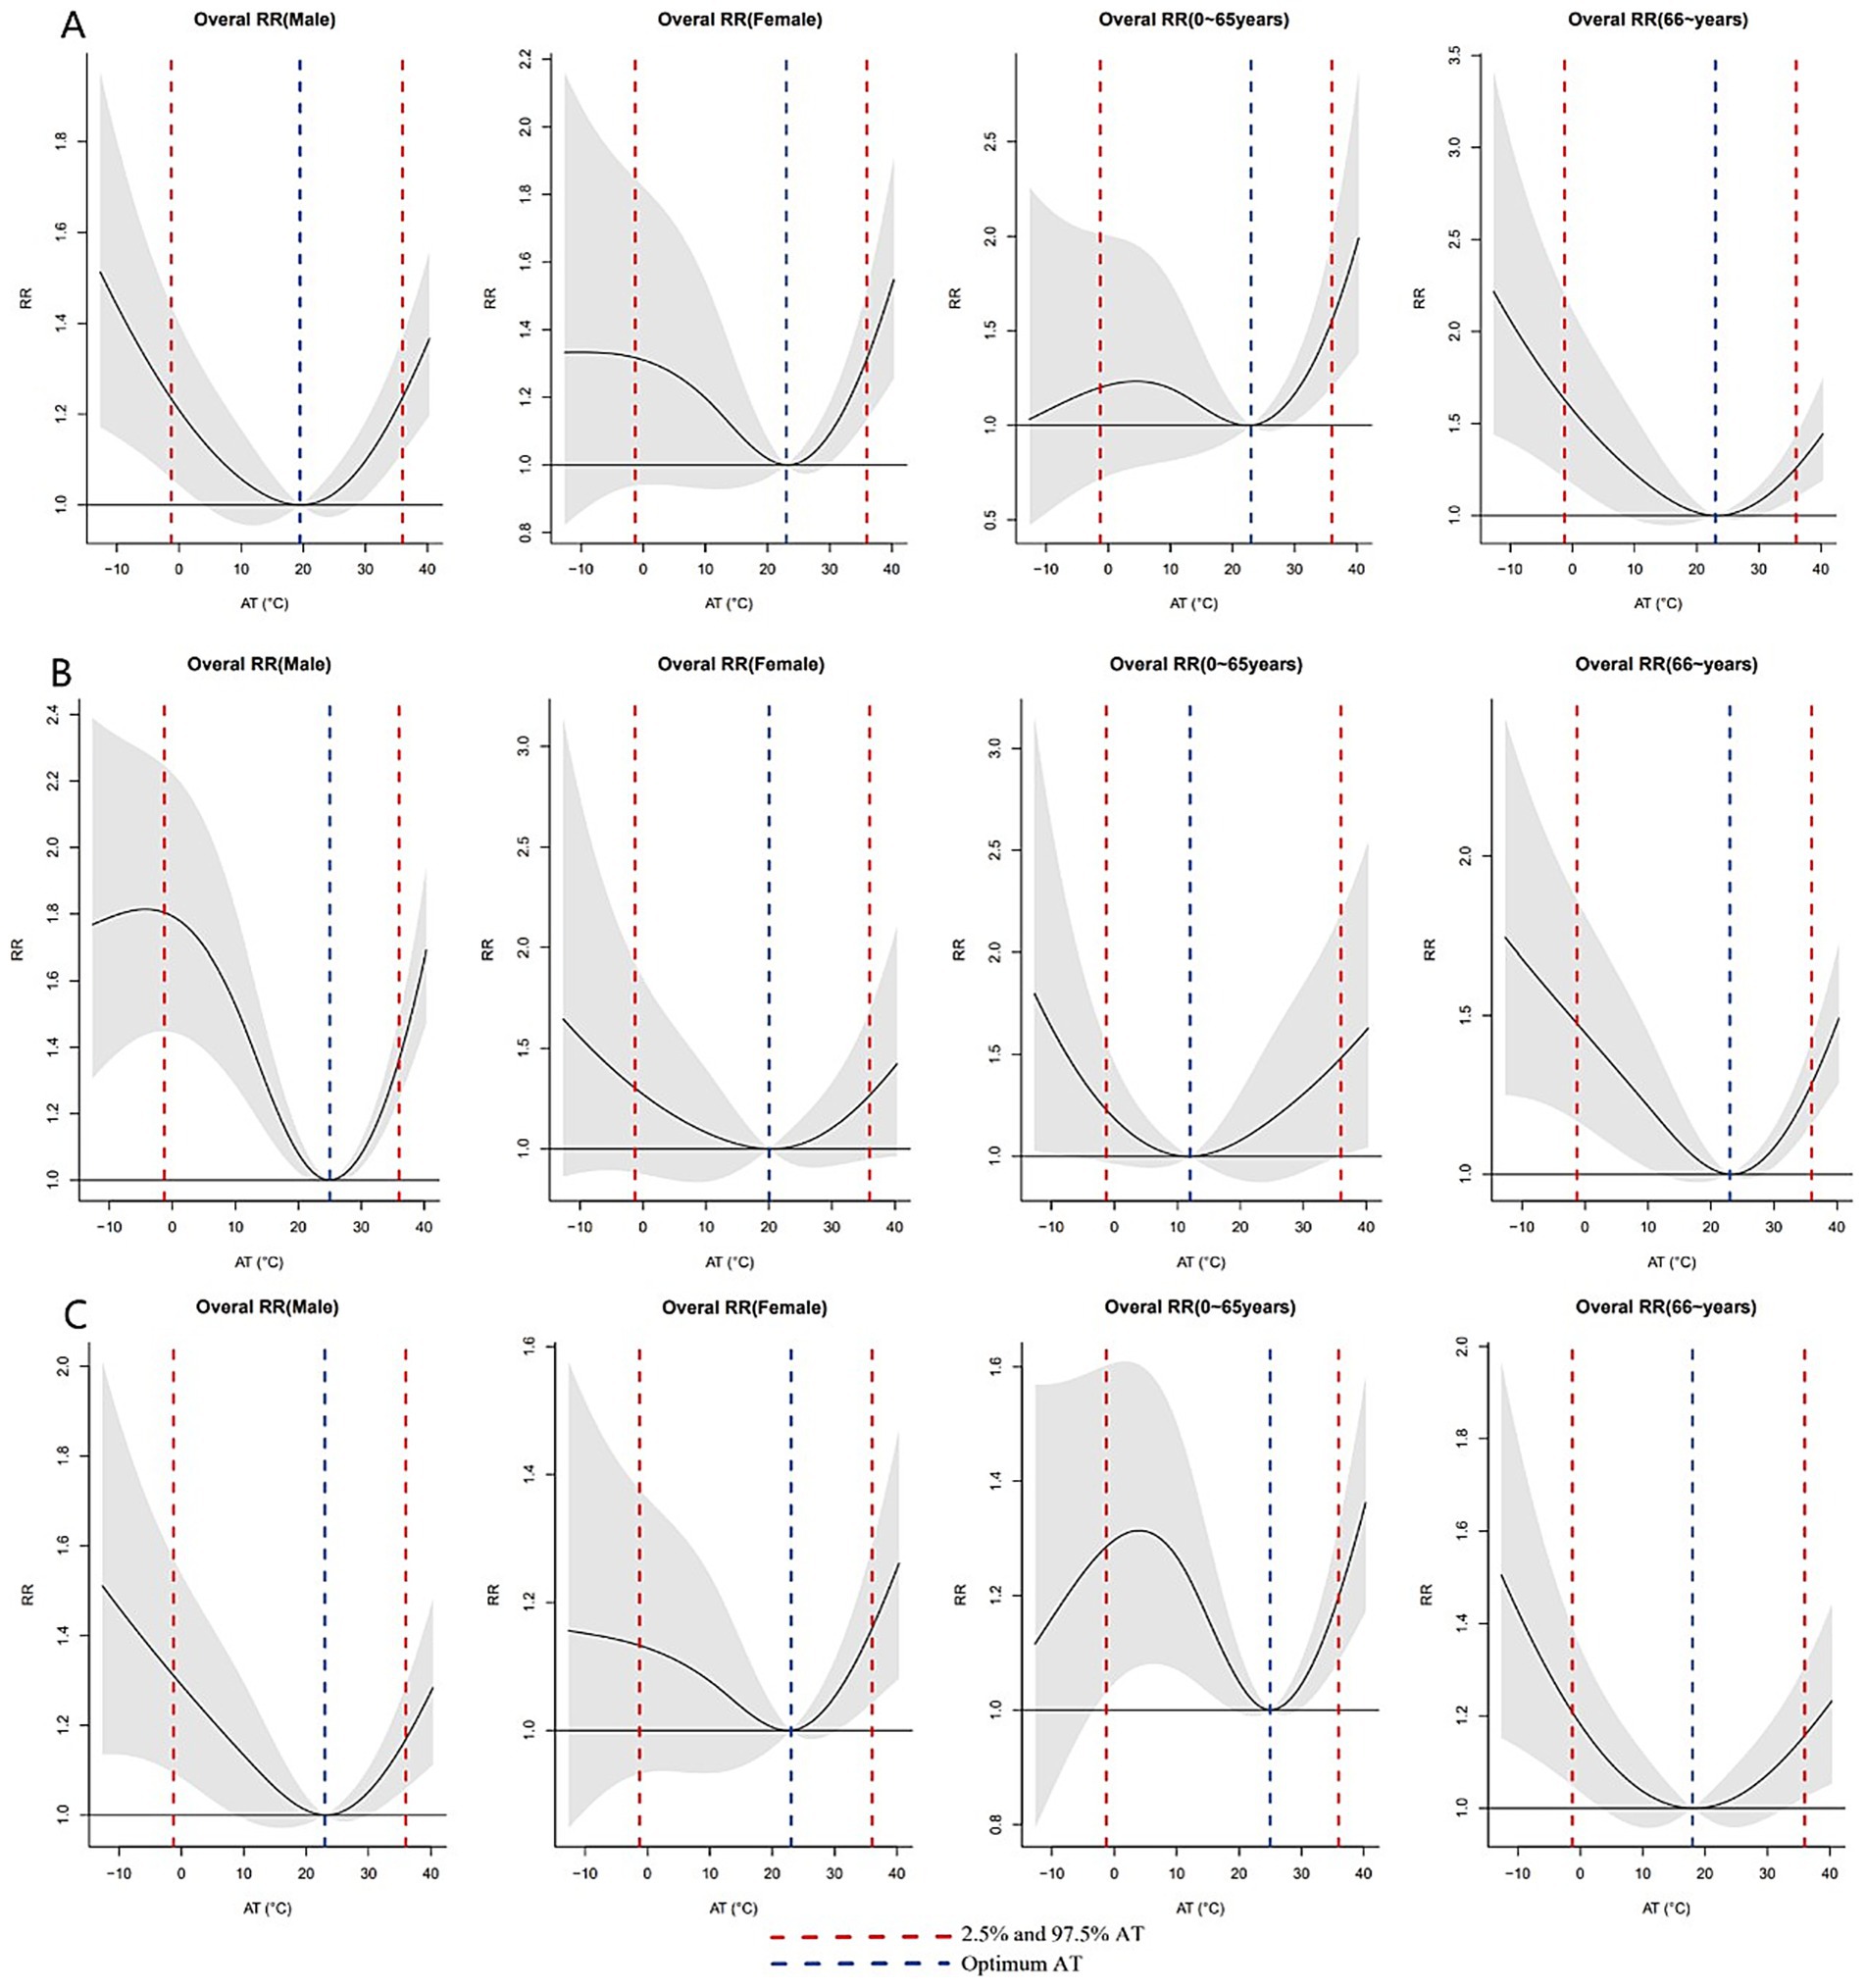
Figure 2. Exposure–response relationships between AT and EACs across subgroups, referenced to group-specific optimum AT values. (A) Non-accidental EACs; (B) Cardiovascular EACs; (C) Respiratory EACs. Wuxi, China 2014–2019.
3.3 Delayed effects of AT on EACs
Figure 3 shows the individual effects of AT on non-accidental, cardiovascular, and respiratory EACs over different lag days. The effect of extreme cold (2.5th percentile) varied across different types of EACs. For non-accidental EACs, significant effects were observed from lag 7 to lag 12, with the maximum effect occurring at lag 12 (RR = 1.017; 95% CI: 1.003–1.031). For cardiovascular EACs, significant effects were noted from lag 1 to lag 4, with the maximum effect observed at lag 1 (RR = 1.031, 95% CI: 1.004–1.059). Similarly, for respiratory EAC, significant effects were observed from lag 5 to lag 7, with the largest effect occurring at lag 5 (RR = 1.022, 95% CI: 1.003–1.048). The impact of extreme heat followed a similar pattern, with the maximum effect occurring on the first day, gradually diminishing and becoming negligible after 4 or 5 days (Supplementary Table S4).
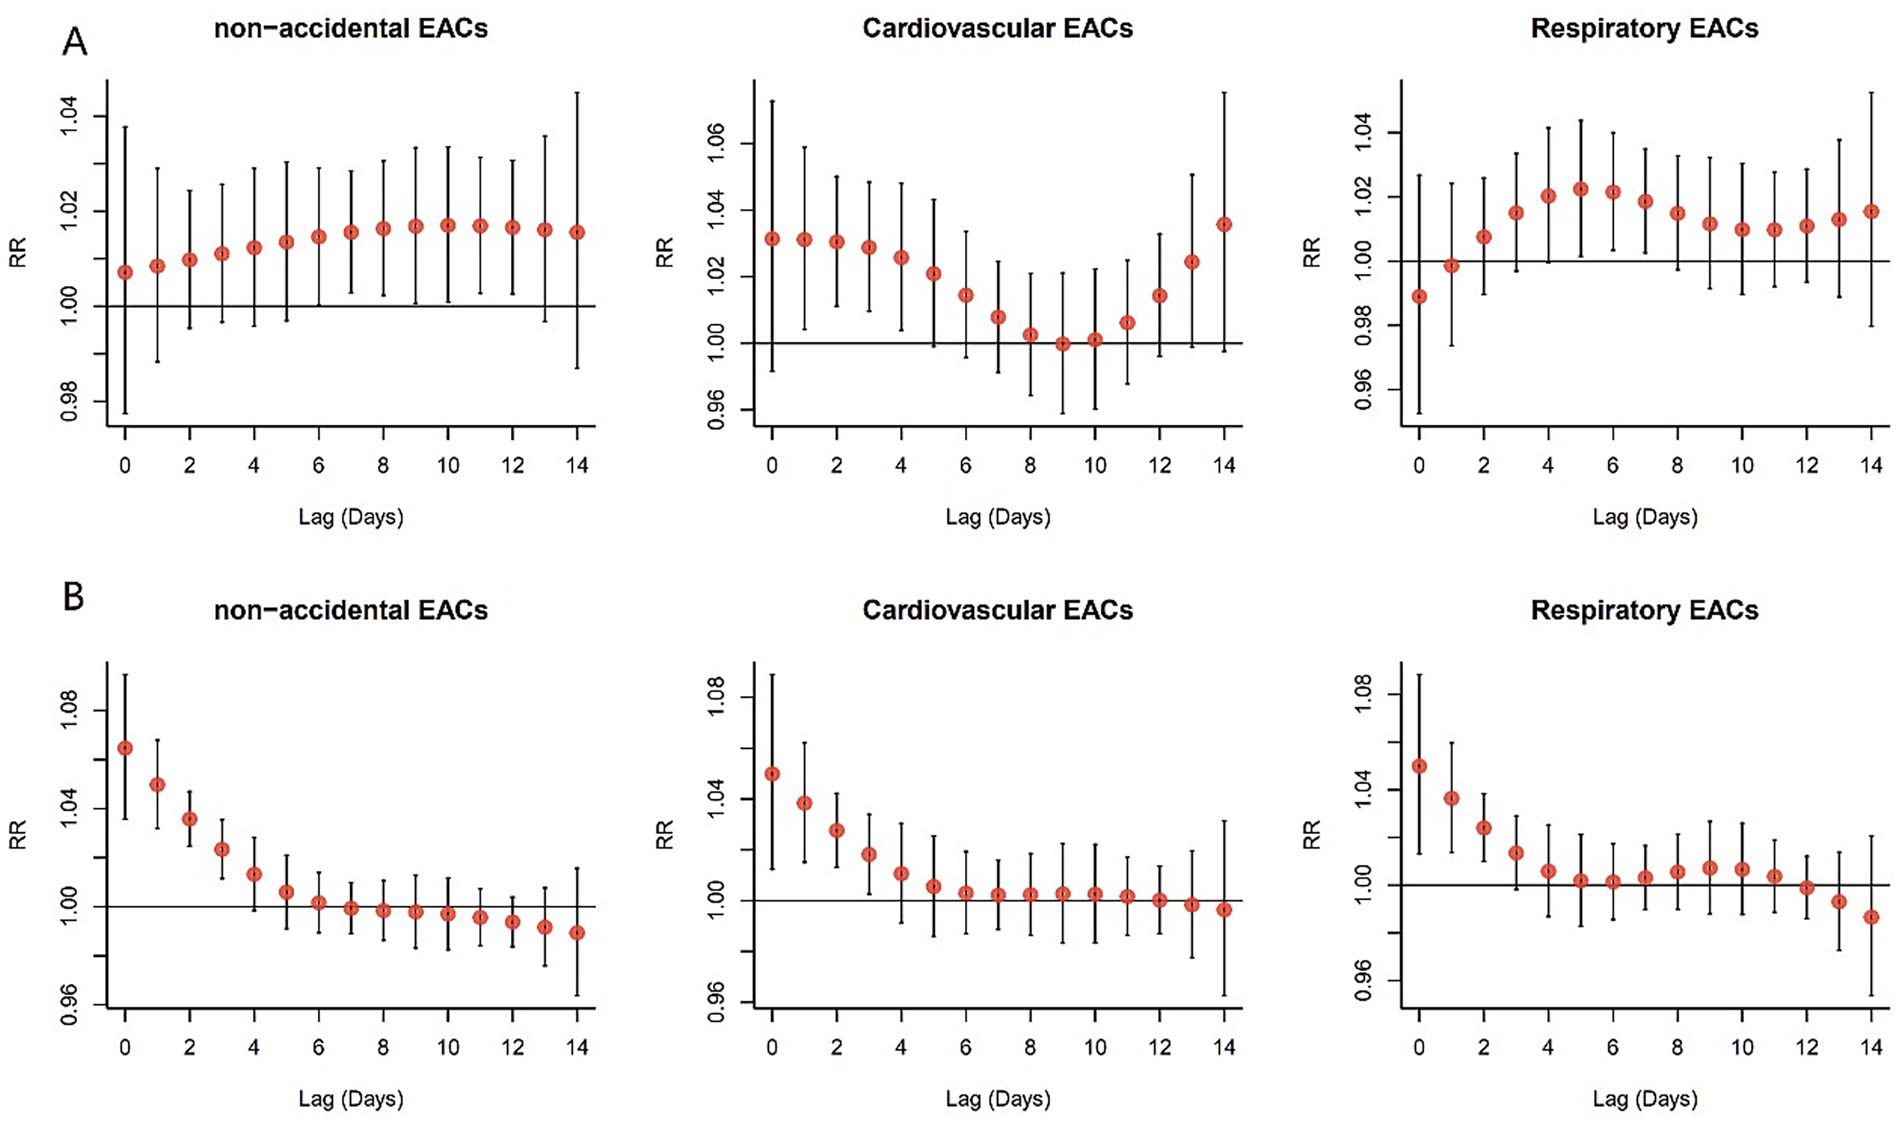
Figure 3. Lagged effects of extreme AT percentiles on EACs, referenced to group-specific optimum AT. (A) Extreme cold (2.5th percentile); (B) Extreme heat (97.5th percentile). Wuxi, China 2014–2019.
Figure 4 presents the single-lag effects for extreme cold (2.5th percentile) and heat (97.5th percentile) in the non-accidental, cardiovascular, and respiratory EACs subgroups. For extreme cold, the lag effects of non-accidental, cardiovascular, and respiratory EACs were similar within the same sex; the effect on males was predominantly acute, peaking on the first day, and subsequently attenuating. In contrast, females exhibited varying lag patterns, with significant effects observed at lag 7–12, 3–7, and 6–7. In the 0–65 year age group, non-accidental EACs showed an effect at lag 11–12, whereas no significant differences were observed for cardiovascular and respiratory EACs. Among those aged ≥65 years, cardiovascular EACs were influenced at lag 3–6, whereas respiratory EACs exhibited effects at lag 0–4, with the maximum impact occurring on the first day. The effects of extreme heat exposure on sex and age were similar. The largest risk effect occurred at lag 0 days and gradually diminished to no significance with an increase in lag days.
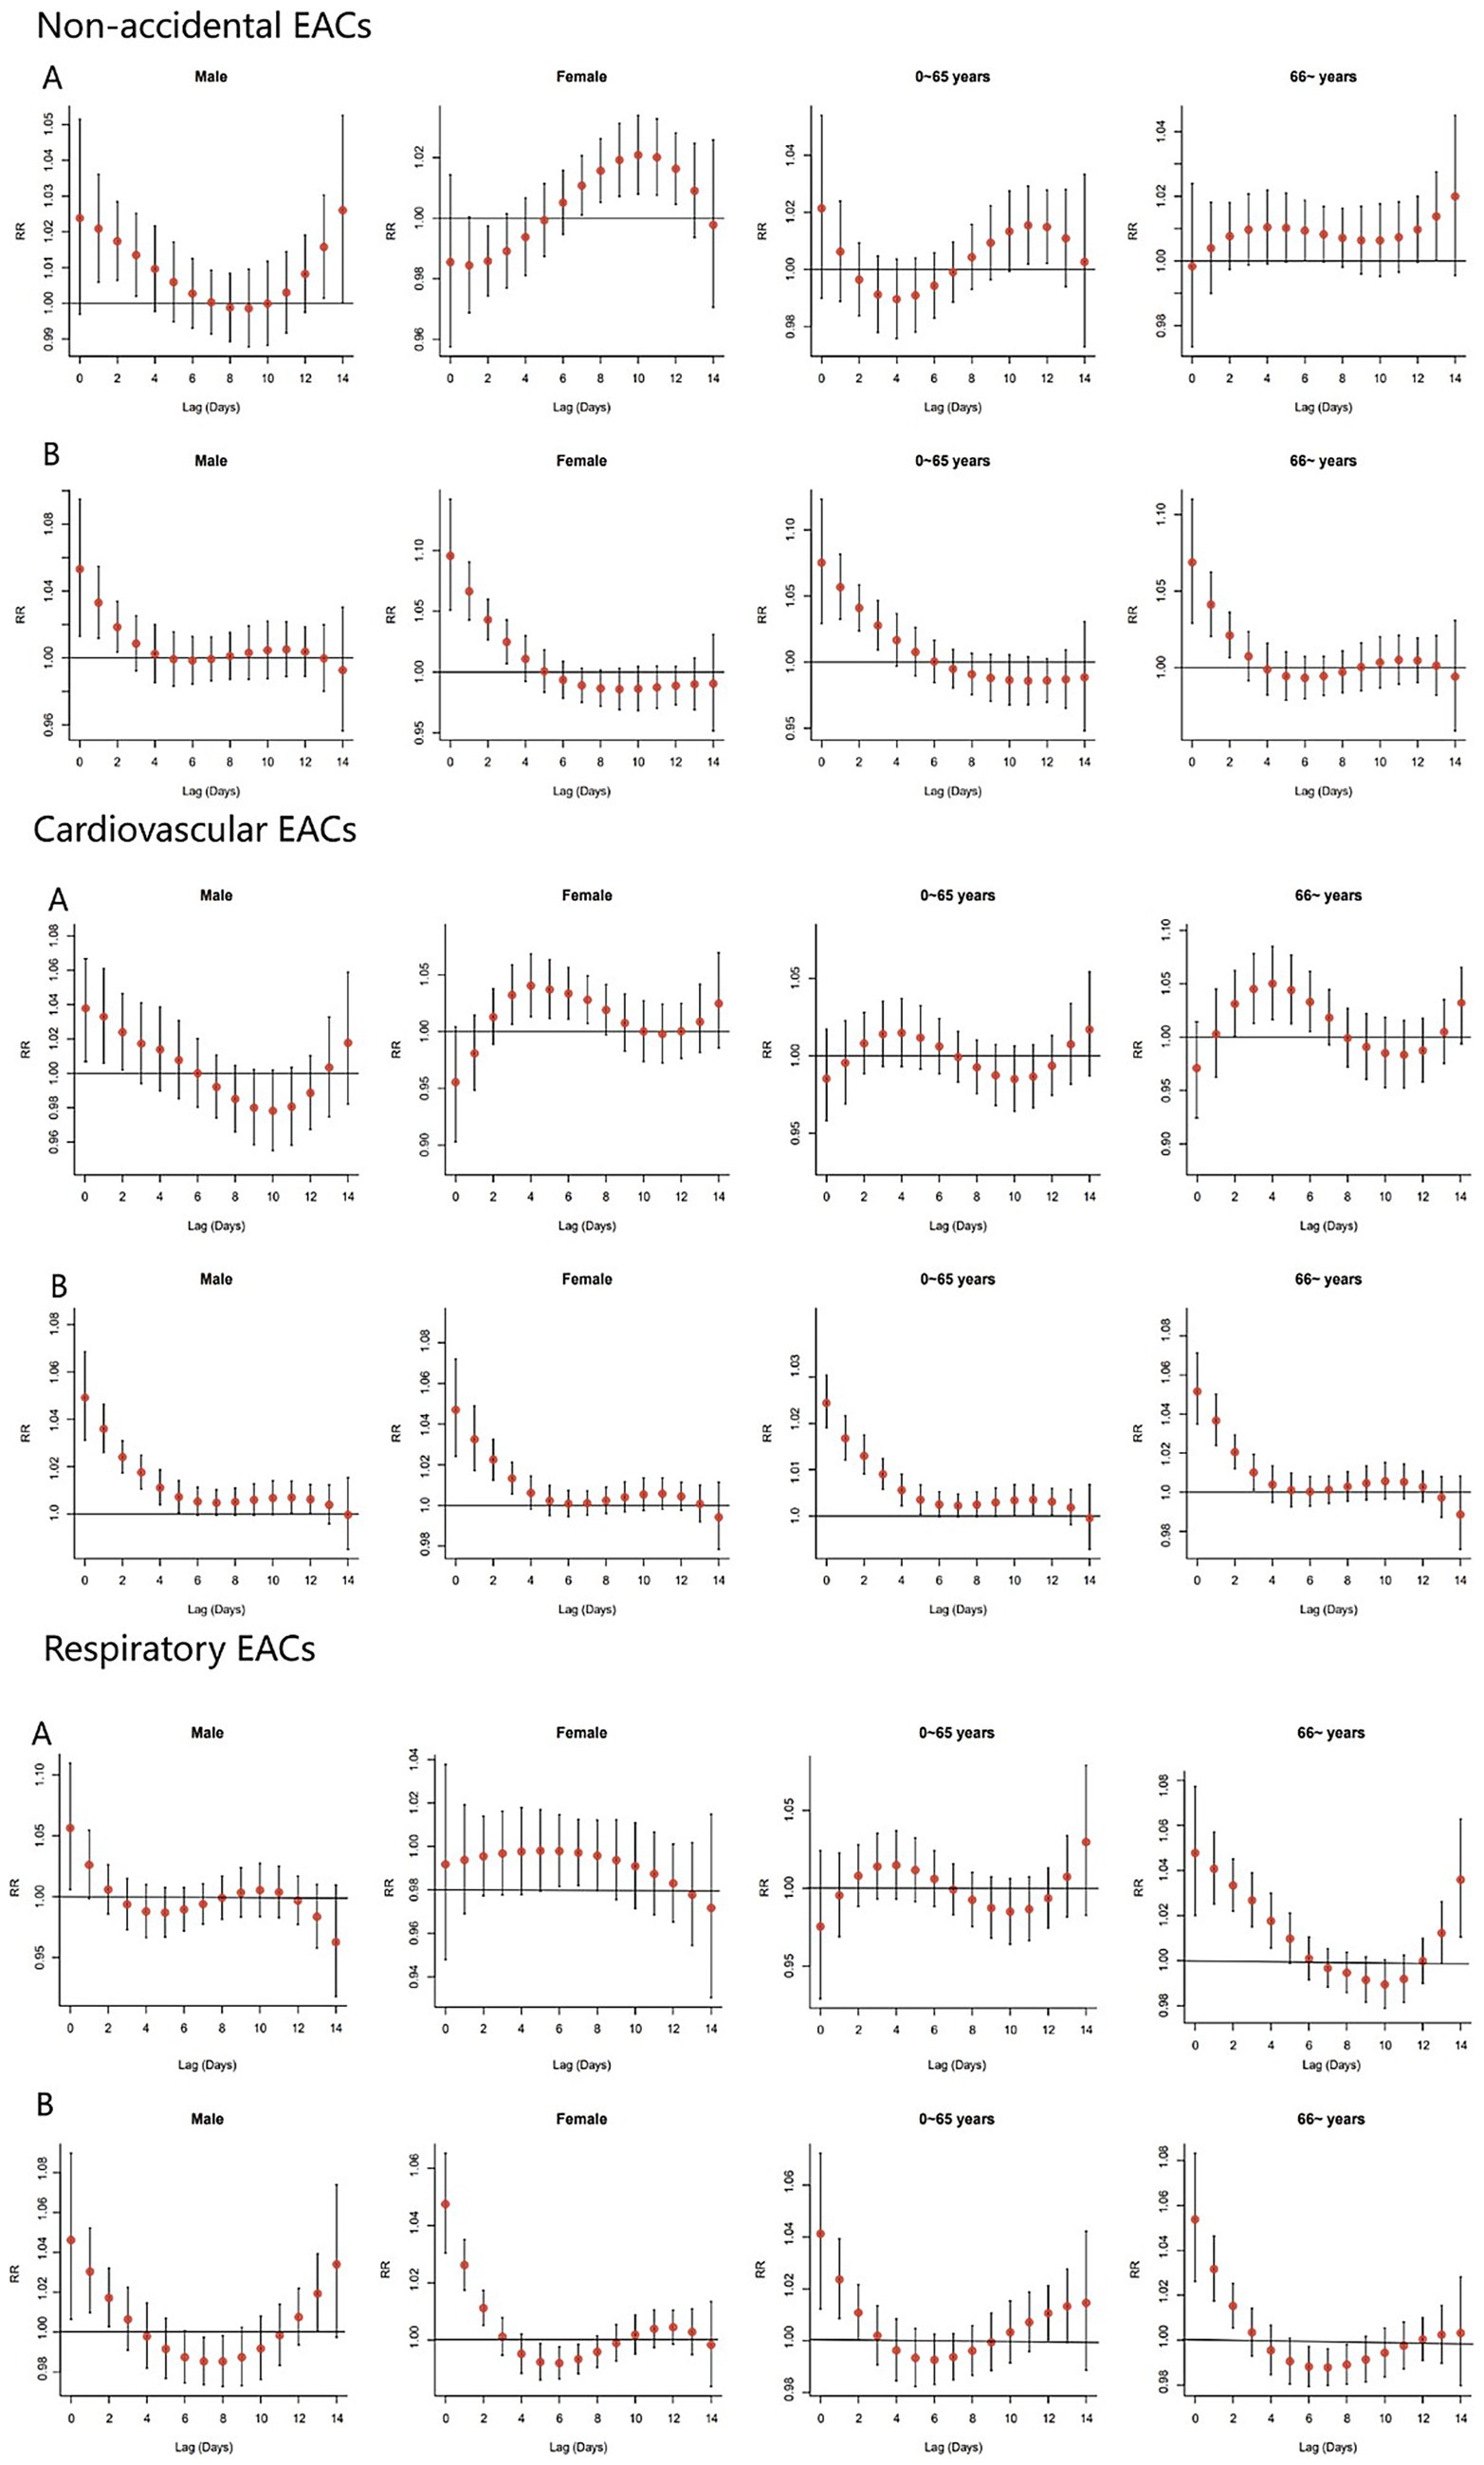
Figure 4. Single-day lag effects of AT on EACs by cause type. Reference temperatures: (A) −1.27 °C (cold effect); (B) 35.98 °C (heat effect). Wuxi, China 2014–2019.
3.4 Attributable risk fractions of AT on EACs
Table 2 presents the population AFs of non-accidental, cardiovascular, and respiratory EACs in Wuxi associated with non-optimal AT, stratified by sex and age. Overall, the total AF of EACs due to suboptimal AT was 6.88% (95% CI: 4.09–9.26%), with moderate heat contributing the most (3.56, 95% CI: 3.92–10.47%), followed by moderate cold (1.43, 95% CI: −0.11–2.97%), extreme heat (1.20, 95% CI: 0.63 1.81%) and extreme cold (0.75, 95% CI: 0.26 1.25%). The total AF of men (7.34%) and older adults >65 years (7.76%) were higher than that of women (6.26%) and 0–65 years old group (5.43%). Men were more sensitive to moderate colds (AF = 2.10% vs. women, 0.55%). The AF of older adults for moderately and extremely cold conditions was significantly higher than that of the young group. The results showed that mildly high temperature was the most important AT risk factor for EACs, and older adults and men were vulnerable populations with non-optimal AT. For cardiovascular EACs, the total AF was 10.37%, primarily driven by moderate cold (3.22%), with men (16.91%) and older adults (9.88%) at a higher risk. In contrast, respiratory EACs had a lower total AF (4.94%), mainly linked to moderate colds (3.14%), affecting older adults (3.15%) more than younger individuals. Significant AFs were consistently found for moderate and extreme cold conditions concerning cardiovascular and respiratory EACs, whereas heat-related effects showed less pronounced impacts.
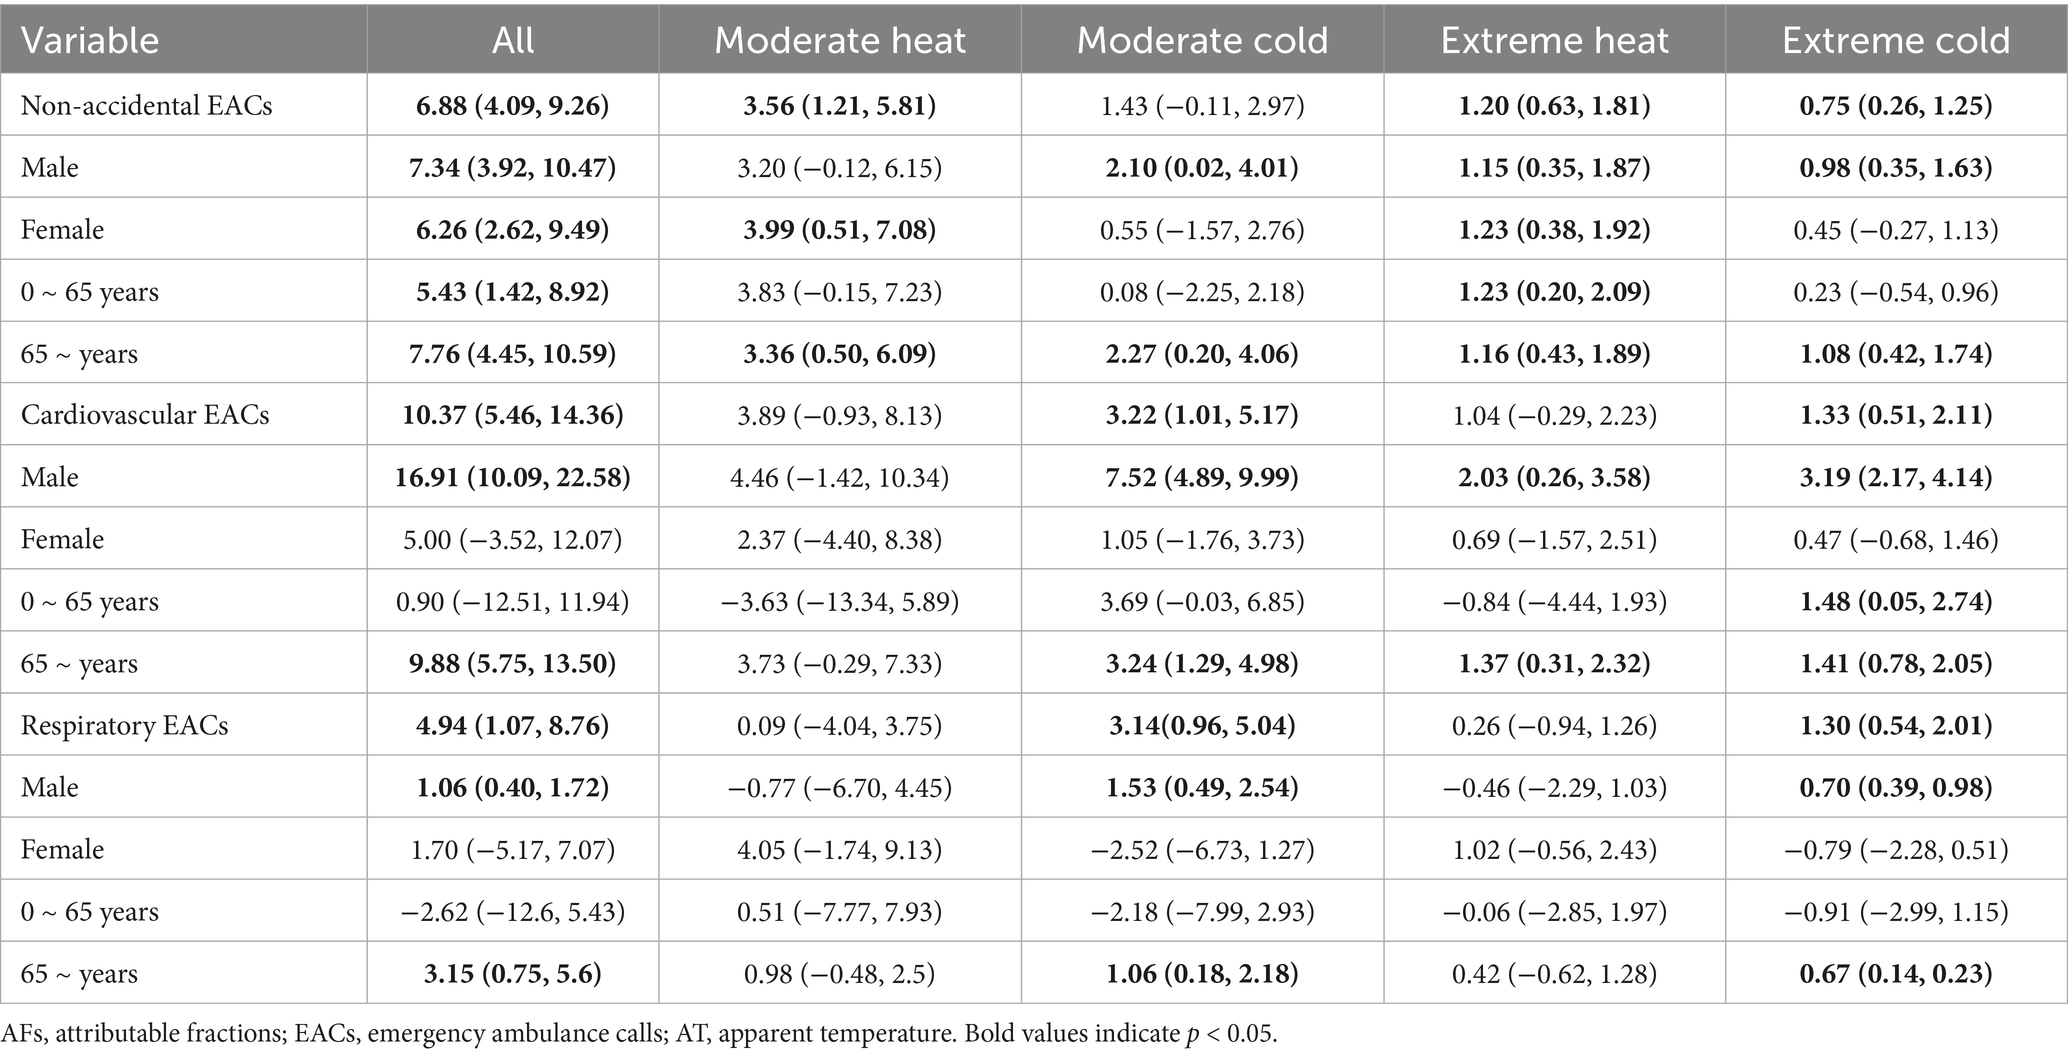
Table 2. The AFs of non-accidental, cardiovascular and respiratory EACs in Wuxi associated with non-optimal AT, stratified by sex and age.
3.5 Sensitivity analysis
A sensitivity analysis was performed by varying the degrees of freedom for long-term time trends (6–9) and relative humidity (4–6), assessing alternative lag periods (7 and 21 days), and evaluating potential confounding by NO2 and SO2 via separate pollutant-adjusted models (Table 3). When these factors were considered with different settings, minimal variation in attributable fractions (AFs) of non-optimal AT on residents’ EACs was observed, indicating that the model was stable.
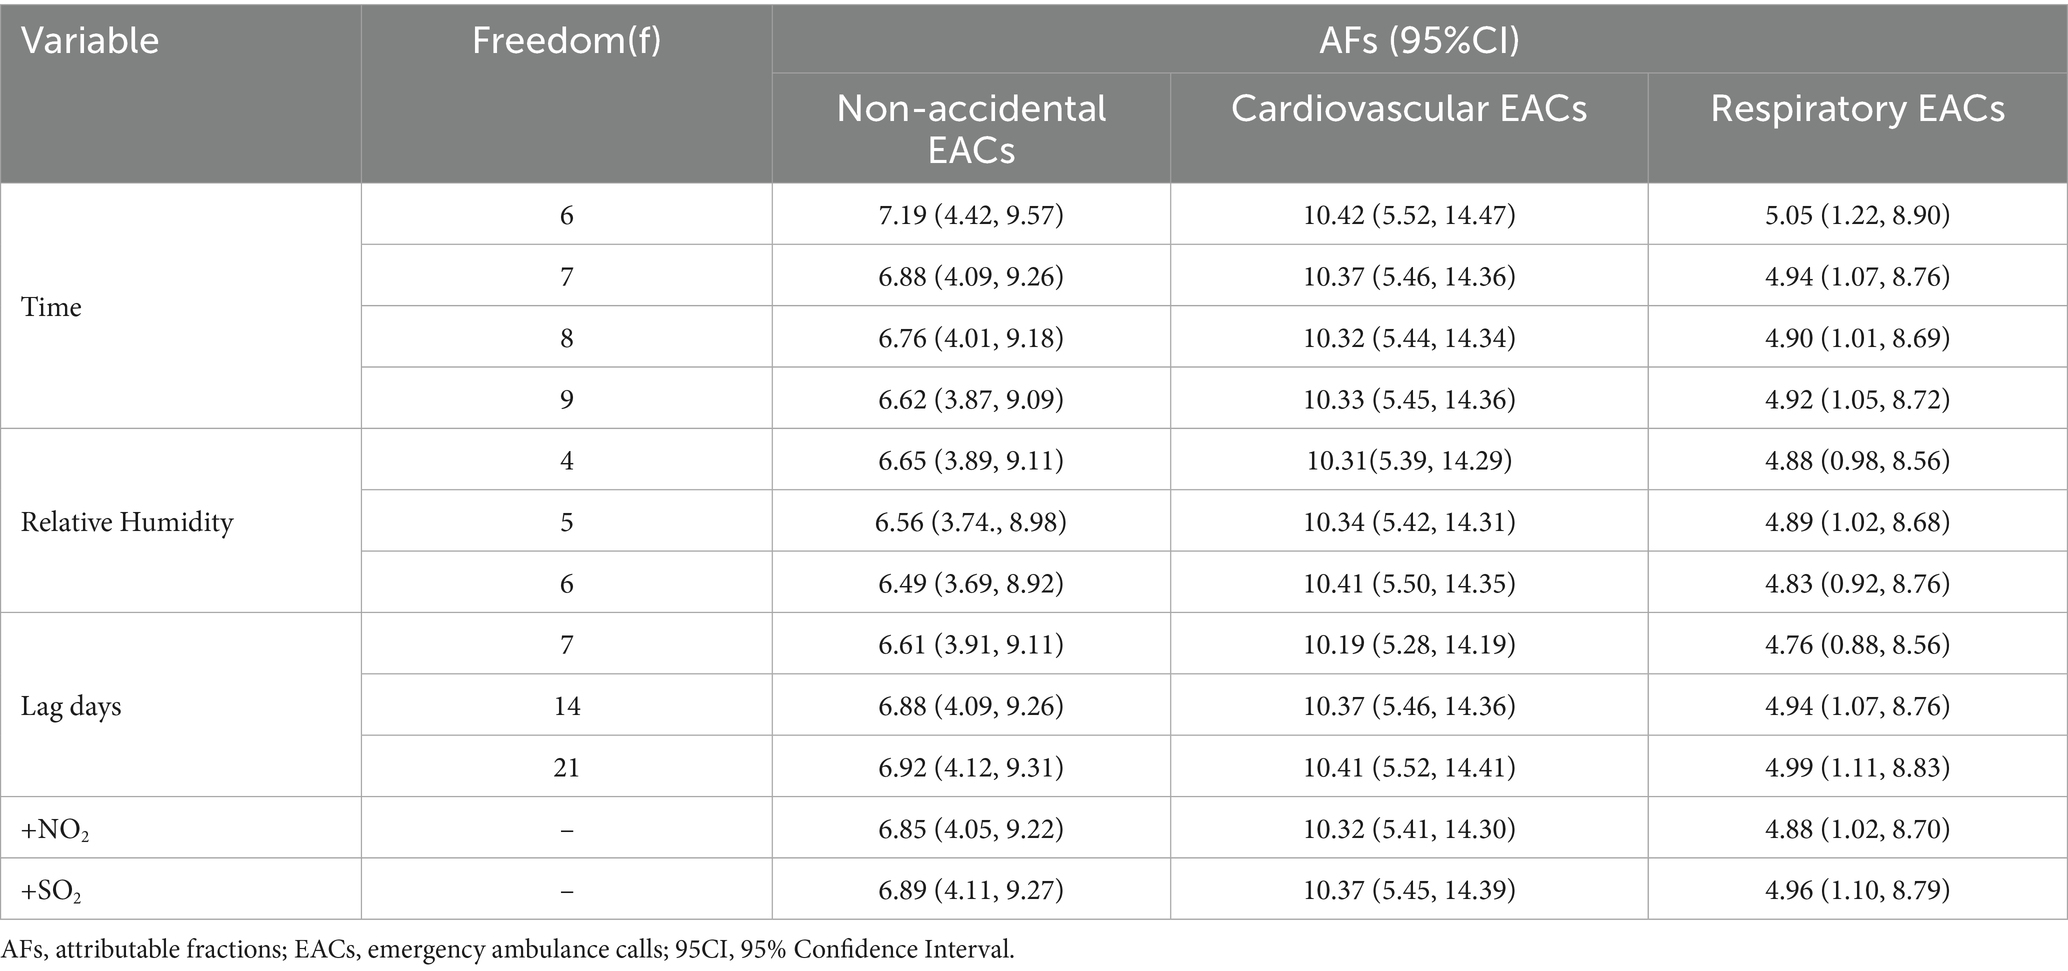
Table 3. Sensitivity analysis of the attributable fraction of apparent temperature on EACs.
4 Discussion
This study investigated the effect of non-optimal AT on EACs using daily EAC, meteorological, and air pollution data from Wuxi City between 2014 and 2019. After adjusting for relative humidity, PM2.5, O3, and long-term trends, a ‘U’-shaped relationship was observed between AT and non-accidental, cardiovascular and circulatory EACs, with the lowest risk AT occurring at 22.54 °C, 17.12 °C, and 12.74 °C, respectively. These findings indicate that both low and high AT levels increase the incidence of non-accidental, cardiovascular, and respiratory EACs in Wuxi residents, which aligns with previous studies reporting varying optimal temperatures for EACs across different regions (28–32). The heterogeneity in optimal temperatures across different studies may stem from multiple contextual factors, including regional climatic characteristics, population demographics, disparities in healthcare resource allocation, urban heat island (UHI) effects, and socioeconomic status.
Our study revealed that high AT exert an immediate effect on EACs, whereas most low AT effects occur with a delay, which is consistent with the results of previous studies (7, 33, 34). The immediate effect of high AT stems from a rapid physiological breakdown dominated by neural regulation, whereas the delayed effects of low AT are closely linked to the cumulative damage mediated by fluid regulation, immune suppression, and metabolic dysregulation (35). However, a study in Zhengzhou found no significant effect of extreme heat (>32.1 °C) on respiratory EACs (29). The observed differences may be attributed to Wuxi’s humid subtropical climate, which exacerbates perceived heat stress during extreme temperature events. This condition impairs the efficiency of respiratory mucosal defence and pathogen clearance. In contrast, Zhengzhou’s semi-arid climate promotes evaporative cooling, enhancing physiological tolerance to heat stress. Furthermore, Wuxi experiences a more pronounced UHI effect resulting from its compact urban form and limited nighttime cooling because of Tai Lake, which prolongs thermal exposure and intensifies acute respiratory impacts.
Males demonstrated significant sensitivity to both heat and cold exposure. Similarly, individuals aged ≥65 years showed a heightened vulnerability to thermal extremes. In contrast, females exhibited a greater susceptibility to extreme heat. These findings align with previous research (8, 9, 36) and may be attributed to physiological and thermoregulatory differences between the sexes. Specifically, females exhibit reduced heat dissipation capacity, resulting in elevated core, skin, and active muscle temperatures. Conversely, males experience more pronounced decreases in core temperature during cold exposure, leading to greater cold intolerance (37, 38). Furthermore, the predominance of males in outdoor labour-intensive occupations, such as agriculture and construction, may contribute to their enhanced heat tolerance through occupational acclimatisation (39). Age-stratified analyses suggested that extreme cold was associated with increased EACs in people aged ≥65 years, which is consistent with the findings of a study conducted in Australia (40). A possible reason for this could be that older adults have poorer physiological regulation capabilities, have more chronic diseases, and may reduce outdoor activities in cold weather, potentially lacking sufficient self-protection awareness or ability (2, 41, 42).
Attribution analysis revealed that for non-accidental EACs, the AF of moderate heat (3.56%) was significantly higher than that of moderate cold (1.20%). This difference stems from two main factors. First, people are more likely to be exposed to heat due to work or daily activities (43, 44) and often lack adequate protective measures, whereas in cold conditions, individuals can mitigate the effects by proper clothing. Second, high temperatures can directly cause acute conditions, such as heatstroke, dehydration, and multi-organ failure, increasing emergency medical demand. This is corroborated by multi-city Chinese data showing a 5.9% AF for heat-related emergency visits (45), with localised studies in Huainan further quantifying a 2.24% AF for ambulance dispatches during extreme heat (46). Similarly, Shenzhen’s findings on heatwave-induced EACs (47) collectively underscore the nationwide heat burden on emergency systems. For cardiovascular EACs, Wuxi’s AF reached 10.37%, which is consistent with Shenzhen’s findings (9.46% for moderate cold stress, particularly affecting males and older adults) (30), highlighting the widespread cardiovascular threat of cold temperatures across China. Our cardiovascular and respiratory EAC analysis revealed that significant AFs were associated with moderate and extreme cold conditions. These findings align with previous studies (45, 47). This phenomenon can be primarily attributed to the prolonged duration of cold weather and its significant and direct effect on the cardiovascular system. Cold temperatures may increase the risk of cardiovascular diseases by influencing the autonomic nervous system, blood pressure, body temperature regulation, inflammatory responses, and oxidative stress (1). In respiratory EACs, a low AT can directly affect respiratory diseases by stimulating airway mucosal vasoconstriction and suppressing immune responses (10). This study has several strengths. First, we used the new composite index AT as an early warning indicator to assess the immediate and delayed effects of temperature on EACs, which may be more realistic and objective than ambient temperature alone. Second, the AFs were calculated to quantify the proportion of EACs attributable to non-optimal AT, thus establishing an evidence base for developing temperature-adaptation strategies in emergency response systems. Finally, we conducted a detailed analysis to compare the effects of AT on different populations of EACs and identify susceptible populations. However, this study has some limitations. First, this study used environmental monitoring station data as the population exposure level for analysis, which belongs to ecological research and may deviate from individual exposure levels. Second, information on medical history, medication use, lifestyle, and access to healthcare services was not included in the emergency care attendance records; therefore, these potential confounders could not be avoided during the analysis. In addition, the lagged effect of temperature on the 120 emergency volumes was only accurate to days and did not consider the variation in hours, which may have led to insufficient accuracy (48). Finally, the limited sample size may have increased the risk of Type II error in some null findings, particularly the observed non-significant association between extreme temperatures and cardiovascular EACs in the 0–65 age group. In future studies, focusing on individual exposure levels and analysing potential risk factors will be necessary to provide a scientific basis for public health protection strategies and measures under extreme temperature conditions.
This study uses historical emergency medical data from Wuxi to provide practical guidance for predicting and preparing for temperature-related emergency burdens. The findings are especially relevant to the Yangtze River Delta region, where cities have similar meteorological conditions, comparable economic development levels, similar healthcare resource allocations, and alike population densities. However, these results may not apply well to other regions in China. Areas with different climate features, like the humid south or arid north, may have different relationships between temperature and emergencies because of varying environmental and socioeconomic factors.
5 Conclusion
A non-linear U-shaped relationship was observed between AT and non-accidental, cardiovascular and circulatory EACs, with the lowest risk ATs occurring at 22.54 °C, 17.12 °C, and 12.74 °C, respectively. Both high and low ATs significantly increased the demand for non-accidental EACs, particularly cardiovascular and respiratory EACs. High AT levels have an immediate effect, whereas low levels exhibit a delayed effect. Notably, males and individuals aged ≥65 years were more vulnerable to extreme AT, whereas women demonstrated heightened sensitivity to high AT. These findings are important for developing targeted interventions and hospital service plans to address climate change.
Data availability statement
The processed datasets generated for this study are available on request. The data are not publicly available due to privacy restrictions, but non-identifiable data can be provided by the corresponding author upon reasonable request.
Ethics statement
The studies involving humans were approved by Ethics Committee of Wuxi Center for Disease Control and Prevention. The studies were conducted in accordance with the local legislation and institutional requirements. Written informed consent for participation was not required from the participants or the participants’ legal guardians/next of kin in accordance with the national legislation and institutional requirements.
Author contributions
CY: Software, Writing – review & editing, Writing – original draft, Validation. XL: Formal analysis, Data curation, Writing – review & editing. WaZ: Writing – review & editing, Methodology. YT: Formal analysis, Writing – review & editing. PZ: Writing – review & editing, Methodology, Project administration. CL: Software, Writing – review & editing, Investigation. WeZ: Writing – review & editing, Resources, Project administration. XD: Writing – review & editing, Formal analysis.
Funding
The author(s) declare that financial support was received for the research and/or publication of this article. This study was supported by the Top Talent Support Program for Young and Middle-Aged People of the Wuxi Health Commission (grant number BJ2023100), Medical Key Discipline Program of Wuxi Health Commission (grant number LCZX2021006), Cohort and Clinical Research Program of Wuxi Medical Center, Nanjing Medical University (grant number WMCC202318), Major Program of Wuxi Medical Center, Nanjing Medical University (grant numbers WMCJ202302 and WMCJ202404), and Preventive Medicine Research Program of Jiangsu Provincial Health Commission (grant number Ym2023009).
Acknowledgments
The authors thank all the funders of this study and all researchers related to the article.
Conflict of interest
The authors declare that the research was conducted in the absence of any commercial or financial relationships that could be construed as a potential conflict of interest.
Generative AI statement
The authors declare that no Gen AI was used in the creation of this manuscript.
Any alternative text (alt text) provided alongside figures in this article has been generated by Frontiers with the support of artificial intelligence and reasonable efforts have been made to ensure accuracy, including review by the authors wherever possible. If you identify any issues, please contact us.
Publisher’s note
All claims expressed in this article are solely those of the authors and do not necessarily represent those of their affiliated organizations, or those of the publisher, the editors and the reviewers. Any product that may be evaluated in this article, or claim that may be made by its manufacturer, is not guaranteed or endorsed by the publisher.
Supplementary material
The Supplementary material for this article can be found online at: https://www.frontiersin.org/articles/10.3389/fpubh.2025.1652961/full#supplementary-material
Abbreviations
AT, apparent temperature; GAM, generalised additive model; EACs, emergency ambulance calls; DLNM, distributed lag non-linear model; df, degree of freedom; RR, relative risk; AF, attributable fractions; 95%CI, 95% Confidence interval.
References
1. Chen, R, Yin, P, Wang, L, Liu, C, Niu, Y, Wang, W, et al. Association between ambient temperature and mortality risk and burden: time series study in 272 main Chinese cities. BMJ. (2018) 363:k4306. doi: 10.1136/bmj.k4306
2. García-León, D, Masselot, P, Mistry, MN, Gasparrini, A, Motta, C, Feyen, L, et al. Temperature-related mortality burden and projected change in 1368 European regions: a modelling study. Lancet Public Health. (2024) 9:e644–53. doi: 10.1016/S2468-2667(24)00179-8
3. Vicedo-Cabrera, AM, Scovronick, N, Sera, F, Roye, D, Schneider, R, Tobias, A, et al. The burden of heat-related mortality attributable to recent human-induced climate change. Nat Clim Chang. (2021) 11:492–500. doi: 10.1038/s41558-021-01058-x
4. Hundessa, S, Huang, W, Zhao, Q, Wu, Y, Wen, B, Alahmad, B, et al. Global and regional cardiovascular mortality attributable to nonoptimal temperatures over time. J Am Coll Cardiol. (2024) 83:2276–87. doi: 10.1016/j.jacc.2024.03.425
5. Feng, F, Ma, Y, Zhang, Y, Shen, J, Wang, H, Cheng, B, et al. Effects of extreme temperature on respiratory diseases in Lanzhou, a temperate climate city of China. Environ Sci Pollut Res. (2021) 28:49278–88. doi: 10.1007/s11356-021-14169-x
6. Lei, J, Chen, R, Yin, P, Meng, X, Zhang, L, Liu, C, et al. Association between cold spells and mortality risk and burden: a nationwide study in China. Environ Health Perspect. (2022) 130:10.1289/EHP9284. doi: 10.1289/EHP9284
7. Wu, Y, Liu, X, Gao, L, Sun, X, Hong, Q, Wang, Q, et al. Short-term exposure to extreme temperature and outpatient visits for respiratory diseases among children in the northern city of China: a time-series study. BMC Public Health. (2024) 24:10.1186/s12889-024-17814-5. doi: 10.1186/s12889-024-17814-5
8. Achebak, H, Rey, G, Lloyd, SJ, Quijal-Zamorano, M, Méndez-Turrubiates, RF, and Ballester, J. Ambient temperature and risk of cardiovascular and respiratory adverse health outcomes: a nationwide cross-sectional study from Spain. Eur J Prev Cardiol. (2024) 31:1080–9. doi: 10.1093/eurjpc/zwae021
9. Achebak, H, Garcia-Aymerich, J, Rey, G, Chen, Z, Mendez-Turrubiates, RF, and Ballester, J. Ambient temperature and seasonal variation in inpatient mortality from respiratory diseases: a retrospective observational study. Lancet Reg Health Eur. (2023) 35:100757. doi: 10.1016/j.lanepe.2023.100757
10. Li, X, Zhang, Y, Tian, Z, Wang, J, Zhao, J, Lyu, Y, et al. Lag effect of ambient temperature on respiratory emergency department visits in Beijing: a time series and pooled analysis. BMC Public Health. (2024) 24:1363. doi: 10.1186/s12889-024-18839-6
11. Liu, J, Liu, T, Burkart, KG, Wang, H, He, G, Hu, J, et al. Mortality burden attributable to high and low ambient temperatures in China and its provinces: results from the global burden of disease study 2019. Lancet Reg Health. (2022) 24:24100493. doi: 10.1016/j.lanwpc.2022.100493
12. Wang, B, Chai, G, Sha, Y, Zha, Q, Su, Y, and Gao, Y. Impact of ambient temperature on cardiovascular disease hospital admissions in farmers in China's Western suburbs. Sci Total Environ. (2021) 761:143254. doi: 10.1016/j.scitotenv.2020.143254
13. Xu, E, Li, Y, Li, T, and Li, Q. Association between ambient temperature and ambulance dispatch: a systematic review and meta-analysis. Environ Sci Pollut Res. (2022) 29:66335–47. doi: 10.1007/s11356-022-20508-3
14. Gestal, RS, Figueiras, A, and Royé, D. Effect of temperature on emergency ambulance call-outs for cardiovascular causes: a scoping review. Environ Health. (2023) 1:6–14. doi: 10.1021/envhealth.3c00003
15. Xu, Z, Watzek, JT, Phung, D, Oberai, M, Rutherford, S, and Bach, A. Heat, heatwaves, and ambulance service use: a systematic review and meta-analysis of epidemiological evidence. Int J Biometeorol. (2023) 67:1523–42. doi: 10.1007/s00484-023-02525-0
16. Ghada, W, Estrella, N, Pfoerringer, D, Kanz, KG, Bogner-Flatz, V, Ankerst, DP, et al. Effects of weather, air pollution and Oktoberfest on ambulance-transported emergency department admissions in Munich, Germany. Sci Total Environ. (2021) 755:143772. doi: 10.1016/j.scitotenv.2020.143772
17. Sari Kovats, R, and Hajat, S. Heat stress and public health: a critical review. Annu Rev Public Health. (2008) 29:41–55. doi: 10.1146/annurev.publhealth.29.020907.090843
18. Alessandrini, E, Zauli Sajani, S, Scotto, F, Miglio, R, Marchesi, S, and Lauriola, P. Emergency ambulance dispatches and apparent temperature: a time series analysis in Emilia–Romagna, Italy. Environ Res. (2011) 111:1192–200. doi: 10.1016/j.envres.2011.07.005
19. Grjibovski, AM, Adilbekova, B, Omralina, E, Imangazinova, S, Akhmetova, Z, Ainabai, A, et al. Effects of air temperature on the number of ambulance calls for asthma during cold season in Nur-sultan—the second coldest capital in the world. Int J Circumpolar Health. (2021) 80:1978228. doi: 10.1080/22423982.2021.1978228
20. Zhao, Y, Jia, X, Lee, HF, Zhao, H, Cai, S, and Huang, X. Relationship between ancient bridges and population dynamics in the lower Yangtze River basin, China. PLoS One. (2017) 12:e0182560. doi: 10.1371/journal.pone.0182560
21. Ueno, S, Hayano, D, Noguchi, E, and Aruga, T. Investigating age and regional effects on the relation between the incidence of heat-related ambulance transport and daily maximum temperature or WBGT. Environ Health Prev Med. (2021) 26:116. doi: 10.1186/s12199-021-01034-z
22. Yi, W, Zhang, X, Gao, J, Wei, Q, Pan, R, Duan, J, et al. Examining the association between apparent temperature and admissions for schizophrenia in Hefei, China, 2005-2014: a time-series analysis. Sci Total Environ. (2019) 672:1–6. doi: 10.1016/j.scitotenv.2019.03.436
23. Xu, Z, Cheng, J, Hu, W, and Tong, S. Heatwave and health events: a systematic evaluation of different temperature indicators, heatwave intensities and durations. Sci Total Environ. (2018) 630:679–89. doi: 10.1016/j.scitotenv.2018.02.268
24. Royé, D, Zarrabeitia, MT, Riancho, J, and Santurtún, A. A time series analysis of the relationship between apparent temperature, air pollutants and ischemic stroke in Madrid, Spain. Environ Res. (2019) 173:349–58. doi: 10.1016/j.envres.2019.03.065
25. Boudreault, J, Lavigne, É, Campagna, C, and Chebana, F. Estimating the heat-related mortality and morbidity burden in the province of Quebec, Canada. Environ Res. (2024):257119347. doi: 10.1016/j.envres.2024.119347
26. Quijal-Zamorano, M, Martinez-Solanas, E, Achebak, H, Petrova, D, Robine, JM, Herrmann, FR, et al. Seasonality reversal of temperature attributable mortality projections due to previously unobserved extreme heat in Europe. Lancet Planet Health. (2021) 5:e573–5. doi: 10.1016/S2542-5196(21)00211-4
27. Guo, C, Cai, K, Chen, G, Wang, J, Zeng, J, Huang, X, et al. Daily diurnal temperature range associated with emergency ambulance calls: a nine-year time-series study. Front Public Health. (2024):121454097. doi: 10.3389/fpubh.2024.1454097
28. An, Y, Xing, D, Chen, S, Wang, X, Zhou, X, and Zhang, Y. Association between ambient temperatures and cardiovascular disease: a time series analysis using emergency ambulance dispatches in Chongqing, China, 2019-2021. Health Place. (2024):91103403. doi: 10.1016/j.healthplace.2024.103403
29. Cui, Y, Ai, S, Liu, Y, Qian, ZM, Wang, C, Sun, J, et al. Hourly associations between ambient temperature and emergency ambulance calls in one central Chinese city: call for an immediate emergency plan. Sci Total Environ. (2020):711135046. doi: 10.1016/j.scitotenv.2019.135046
30. Jingesi, M, Yin, Z, Huang, S, Liu, N, Ji, J, Lv, Z, et al. Cardiovascular morbidity risk attributable to thermal stress: analysis of emergency ambulance dispatch data from Shenzhen, China. BMC Public Health. (2024) 24:10.1186/s12889-024-20144-1. doi: 10.1186/s12889-024-20144-1
31. Wang, YC, Lin, YK, Chen, YJ, Hung, SC, Zafirah, Y, and Sung, FC. Ambulance services associated with extreme temperatures and fine particles in a Subtropical Island. Sci Rep. (2020) 10:2855. doi: 10.1038/s41598-020-59294-8
32. Yin, Z, Jingesi, M, Yin, Z, Chen, S, Huang, S, Cheng, J, et al. Short-term effects of temperature-related indices on emergency ambulance dispatches due to mental and behavioral disorders in Shenzhen, China. Front Public Health. (2024):121343550. doi: 10.3389/fpubh.2024.1343550
33. Wu, W, Chen, B, Wu, G, Wan, Y, Zhou, Q, Zhang, H, et al. Increased susceptibility to temperature variation for non-accidental emergency ambulance dispatches in Shenzhen, China. Environ Sci Pollut Res Int. (2021) 28:32046–56. doi: 10.1007/s11356-021-12942-6
34. Zhan, Z, Zhong, X, Yang, J, Ding, Z, Xie, X, Zheng, Z, et al. Effect of apparent temperature on hospitalization from a spectrum of cardiovascular diseases in rural residents in Fujian, China. Environ Pollut. (2022):303119101. doi: 10.1016/j.envpol.2022.119101
35. Filingeri, D. Neurophysiology of skin thermal sensations. Compr. Physiol. (2016) 6:1429. doi: 10.1002/cphy.c150040
36. Chitu, Z, Bojariu, R, Velea, L, and Van Schaeybroeck, B. Large sex differences in vulnerability to circulatory-system disease under current and future climate in Bucharest and its rural surroundings. Environ Res. (2023) 234:116531. doi: 10.1016/j.envres.2023.116531
37. Brychta, RJ, Mcgehee, S, Huang, S, Leitner, BP, Duckworth, CJ, Fletcher, LA, et al. The thermoneutral zone in women takes an “arctic” shift compared to men. Proc Natl Acad Sci USA. (2024) 121:e1983851175. doi: 10.1073/pnas.2311116121
38. Greenfield, AM, Alba, BK, Giersch, G, and Seeley, AD. Sex differences in thermal sensitivity and perception: implications for behavioral and autonomic thermoregulation. Physiol Behav. (2023):263114126. doi: 10.1016/j.physbeh.2023.114126
39. Yuan, L, Madaniyazi, L, Vicedo-Cabrera, AM, Ng, C, Oka, K, Chua, P, et al. Non-optimal temperature-attributable mortality and morbidity burden by cause, age and sex under climate and population change scenarios: a nationwide modelling study in Japan. Lancet Reg Health. (2024) 52:52101214. doi: 10.1016/j.lanwpc.2024.101214
40. Campbell, SL, Remenyi, T, Williamson, GJ, Rollins, D, White, CJ, and Johnston, FH. Ambulance dispatches and heatwaves in Tasmania, Australia: a case-crossover analysis. Environ Res. (2021) 202:111655. doi: 10.1016/j.envres.2021.111655
41. Requia, WJ, Alahmad, B, Schwartz, JD, and Koutrakis, P. Association of low and high ambient temperature with mortality for cardiorespiratory diseases in Brazil. Environ Res. (2023) 234:116532. doi: 10.1016/j.envres.2023.116532
42. Yang, J, Yin, P, Sun, J, Wang, B, Zhou, M, Li, M, et al. Heatwave and mortality in 31 major Chinese cities: definition, vulnerability and implications. Sci Total Environ. (2019) 649:695–702. doi: 10.1016/j.scitotenv.2018.08.332
43. Riley, K, Wilhalme, H, Delp, L, and Eisenman, DP. Mortality and morbidity during extreme heat events and prevalence of outdoor work: an analysis of community-level data from Los Angeles County, California. Int J Environ Res Public Health. (2018) 15:580. doi: 10.3390/ijerph15040580
44. Zhan, ZY, Yu, YM, Qian, J, Song, YF, Chen, PY, and Ou, CQ. Effects of ambient temperature on ambulance emergency call-outs in the subtropical city of Shenzhen, China. PLoS One. (2018) 13:e0207187. doi: 10.1371/journal.pone.0207187
45. Cheng, J, Zhang, Y, Zhang, W, Xu, Z, Bambrick, H, Hu, W, et al. Assessment of heat- and cold-related emergency department visits in cities of China and Australia: population vulnerability and attributable burden. Environ Res. (2018) 166:610–9. doi: 10.1016/j.envres.2018.06.026
46. Cheng, J, Xu, Z, Zhao, D, Xie, M, Zhang, H, Wang, S, et al. The burden of extreme heat and heatwave on emergency ambulance dispatches: a time-series study in Huainan, China. Sci Total Environ. (2016) 571:27–33. doi: 10.1016/j.scitotenv.2016.07.103
47. Hu, J, Wen, Y, Duan, Y, Yan, S, Liao, Y, Pan, H, et al. The impact of extreme heat and heat waves on emergency ambulance dispatches due to external cause in Shenzhen, China. Environ Pollut. (2020):261114156. doi: 10.1016/j.envpol.2020.114156
48. Zhan, ZY, Yu, YM, Chen, TT, Xu, LJ, An, SL, and Ou, CQ. Effects of hourly precipitation and temperature on ambulance response time. Environ Res. (2020) 181:108946. doi: 10.1016/j.envres.2019.108946
49. Wang, Q, He, Y, Hajat, S, Cheng, J, Xu, Z, Hu, W, et al. Temperature-sensitive morbidity indicator: consequence from the increased ambulance dispatches associated with heat and cold exposure. Int J Biometeorol. (2021) 65:1871–80. doi: 10.1007/s00484-021-02143-8
Keywords: apparent temperature, emergency ambulance calls, extreme temperatures, attributable risk, time series analysis
Citation: Yang C, Li X, Zhang W, Tao Y, Zhu P, Lu C, Zhou W and Ding X (2025) Associations between apparent temperatures and emergency ambulance calls in Wuxi, China: a time series analysis. Front. Public Health. 13:1652961. doi: 10.3389/fpubh.2025.1652961
Edited by:
Jian Cheng, Anhui Medical University, ChinaReviewed by:
Tianfeng He, Ningbo Municipal Center for Disease Control and Prevention, ChinaPeizhi Deng, Central South University, China
Copyright © 2025 Yang, Li, Zhang, Tao, Zhu, Lu, Zhou and Ding. This is an open-access article distributed under the terms of the Creative Commons Attribution License (CC BY). The use, distribution or reproduction in other forums is permitted, provided the original author(s) and the copyright owner(s) are credited and that the original publication in this journal is cited, in accordance with accepted academic practice. No use, distribution or reproduction is permitted which does not comply with these terms.
*Correspondence: Xinliang Ding, ZGluZ3hpbmxpYW5nQG5qbXUuZWR1LmNu
†These authors have contributed equally to this work