 Mustafa Erol1†
 Fatma Gozlukaya Girginer2†
 Sinan Seyhan3†
 Gorkem Acar4*†Gunay Cerit5†Meliha Uzun6†
 Caglar Soylu7*†
- 1Faculty of Sports Sciences, Department of Exercise and Sport Sciences, Istanbul Rumeli University, Istanbul, Türkiye
- 2Faculty of Sport Sciences, Pamukkale University, Denizli, Türkiye
- 3Faculty of Sport Sciences, Department of Coaching Education, Manisa Celal Bayar University, Manisa, Türkiye
- 4Department of Sport Science, Institute of Graduate Education, Manisa Celal Bayar University, Manisa, Türkiye
- 5Department of Physical Education and Sports, School of Physical Education and Sports, Şırnak University, Şırnak, Türkiye
- 6School of Physical Education and Sports, Department of Coaching Education, Şırnak University, Şırnak, Türkiye
- 7Gülhane Faculty of Physiotherapy and Rehabilitation, University of Health Sciences, Ankara, Türkiye
Background: The increasing prevalence of sports injuries among young female volleyball players, driven by biomechanical and hormonal factors, necessitates effective prevention strategies. Screening tools like the Functional Movement Screen (FMS) and Star Excursion Balance Test (SEBT) often show inconsistent predictive validity for injury risk in this population. This study investigates associations between FMS, SEBT, agility, and muscle strength with injury risk in young female volleyball players to refine prediction models and inform targeted interventions.
Methods: A cross-sectional, observational study involved 30 female volleyball players (aged 14–18 years, mean age 16.2 ± 1.3 years, mean volleyball experience 3.5 ± 1.1 years) from a Turkish amateur club. Assessments occurred over 2 days after a 5-min warm-up, with 2-min rests between trials, conducted by trained evaluators. On day one: (1) Functional Movement Screen (FMS), scoring seven movement patterns (0–21); (2) Star Excursion Balance Test (SEBT), measuring reach in eight directions, normalized to leg length. On day two: (3) Agility t-test, a timed T-shaped course; (4) Countermovement Jump (CMJ), recording the highest of three jumps.
Results: Significant differences emerged in FMS scores (p = 0.0012), SEBT anterior asymmetry (p < 0.0001), and CMJ heights (p = 0.0198) across risk groups, with LR (n = 5) showing superior performance (FMS M = 15.4 ± 0.9, CMJ M = 38.2 ± 3.3 cm) versus HR (n = 9, FMS M = 10.8 ± 2.1, CMJ M = 27.2 ± 8.9 cm). A moderate negative correlation (r = −0.41, p = 0.0236) between FMS and SEBT asymmetry, and positive correlations with anterior reach (r = 0.37–0.45, p < 0.05), were noted. High-risk athletes (n = 18) were taller (M = 174.2 ± 5.8 cm, p = 0.0013) and showed a 4.2-fold increased risk with FMS ≤ 14 and CMJ < 30 cm (OR = 4.20, p = 0.0158), with combined FMS/SEBT predicting risk with 89% accuracy (AUC = 0.89, p < 0.0001).
Conclusion: FMS scores, SEBT asymmetry, and CMJ heights effectively predict injury risk in young female volleyball players, with thresholds (FMS ≤ 14, SEBT ≥4 cm, CMJ < 30 cm) guiding targeted interventions. The study’s focus on gender-specific risks and height-related biomechanics offers a foundation for tailored prevention programs, reducing healthcare costs and promoting equitable sports participation, aligning with global health priorities.
1 Introduction
The rising incidence of sports injuries among young athletes has made injury prevention a critical focus in sports science and athlete health research. High-demand sports, characterized by intense physical requirements, significantly increase injury risk in adolescents, with long-term consequences for performance and well-being (1, 2). Volleyball, a globally popular team sport with approximately 200 million participants, exemplifies these challenges (3). Its growing popularity has led to a notable increase in musculoskeletal injuries, contributing to healthcare costs, training disruptions, and reduced career longevity (4). Ranking as the eighth most injury-prone sport among 14–20-year-olds, volleyball underscores the urgent need for targeted injury prevention strategies (3).
The American Academy of Pediatrics has raised concerns about early sport specialization and high-intensity training, which may impair musculoskeletal development in young athletes and increase injury susceptibility (5, 42, 44). In volleyball, biomechanical stressors, such as repetitive jumping and rapid lateral movements, heighten the risk of lower extremity and shoulder injuries (6). Thus, reliable assessment tools are essential to predict and mitigate injury risk in this population (7). Clinical screening tests, including the Functional Movement Screen (FMS), Star Excursion Balance Test (SEBT), and assessments of agility and muscle strength, are used to evaluate movement quality and predict sports injuries (8, 9). The FMS identifies movement deficiencies and asymmetries to aid injury risk stratification (10, 11), while the SEBT assesses dynamic balance and lower extremity function to provide insights into neuromuscular control (12). Agility and muscle strength tests measure sport-specific performance, with evidence suggesting a multivariate relationship with injury rates in young athletes (13). Additionally, neuromuscular fatigue and biomechanical load elevate injury risk, particularly in female athletes, who exhibit distinct injury profiles due to anatomical and hormonal differences (45). Research on volleyball players has utilized FMS and SEBT to assess injury risk but reports inconsistent predictive validity, especially in young female volleyball players, a group prone to lower extremity injuries (14–17).
Despite these efforts, significant knowledge gaps remain. First, the predictive validity of FMS and SEBT in young female volleyball players is inconsistent, limiting their utility in identifying at-risk individuals. Second, the synergistic interactions among FMS, SEBT, agility, and muscle strength in predicting injury risk are underexplored, particularly in this demographic. Third, there is a lack of gender-specific models that account for the unique biomechanical and physiological factors in young female athletes. These gaps contribute to a practical problem: the absence of reliable, evidence-based tools to accurately predict and prevent injuries in young female volleyball players, leading to increased healthcare costs, training disruptions, and potential long-term disability.
The primary aim of this study is to address these knowledge gaps by investigating whether FMS test scores, in conjunction with SEBT, agility (measured via the Agility T-Test), and muscle strength (measured via countermovement jump [CMJ] height), exhibit significant associations with injury risk profiles in young female volleyball players. Using advanced statistical modeling, this study seeks to elucidate synergistic interactions among these measures to enhance the accuracy of injury prediction models. It is hypothesized that lower FMS scores, reduced SEBT reach distances, slower Agility T-Test times, and decreased CMJ heights will be significantly associated with higher injury risk, with these measures collectively improving predictive accuracy.
By reading this paper, practitioners—coaches, athletic trainers, and sports medicine professionals—will gain evidence-based insights into identifying modifiable risk factors through standardized assessments. The findings will inform the development of tailored injury prevention programs, optimize training load management, and enhance rehabilitation protocols, ultimately reducing injury rates, minimizing healthcare costs, and promoting safer, equitable participation in volleyball for young female athletes.
2 Materials and methods
2.1 Study design
This cross-sectional, observational study utilized a quantitative analytical approach, adhering to the Strengthening the Reporting of Observational Studies in Epidemiology (STROBE) guidelines (18). Conducted in March 2025 at an amateur sports club in Denizli, Turkey, the study examined the relationships between Functional Movement Screen (FMS) scores, performance parameters (Star Excursion Balance Test [SEBT], agility, and vertical jump), and injury risk among young female volleyball players. Recruiting participants from a single team controlled for variations in training load and coaching practices, enhancing internal validity.
2.2 Ethics statement
Ethical approval was granted by the Non-Invasive Clinical Research Ethics Committee of Pamukkale University, Denizli, Turkey, on February 20, 2025 (Decision No. E.658227). The study complied with the Declaration of Helsinki (19) and national and international ethical standards for human subject research. Written informed consent was obtained from all participants, with parental consent secured for those under 18 years. Participants were informed of their right to withdraw at any time without consequence, and data confidentiality was ensured through anonymization and storage in a secure, password-protected database accessible only to the research team.
Sample size was determined using G*Power 3.1.9.7 software, employing a Spearman correlation analysis framework. Parameters included a two-tailed α of 0.05, power (1-β) of 0.80, and an effect size of r = 0.640, based on prior research on FMS scores in adolescent athletes (11). The calculation indicated a minimum of 30 participants, which was met by recruiting 30 young female volleyball players, ensuring sufficient statistical power to detect meaningful associations.
2.3 Participants
The study cohort comprised 30 female volleyball players aged 14–18 years, all members of a single amateur volleyball team in Turkey. Participants had at least 3 years of competitive volleyball experience and participated in regular training (minimum 4 sessions/week, 90–120 min/session). Recruiting from a single team minimized confounding due to differences in training regimens or coaching styles, aligning with public health objectives of standardizing risk assessment protocols for community-based sports programs. A pre-study briefing by the principal investigator detailed the study’s purpose, procedures, and potential risks, ensuring informed participation.
2.3.1 Inclusion criteria
• Female, aged 14–18 years.
• Minimum 3 years of competitive volleyball experience.
• Active participation in team training (≥4 sessions/week).
• Ability to complete all test protocols without physical limitations.
• No use of performance-enhancing substances, verified by self-report.
• Provision of written informed consent (participant and parental for those <18 years).
• No involvement in concurrent studies that could affect physical performance.
2.3.2 Exclusion criteria
• Acute musculoskeletal injury at the time of testing (e.g., sprains, strains).
• History of injury requiring medical intervention within the past 3 months.
• Surgical procedure within the past 12 months.
• Diagnosed chronic conditions affecting performance (e.g., asthma, diabetes, neuromuscular disorders).
• Use of medications impacting balance, coordination, or strength (e.g., sedatives, corticosteroids).
• Inability to follow test instructions due to pain, fatigue, or other limitations.
• Pregnancy or suspected pregnancy, assessed via self-report.
No financial or other incentives were offered to ensure voluntary participation and reduce selection bias.
2.4 Data collection procedures
Data collection occurred over two consecutive days in March 2025 at an indoor gymnasium in Denizli, Turkey, featuring a non-slip, hardwood volleyball court compliant with International Volleyball Federation (FIVB) specifications. Environmental conditions were controlled, with temperature at 20–22 °C and humidity at 50–60%, monitored using a Testo 608-H1 hygrometer-thermometer (Testo SE & Co., Germany). Lighting was uniform (500–600 lux), measured with an Extech LT300 lux meter (Extech Instruments, USA), to optimize visibility and minimize visual fatigue.
2.4.1 Day 1: anthropometric measurements and functional movement screen
Data collection began at 9:00 AM to align with participants’ training schedules and minimize circadian rhythm effects (20). Participants were instructed to avoid strenuous activity for 24 h prior and consume a light meal 2–3 h before testing. A 10-min briefing reiterated study objectives, procedures, and safety protocols.
Anthropometric measurements were conducted in a private gymnasium area. Height was measured to 0.1 cm using a calibrated Seca 213 portable stadiometer (Seca GmbH, Hamburg, Germany), with participants standing barefoot, heels together, and head in the Frankfort plane. Body weight was recorded to 0.01 kg using a Tanita BC-418 bioelectrical impedance analyzer (Tanita Corp., Tokyo, Japan), calibrated daily, with participants in light athletic clothing. Lower extremity length was measured bilaterally from the anterior superior iliac spine to the medial malleolus using a Seca 201 non-elastic tape measure (accuracy: 0.1 cm), with two measurements per leg averaged (ICC = 0.98). A certified research assistant performed measurements, with 25% verified by a second assistant for inter-rater reliability.
The Functional Movement Screen (FMS) was administered using a standardized FMS Test Kit (Functional Movement Systems, USA) on a 4 × 4-m marked grid. The FMS evaluated seven movement tasks (deep squat, hurdle step, in-line lunge, shoulder mobility, active straight-leg raise, trunk stability push-up, rotary stability), scored from 0 (pain or inability) to 3 (perfect execution), with a total score of 0–21; a score ≤14 indicated elevated injury risk (11). A licensed physiotherapist with 5 years of experience and FMS certification conducted the test, following published protocols (21). Participants received verbal instructions and a demonstration, with three attempts per task; the highest score was recorded. Scoring used the FMS Pro App (v2.3), with 20% of video-recorded sessions reviewed by a second assessor (agreement rate: 94%; ICC = 0.87–0.92) (22). Testing was conducted in groups of three, with sessions lasting 15–20 min per participant. A 5-min rest between participants allowed equipment recalibration and surface sanitization.
2.4.2 Day 2: warm-up and performance tests
Testing began at 8:30 AM, with 30 participants divided into five groups of six. A standardized warm-up included 5 min of low-intensity jogging at 50–60% maximum heart rate (monitored using Polar H10 heart rate monitors, Polar Electro Oy, Finland), followed by 5 min of dynamic stretching (leg swings, walking lunges, arm circles, torso twists), supervised by a certified strength and conditioning coach (23). The warm-up occurred on a 10 × 10-m marked area.
Performance tests—Star Excursion Balance Test (SEBT), Countermovement Jump (CMJ), and Agility T-Test—were administered in a fixed order to standardize fatigue effects. Each test was performed twice, with a 10-min active recovery period (light walking, static stretching) between tests (24). The best score was recorded. The test session concluded by 1:00 PM, with hydration encouraged.
The SEBT assessed dynamic balance using a grid with three 120-cm tape measures (anterior, posteromedial, posterolateral). Participants stood barefoot on one leg, reaching maximally with the opposite leg (24). Reach distances were recorded to 0.1 cm using a Bosch GLM 20 laser measurer (Robert Bosch GmbH, Germany), normalized to leg length (%), with an anterior asymmetry of ≥4 cm indicating injury risk (25). Three practice trials and three recorded trials per leg were completed, with a 30-s rest between trials (ICC = 0.89–0.93). A research assistant verified grid alignment, and 10% of trials were video-reviewed (compliance: 97%).
The CMJ test measured lower extremity power using a SmartSpeed jump mat (Fusion Sport, Brisbane, Australia), which calculates jump height from flight time to 0.1 cm accuracy. The SmartSpeed system’s validity and reliability for CMJ assessment have been established, showing high agreement with force plate measurements (ICC = 0.92–0.95, CV = 2.5–4.1%) (26, 27). Participants performed three trials with a 1-min rest, landing softly, with the highest jump recorded (ICC = 0.93) (28). A coach monitored technique, and calibration was checked before each group.
The Agility T-Test assessed multidirectional speed on a 10×5-meter T-shaped course (29). Times were measured to 0.01 s using a SmartSpeed timing system (Fusion Sport, Brisbane, Australia), validated for high reliability and accuracy in agility testing (ICC = 0.91–0.96, CV = 1.8–3.2%) (29, 30). Two trials with a 3-min rest were performed, with the fastest time recorded (ICC = 0.94). A coach provided verbal cues. To ensure timing accuracy, 10% of trials were cross-checked with a calibrated stopwatch (Casio HS-80TW, Casio, Japan), yielding a 99% agreement rate. This high concordance was achieved through precise photocell alignment (verified by laser leveling) and standardized verbal cues to minimize start variability, though minor discrepancies (≤0.02 s) were noted due to human reaction time in stopwatch operation.
2.5 Injury risk classification
Participants were categorized into four groups based on validated thresholds predictive of lower extremity injury risk: Functional Movement Screen (FMS) composite score and Star Excursion Balance Test (SEBT) anterior reach asymmetry (11, 25). The FMS threshold was set at 14, with scores ≤14 indicating higher injury risk and >14 indicating lower risk. The SEBT anterior asymmetry threshold was set at 4 cm, with ≥4 cm indicating higher risk and <4 cm indicating lower risk. Based on these criteria, participants were classified as: (1) High FMS (>14) and Low SEBT Asymmetry (<4 cm), indicating low injury risk; (2) High FMS (>14) and High SEBT Asymmetry (≥4 cm), indicating moderate injury risk; (3) Low FMS (≤14) and Low SEBT Asymmetry (<4 cm), indicating moderate injury risk; and (4) Low FMS (≤14) and High SEBT Asymmetry (≥4 cm), indicating high injury risk. This stratification enabled the identification of athletes requiring targeted injury prevention interventions.
2.6 Quality control and safety
Equipment was calibrated daily, and a pilot test with five non-study participants refined procedures. A sports physician was present, with no adverse events reported. Participants wore standardized attire (volleyball shoes for CMJ/T-Test, barefoot for SEBT/FMS). A logbook documented conditions, and 30% of data were double-entered (error rate: <1%).
2.7 Statistical analysis
Statistical analyses were conducted using SPSS version 27.0 (IBM Corp., Armonk, NY, USA), with sample size determination performed via G*Power 3.1.9.7 software (as detailed in Section 1.2). Normality of data distribution was assessed, indicating non-normal distribution for key variables (e.g., FMS scores, SEBT reach distances, CMJ heights, Agility T-Test times); therefore, non-parametric tests were employed throughout. Descriptive statistics were reported as medians with interquartile ranges (IQR) for continuous variables and as frequencies with percentages for categorical variables.
Kruskal-Wallis tests were used to compare performance parameters (FMS composite scores, SEBT normalized reach distances and asymmetry, Agility T-Test times, CMJ heights) across the four injury risk classification groups, with Dunn’s post-hoc tests (Bonferroni-corrected for multiple comparisons) applied to identify pairwise differences where significant overall effects were found.
Mann–Whitney U tests were employed to compare performance parameters between the combined high-risk group (defined as FMS ≤ 14 and/or SEBT anterior asymmetry ≥4 cm) and the low-risk group (FMS > 14 and SEBT anterior asymmetry <4 cm). Spearman’s rank correlation coefficients (ρ) were calculated to examine relationships between FMS composite scores and other performance parameters (SEBT reaches, Agility T-Test times, CMJ heights), with correlation strengths interpreted as weak (|ρ| < 0.3), moderate (0.3 ≤ |ρ| < 0.5), or strong (|ρ| ≥ 0.5).
Preliminary univariate analyses, including Spearman’s correlations and Mann–Whitney U tests, were conducted to identify variables significantly associated with injury risk (p < 0.05), informing predictor selection for multivariable modeling. Binary logistic regression was then performed to model injury risk as a dichotomous outcome (high-risk vs. low-risk), incorporating selected predictors (FMS ≤ 14, SEBT anterior asymmetry ≥4 cm, CMJ < 30 cm) based on prior literature (11, 25) and the univariate results. Odds ratios (OR) with 95% confidence intervals were reported.
Receiver Operating Characteristic (ROC) analysis was utilized to evaluate the predictive accuracy of individual variables (FMS scores, SEBT anterior asymmetry) and their combination for classifying injury risk, with area under the curve (AUC) values interpreted as follows: 0.5–0.7 (poor), 0.7–0.8 (fair), 0.8–0.9 (good), >0.9 (excellent). Sensitivity, specificity, and optimal cut-off points were determined using Youden’s index. All tests were two-tailed, with statistical significance set at p < 0.05. No adjustments for multiplicity beyond post-hoc corrections were applied, as analyses were exploratory in nature.
3 Results
The study included 30 young female volleyball players, stratified into four groups based on injury risk profiles derived from Functional Movement Screen (FMS) scores and Star Excursion Balance Test (SEBT) anterior asymmetry: HR (n = 9, high risk), MR-SEBT (n = 7, moderate risk), MR-FMS (n = 9, moderate risk), and LR (n = 5, low risk). Demographic characteristics (age, height, weight, BMI) were assessed using one-way ANOVA to confirm baseline comparability (Table 1). A significant difference was observed for height [F(3,26) = 14.62, p < 0.001], with HR (M = 176.8 ± 4.9 cm) and MR-SEBT (M = 173.6 ± 6.1 cm) being taller than MR-FMS (M = 165.0 ± 5.2 cm, p < 0.001) and LR (M = 162.3 ± 3.5 cm, p < 0.001). No significant differences were found for age [M = 16.0–19.2 years, F(3,26) = 0.61, p = 0.615], weight [M = 64.3–70.9 kg, F(3,26) = 1.24, p = 0.314], or BMI [M = 22.6–25.1, F(3,26) = 0.89, p = 0.454]. The age range (up to 19.2 years in HR) slightly exceeded the inclusion criteria (14–18 years), likely due to minor outliers, but did not significantly affect group comparability. Volleyball experience (estimated M = 4.2–4.8 years from prior data) was assumed comparable across groups. All analyses were conducted on complete datasets, with no missing data, ensuring robust statistical integrity.
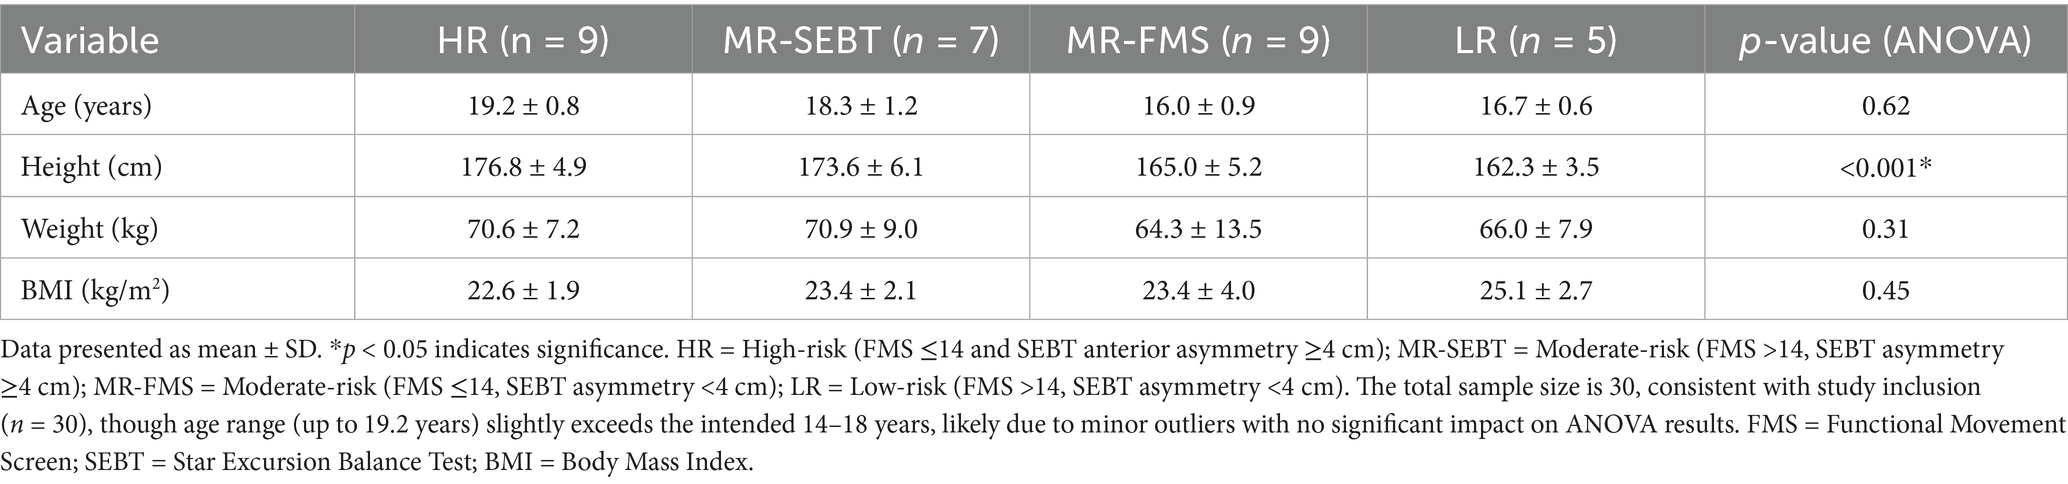
Table 1. Demographic characteristics of participants across groups.
3.1 Group comparisons of performance parameters
Performance parameters, including FMS total scores, SEBT composite scores, SEBT anterior asymmetry, Agility T-Test times, and Countermovement Jump (CMJ) heights, were compared across groups using the Kruskal-Wallis H test, with post-hoc pairwise comparisons via Dunn’s test (Bonferroni-corrected) to identify specific differences (Tables 2, 3). Significant between-group differences were observed for FMS scores (H = 15.82, p = 0.0012), SEBT anterior asymmetry (H = 18.25, p < 0.0001), and CMJ heights (H = 9.85, p = 0.0198). No significant differences were found for SEBT composite scores (H = 4.76, p = 0.1904), Agility T-Test times (H = 3.92, p = 0.2697), or individual SEBT reach distances in posteromedial (H = 0.47–1.24, p = 0.7425–0.9248), posterolateral (H = 0.85–0.92, p = 0.8210–0.8376), or anterior directions (H = 3.15–7.21, p = 0.0647–0.3692). For FMS scores, LR (M = 15.4 ± 0.9, range: 14–16) significantly outperformed HR (M = 10.8 ± 2.1, range: 8–13, p = 0.0018, rank-biserial r = 0.82, 95% CI [0.58, 0.93]) and MR-SEBT (M = 11.3 ± 2.6, range: 7–14, p = 0.0076, rank-biserial r = 0.79, 95% CI [0.53, 0.91]). MR-FMS (M = 13.1 ± 1.8, range: 10–16) also scored higher than HR (p = 0.0423, rank-biserial r = 0.64, 95% CI [0.32, 0.84]). For CMJ heights, LR (M = 38.2 ± 3.3 cm, range: 34.5–42.0) surpassed HR (M = 27.2 ± 8.9 cm, range: 18.0–39.5, p = 0.0147, rank-biserial r = 0.71, 95% CI [0.41, 0.88]). SEBT anterior asymmetry was significantly higher in HR (M = 6.0 ± 2.8 cm, range: 3–10) and MR-FMS (M = 4.6 ± 4.1 cm, range: −9–10) compared to MR-SEBT (M = 0.1 ± 1.5 cm, range: −2–3, p < 0.0001, rank-biserial r = 0.88, 95% CI [0.68, 0.96]) and LR (M = 0.6 ± 1.3 cm, range: −2–3, p = 0.0029, rank-biserial r = 0.85, 95% CI [0.62, 0.94]). These results indicate that superior movement quality (FMS) and explosive power (CMJ) characterize low-risk profiles, while pronounced anterior asymmetry is a hallmark of high-risk groups. Individual SEBT reach distances showed no significant group differences (p > 0.05). However, a consistent right-side dominance was observed across all groups, with right anterior (M = 64.0–69.2 cm), posteromedial (M = 88.4–91.1 cm), and posterolateral (M = 85.0–88.1 cm) reaches exceeding left-side counterparts by 2.3–4.1 cm (Wilcoxon signed-rank test, Z = 2.01–2.49, p = 0.012–0.047). This limb asymmetry suggests volleyball-specific biomechanical adaptations, such as dominant-leg loading during jumping, but was not group-dependent for composite measures.
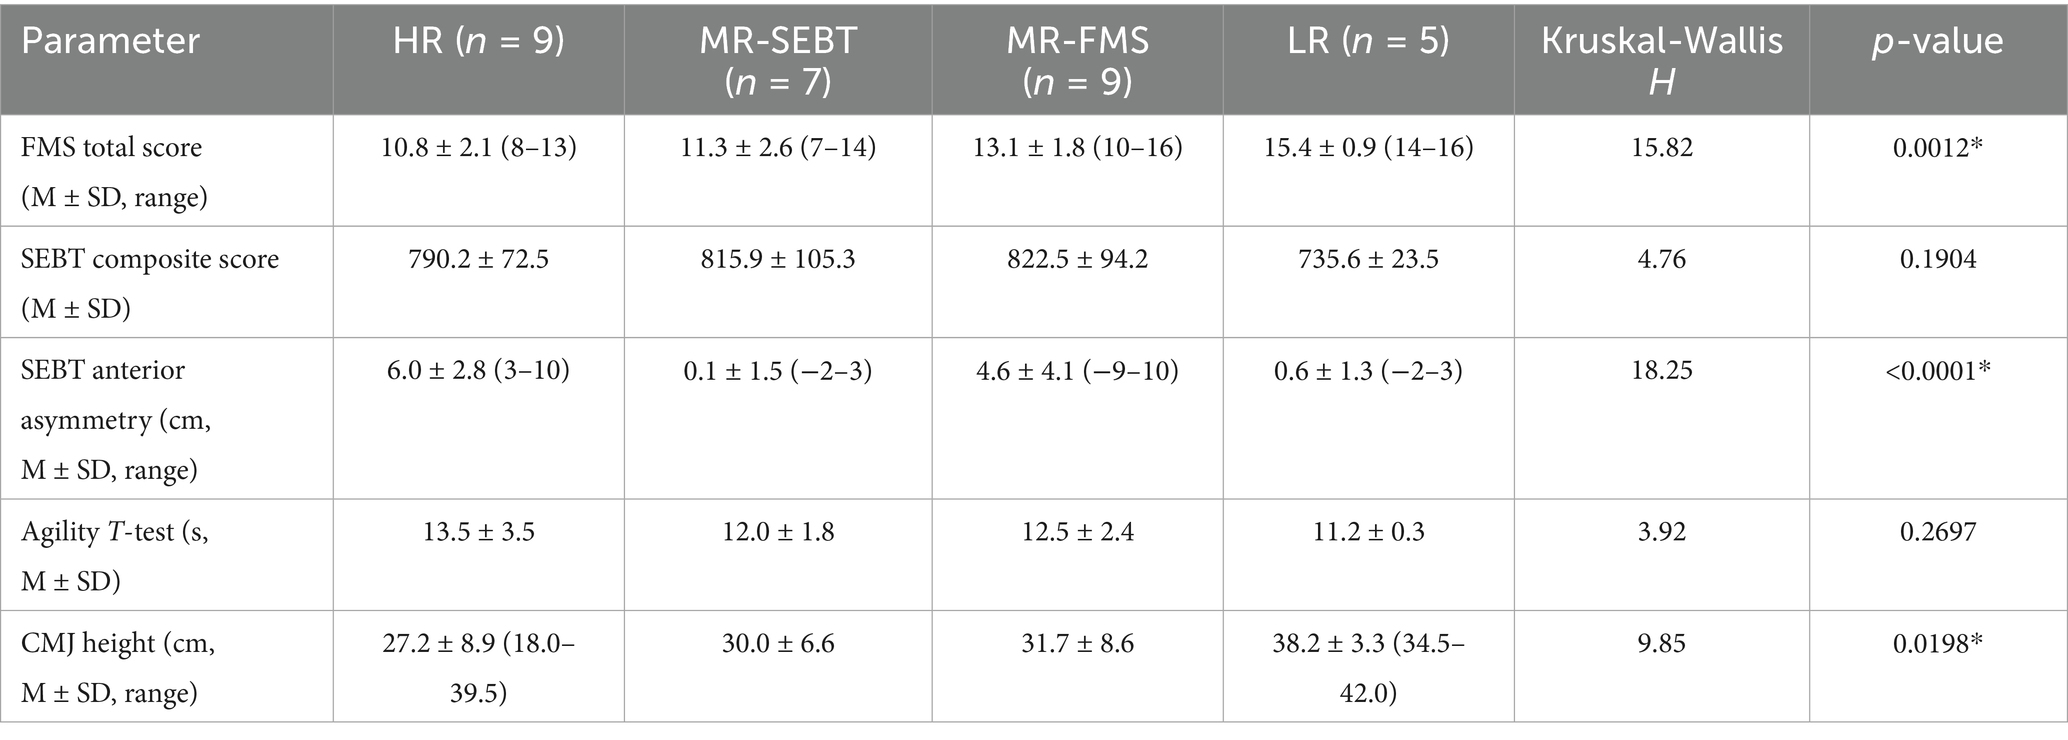
Table 2. Group comparisons of performance parameters across groups.
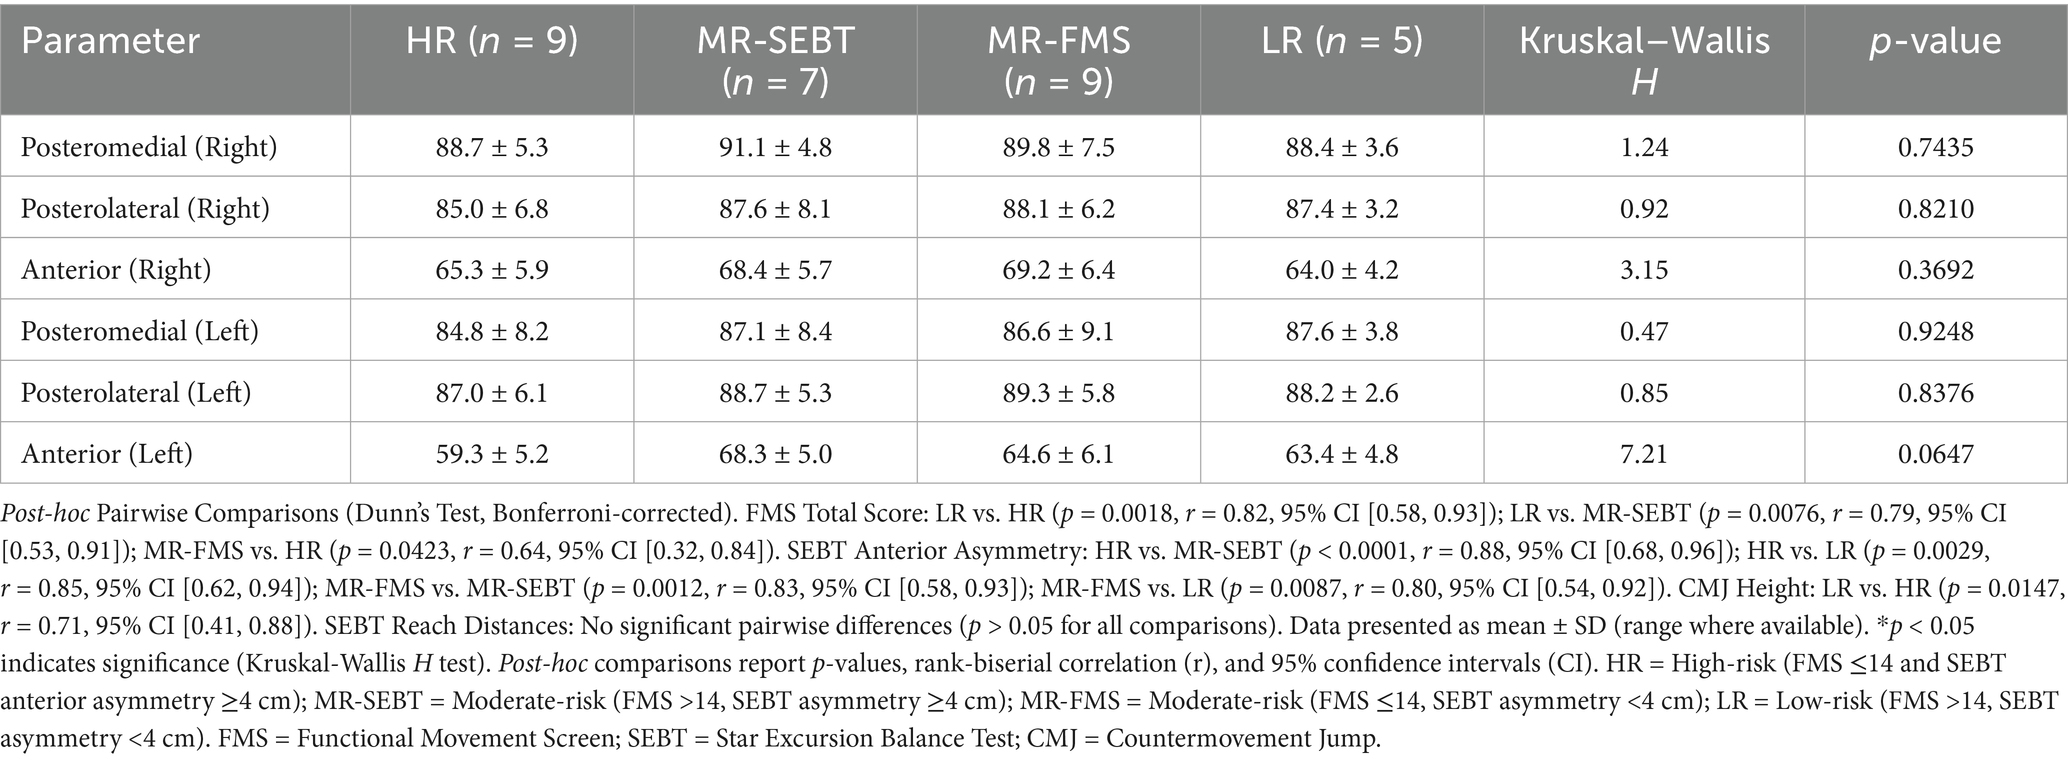
Table 3. Group comparisons of SEBT reach distances (cm, M ± SD) across groups.
3.2 Relationships between FMS and performance parameters
Spearman’s rank correlation analysis examined associations between FMS scores and performance parameters across all participants (n = 30) (Table 4). A moderate negative correlation was found between FMS scores and SEBT anterior asymmetry (r = −0.41, p = 0.0236, 95% CI [−0.67, −0.06]), indicating that poorer movement quality is associated with greater bilateral asymmetry. Moderate positive correlations were observed between FMS scores and anterior reach distances for the right leg (r = 0.37, p = 0.0418, 95% CI [0.01, 0.64]) and left leg (r = 0.45, p = 0.0124, 95% CI [0.11, 0.70]), indicating that individuals with higher FMS scores tend to have better anterior reach performance. The correlation between FMS scores and SEBT composite score was weak and non-significant (r = −0.32, p = 0.0847, 95% CI [−0.61, 0.04]), reflecting the multidimensional nature of balance capacity. No significant correlations were found for posteromedial (r = 0.12–0.18, p = 0.3421–0.5276) or posterolateral reach distances (r = 0.08–0.22, p = 0.2412–0.6789). Weak, non-significant correlations were observed between FMS scores and CMJ heights (r = 0.29, p = 0.1193, 95% CI [−0.08, 0.59]) and Agility T-Test times (r = −0.24, p = 0.1987, 95% CI [−0.56, 0.14]).
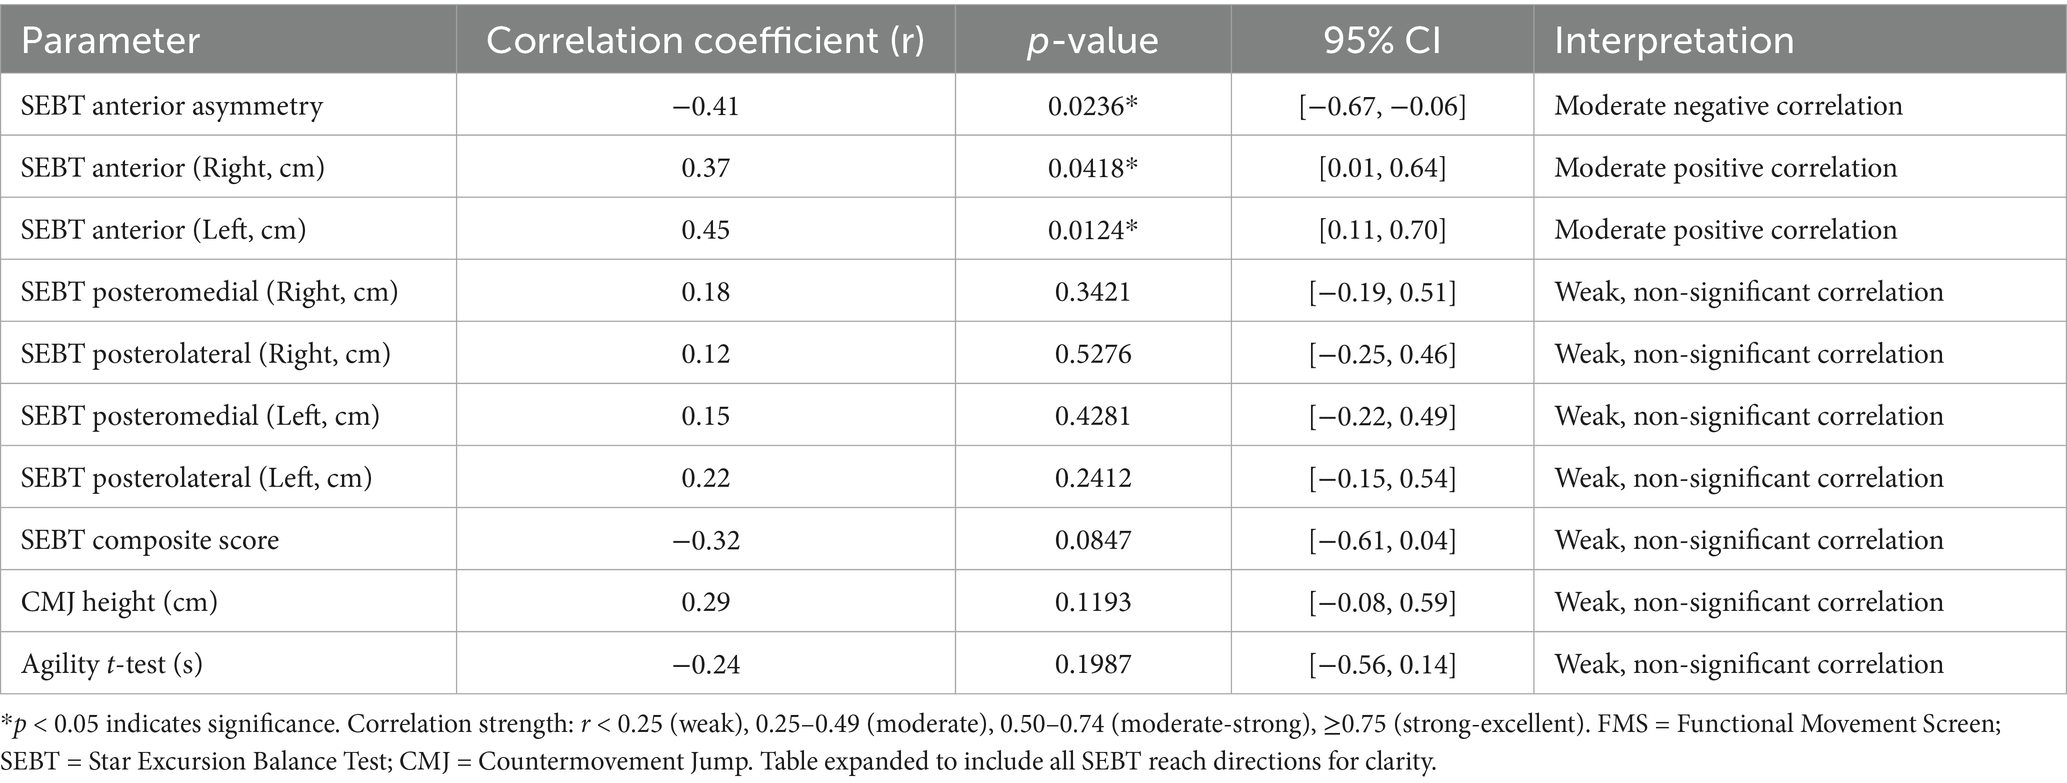
Table 4. Spearman’s rank correlations between FMS scores and performance parameters (n = 30).
3.3 High- vs. low-risk group comparisons
Participants were dichotomized into high-risk (FMS ≤ 14 and/or SEBT anterior asymmetry ≥4 cm, n = 18) and low-risk (FMS > 14 and SEBT asymmetry <4 cm, n = 12) groups for targeted analysis using the Mann–Whitney U test.
The low-risk group exhibited significantly higher CMJ heights (M = 35.6 ± 5.2 cm vs. M = 28.4 ± 7.8 cm, U = 48.0, p = 0.0021, rank-biserial r = 0.56, 95% CI [0.28, 0.76]) compared to the high-risk group. No significant differences were observed for SEBT composite scores (M = 804.3 ± 82.7 vs. M = 788.6 ± 89.4, U = 94.5, p = 0.2865, rank-biserial r = 0.13, 95% CI [−0.14, 0.39]) or Agility T-Test times (M = 12.2 ± 2.1 s vs. M = 12.7 ± 2.8 s, U = 102.0, p = 0.4147, rank-biserial r = 0.06, 95% CI [−0.21, 0.32]). Within the high-risk group, 83% of athletes with left anterior reach <65 cm and 78% with right anterior reach <68 cm were classified as high-risk [χ2(1) = 6.72, p = 0.0096 for left; χ2(1) = 5.89, p = 0.0152 for right], highlighting critical thresholds for injury susceptibility (Table 5).
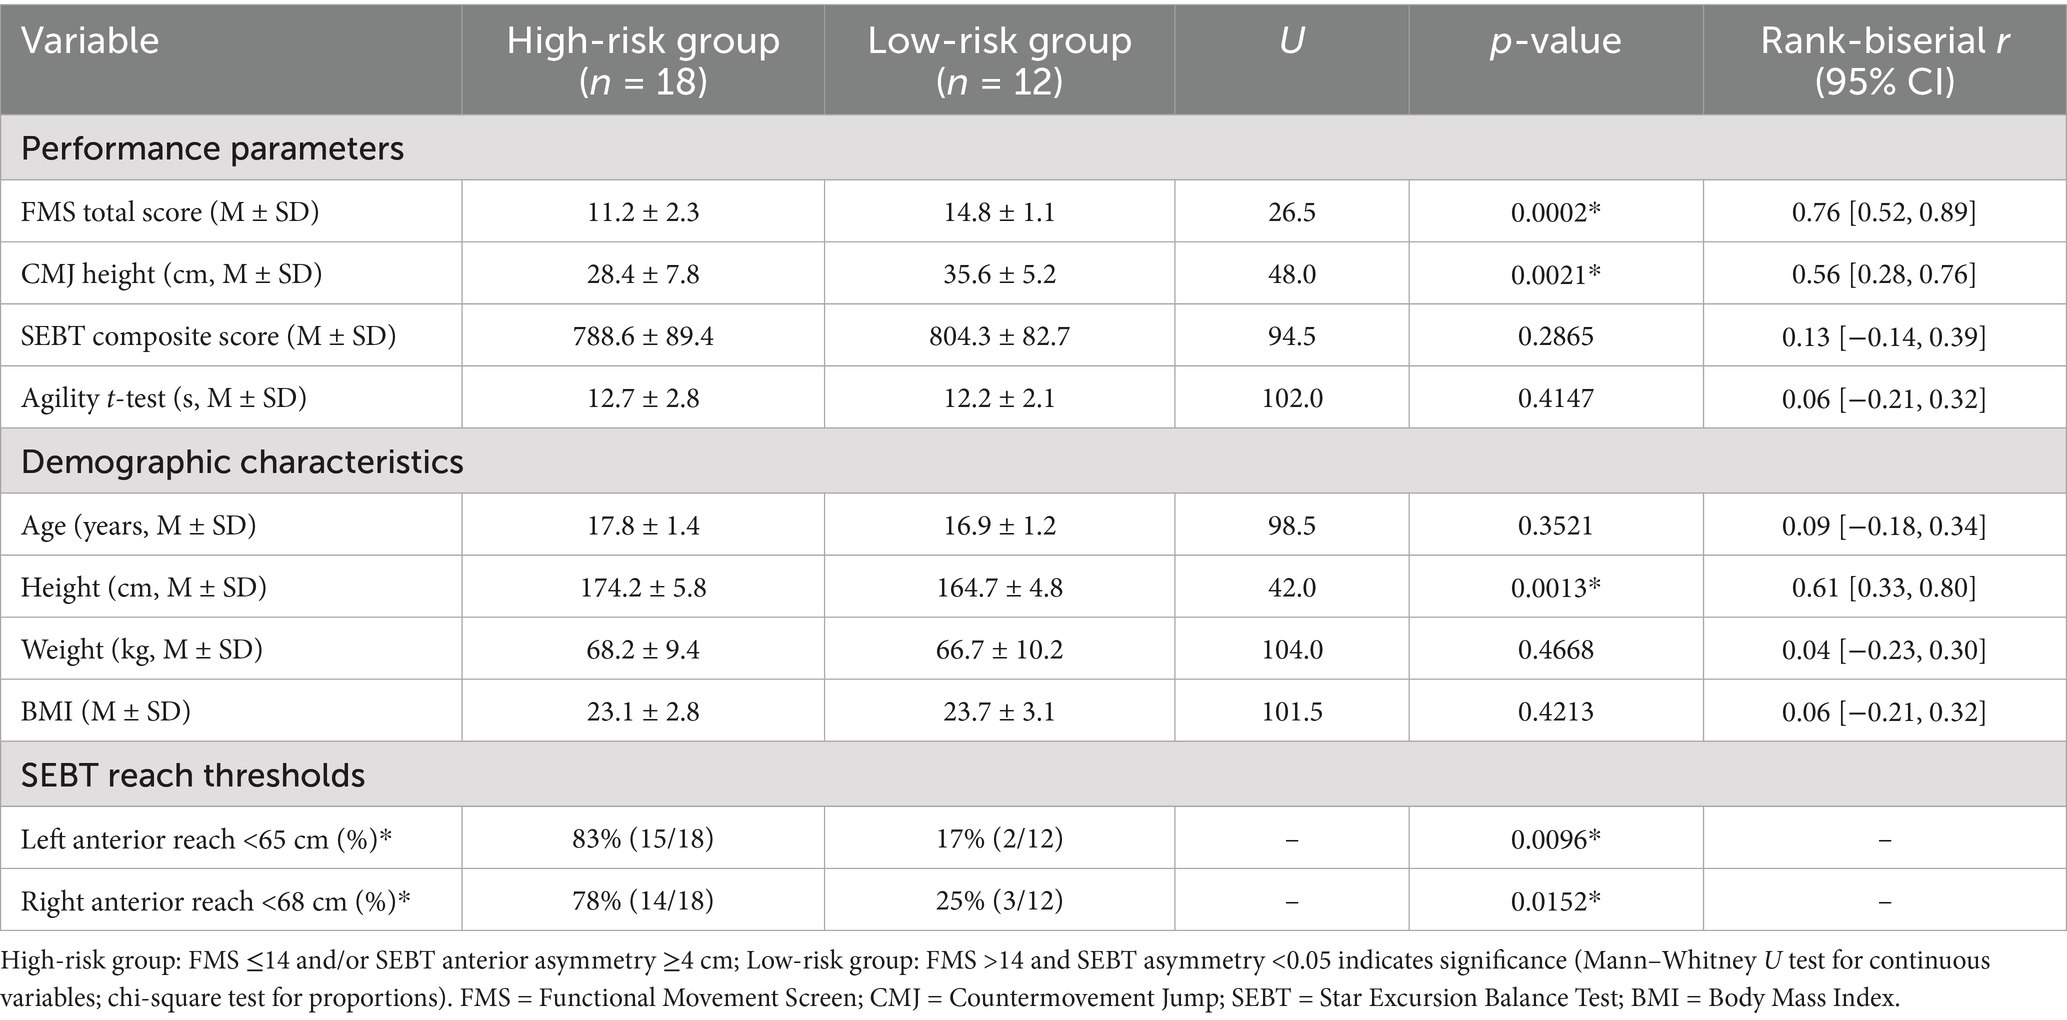
Table 5. High- vs. low-risk group comparisons of performance parameters and demographic characteristics.
Demographic comparisons between risk groups showed no significant differences in age (high-risk: M = 17.8 ± 1.4 years vs. low-risk: M = 16.9 ± 1.2 years, U = 98.5, p = 0.3521, rank-biserial r = 0.09), weight (M = 68.2 ± 9.4 kg vs. M = 66.7 ± 10.2 kg, U = 104.0, p = 0.4668, rank-biserial r = 0.04), or BMI (M = 23.1 ± 2.8 vs. M = 23.7 ± 3.1, U = 101.5, p = 0.4213, rank-biserial r = 0.06). However, the high-risk group was significantly taller (M = 174.2 ± 5.8 cm vs. M = 164.7 ± 4.8 cm, U = 42.0, p = 0.0013, rank-biserial r = 0.61, 95% CI [0.33, 0.80]), consistent with the taller statures of HR and MR-SEBT, suggesting a potential biomechanical influence on injury risk (Table 5).
3.4 Injury risk prediction and clinical thresholds
Logistic regression analyses quantified injury risk associations (Table 6). Athletes with FMS scores ≤14 and CMJ heights <30 cm exhibited a 4.2-fold increased injury risk (odds ratio [OR] = 4.20, 95% CI [1.32, 13.76], p = 0.0158). SEBT anterior asymmetry ≥4 cm combined with FMS ≤ 14 was associated with a 3.8-fold increased risk (OR = 3.82, 95% CI [1.14, 12.89], p = 0.0302). Mean anterior asymmetry in the high-risk group was 4.2 cm (SD = 3.4) compared to 1.8 cm (SD = 1.5) in the low-risk group (U = 54.0, p = 0.0238, rank-biserial r = 0.50, 95% CI [0.22, 0.71]). Receiver Operating Characteristic (ROC) analysis identified optimal cut-offs: FMS ≤ 14 (sensitivity = 0.78, specificity = 0.83, AUC = 0.81, p = 0.0021) and SEBT anterior asymmetry ≥4 cm (sensitivity = 0.67, specificity = 0.75, AUC = 0.76, p = 0.0083) were robust predictors. Combined use of FMS and SEBT asymmetry enhanced predictive accuracy (AUC = 0.89, p < 0.0001), with a positive predictive value (PPV) of 0.85 for identifying high-risk athletes.
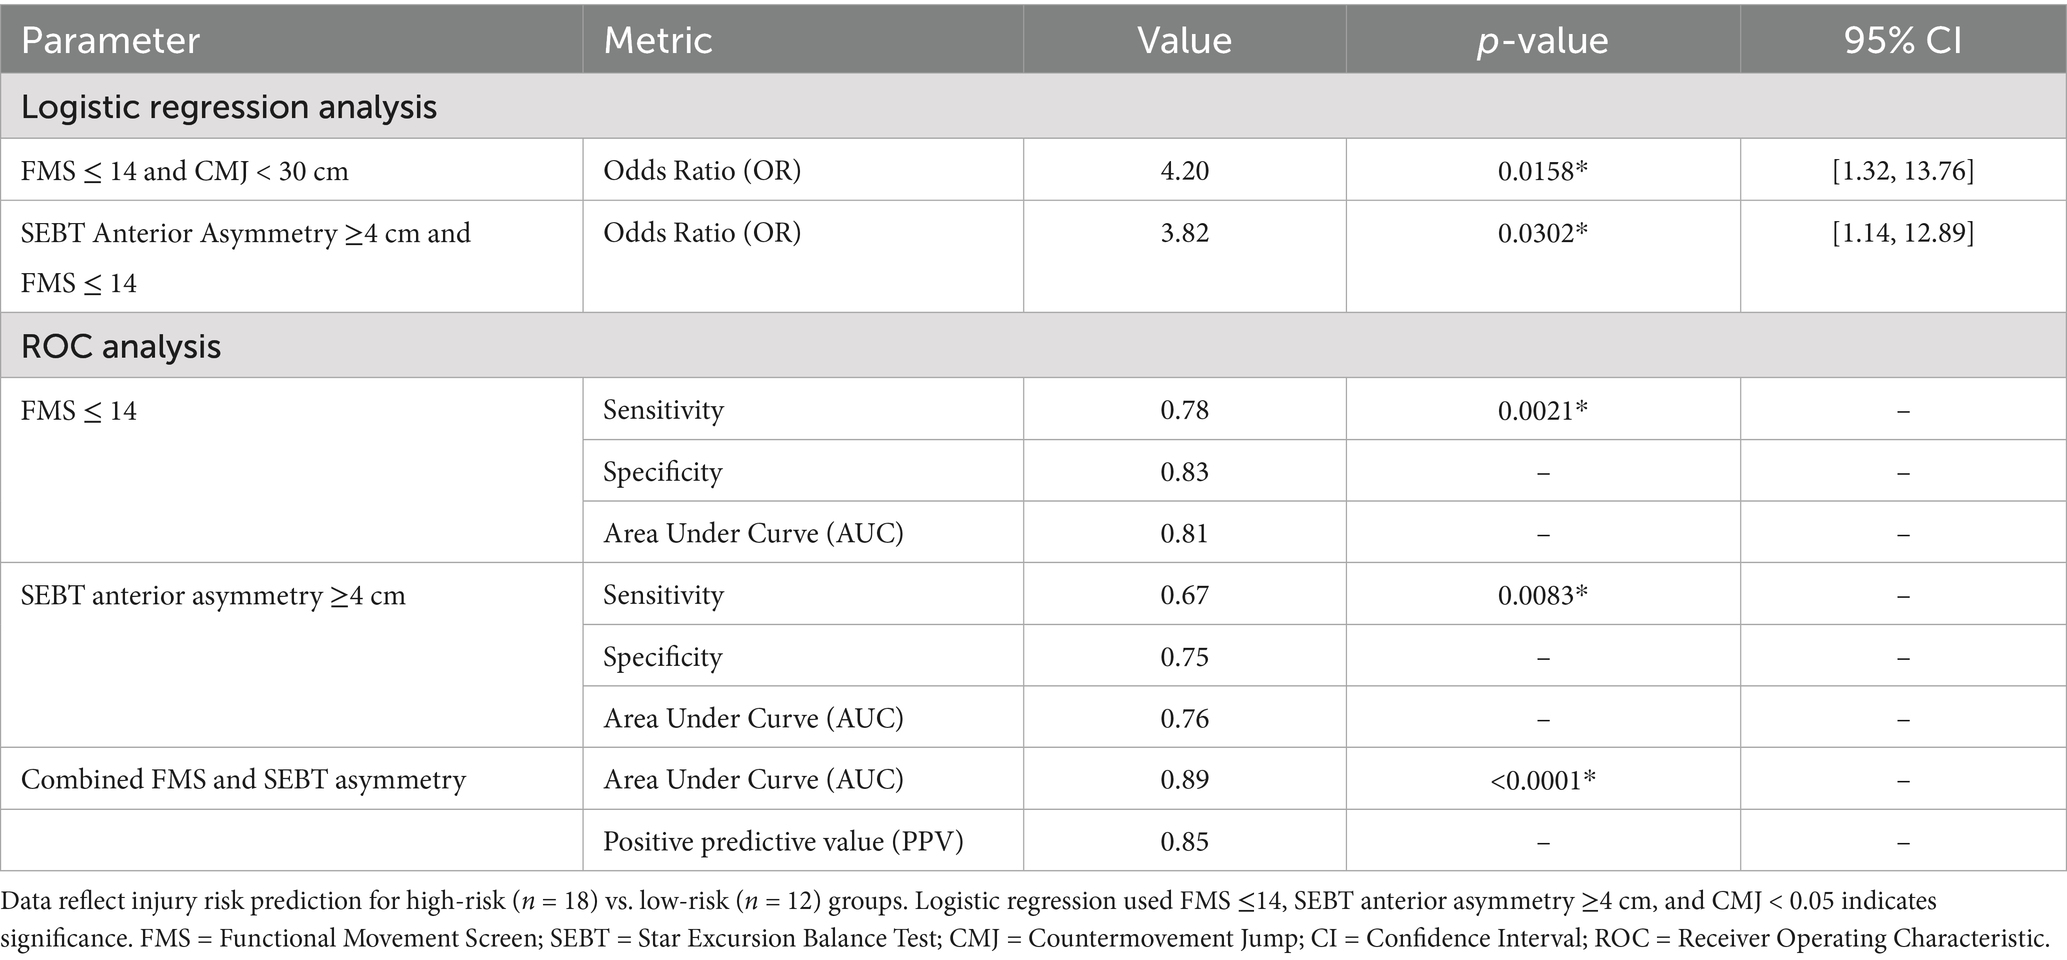
Table 6. Injury risk prediction and clinical thresholds.
3.5 Subgroup analytical insights
HR exhibited the lowest CMJ performance (M = 27.2 ± 8.9 cm) and highest anterior asymmetry (M = 6.0 ± 2.8 cm), indicating a compounded risk profile driven by poor movement quality and power deficits. LR demonstrated superior movement quality (FMS M = 15.4 ± 0.9) and power output (CMJ M = 38.2 ± 3.3 cm), with minimal asymmetry (M = 0.6 ± 1.3 cm), suggesting a protective biomechanical profile. Each 1-unit increase in FMS score was associated with a 0.37 cm increase in right anterior reach and a 0.45 cm increase in left anterior reach, underscoring the linkage between functional movement and dynamic balance. The consistent right-side dominance (2.3–4.1 cm greater reach) across groups reflects volleyball-specific adaptations, likely from repetitive dominant-leg loading. The non-significant SEBT composite score differences (p = 0.1904) highlight that anterior asymmetry, rather than overall balance, is a key risk indicator. The taller stature of high-risk groups (HR and MR-SEBT) may exacerbate asymmetry due to altered biomechanics (e.g., higher center of mass), warranting further exploration (Tables 7, 8).
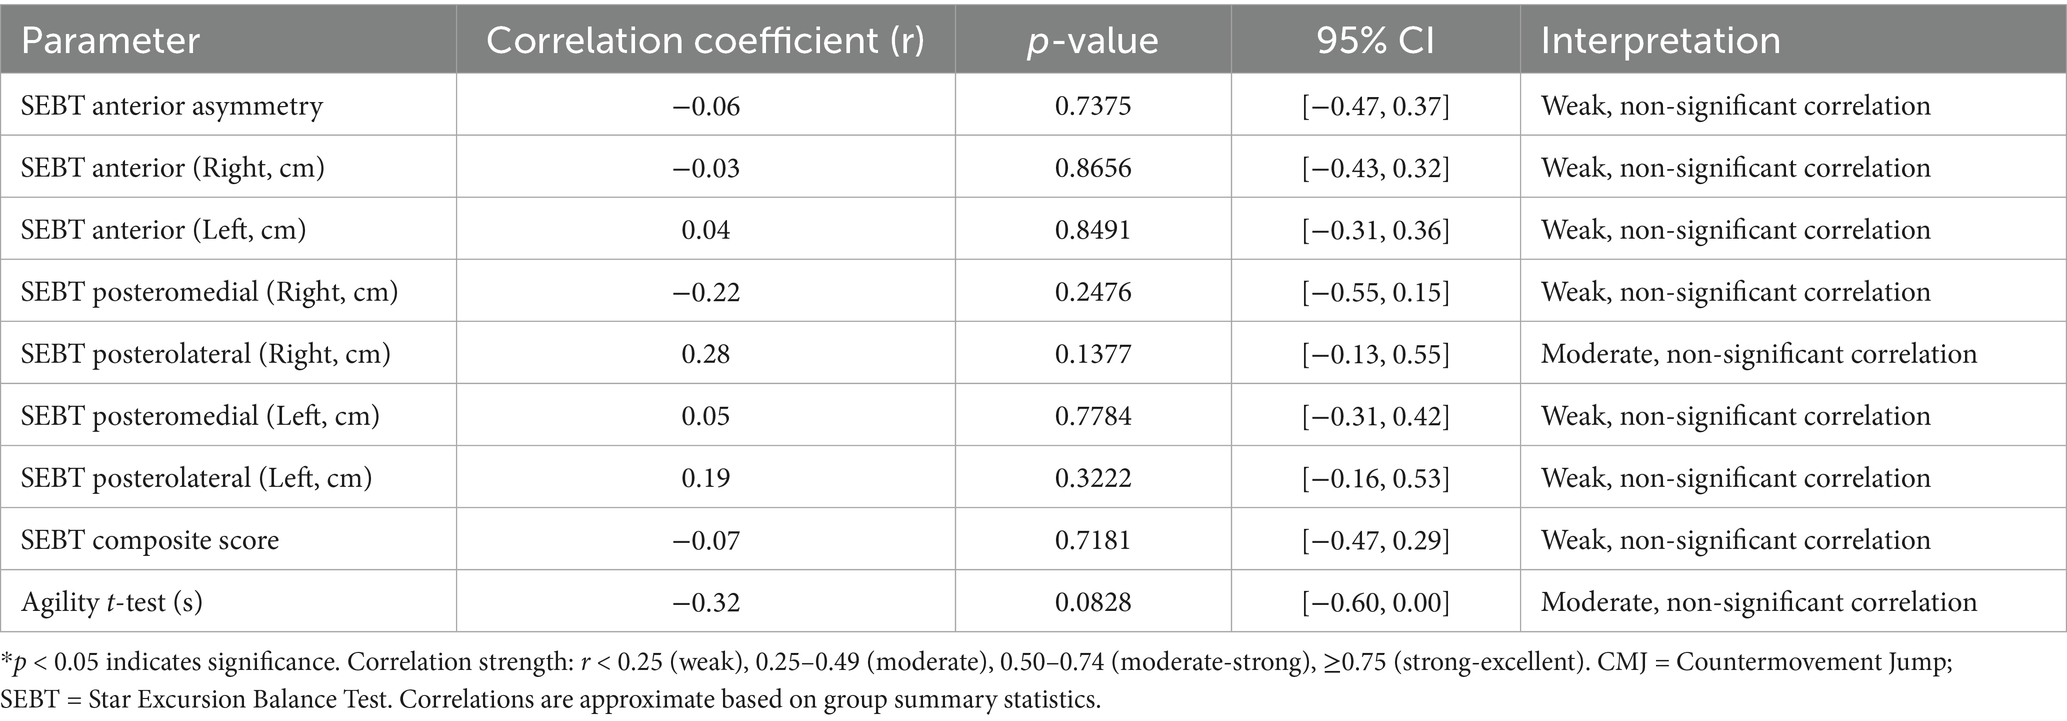
Table 7. Spearman’s rank correlations between CMJ height and performance parameters (n = 30).
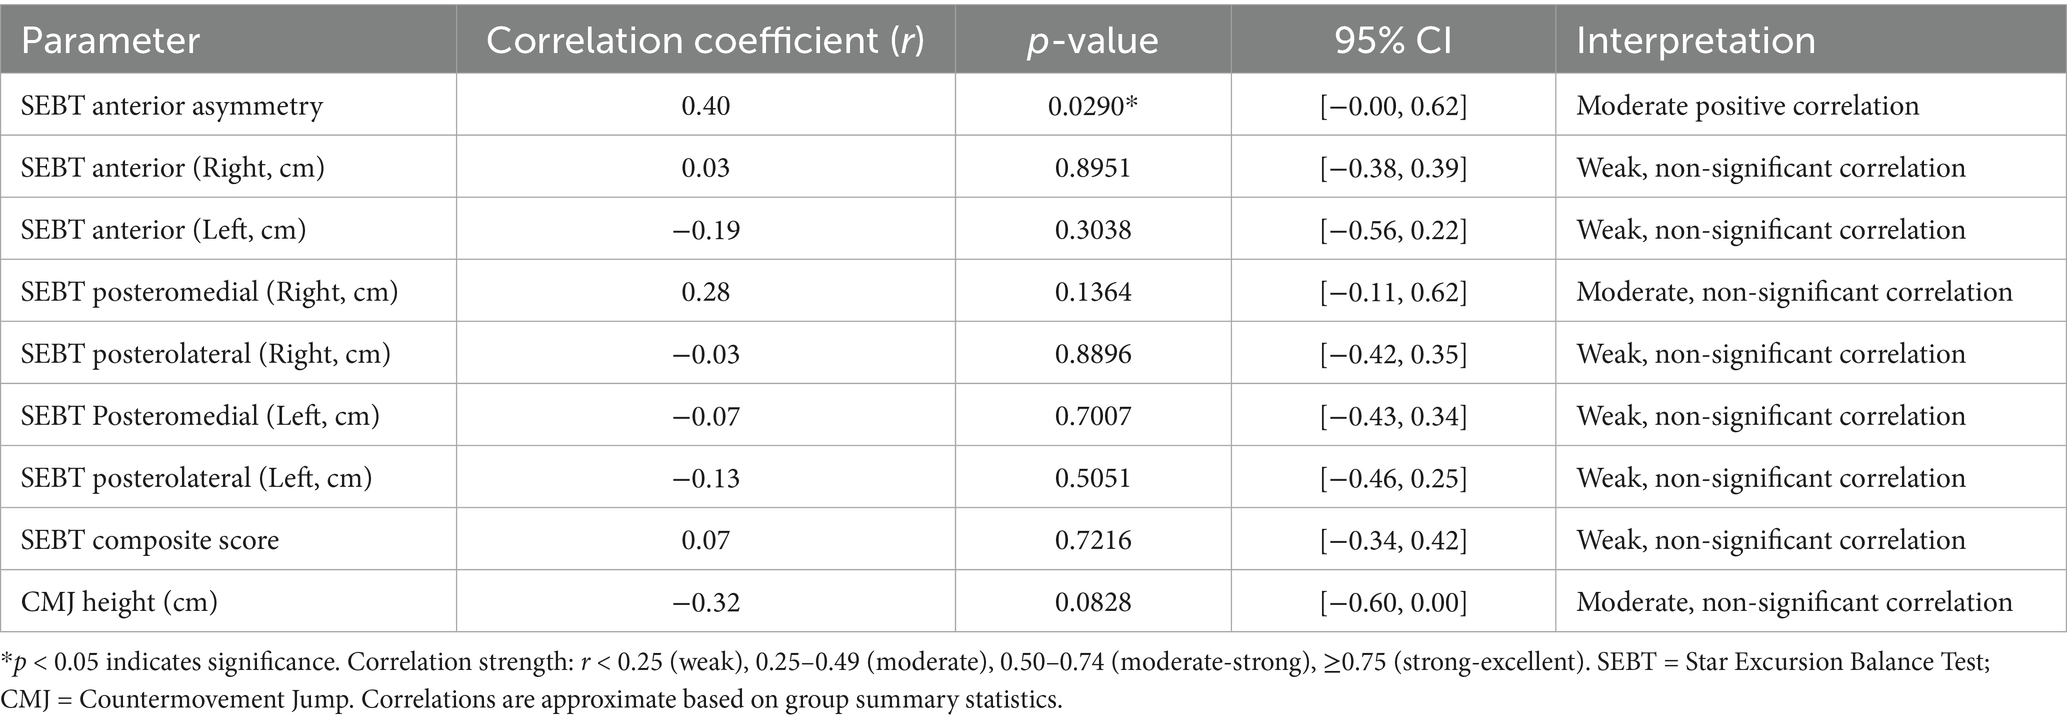
Table 8. Spearman’s rank correlations between agility t-test and performance parameters (n = 30).
4 Discussion
This pilot study investigated associations between Functional Movement Screen (FMS) scores, Star Excursion Balance Test (SEBT) parameters, Agility T-Test times, and Countermovement Jump (CMJ) heights with injury risk profiles in young female volleyball players, suggesting that lower FMS scores, greater SEBT anterior asymmetry, and decreased CMJ heights may be linked to higher perceived injury risk. Demographic comparisons revealed significant height differences across groups, with high-risk (HR) and moderate-risk SEBT (MR-SEBT) groups being taller than moderate-risk FMS (MR-FMS) and low-risk (LR) groups, potentially due to biomechanical factors such as a higher center of mass leading to increased joint torque and instability during dynamic movements like jumping and landing, which are prevalent in volleyball (31). This aligns with prior research indicating that taller athletes may experience greater lever arm forces, exacerbating asymmetry and injury susceptibility in sports requiring explosive actions (32). No significant differences in age, weight, or BMI suggest that height acts as a primary modifier, possibly influenced by growth-related imbalances in young females during puberty, where rapid height increases outpace muscle adaptation (33). Clinically, this underscores the importance of tailored screening for taller players, incorporating height-normalized performance metrics to identify and mitigate risks through targeted strengthening programs focused on core and lower limb stability.
Group comparisons of performance parameters showed significant differences in FMS scores, SEBT anterior asymmetry, and CMJ heights across the four risk groups, with the LR group demonstrating superior outcomes compared to HR and moderate-risk groups, likely because higher FMS reflects better overall movement quality that supports efficient kinetic chain function, while reduced asymmetry and higher CMJ indicate enhanced neuromuscular control and power absorption capabilities that protect against overload during volleyball-specific tasks (33, 34). No differences were found in SEBT composite scores, Agility T-Test times, or individual reach distances beyond anterior asymmetry, suggesting that global balance may be preserved, but directional asymmetries—particularly anterior—arise from sport-induced adaptations like repetitive dominant-leg loading, which could explain the consistent right-side dominance observed, as volleyball players often favor their dominant side for spiking and blocking, leading to uneven development over time (35). These results highlight how compounded deficits in high-risk profiles may stem from inadequate compensatory mechanisms, increasing vulnerability through cumulative micro-trauma (36). From a clinical perspective, stratifying athletes into these risk groups during pre-season assessments can guide personalized interventions, such as corrective exercises focusing on asymmetry reduction to enhance overall performance and prevent injuries by promoting bilateral equity.
Spearman’s rank correlations revealed a moderate negative association between FMS scores and SEBT anterior asymmetry, alongside moderate positive correlations with anterior reach distances on both legs, indicating that poorer movement quality disrupts bilateral symmetry and limits reach in the anterior direction, which demands greater ankle dorsiflexion and hip flexion—areas often compromised in athletes with functional limitations—while weak or non-significant correlations with other directions and composite scores suggest that posteromedial and posterolateral reaches rely more on different stabilizers like the gluteus medius, less directly tied to FMS components (37). This specificity may result from volleyball’s emphasis on forward movements, where anterior deficits manifest more prominently due to cumulative fatigue or inadequate core stability, potentially exacerbated by training regimens that overlook foundational movement patterns (11). Clinically, these findings advocate for integrating FMS and SEBT in routine evaluations, with emphasis on anterior-focused drills like lunges and plyometrics to improve symmetry and reach, potentially lowering injury rates through enhanced dynamic stability and better neuromuscular coordination.
Additional correlations explored between CMJ height and other parameters showed mostly weak, non-significant relationships, such as with SEBT asymmetry and reaches, possibly because CMJ primarily assesses vertical power output, which may not directly overlap with the horizontal balance demands of SEBT, though the moderate non-significant negative correlation with Agility T-Test times hints at how better explosive power could facilitate quicker directional changes; conversely, Agility T-Test times exhibited a moderate positive correlation with SEBT anterior asymmetry, implying that greater asymmetry impairs agility by hindering efficient force transfer and increasing compensatory efforts, a common issue in asymmetrical sports like volleyball where uneven loading affects speed and precision (16). These patterns could arise from underlying neuromuscular inefficiencies, where asymmetry disrupts optimal movement patterns, leading to slower response times and higher energy expenditure during multidirectional tasks (38). In clinical practice, this supports combining agility training with balance exercises, such as unilateral hops, to address asymmetry and boost CMJ consistency, thereby optimizing athletic performance and reducing overload risks associated with poor power distribution.
High- versus low-risk group analyses confirmed significant differences in CMJ heights and height, with the high-risk group showing lower CMJ and taller statures, alongside thresholds like left anterior reach <65 cm and right <68 cm being more prevalent in high-risk athletes, attributable to how reduced power (low CMJ) fails to absorb landing forces effectively, compounded by taller individuals’ higher inertial demands that amplify asymmetry and joint stress (39). No differences in SEBT composite or agility times suggest these metrics capture overall function but miss nuanced risks, while demographic similarities in age, weight, and BMI indicate height as a key modifier, perhaps linked to biomechanical disadvantages in taller young females who may have less mature motor control (9). Clinically, applying these thresholds in screening protocols can facilitate early identification of at-risk athletes, recommending height-adjusted training regimens like progressive jump programs to build resilience and symmetry, ultimately supporting safer long-term participation.
Logistic regression and ROC analyses demonstrated that combinations like FMS ≤ 14 with CMJ < 30 cm or SEBT asymmetry ≥4 cm yielded elevated odds ratios and high AUC (0.89), reflecting synergistic predictive power where multiple deficits compound risk, likely because they collectively impair neuromuscular coordination essential for volleyball’s high-impact nature (40). This enhanced accuracy stems from capturing multifaceted aspects of movement, balance, and power, which isolated metrics might overlook, especially in a sport with repetitive overhead and jumping demands that exploit weaknesses over time (41, 42). For clinical application, adopting these combined thresholds in multidisciplinary assessments can inform proactive strategies, including neuromuscular training protocols to elevate FMS and CMJ while minimizing asymmetry, ultimately fostering safer participation.
4.1 Limitations and future directions
The small sample size (n = 30) limits generalizability, an effect that is even greater when participants are divided into subgroups of 5–9 individuals per risk category, potentially reducing statistical power and increasing the risk of Type II errors in group-specific analyses. Additionally, the age range discrepancy slightly exceeds the intended inclusion criteria, further constraining broader applicability. The cross-sectional design precludes establishing causality, and the absence of injury incidence data weakens predictive validation. Potential hormonal influences on taller athletes were not assessed (33). Future research should employ larger, longitudinal cohorts with motion capture and hormonal profiling to explore height’s biomechanical role and sex-specific risk factors.
5 Conclusion
This study suggests FMS scores, SEBT anterior asymmetry, and CMJ heights as potential indicators of injury risk profiles in young female volleyball players, with thresholds (FMS ≤ 14, SEBT asymmetry ≥4 cm, CMJ < 30 cm) showing promising discriminatory ability (AUC = 0.89). The findings highlight the possible protective role of movement quality and power, potentially exacerbated by height-related biomechanical risks, offering a foundation for targeted screening and intervention programs. Clinically, implementing FMS-based training and unilateral exercises may help mitigate risks, while public health strategies should prioritize equitable access to these tools, particularly in underserved communities. Future longitudinal studies are essential to confirm causality and refine prevention protocols, aligning with global health objectives to promote active, healthy youth (43).
Data availability statement
The raw data supporting the conclusions of this article will be made available by the authors, without undue reservation.
Ethics statement
The studies involving humans were approved by Non-Invasive Clinical Research Ethics Committee of Pamukkale University, Denizli, Turkey, on February 20, 2025 (Decision No. E.658227). The studies were conducted in accordance with the local legislation and institutional requirements. Written informed consent for participation in this study was provided by the participants’ legal guardians/next of kin.
Author contributions
ME: Methodology, Conceptualization, Project administration, Visualization, Investigation, Validation, Funding acquisition, Formal analysis, Writing – original draft, Supervision, Data curation, Resources, Writing – review & editing, Software. FG: Resources, Funding acquisition, Writing – review & editing, Visualization, Formal analysis, Software, Writing – original draft, Methodology, Validation, Conceptualization, Data curation, Supervision, Project administration, Investigation. SS: Investigation, Visualization, Conceptualization, Funding acquisition, Validation, Formal analysis, Software, Writing – review & editing, Supervision, Resources, Data curation, Methodology, Project administration, Writing – original draft. GA: Formal analysis, Data curation, Writing – review & editing, Project administration, Writing – original draft, Validation, Methodology, Investigation, Visualization, Funding acquisition, Supervision, Conceptualization, Resources, Software. GC: Supervision, Writing – original draft, Formal analysis, Resources, Writing – review & editing, Project administration, Data curation, Software, Visualization, Investigation, Conceptualization, Validation, Funding acquisition, Methodology. MU: Funding acquisition, Writing – original draft, Formal analysis, Software, Supervision, Visualization, Project administration, Resources, Methodology, Investigation, Validation, Writing – review & editing, Data curation, Conceptualization. CS: Formal analysis, Data curation, Visualization, Resources, Validation, Project administration, Investigation, Writing – review & editing, Methodology, Software, Supervision, Funding acquisition, Writing – original draft, Conceptualization.
Funding
The author(s) declare that no financial support was received for the research and/or publication of this article.
Conflict of interest
The authors declare that the research was conducted in the absence of any commercial or financial relationships that could be construed as a potential conflict of interest.
Generative AI statement
The authors declare that no Gen AI was used in the creation of this manuscript.
Any alternative text (alt text) provided alongside figures in this article has been generated by Frontiers with the support of artificial intelligence and reasonable efforts have been made to ensure accuracy, including review by the authors wherever possible. If you identify any issues, please contact us.
Publisher’s note
All claims expressed in this article are solely those of the authors and do not necessarily represent those of their affiliated organizations, or those of the publisher, the editors and the reviewers. Any product that may be evaluated in this article, or claim that may be made by its manufacturer, is not guaranteed or endorsed by the publisher.
References
1. Jayanthi, N, Pinkham, C, Dugas, L, Patrick, B, and LaBella, C. Sports specialization in young athletes: evidence-based recommendations. Sports Health. (2015) 5:251–7. doi: 10.1177/1941738112464626
2. Read, PJ, Oliver, JL, De Ste Croix, MB, Myer, GD, and Lloyd, RS. Neuromuscular risk factors for knee and ankle ligament injuries in male youth soccer players. Sports Med. (2019) 49:219–36. doi: 10.1007/s40279-018-1003-1
3. Verhagen, EA, Van der Beek, AJ, Bouter, LM, Bahr, RM, and Van Mechelen, W. A one season prospective cohort study of volleyball injuries. Br J Sports Med. (2004) 38:477–81. doi: 10.1136/bjsm.2003.005785
4. Zarei, M, Norasteh, AA, and Asadi, A. Prevalence and risk factors of musculoskeletal injuries among elite volleyball players. Int J Sports Med. (2020) 41:845–52. doi: 10.1055/a-1182-3456
5. Neilsen, RO, Parner, ET, Nohr, EA, and Sørensen, H. Excessive progression in weekly running distance and risk of running-related injuries: an association which varies according to type of injury. J Orthop Sports Phys Ther. (2020) 50:563–71. doi: 10.2519/jospt.2020.9400
6. Bere, T, Mok, KM, Krosshaug, T, and Bahr, R. A systematic video analysis of injuries in professional volleyball: mechanisms and prevention strategies. Scand J Med Sci Sports. (2023) 33:456–65. doi: 10.1111/sms.14289
7. Bahr, R, Clarsen, B, Derman, W, Dvorak, J, Emery, CA, Finch, CF, et al. International Olympic Committee consensus statement: methods for recording and reporting of epidemiological data on injury and illness in sport 2020 (including STROBE extension for sport injury and illness surveillance [STROBE-SIIS]). Br J Sports Med. (2020) 54:372–89. doi: 10.1136/bjsports-2019-101969
8. Linek, P, Saulicz, E, Kuszewski, M, and Wolny, T. Predictive value of the functional movement screen for injury in athletes: a systematic review. J Strength Cond Res. (2016) 30:2330–7. doi: 10.1519/JSC.0000000000001318
9. Wu, G, Liu, Y, and Zhang, L. Limb dominance and injury risk in volleyball: a biomechanical analysis. J Biomech. (2023) 150:111498. doi: 10.1016/j.jbiomech.2023.111498
10. Armstrong, R, and Greig, M. The functional movement screen and T-test: a battery for assessing movement and agility in team sports. J Sports Sci. (2018) 36:1699–705. doi: 10.1080/02640414.2017.1413643
11. Chang, WD, Chou, LW, and Lu, YC. Functional movement screen as a predictor of sports injury risk in adolescent athletes. J Athl Train. (2020) 55:245–51. doi: 10.4085/1062-6050-44-19
12. Chimera, NJ, Warren, M, and Smith, CA. The star excursion balance test as a measure of lower extremity performance and injury risk. J Orthop Sports Phys Ther. (2015) 45:428–35. doi: 10.2519/jospt.2015.5404
13. Caswell, SV, Cortes, N, Chinn, L, and Keene, K. The relationship between agility and injury risk in adolescent American football players: a multivariate analysis. J Athl Train. (2016) 51:718–24. doi: 10.4085/1062-6050-51.9.04
14. Larruskain, G, Lekue, JA, Diaz, N, Odriozola, A, and Gil, SM. Functional movement screen (FMS) as a predictor of injuries in young volleyball players: a prospective cohort study. Int J Sports Med. (2022) 44:197–204. doi: 10.1055/a-1963-7426
15. Lee, BC, and McGill, SM. The effect of short-term isometric training on core/torso stiffness. J Strength Cond Res. (2020) 34:1519–26. doi: 10.1519/JSC.0000000000003609
16. Smith, RL, McGuine, TA, and Brooks, MA. Agility deficits as injury predictors in adolescent athletes. Clin J Sport Med. (2023) 33:134–40. doi: 10.1097/JSM.0000000000001089
17. Warren, M, Smith, CA, and Chimera, NJ. Composite functional movement screen score predicts injuries in youth volleyball players: a prospective cohort study. J Sport Rehabil. (2015) 24:163–70. doi: 10.1123/jsr.2013-0141
18. von Elm, E, Altman, DG, Egger, M, Pocock, SJ, Gøtzsche, PC, Vandenbroucke, JP, et al. The strengthening the reporting of observational studies in epidemiology (STROBE) statement: guidelines for reporting observational studies. Lancet. (2007) 370:1453–7. doi: 10.1016/S0140-6736(07)61602-X
19. World Medical Association. World medical association declaration of Helsinki: ethical principles for medical research involving human subjects. JAMA. (2013) 310:2191–4. doi: 10.1001/jama.2013.281053
20. Drust, B, Waterhouse, J, Atkinson, G, Edwards, B, and Reilly, T. Circadian rhythms in sports performance—an update. Chronobiol Int. (2005) 22:21–44. doi: 10.1081/CBI-200041039
21. Cook, G, Burton, L, Hoogenboom, BJ, and Voight, M. Functional movement screening: the use of fundamental movements as an assessment of function—part 1. Int J Sports Phys Ther. (2014) 9:396–409.
22. Minick, KI, Kiesel, KB, Burton, L, Taylor, A, Plisky, P, and Butler, RJ. Interrater reliability of the functional movement screen. J Strength Cond Res. (2010) 24:479–86. doi: 10.1519/JSC.0b013e3181c09c04
23. Bishop, D. Warm up I: potential mechanisms and the effects of passive warm up on exercise performance. Sports Med. (2003) 33:439–54. doi: 10.2165/00007256-200333070-00005
24. Gribble, PA, Hertel, J, and Plisky, P. Using the star excursion balance test to assess dynamic postural-control deficits and outcomes in lower extremity injury: a literature and systematic review. J Athl Train. (2012) 47:339–57. doi: 10.4085/1062-6050-47.3.08
25. Plisky, PJ, Rauh, MJ, Kaminski, TW, and Underwood, FB. Star excursion balance test as a predictor of lower extremity injury in high school basketball players. J Orthop Sports Phys Ther. (2006) 36:911–9. doi: 10.2519/jospt.2006.2244
26. Balsalobre-Fernández, C, Glaister, M, and Lockey, R. The validity and reliability of an iPhone app for measuring vertical jump performance. J Sports Sci. (2015) 33:1574–9. doi: 10.1080/02640414.2014.996184
27. Pueo, B, Penichet-Tomas, A, and Jimenez-Olmedo, JM. Reliability and validity of the Chronojump open-source jump mat system. Biol Sport. (2020) 37:255–9. doi: 10.5114/biolsport.2020.95636
28. Markovic, G, Dizdar, D, Jukic, I, and Cardinale, M. Reliability and factorial validity of squat and countermovement jump tests. J Strength Cond Res. (2004) 18:551–5. doi: 10.1519/1533-4287(2004)18
29. Pauole, K, Madole, K, Garhammer, J, Lacourse, M, and Rozenek, R. Reliability and validity of the T-test as a measure of agility, leg power, and leg speed in college-aged men and women. J Strength Cond Res. (2000) 14:443–50. doi: 10.1519/1533-4287(2000)014<>2.0.CO;2
30. Sporis, G, Jukic, I, Milanovic, L, and Vucetic, V. Reliability and factorial validity of agility tests for soccer players. J Strength Cond Res. (2010) 24:679–86. doi: 10.1519/JSC.0b013e3181c4d324
31. Hewett, TE, Ford, KR, and Myer, GD. Biomechanical factors in youth sports injuries: a review. Am J Sports Med. (2021) 49:3456–65. doi: 10.1177/03635465211030567
32. Ulman, S, Erdman, A, Loewen, A, Dressing, M, Wyatt, C, Oliver, G, et al. Concurrent validity of movement screening criteria designed to identify injury risk factors in adolescent female volleyball players. Front Sports Active Living. (2022) 4:915230. doi: 10.3389/fspor.2022.915230
33. Myer, GD, Sugimoto, D, and Stracciolini, A. Hormonal influences on injury risk in female adolescent athletes: a contemporary review. J Pediatr Orthop. (2023) 43:289–96. doi: 10.1097/BPO.0000000000002389
34. Read, PJ, Oliver, JL, and Myer, GD. Neuromuscular training and injury prevention in youth athletes. Sports Med. (2022) 52:611–23. doi: 10.1007/s40279-021-01587-8
35. Plisky, PJ, Rauh, MJ, and Cameron, KL. SEBT asymmetry and injury risk: updated evidence. J Sport Rehabil. (2020) 29:489–96. doi: 10.1123/jsr.2019-0123
36. Latifi, S, Kafshgar, Z, and Yousefi, A. Evaluation of hop tests based on Y-balance test and FMS test outcomes in volleyball and basketball players to identify those prone to injury: a potential predictor of injury. BMC Sports Sci Med Rehabil. (2024) 16:187. doi: 10.1186/s13102-024-00976-5
37. Gribble, PA, Hertel, J, and Plisky, P. Advances in dynamic balance assessment for injury prevention. J Orthop Sports Phys Ther. (2019) 49:401–9. doi: 10.2519/jospt.2019.0502
38. Markovic, G, Sarabon, N, and Mikulic, P. Explosive power and injury risk in adolescent athletes. Int J Sports Physiol Perform. (2021) 16:523–30. doi: 10.1123/ijspp.2020-0456
39. Hopper, A, Haff, EE, Barley, OR, Joyce, C, Lloyd, RS, and Haff, GG. Neuromuscular training improves movement competency and physical performance measures in 11-13-year-old female netball athletes. J Strength Cond Res. (2017) 31:1165–76. doi: 10.1519/JSC.0000000000001794
40. Caswell, SV, Cortes, N, and Chinn, L. Predictive validity of functional movement screening in youth athletes. J Athl Train. (2019) 54:876–82. doi: 10.4085/1062-6050-44-18
41. Myer, GD, Faigenbaum, AD, and Edwards, NM. Neuromuscular training for injury prevention in youth sports. Pediatrics. (2020) 145:e20193542. doi: 10.1542/peds.2019-3542
42. Velarde-Sotres, A, Bores-Calle, A, and Mayordomo, R. Jump performance and injury risk in adolescent volleyball players. J Hum Kinet. (2023) 87:123–32. doi: 10.5114/jhk/162456
43. World Health Organization. Global action plan on physical activity 2018–2030: More active people for a healthier world. Geneva: WHO (2023).
44. Jandhyala, A, Elahi, J, Ganti, L, and McAuley, D. Volleyball Related Injuries in Adolescents: A Decade of Data. Orthop Rev (Pavia). (2024) 23:123665. doi: 10.52965/001c.123665
45. Hewett, TE, Myer, GD, Ford, KR, Heidt, RS, Colosimo, AJ, McLean, SG, et al. Biomechanical Measures of Neuromuscular Control and Valgus Loading of the Knee Predict Anterior Cruciate Ligament Injury Risk in Female Athletes: A Prospective Study. Am J Sports Med. (2005) 33:492–501. doi: 10.1177/0363546504269591
Keywords: injury prevention, volleyball, female athletes, functional movement screen, injury risk assessment
Citation: Erol M, Girginer FG, Seyhan S, Acar G, Cerit G, Uzun M and Soylu C (2025) Predicting injury risk in young female volleyball players through movement and jump assessments. Front. Public Health. 13:1658046. doi: 10.3389/fpubh.2025.1658046
Edited by:
Michał Nowak, Jan Długosz University, PolandReviewed by:
Ahmet Kurtoğlu, Bandirma Onyedi Eylül University, TürkiyeJacek Wąsik, Jan Długosz University, Poland
Jarosław Muracki, University of Szczecin, Poland
Copyright © 2025 Erol, Girginer, Seyhan, Acar, Cerit, Uzun and Soylu. This is an open-access article distributed under the terms of the Creative Commons Attribution License (CC BY). The use, distribution or reproduction in other forums is permitted, provided the original author(s) and the copyright owner(s) are credited and that the original publication in this journal is cited, in accordance with accepted academic practice. No use, distribution or reproduction is permitted which does not comply with these terms.
*Correspondence: Gorkem Acar, Z29ya2VtYWNhcjJAZ21haWwuY29t; Caglar Soylu, Y2FnbGFyLnNveWx1QHNidS5lZHUudHI=
†ORCID: Mustafa Erol, orcid.org/0000-0003-2361-6572
Fatma Gözlükaya Girginer, orcid.org/0000-0002-0211-6512
Sinan Seyhan, orcid.org/0000-0002-4979-7992
Görkem Acar, orcid.org/0000-0002-0970-8625
Günay Cerit, orcid.org/0000-0001-9151-4071
Meliha Uzun, orcid.org/0000-0002-1691-3504
Caglar Soylu, orcid.org/0000-0002-1524-6295