 Jeffrey Allen
 Charles Olomofe
 Shane Lehman
- 1Department of Public Health and Health Science, St. Bonaventure University, St. Bonaventure, NY, United States
- 2Department of Health, Physical and Secondary Education, Fayetteville State University, Fayetteville, NC, United States
College and university faculty and staff in the United States experience diabetes rates higher than the national average, elevated cholesterol levels, receive fewer than the recommended 7 h of sleep per night, and routinely experience overwhelming anxiety. In response, some universities have implemented top-down approaches to employee wellness but there is scant evidence of student-driven approaches to faculty and staff wellness. The current study examines improvement in faculty and staff participation consistency when enrolled in a fully student-developed, −implemented, and -evaluated 8-week health and wellness program. The 78 participants in the study were asked to complete both a pre- and post-intervention Likert scale questionnaire, which was assessed by independent T-tests. There was a statistically significant difference in mean of the participation of staff in the wellness program activities within the university and at local community activities pre- and post-challenge (Mean difference: −0.456, 95% CI: −0.882 – −0.048; p = 0.029). In a similar vein, there was a statistically significant difference between pre-intervention and post-intervention participation in nutritional programs at the university and the surrounding local community by staff and faculty (Mean difference: −0.472, 95% CI: −0.817 – −0.127; p = 0.008). This increased participation could be the result of nudging used throughout the intervention, which included weekly consistency reporting reminders, weekly newsletters, regular email promotions, mailbox stuffers, and personal reminders to participate. It is our belief that this nudging approach led to habituation of participation amongst faculty and staff members.
Introduction
National burden of disease
Some of the most prevalent chronic diseases in the United States include heart disease, diabetes, cancer, and stroke (1). Chronic disease is defined as conditions lasting more than one year that require regular medical care and affect the activities of daily living (2). Chronic diseases are often the result of poor health behaviors, exacerbating health conditions, and endemic socioeconomic and environmental effects. Some of these health behaviors and conditions include limited physical activity, poor nutritional habits and dietary intake, smoking, sedentary lifestyles, consumption of alcoholic beverages, and economic stressors (3). University faculty and staff are far from immune from these health behaviors and structural conditions that result in chronic diseases from preventable causes.
Faculty and staff burden of disease
The 2023 American College Association-National Faculty and Staff Health Assessment (ACHA-NFSFA) report reveals that faculty and staff from colleges and universities across the United States maintain a diabetes rate of 16% in men and 13% in women (4), both rates are higher than the national average of 11.6% (5) Faculty and staff members also maintain elevated cholesterol levels (34% of men surveyed and 27% of women), receive less than the 7 h of recommended sleep (46% of men, 45% of women), feel overwhelming anxiety (28% of men, 40% of women), and feel overwhelmed by their responsibilities (48% of men, 64% of women) (4). Tenure-track faculty, especially women and underrepresented minorities, may experience the stresses of and anxiety of promotion tenure-criteria and review differently than their tenured colleagues. These figures may well be the result of an aging academic workforce, in which the average age of a tenure-track faculty member is 49 years, seven years older than the US workforce. Thirteen percent of university faculty are over the age of 65, compared to 6% of the US workforce (6) Universities often employ older faculty since the role of a professor requires many years of advanced training6 and the 1986 Discrimination in Employment Act (DEA) prevents academic institutions from mandating retirement ages for faculty and/or staff (7–9). Though age is one possibility, there are a number of potential causes common to academic institutions that may better explain the worsening of university faculty and staff health and wellness in the United States.
Contributing factors influencing faculty and staff health and wellness
Some of the reasons faculty and staff may not be as healthy as the general population include lack of motivation, poor time management, forgetting about wellness-at-work initiatives, wellness program times that do not fit their schedule, and job responsibilities that make it difficult to attend wellness programming or adhere to a regular meal/exercise schedule (4). A 2025 study of an academic medical center identified factors that help explain the lack of wellness at a personal level within their faculty. These factors included professional and personal life imbalances, feeling disconnected from their colleagues and not supported by the center’s senior leadership (10). Specifically, the time expended due to measures of academic success-the burdensome workload, pressure to publish, responsibilities to students, the need to secure grant funding-contribute to an inability to disconnect from work during personal time (11). Employees in higher education generally have more sedentary job responsibilities than the general public (12), maintain an inadequate dietary intake, and engage in improper eating habits (13) that can result in an obesity-related chronic disease (14). Improper diets and food security are a concern for both faculty and staff members. A qualitative study in 2019 found that faculty may have greater financial resources and access to healthy foods, however the demands of their positions and a lack of available time to shop for or prepare meals prevents them from eating more balanced, nutritious meals, consuming enough food or eating on a regular schedule (15). The staff members, on the other hand, often do not have adequate financial resources, are single heads-of-household and cannot purchase more nutritious food on a regular basis (15). Food insecurity has a direct effect on several obesity-related factors including physical activity and sleep quality and duration, as well as both a direct and indirect effect on body mass index (BMI) in an obesogenic environment (16).
Existing workplace wellness approaches
In response to employee needs and to improve the wellness of faculty and staff, several universities have instituted either top-down workplace wellness initiatives focused on faculty, students, and staff or invested in cellular phone applications to promote health. One of the most comprehensive and interesting faculty, staff, and student programs is found at a university in Illinois, whose program has been operating for over 40 years (17). Some of the hallmarks of the program is the institutional support demonstrated through the investment in a guiding committee and the inclusion of this wellness program in the university’s strategic plan. The program also includes a campus ambassador program comprised of faculty and students to promote wellness and the allowance of 90-min per week of wellness flex time for all employees to participate in activities (17). A 2024 study also supports the faculty need for some flex time to participate in wellness activities since most staff members do not have the freedom of faculty members to dictate their own schedules (18). The top-down, employee-only programs offered by universities across the United States are generally governed by faculty and leadership teams and include activities such as walking campaigns, mindfulness activities, exercise classes, discounted Weight Watchers memberships, web-based applications, and incentives for participation (19). A few additional pilot studies have been conducted by both faculty and doctoral students. A faculty driven 12-week walking pilot did not achieve the authors’ goal of reducing BMI (20). The mixed-methods study conducted by doctoral students seeking to determine if employees would be more encouraged to utilize staircases to traverse the university buildings when exposed to marketing banners near stairwells found that employee use of staircases (rather than elevators) increased over the course of the 12-week pilot (21).
Purpose of the study
The purpose of this quasi-experimental study is to determine if faculty and staff consistency of participation, self-efficacy when participating in a program and their comfort beginning a new health and wellness challenge would increase when enrolled in an 8-week broad-based (physical, nutritional, financial, spiritual, and emotional health) health and wellness program designed, developed, planned, marketed, implemented, evaluated, and led wholly by undergraduate public health students. Based on a cursory review of the literature, it is our belief this wholly student-driven program fills a gap in the existing body of literate. Since faculty and staff members are servant leaders, our theory is that they will participate more regularly in a fun, community-building, student-developed campaign. This regular participation is foundational to creating a culture of health at universities and organizations across the nation (22).
Methods
Study population and data collection
This was a quasi-experimental study conducted among Faculty and Staff of St. Bonaventure University (SBU). Participants were 18 years and above, employed at SBU, and provided consent by signing the informed consent form. Pre- and post-intervention data were collected using a semi-structured questionnaire administered through Qualtrics. Faculty and staff were also invited to add qualitative clarity for each Likert-scale question on the post-test only. The questionnaire contained 18 questions split into 2 sections-demographic and study-specific questions about comfort, confidence, and current feelings about their engagement in physical activities. Faculty members were invited to contribute qualitative responses to better explain their responses to Likert-scale questions. For each question, faculty and staff were asked about what encouraged/discouraged their participation and asked to recommend changes to the program, based on their experience. By request, the authors will provide a copy of the questionnaire to allow replication studies.
The health and wellness program—branded as the B. O. N. A. S. Challenge—was designed and implemented by 23 undergraduate Public Health majors enrolled in Health Promotion Programming and Program Implementation and Evaluation courses. These students participated through course enrollment rather than as part of a forum or outreach group. Their inclusion was based on course participation, not a competitive selection process. Development followed structured stages: needs assessment, domain prioritization, challenge module creation, pilot testing, final revisions, and program delivery.
The eight weekly challenges were authored by small student teams, each assigned a wellness theme (nutrition, movement, mindfulness, etc.), with faculty mentors providing oversight. A total of 44 participants completed the pre-intervention survey, and 34 completed the post-intervention survey after 8 weeks. Several faculty and staff members did drop out of the program prior to its termination due to scheduling concerns. Since the end of our program approached the end of the academic year, these scheduling concerns seemed appropriate.
Setting: Cattaraugus County and the rural university context
This study was conducted at St Bonaventure University (SBU) in New York State. St Bonaventure has a student population of roughly two thousand in-person students or distance learners. At the university, there are over 606 full- and part-time faculty and staff members working in various departments. St. Bonaventure University is situated in Cattaraugus County, a rural region in Western New York ranked 56th out of 62 counties in New York State for health outcomes (23). Many university employees live locally and are directly impacted by the county’s high burden of chronic illness and limited healthcare access.
Eighteen percent of adults in the county report fair or poor health—exceeding the statewide average of 14%—and residents average 4.5 physically unhealthy and 5.2 mentally unhealthy days per month (22). Obesity affects 37% of adults, while 26% report no leisure-time physical activity. Access to safe, convenient spaces for physical activity is limited to 68% of the population (23). Risk behaviors and chronic conditions remain elevated with 19% of adults identifying as smokers, compared to the state average of 12% (23). Excessive alcohol use is reported by 22%, and preventable hospital stays total 5,961 per 100,000 Medicare enrollees (23). Socioeconomic pressures exacerbate these health issues: 22% of children live in poverty, and 18% of adults are uninsured (23). Given the challenges faced by New York State, it is reassuring that NYS diabetes rate has declined from 11/4% in 2021 (24) to 10% in 2024 (23). It is equally reassuring to note that Cattaraugus County’s diabetes estimate rivals NYS at 10% in 2024 (23). However, obesity rates in Cattaraugus County are estimated to be 7% higher than the NYS average of 30% (23).
In response, the B. O. N. A. S. Challenge was designed to address modifiable health behaviors within the local context. Its flexible, inclusive structure offered both in-person and virtual opportunities and aimed to reduce participation barriers often faced in rural communities. The program’s structure is aligned with community needs and university wellness goals, demonstrating a sustainable model for worksite health promotion in underserved areas.
Intervention: the B. O. N. A. S. Challenge
The B. O. N. A. S. (Bonnies Optimizing Nourishment, Achievement, and Strength) challenge was an eight-week wellness initiative targeting St. Bonaventure University’s faculty and staff. Created by undergraduate Public Health students from four courses offered in the Health Education Specialist (HES) concentration, the program functioned as an experiential learning capstone aligned with Health Education Specialist Practice Analysis (HESPA) competencies necessary to sit for the Certified Health Education Specialist (CHES) credentialing exam. Students designed and implemented the intervention with limited faculty input, collaborating weekly with Human Resources and a faculty mentor.
The undergraduate students were only provided the broad guidance to create a faculty and staff health and wellness program focused on increasing the participation of employees in their own health and wellness. The students intentionally selected activities to address diverse domains of wellness—physical, mental, social, and nutritional—based on local health data and stakeholder input. The challenge featured over 20 events, including group fitness sessions, yoga, walking groups, stress-reduction workshops, and healthy cooking demonstrations and 8 additional weekly challenges. The weekly challenges included March Madness (four 1-week daily bodyweight activities), water you waiting for (water drinking challenge), commercial break (bodyweight exercises during commercials), parking challenge (park an additional 6 stalls from intended parking spot), and home cooking challenge (prepare and eat one meal at home daily). A weekly “Lunch and Learn” series tackled topics such as sleep hygiene, hydration, and chronic disease prevention. Supplemental behavior challenges encourage daily habits like gratitude journaling, mindful breathing, or limiting sugar-sweetened beverages.
To encourage sustained engagement, students developed a point-based consistency system tracked through Qualtrics and promoted the initiative via weekly emails and social media. Students enrolled in Public Health marketing took responsibility for campaign branding and communications, while evaluation teams monitored implementation and outcomes. Incentives such as T-shirts and newsletter recognition supported ongoing participation. By emphasizing consistency over perfection and prioritizing accessibility, the Challenge maintained strong faculty and staff involvement while also demonstrating how a student-led project can connect classroom learning with institutional wellness promotion.
Dependent variables
The level of self-reported confidence and participation in physical activity and wellness program post-BONAS challenge (post-intervention). Confidence level was not specifically defined for participants, so the measure was more subjective than objective. On-campus participation was recorded via Qualtrics sign-in sheets, however off-campus participation was wholly self-reported. Confidence level was assessed using a six-point Likert scale: “very confident” scored “5”; “somewhat confident” scored “4”; “neither” scored “3”; “not confident” scored “2”; “extremely not confident” scored “1”; “never” scored “0.” Participation level was assessed using a five-point Likert scale: “very regularly” scored “5”; “somewhat regularly” scored “4”; “neither” scored “3”; “not very regularly” scored “2”; “not very regularly at all” scored “1.”
Independent variables
The level of self-reported confidence and participation in physical activity and wellness program pre-BONAS challenge (pre-intervention). Confidence level was not specifically defined for participants, so the measure was more subjective than objective. On-campus participation was recorded via Qualtrics sign-in sheets, however off-campus participation was wholly self-reported. Confidence level was assessed using a six-point Likert scale: “very confident” scored “5”; “somewhat confident” scored “4”; “neither” scored “3”; “not confident” scored “2”; “extremely not confident” scored “1”; “never” scored “0.” Participation level was assessed using a five-point Likert scale: “very regularly” scored “5”; “somewhat regularly” scored “4”; “neither” scored “3”; “not very regularly” scored “2”; “not very regularly at all” scored “1.”
Statistical analysis
Data collection and editing were conducted manually to detect omissions and to ensure uniform coding. The data was transferred into Excel, and analysis was completed using Statistical Package for the Social Sciences (SPSS) version 29. Frequency tables of the demographic variables pre- and post-intervention were generated. The major categorical variables were coded numerically for analysis. The mean, the mean difference, and the confidence interval of the difference between the pre-and post-intervention were determined. An independent T-test was used to determine the statistical significance of the difference between the dependent (post-intervention) and independent (pre-intervention) variables. The level of significance was determined at a p-value < 0.05 with a 95% confidence level (CI).
Ethical considerations
The informed consent form was administered to participants before the questionnaire. The questionnaire consisted of two sections, A and B. Section A included questions on participation in wellness programs, and Section B included questions on demographics. Research approval was obtained from the Institutional Review Board of the St Bonaventure University, St Bonaventure, New York. The reference number is 731.
Results
A total of 44 and 34 faculty and staff members responded well to the pre- and post-intervention questionnaire survey, respectively. Most of the participants were females in the pre-intervention (93.18%) and post-intervention (88.24%) groups (Table 1). About two-thirds of the respondents in both groups – pre-intervention group (64.29%) and post-intervention (63.64%)- had a graduate degree. Similarly, more than a third of both pre-intervention (36.36%) and post-intervention (35.29%) groups were within the age group 31–40 years (Table 1). Pre- and post-intervention age breakdowns can be found in Figures 1, 2. Importantly, the age breakdown between groups is to be expected since the program dropouts would alter some of the final demographic information. The predominant race in both groups was white, limiting the ability to generalize these findings to more diverse colleges and universities.
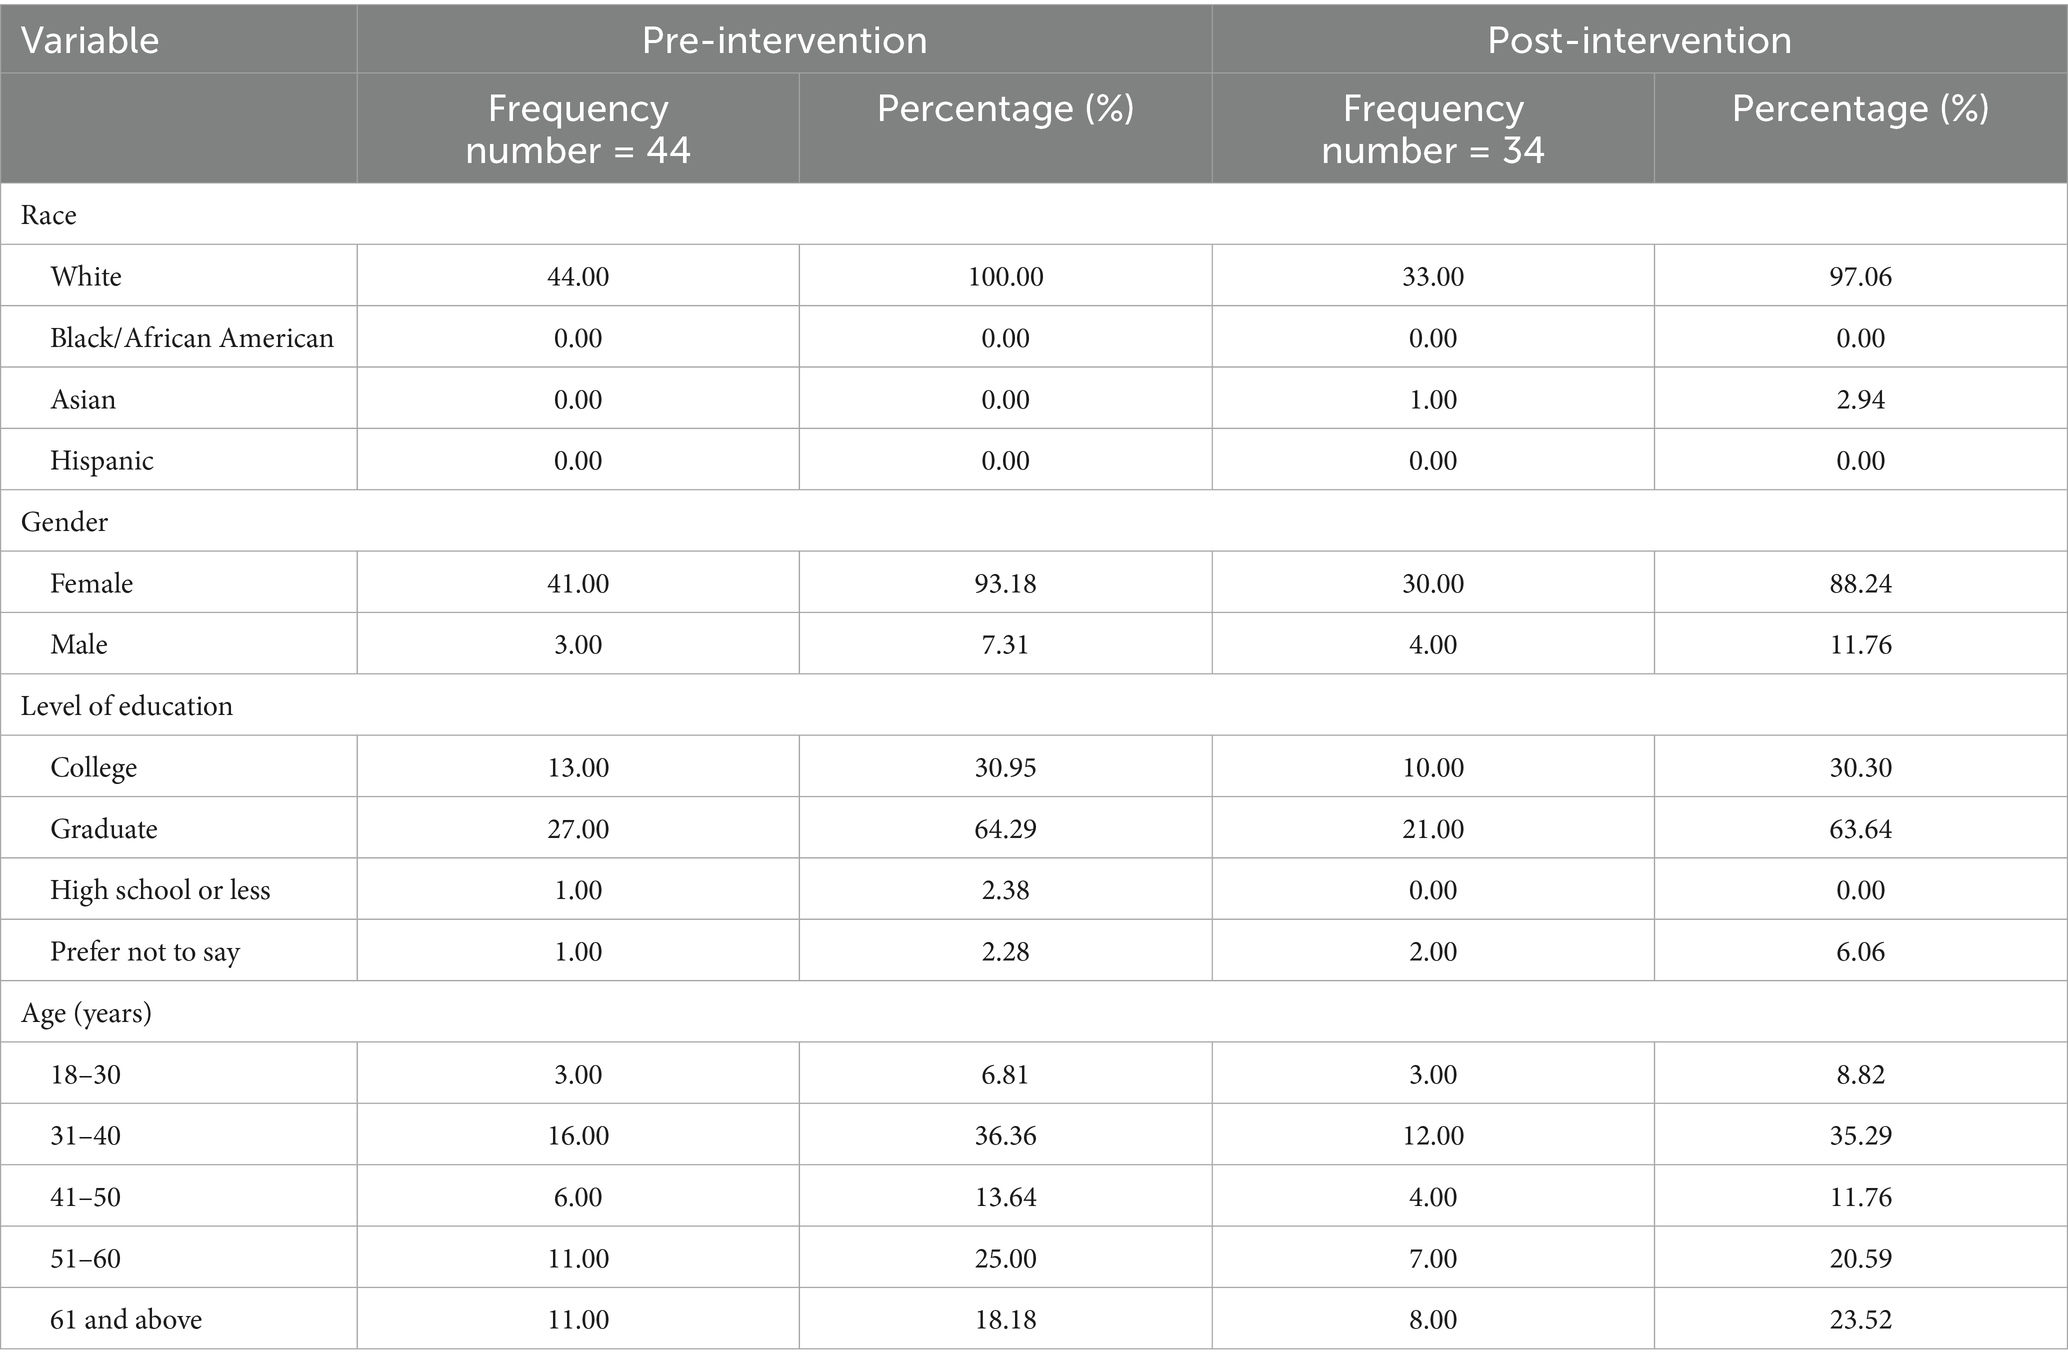
Table 1. Demographic variables of staff pre- and post implementation of the wellness program.
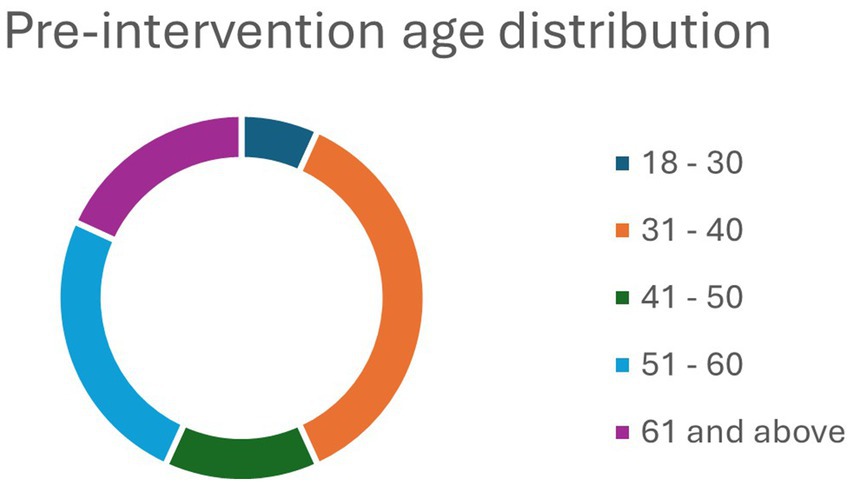
Figure 1. Age distribution pre-intervention.
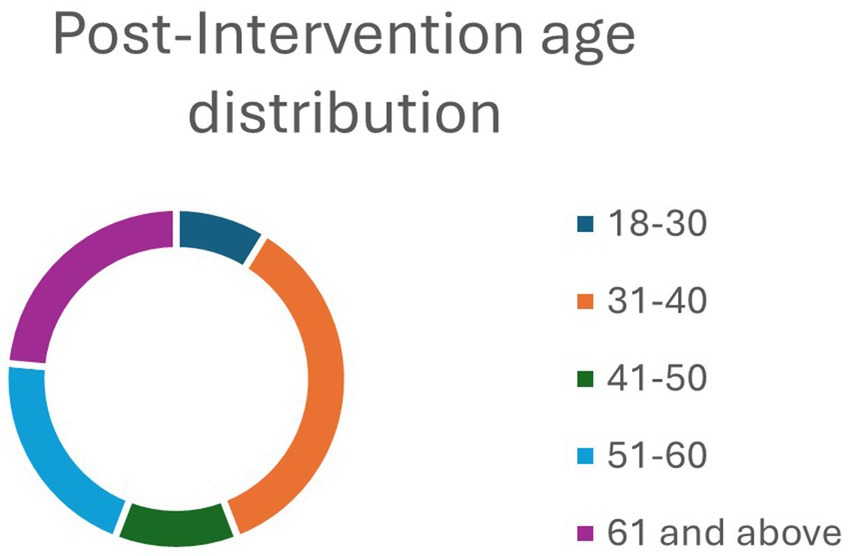
Figure 2. Age distribution post-intervention.
Comparison of consistency of staff in physical activity in the pre-and post-intervention
In Table 2, there was a statistically significant difference in mean in the participation of staff in the wellness program within SBU and local community pre- and post-BONAS challenge (Mean difference: −0.456, 95% CI: −0882 – −0.048; p = 0.029). In a similar vein, there was a statistically significant difference between pre-intervention and post-intervention participation in nutritional programs in SBU and the local community by staff and faculty (Mean difference: −0.472, 95% CI: −0.817 – −0.127; p = 0.008). However, there was no statistically significant difference in the mean pre- and post-intervention in comfortability starting a new wellness program and confidence participating in a new wellness program by staff and faculty at the university with p = 0.628 and 0.593, respectively. Faculty and staff members, who either provided a qualitative response or contacted one of the authors to share their feedback indicated that their overall participation improved, thanks to the regular marketing for the B. O. N. A. S. Challenge, calendar invitations to participate, post-event marketing, weekly newsletters and from seeing other participants adorned in their team t-shirts.
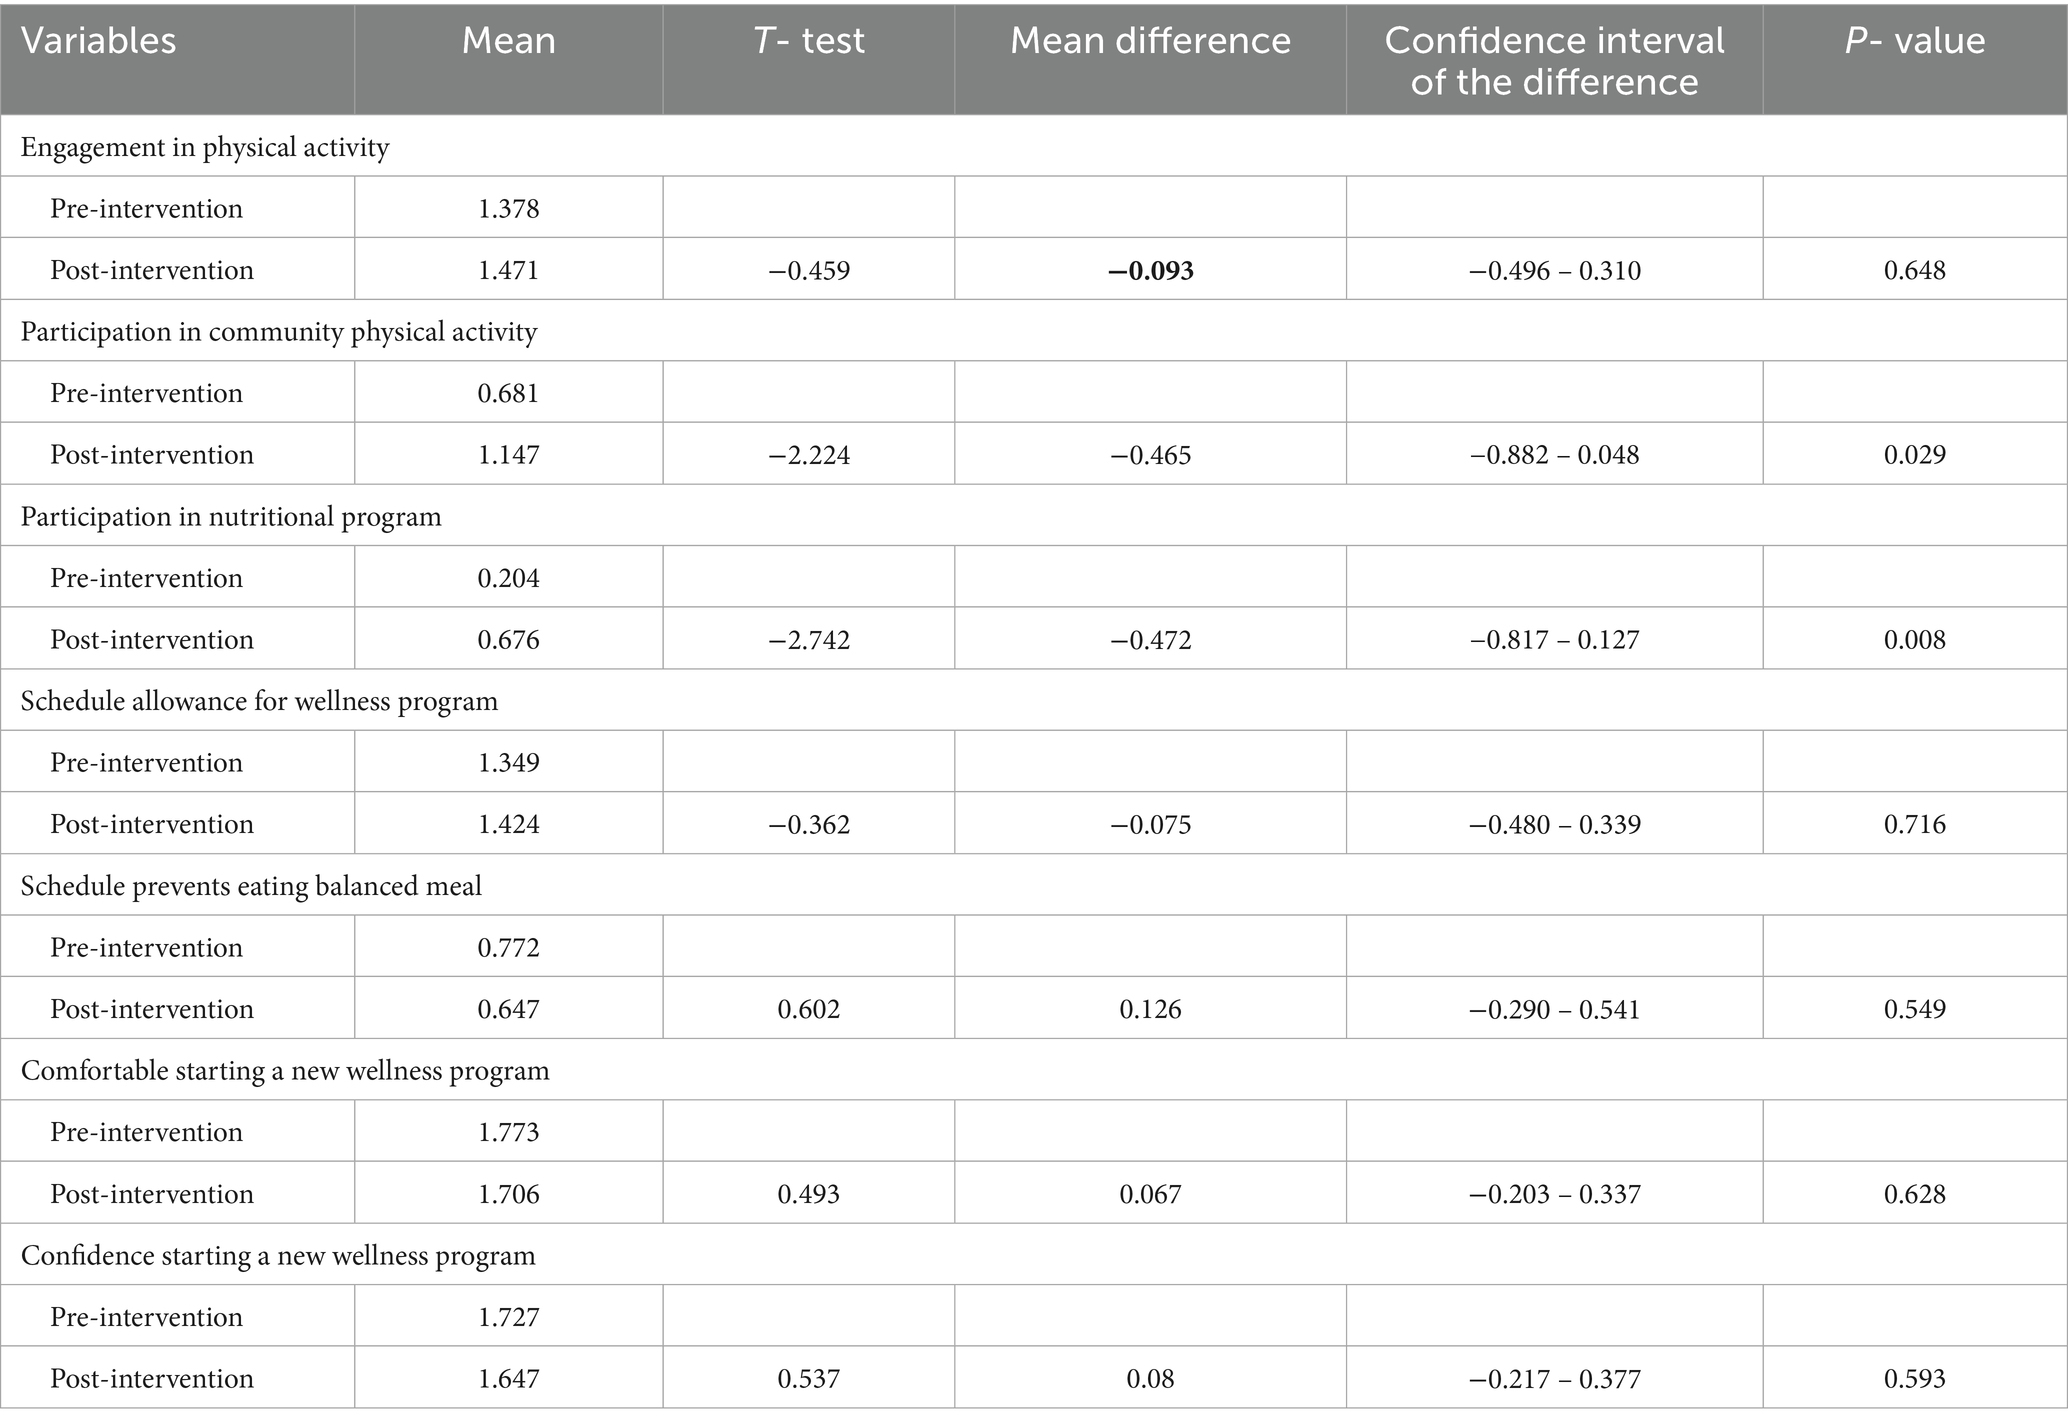
Table 2. Comparison of staff’s consistency in physical activity and wellness programs pre- and post- intervention.
Discussion
The current study focused on the consistency of faculty and staff participation when engaged in a wholly student-led, −designed, −developed, −marketed, −implemented, and -evaluated health and wellness campaign. The study was conducted at a small, private university housed within a rural county in Western New York State on the East Coast of the United States. The surrounding county suffers from poor health outcomes and maintains rates of diabetes, obesity, poverty, food insecurity, and physical inactivity higher than both the state and national averages (23).
The results derived from t-tests utilizing the Likert-scale Qualtrics pre- and post-test data indicate that there was both a significant increase in faculty and staff consistency our wellness program and in community-based wellness activities (p = 0.029) and in nutritional programming from within and without the university setting (p = 0.0008). T-tests were preferable to use for this analysis, as paired t-test analysis would have required the same participants complete both the pre- and post-intervention test. Since the study allowed rolling participation, matched participation was more complicated to solicit. Our program was focused on consistency, so we chose not to limit faculty and staff participation to events held on-campus and broadened the arena to allow consistency tracking points for activities off-campus. Community-based activities included visits to local gyms, dance classes, running clubs, etc. and consistency from community activities was self-reported by participants.
This consistent behavior is best explained by both habit training and nudging theory. Habit training and habit theory, often utilized by occupational therapists to retrain patients to perform the activities of daily living, focuses on performing and reminding patients of a task to be performed until the habituation reduces the amount of conscious thought needed to perform these context- and environment-dependent behaviors (25–27). The context necessary for a behavior to become a habit also involves the choices available to a participant. If a participant can choose between a physical activity, nutritional activity or drinking more water daily, they may choose the easiest of the behaviors or try each but not develop the habituation needed for said behavior to become routine (28). A study conducted in the UK focused on how habits are formed and determined that the variable length of time necessary to convert a repeated behavior into a habit ranged from 18–254 days (28, 29). Nudging theory and nudging interventions, on the other hand, focus on promoting better health behavior changes through gentle reminders, signage, regular health marketing, and product positioning and placement (30). Grocery stores often rely on nudging by placing items at the end of rows of grocery to nudge a buyer with limited time to shop into an impulse purchase (30).
This study found that participant comfort starting and confidence when participating in a health and wellness campaign did not meet the threshold of significance. Though very few of the participants elected to provide written qualitative feedback, some of the possible reasons for this result could include the nature of some of the campaign’s activities, the time management skills of the participants, the timing of the intervention which neared finals week and the end of the academic year, holding indoor activities as the weather improved, timing of the events offered, discomfort when engaging in physical activities with colleagues, body dysmorphia and self-image concerns, and fear of the unknown. The aforementioned reasons many faculty and staff members became inconsistent in their on-campus participation are from conversations with the authors initiated by participants. In retrospect, participant confidence and comfort starting a program could have improved had elements of social support been added to the program. Social support has been associated with increased self-efficacy when engaged in physical activities, in particular (31). In addition, employing a targeted motivation-focused, empowering campaign strategy may have improved participant comfort when beginning this program. Higher self-efficacy has been associated with reduced barriers to physical activity and positive outcome expectations (31). Incorporating self-imagery activities into this wellness campaign may have influenced activity and motivation to perform. Self-imagery is a process in which participants can imagine themselves performing an activity successfully (32). Without the adequate qualitative responses from the post-intervention survey, the reasons listed above are from anecdotal observations and conversations with participants.
This study is not without its limitations. The current paper was not originally designed as research, as it was developed as a student learning opportunity. As a result and given the truncated lead time to begin the program, the quasi-experimental study lacks a control group and relied on self-reported data. Since the study was performed at a small, private 4-year university and the sample size was limited, the results of this study may not be generalizable to larger, public institutions of higher learning nor would these results be indicative of the success of a faculty and staff health and wellness program in k-12 school systems. More so, there is a possibility of social desirability bias as the questionnaire was self-administered. Additionally, the study population was largely Caucasian and female, which further limits the ability to generalize our findings. Another limitation was the fragmented funding sources and the lack of institutional support by the university’s senior leadership. The addition of qualitative queries found in the post-intervention survey would have been more useful had we added qualitative response options to the pre-test. In addition, coding participants and their responses would have allowed for deeper analysis of the qualitative data.
Some of the strengths of this study include its novelty and that the totality of this campaign was wholly student-designed and -driven. In addition, this program was dedicated to the improvement of faculty and staff wellness, as we posited that faculty and staff members serve as examples for the students and would be more likely to model these behaviors when engaged in a student-driven activity campaign. Upon a cursory review of the literature, there are few to no other programs like this that are wholly driven by undergraduate students to improve the wellbeing of university faculty and staff.
Conclusion
The current study focused on improving the consistency of participation by faculty and staff in a student-led, −developed, −designed, and implemented health and wellness campaign. Our findings indicate that consistency of faculty and staff participation increased significantly both on- and off-campus over the course of the 8-week campaign. The authors’ theorized that faculty and staff would continue to participate in a program designed by students since university staff members often serve as servant leaders and examples to the student body.
Data availability statement
The raw data supporting the conclusions of this article will be made available by the authors, without undue reservation.
Ethics statement
The studies involving humans were approved by the St. Bonaventure University Insititutional Review Board, St. Bonaventure University. The studies were conducted in accordance with the local legislation and institutional requirements. The participants provided their written informed consent to participate in this study.
Author contributions
JA: Conceptualization, Data curation, Funding acquisition, Project administration, Resources, Supervision, Visualization, Writing – original draft, Writing – review & editing. CO: Data curation, Formal analysis, Methodology, Writing – original draft. SL: Conceptualization, Methodology, Project administration, Supervision, Writing – original draft.
Funding
The author(s) declare that financial support was received for the research and/or publication of this article. Internal funding for the intervention itself was provided by 4 academic schools and the human resources department at St. Bonaventure University.
Acknowledgments
The authors would like to acknowledge the support and participation of Katie Lowe, Dawn Parisella, and Kyle Leslie from the SBU HR department for their participation, support and their role as the primary funders of this intervention. We would like to further acknowledge 4 Deans from SBU who also demonstrated their support through contributions to this research. They include Dr. Swagata Bank, Dean of the DePerro School of Health Professions, Dr. Rene’ Garrison, Dean of the School of Education, Dr. Erin Sadlack, Dean of the School of Arts and Sciences, and Aaron Chimbel, Dean of the Jandoli School of Communication.
Conflict of interest
The authors declare that the research was conducted in the absence of any commercial or financial relationships that could be construed as a potential conflict of interest.
Generative AI statement
The authors declare that no Gen AI was used in the creation of this manuscript.
Any alternative text (alt text) provided alongside figures in this article has been generated by Frontiers with the support of artificial intelligence and reasonable efforts have been made to ensure accuracy, including review by the authors wherever possible. If you identify any issues, please contact us.
Publisher’s note
All claims expressed in this article are solely those of the authors and do not necessarily represent those of their affiliated organizations, or those of the publisher, the editors and the reviewers. Any product that may be evaluated in this article, or claim that may be made by its manufacturer, is not guaranteed or endorsed by the publisher.
References
1. Hacker, K. The burden of chronic disease. Mayo Clinic Proceed. (2024) 8:112–9. doi: 10.1016/j.mayocpiqo.2023.08.005
2. Centers for Disease Control and Prevention. About chronic diseases (2025). Available online at: https://www.cdc.gov/chronic-disease/about/index.html (Accessed June 11, 2025).
3. Benavidez, GA, Zahnd, WE, Hung, P, and Eberth, JM. Chronic disease prevalence in the US: sociodemographic and geographic variations by zip code tabulation area. Prev Chronic Dis. (2024) 21:E14. doi: 10.5888/pcd21.230267
4. American College Health Association. American college health association-national faculty and staff health assessment (2025). Available online at: https://www.acha.org/resources-programs/data-solutions-assessments/national-faculty-staff-health-assessment/ (Accessed June 12, 2025).
5. Centers for Disease Control and Prevention. National diabetes statistics report (2024). Available online at: https://www.cdc.gov/diabetes/php/data-research/index.html (Accessed June 12, 2025).
6. McChesney, J, and Bichsel, J. The aging of tenure-track faculty in higher education: implications for succession and diversity. College and University Professional Association for Human Resources. (2020).
7. Kaskie, B. The academy is aging in place: assessing alternatives for modifying institutions of higher education. Gerontologist. (2017) 57:816–23.
8. American Council on Education. Advancing an agenda for excellence: supporting faculty retirement transitions. (2011). Available online at: https://www.acenet.edu/Documents/ACE-Faculty-Retirement-Transitions-exec-summary.pdf (Accessed June 11, 2025).
9. Clauss-Ehlers, CS, and Pasquerella, L. Understanding retirement from a developmental perspective: the case of Mount Holyoke college In: Faculty retirement. Oxfordshire, UK: Routledge (2023). 42–51.
10. Gupta, A, Conley, CC, Rice, J, Poth, K, and Graves, K. Faculty perceptions of wellness at an academic medical center. Work. (2025)
11. Ryan, CG, Dall, PM, Granat, MH, and Grant, PM. Sitting patterns at work: objective measurement of adherence to current recommendations. Ergonomics. (2011) 54:531–8. doi: 10.1080/00140139.2011.570458
12. Freedman, MR, and Rubinstein, RJ. Obesity and food choices among faculty and staff at a large urban university. J Am Coll Heal. (2010) 59:205–10. doi: 10.1080/07448481.2010.502203
13. Yuen, HK, Becker, SW, Ellis, MT, and Moses, J. Prevalence and characteristics of campus-based employee wellness programs among United States accredited colleges and universities. Work. (2021) 68:1049–57. doi: 10.3233/WOR-213435
14. Booth, AL. Hungry ghosts: the impact of food as a workplace health concern among university staff and faculty. Hum Ecol Rev. (2019) 25:69–89. doi: 10.3316/informit.T2024030600004202039901066
15. Allen, J. The indirect effects of food insecurity on obesogenic environments. Front Public Health. (2023) 10:1052957. doi: 10.3389/fpubh.2022.1052957
16. Amaya, M, Donegan, T, Conner, D, Edwards, J, and Gipson, C. Creating a culture of wellness: a call to action for higher education, igniting change in academic institutions. Building Healthy Academic Communities J. (2019) 3:27–40. doi: 10.18061/bhac.v3i2.7117
17. Mathien, RG, Cochran, B, Johnson, AK, and Dengo, AL. Rationale for participation in university worksite wellness programs. J Am Coll Heal. (2024) 72:3348–56. doi: 10.1080/07448481.2022.2155827
18. Travia, RM, Larcus, JG, Andes, S, and Gomes, PG. Framing well-being in a college campus setting. J Am Coll Heal. (2022) 70:758–72. doi: 10.1080/07448481.2020.1763369
19. Haines, DJ, Davis, L, Rancour, P, Robinson, M, Neel-Wilson, T, and Wagner, S. A pilot intervention to promote walking and wellness and to improve the health of college faculty and staff. J Am Coll Heal. (2007) 55:219–25. doi: 10.3200/JACH.55.4.219-225
20. Safi, A, and Hossain, M. Promoting workplace physical activity among university employees: the impact of motivational and educational banners on stair use. Discover Public Health. (2025) 22:197. doi: 10.1186/s12982-025-00586-7
21. Trujillo, MD, and Plough, A. Building a culture of health: a new framework and measures for health and health care in America. Soc Sci Med. (2016) 1:206–13. doi: 10.1016/j.socscimed.2016.06.043
22. County Health Rankings & Roadmaps. Cattaraugus County population health and well-being. (2025). Available online at: https://www.countyhealthrankings.org/health-data/new-york/cattaraugus?year=2025#population-health (Accessed June 18, 2025).
23. County Health Rankings & Roadmaps. Data and documentation. (2025). Available online at: https://www.countyhealthrankings.org/health-data/methodology-and-sources/data-documentation (Accessed September 12, 2025).
24. New York State Department of Health. Diabetes prevalence and management report 2021. (2021). Available online at: https://www.health.ny.gov/statistics/diseases/conditions/diabetes (Accessed June 18, 2025).
25. Epley, E, Wolske, J, Lee, J, Mirza, M, and Fisher, G. Habits and health promotion in occupational therapy: a scoping review. Annals International Occupational Therapy. (2021) 4:e269–77. doi: 10.3928/24761222-20210921-04
26. Kielhofner, TR. Kielhofner’s model of human occupation theory and application. 6th ed. Philadelphia: Wolters Kluwer (2024).
27. Arlinghaus, KR, and Johnston, CA. The importance of creating habits and routine. Am J Lifestyle Med. (2019) 13:142–4. doi: 10.1177/1559827618818044
28. Lachman, ME, Lipsitz, L, Lubben, J, Castaneda-Sceppa, C, and Jette, AM. When adults don’t exercise: behavioral strategies to increase physical activity in sedentary middle-aged and older adults. Innov Aging. (2018) 2:igy007. doi: 10.1093/geroni/igy007
29. Lally, P, Van Jaarsveld, CH, Potts, HW, and Wardle, J. How are habits formed: modelling habit formation in the real world. Eur J Soc Psychol. (2010) 40:998–1009. doi: 10.1002/ejsp.674
30. Ensaff, H. A nudge in the right direction: the role of food choice architecture in changing populations' diets. Proc Nutr Soc. (2021) 80:195–206. doi: 10.1017/S0029665120007983
31. Rackow, P, Scholz, U, and Hornung, R. Received social support and exercising: an intervention study to test the enabling hypothesis. Br J Health Psychol. (2015) 20:763–76. doi: 10.1111/bjhp.12139
Keywords: faculty and staff, student-driven, health and wellness, nutrition, consistency, fitness, participation
Citation: Allen J, Olomofe C and Lehman S (2025) The impact of a student-developed, student-marketed, student-implemented and student-led 8-week health and wellness program on faculty and staff participation consistency. Front. Public Health. 13:1659127. doi: 10.3389/fpubh.2025.1659127
Edited by:
Keerti Singh, The University of the West Indies, BarbadosReviewed by:
Jacqueline Benn, The University of the West Indies, BarbadosMeshell Carrington, The University of the West Indies, Barbados
Cayla R. McAvoy, Florida Department of Health, United States
Copyright © 2025 Allen, Olomofe and Lehman. This is an open-access article distributed under the terms of the Creative Commons Attribution License (CC BY). The use, distribution or reproduction in other forums is permitted, provided the original author(s) and the copyright owner(s) are credited and that the original publication in this journal is cited, in accordance with accepted academic practice. No use, distribution or reproduction is permitted which does not comply with these terms.
*Correspondence: Jeffrey Allen, amFsbGVuQHNidS5lZHU=