 Masaki Adachi1,2,3*
 Michio Takahashi2,3,4
 Hiroyuki Mori2,5
 Tomoko Nishimura2,6
 Makoto Osada3Minami Adachi3Rei Monden7
 Manabu Wakuta2
 Kazuhiko Nakamura3
- 1Department of Psychology, Meiji Gakuin University, Tokyo, Japan
- 2Research Department, Institute of Child Developmental Science Research, Shizuoka, Japan
- 3Department of Neuropsychiatry, Graduate School of Medicine, Hirosaki University, Aomori, Japan
- 4Smart-Aging Research Center, Tohoku University, Sendai, Miyagi, Japan
- 5Faculty of Humanities, Saitama Gakuen University, Saitama, Japan
- 6United Graduate School of Child Development, The University of Osaka, Osaka, Japan
- 7Graduate School of Advanced Science and Engineering, Hiroshima University, Hiroshima, Japan
Introduction: The 5-item World Health Organization Well-Being Index (WHO-5) is widely used to assess psychological well-being, but its psychometric properties in younger populations, particularly in non-Western settings, remain underexplored. This study aimed to assess the validity and reliability of the Japanese version of the WHO-5 (WHO-5-J) and a culturally adapted four-item version (WHO-4-J), which excludes a culturally sensitive item (“I have felt cheerful and in good spirits”) and uses a simplified four-point Likert scale to minimize cognitive burden among Japanese school-aged children.
Methods: Data were collected from a large community-based sample of 6,983 students aged 10–15 years (Grades 4–9) in Hirosaki City, Japan. We evaluated the factorial validity and internal consistency of the WHO-5-J and WHO-4-J using exploratory and confirmatory factor analyses. Measurement invariance across age and gender groups was examined with multi-group confirmatory factor analyses. Receiver operating characteristic analyses were conducted to determine optimal cutoff scores for detecting psychological distress.
Results: Exploratory and confirmatory factor analyses supported the factorial validity and internal consistency of both the WHO-5-J (α = 0.84–0.88; ω = 0.86–0.91) and WHO-4-J (α = 0.82–0.88), confirming their unidimensional structures. Multi-group confirmatory factor analyses demonstrated full scalar measurement invariance across age and gender groups. Receiver operating characteristic analyses identified optimal cutoff scores with area under the curve values ranging from 0.80 to 0.85, indicating good diagnostic accuracy for psychological distress.
Discussion: Overall, the WHO-4-J demonstrated psychometric properties comparable to those of the WHO-5-J, supporting its practical utility as a culturally appropriate tool for assessing psychological well-being and screening for depression in Japanese youth. These findings underscore the importance of cultural adaptation and developmentally appropriate scaling for accurately assessing psychological well-being in diverse, non-Western child populations.
1 Introduction
The 5-item World Health Organization Well-Being Index (WHO-5) is a widely used tool for assessing subjective psychological well-being (1). Developed by the WHO, it comprises five positively framed items that assess mood, interest, and energy levels (2). Each item is rated on a 6-point Likert scale from 0 (“At no time”) to 5 (“All the time”), resulting in a total score ranging from 0 to 25. This score can be converted to a percentage scale (0–100%) for easier interpretation, with higher scores indicating better well-being (3).
Psychological well-being is a crucial aspect of overall quality of life (QoL) and is linked to various life outcomes, including academic success, social adaptation, and long-term mental health (4–6). Reliable measures like the WHO-5 are vital for understanding mental health and guiding effective interventions across diverse populations. The brevity and strong psychometric properties of the WHO-5 make it valuable in clinical and research settings.
In addition to assessing psychological well-being, the WHO-5 has proven to be effective as a screening tool for mental health conditions, particularly depression (7). Previous studies have shown strong negative correlations between WHO-5 scores and established depression measures, such as the Patient Health Questionnaire 9 (PHQ-9) (1, 8, 9), indicating that lower WHO-5 scores can help identify individuals at risk for depressive symptoms.
While the WHO-5 has been extensively validated in adults and clinical populations, its applicability to younger, nonclinical populations—particularly in community settings—remains underexplored (1, 8). Developmental differences in cognition, emotion, and language mean that school-aged children may struggle with abstract or complex well-being items, increasing susceptibility to response bias and reliability concerns (10–13). Consistent with developmental theory and empirical work, age-appropriate, developmentally sensitive tools are needed to capture children’s genuine feelings and to support early mental-health interventions and policy actions from the early school years (14, 15). Moreover, instruments developed or validated in clinical samples may not perform equivalently in community populations, which have broader symptom distributions, lower disorder prevalence, and greater demographic diversity, potentially altering sensitivity and specificity (16). Thus, explicit validation of the WHO-5 in younger, community-based samples is essential to confirm its measurement properties for subjective well-being and to ensure reliable identification of early psychological distress, thereby enabling timely prevention and broad public-health applicability.
Cultural factors shape how WHO-5 items are interpreted and answered, with implications for validity across sociocultural settings (12, 14, 17). Despite its global use, evidence remains concentrated in Europe and North America, with limited coverage of non-Western regions—including East Asia, South Asia, the Middle East, and Africa (18). Within East Asia, for example, studies from China have often focused on university students rather than younger school-age groups, limiting developmental generalizability (19). Cross-cultural work further suggests that expression and reporting of positive affect can vary at the item level (e.g., “I have felt cheerful and in good spirits”), raising potential validity concerns in youth samples (18, 20). These gaps motivate comprehensive research in younger age ranges and diverse contexts within East Asia, including Japan. Because schools increasingly rely on brief well-being screens to enable early identification and stepped support, age-appropriate validation is a prerequisite for safe implementation.
Psychometrically, variability has been reported in factorial structure and cutoffs across cultures and age groups (1, 7). While the WHO-5 is often treated as unidimensional, robust validation requires moving beyond exploratory factor analysis (EFA) to confirmatory factor analysis (CFA) and explicit tests of measurement invariance to avoid biased cross-group comparisons (17, 21–23). A recent cross-national study of 74,071 children and adolescents in 15 European countries found that the WHO-5 did not achieve full measurement invariance across countries, age groups, or genders; scalar non-invariance was especially evident for Item 1 (“cheerful and in good spirits”), motivating a four-item variant (WHO-4) to enhance comparability (20). These signals point not only to potential content-level issues (e.g., Item 1) but also to how response categories function in youth as a plausible driver of scalar non-invariance.
Building on this, developmental questionnaire research shows that six response options can overtax younger respondents, destabilize category thresholds, and thereby undermine scalar invariance (10, 11). Consistent with this rationale, a four-category format may improve interpretability and cross-group comparability in children (18, 20). Accordingly, we formally evaluate WHO-5-J and WHO-4-J head-to-head in Japanese school-aged children, testing whether a four-item content core combined with a four-category response format improves interpretability and scalar comparability beyond mere item reduction. By holding the response format constant (four categories) for both versions, we isolate response-format effects from item-content effects (i.e., the exclusion of Item 1) and can evaluate their respective contributions to measurement invariance and discrimination.
Although the WHO-5 is commonly used as a screening tool for depression, its validation in community-based samples of school-aged children is lacking. Furthermore, the impact of reducing the scale to four items (WHO-4) on its ability to detect depressive symptoms in this population has not been explored. Given the increasing prevalence of mental health challenges among children, exacerbated by the coronavirus disease of 2019 pandemic (24), validating both WHO-5 and WHO-4 in general child populations could be crucial. While the WHO-5 is effective in identifying mild to moderate depressive symptoms, it has limited sensitivity in severe cases, highlighting the need for further refinement (7).
To address these gaps, we evaluated, in a large community sample of Japanese school-aged children, the psychometric validity, reliability, measurement invariance, and screening utility of the WHO-5-J and WHO-4-J under a common four-point Likert response format designed to reduce cognitive burden and enhance response consistency; specifically, we aimed to: (1) conduct a head-to-head psychometric comparison of WHO-5-J and WHO-4-J administered with this shared four-point format; (2) test configural, metric, and scalar invariance across grade (age) and gender; (3) examine convergent validity with established measures of distress and well-being (PHQ-A, KIDSCREEN-10); and (4) determine and compare ROC-based operating characteristics and optimal cut-off scores for detecting psychological distress.
By systematically comparing these two models while holding the response format constant, this study aimed to clarify their comparative suitability for assessing well-being in Japanese school-aged children. The findings could inform school-based mental-health initiatives, guide evidence-based public-health policies, and enhance culturally sensitive mental-health assessments, particularly in non-Western settings.
2 Materials and methods
2.1 Study design and participants
Data for this study were obtained from the Assessment from Preschool to Puberty—Longitudinal Epidemiological (APPLE) study (25). The APPLE study is a community-based cohort study aimed at clarifying the protective and risk factors and mechanisms of mental health in children and adolescents. Since 2015, data have been collected each September. This study analyzed a cross-sectional wave targeting all elementary and junior high school students in Hirosaki City, Japan. The survey was conducted in collaboration with the Hirosaki City Board of Education and followed established methodologies from previous community-based studies in the same region (e.g., (26, 27)). Hirosaki City is a mid-sized regional municipality in northern Japan (area ≈ 524.20 km2; population ≈ 174,171 across ≈ 71,823 households), providing a typical socioeconomic context for public-school populations (25).
The study population included all students in public elementary and junior high schools in Hirosaki City. During the study period, there were 36 elementary schools and 17 junior high schools in the city, with a total enrollment of approximately 11,900 students. The target population consisted of students from Grades 4 through 9, as these students possessed the cognitive and reading abilities necessary to complete the self-reported questionnaires. Private school students, comprising less than 1% of the total student population, were excluded from the study. Coverage of the public-school target population exceeded 99%, supporting representativeness for public-school children in this setting.
Questionnaires were distributed to all eligible students during a designated class period. Teachers explained the study objectives and emphasized the voluntary nature of participation to the students. Additionally, letters outlining the objectives, methods, and ethical considerations were sent to the parents or guardians of all students by email. Parents had the option to withdraw their child from the study by informing the school. Students who were absent on the day of data collection were excluded.
Data was collected in September 2024, with a total of 7,347 questionnaires distributed. Of these, 6,983 questionnaires were completed and returned, resulting in a response rate of 95.0%.
2.2 Handling of missing data
Questionnaires with entirely missing responses were excluded (n = 102/6,983; 1.46%). Cases with missing values on grouping variables (sex or grade) were retained but excluded only from the relevant grouped analyses; unknown sex/grade was n = 8/6,881 (0.12%) among included respondents. For factor models (EFA/CFA and measurement invariance) using ordinal indicators, missing data were handled under the weighted least squares mean- and variance-adjusted (WLSMV) estimator with polychoric correlations, assuming missing at random (MAR). For ROC analyses using PHQ-A as the reference, cases with missing PHQ-A were excluded listwise (n = 203/6,881; 2.95%), yielding an effective ROC sample of n = 6,678. PHQ-A nonresponse occurred at a low rate (203/6,881; 2.95%) and showed no evidence of concentration by grade [χ2(5) = 5.710, p = 0.336] and only a small sex difference [χ2(1) = 4.483, p = 0.034; male 0.26% vs. female 0.03%]. Taken together, the low overall exclusion rate and minimal subgroup imbalances indicate that missingness is unlikely to meaningfully bias estimates of factor structure, measurement invariance, or ROC-based screening performance, although residual bias cannot be fully excluded.
2.3 Ethical considerations
The study was approved by the Committee of Medical Ethics of Hirosaki University Graduate School of Medicine (IRB# 2015–055). Prior to data collection, parents or guardians were provided with written information about the study through schools, with instructions to contact the researchers if they wished to decline participation. Classroom teachers informed students about the study content and their right to decline participation without facing any disadvantages before distributing the questionnaires.
2.4 Measures
1. WHO-5 Well-Being Index (WHO-5-J). The WHO-5 is a validated self-report measure designed to assess psychological well-being (1, 3). In Japan, a simplified four-point Likert scale version (S-WHO-5-J) was developed and validated for older adult populations to enhance ease of response while maintaining reliability and validity (28). In this study, we adapted the S-WHO-5-J for school-aged children by adjusting item wording and instructions to be more age-appropriate and understandable for younger participants. A back-translation process was conducted to ensure accuracy and consistency in meaning across translations, and the step-by-step translation workflow (including back translation and native check) is documented in Supplementary Material. The five positively worded items, such as “I have felt cheerful and in good spirits,” assess positive affect, interest, and energy levels over the past 2 weeks. Responses are scored from 0 (“At no time”) to 3 (“All of the time”), yielding a total score ranging from 0 to 15, with higher scores indicating better psychological well-being. Additionally, due to potential cross-cultural variability in interpreting the first item (20), a four-item version (WHO-4) excluding this item was also evaluated.
2. Patient Health Questionnaire (PHQ): The PHQ is a validated self-report tool used to assess depressive symptoms based on the Diagnostic and Statistical Manual of Mental Disorders criteria (29). In this study, the adolescent version (PHQ-A) was used, adapted from the PHQ-9 tailored to the developmental stages of adolescents (30). The PHQ-A comprises nine items that align with the Diagnostic and Statistical Manual of Mental Disorders 5 criteria for major depressive disorder, covering mood, interest, sleep, appetite, energy, self-worth, concentration, psychomotor changes, and suicidal ideation. Each item is rated on a 4-point scale from 0 (“Not at all”) to 3 (“Nearly every day”), resulting in total scores ranging from 0 to 27. A cutoff score of 10 or higher is commonly employed to identify moderate-to-severe depressive symptoms. The psychometric properties of the PHQ-A have been validated in Japanese adolescents, demonstrating its reliability and construct validity in detecting depression (31).
3. KIDSCREEN-10: The KIDSCREEN-10 is a validated self-report questionnaire used to assess the general health-related QoL in children and adolescents aged 8 to 18 years (32). This scale is a shortened unidimensional version of the KIDSCREEN questionnaires, comprising 10 items selected from the KIDSCREEN-27 to capture key aspects of physical, psychological, social, and school-related well-being in children. The items cover physical activity, emotional well-being, autonomy, parent–child relationships, peer interactions, and cognitive and learning capacities. Responses are rated on a 5-point Likert scale, indicating frequency (“never” to “always”) or intensity (“not at all” to “extremely”) over the past week. Scores are transformed into T-values with a mean of 50 and a standard deviation of 10, where higher scores indicate better HRQoL. The Japanese version of KIDSCREEN-10 (J-KIDSCREEN-10) has demonstrated acceptable psychometric properties, including internal consistency, test–retest reliability, and concurrent validity in Japanese populations (33).
2.5 Data analysis
The data analysis in this study involved several steps to evaluate the psychometric properties and utility of the WHO-5-J. First, descriptive statistics, such as means, standard deviations, and frequency distributions, were computed for the WHO-5, PHQ-A, and KIDSCREEN-10 measures to provide an overview of the data and ensure its suitability for further analysis.
The internal consistency of the WHO-5 and WHO-4 scales among Japanese elementary and junior high school students was assessed in this study. To comprehensively evaluate reliability, both Cronbach’s α and McDonald’s ω coefficients were utilized. McDonald’s ω is increasingly recommended due to its ability to account for varying factor loadings among items (34, 35). Reliability coefficients of 0.70 or higher were considered acceptable. While Cronbach’s α is commonly used, it may underestimate reliability when factor loadings are not equal and can indicate item redundancy with excessively high alpha values (>0.90) (36). Bayesian estimation methods were employed to calculate McDonald’s ω and Cronbach’s α, along with their 95% credible intervals, providing a nuanced understanding of reliability beyond conventional frequentist methods (37). The Bayesian credible intervals enhanced interpretability by explicitly quantifying uncertainty around reliability estimates, strengthening the robustness of the findings.
EFA and CFA are commonly employed together to assess the construct validity of psychological scales. Typically, EFA is initially conducted to identify the underlying factor structure without imposing a preconceived theoretical model. Subsequently, CFA is performed to assess the fit of the hypothesized model derived from the EFA results (38). It is recommended to split the sample into two independent subsets for EFA and CFA to prevent overfitting, validate the factor structure identified by EFA independently, and enhance the validation process’s robustness (38). While there is no universally prescribed ratio for dividing samples, it is generally recommended to allocate a larger portion to EFA for stable factor extraction and a smaller portion to CFA for validation (39). In the present study, we followed a 2:1 ratio of participants for EFA to CFA, aligning with these recommendations. Additionally, ensuring comparability between subsets in terms of key demographic variables like gender and grade level is crucial to reduce biases and enhance result generalizability (38). Therefore, we randomly divided the analytic sample (N = 6,873) into independent EFA and CFA subsets with a 2:1 allocation (EFA: n = 4,811; CFA: n = 2,062), implemented in Python (Jupyter; pandas, numpy, scikit-learn StratifiedShuffleSplit, seed = 2025). Stratification was performed jointly by sex (1 = male, 2 = female) and school grade (4–9) to preserve marginal distributions. Post-split balance was excellent. For sex, the male proportion was 47.37% (EFA) vs. 47.37% (CFA); the difference in proportions was Δ = 0.000 percentage points [95% CI (−1.80, 1.80)]. A Pearson’s chi-square test indicated no association between subset and sex, χ2(1) = 0.000, p = 0.999, with a negligible effect size (φ = 0.000). For grade (4–9), distributions were also equivalent, χ2(5) = 0.007, p = 0.999, Cramér’s V = 0.001. This methodological approach adheres to established psychometric best practices, indicating that with clearly defined factor structures and adequate sample sizes, population-level factor structures can be accurately reproduced even without a perfect model fit (38). Thus, the approach adopted in this study enhances the reliability and validity of the identified factor structures.
Because item responses are ordinal Likert categories, all factor models were estimated from polychoric correlations using the weighted least squares mean and variance adjusted (WLSMV) estimator with a probit link, which does not assume multivariate normality and is robust to non-normality. We screened item-level distributions (skewness and kurtosis) and found values within acceptable ranges; total scores were approximately normal, supporting the use of parametric summaries. Within this framework, exploratory factor analyses applied a Geomin oblique rotation to allow correlated factors (40). Factor retention was determined based on various criteria, including eigenvalues greater than 1 (41), scree plot inspection (42), and model fit indices. Solutions with one to five factors were considered, but convergence was only achieved for one- and two-factor solutions.
CFA was conducted on the second subset using the same WLSMV estimator. A unidimensional model was specified for each version: all five items for the WHO-5 and all four items for the WHO-4 were set to load onto a single latent factor. The factor variance was fixed at 1, and the mean was set to 0 for model identification.
The model fit for both EFA and CFA was assessed using the Comparative Fit Index (CFI), Tucker-Lewis Index (TLI), Root Mean Square Error of Approximation (RMSEA), and Standardized Root Mean Square Residual (SRMR). Acceptable fit criteria were defined as CFI/TLI ≥ 0.90 and RMSEA ≤ 0.08, while good fit was defined as CFI/TLI ≥ 0.95 and RMSEA ≤ 0.06; SRMR values ≤0.10 and ≤ 0.08 were considered acceptable and good, respectively (43). RMSEA values slightly above 0.06 were considered acceptable due to the low number of items in both scales, consistent with prior recommendations for low degrees of freedom (44, 45).
Following the CFA, subgroup differences were examined through multi-group confirmatory factor analysis using the entire sample (n = 6,873) to assess measurement invariance across gender and age groups. The analysis proceeded sequentially, starting with configural invariance to ensure consistency in factor structure across groups, followed by metric invariance to assess equivalence in factor loadings, and scalar invariance to ascertain if item intercepts remained invariant across groups. Model fit was assessed based on established criteria: CFI > 0.95, TLI > 0.95, and RMSEA < 0.06 (43). However, it is important to consider potential bias in RMSEA values for models with low degrees of freedom, particularly with fewer than 10 indicators (45), as is the case with both the WHO-5 and WHO-4 scales. Moreover, Hu and Bentler (43) indicated that RMSEA values close to 0.06 are acceptable, while values ≤0.08 are widely recognized as acceptable. Therefore, RMSEA values ranging approximately from 0.06 to 0.08 were considered indicative of an acceptable model fit for the present study (22, 23, 45). Upon establishing configural invariance, metric invariance and scalar invariance were tested. Model comparisons were not conducted using chi-square difference tests due to the test’s sensitivity to large sample sizes. Instead, differences in CFI and TLI values ≤0.01 and differences in RMSEA ≤0.015 were considered indicative of measurement invariance.
To assess concurrent validity, Pearson’s correlation coefficients were computed to investigate the associations between the WHO-5-J and two other measures, the PHQ-A and KIDSCREEN-10. These correlations offer insights into the alignment of the WHO-5-J with established measures of depressive symptoms and health-related QoL.
To determine the optimal cutoff scores for both the WHO-5-J and WHO-4-J, ROC curve analyses were conducted. The PHQ-A was used as the reference measure for identifying psychological distress, with predefined cutoff scores of ≥10 for moderate depression, ≥15 for moderately severe depression, and ≥20 for severe depression. The discriminative ability of each scale was assessed by calculating the area under the ROC curve (AUC), with values ≥0.90 indicating excellent discriminative accuracy, 0.80–0.89 representing good accuracy, 0.70–0.79 indicating fair accuracy, and values below 0.70 suggesting poor accuracy (46). AUCs were reported with 95% confidence intervals computed by the DeLong method, and paired DeLong tests were used to compare AUCs between WHO-4-J and WHO-5-J. Various diagnostic accuracy indices, including sensitivity (the proportion correctly identifying true positive cases), specificity (the proportion correctly identifying true negative cases), the Youden’s index (defined as sensitivity + specificity-1, which indicates the optimal balance between sensitivity and specificity (47)), positive likelihood ratios (LR+), and negative likelihood ratios (LR−), were analyzed to determine optimal cutoff scores. LR + values greater than 5 indicate strong diagnostic utility, values between 2 and 5 suggest moderate utility, and LR− values less than 0.2 indicate a low risk of false negatives (48, 49). The overall accuracy of correctly classified cases was assessed, with optimal cutoff scores determined by maximizing the Youden’s index to ensure balanced diagnostic precision (47). In community-based primary screening contexts, minimizing false negatives is crucial, so alternative thresholds emphasizing higher sensitivity with acceptable trade-offs in specificity were also considered. The ROC analyses, incorporating AUC values, sensitivity, specificity, Youden’s index, likelihood ratios, and overall classification accuracy, provided comprehensive evidence for selecting optimal cutoff points and assessing the discriminative accuracy of the WHO-5-J and WHO-4-J across varying levels of depressive symptoms.
Descriptive statistics, reliability estimates, and correlation analyses were conducted using JASP (Version 0.19.3). EFA and CFA, including multi-group CFA, were performed using Mplus (Version 8.8). ROC analyses were conducted using IBM Statistical Package for the Social Sciences Statistics (Version 28.0.1.0).
3 Results
3.1 Descriptive statistics
Table 1 presents the descriptive statistics for each item in the WHO-5 questionnaire, along with the total scores for both WHO-5 and WHO-4. All items demonstrated acceptable levels of skewness and kurtosis, indicating their suitability for subsequent psychometric analyses. The total scores for WHO-4 and WHO-5 had distributions close to normal, with skewness values of −0.716 for WHO-5 and −0.709 for WHO-4, and kurtosis values of −0.014 for WHO-5 and −0.048 for WHO-4, supporting their use in parametric analyses (50).

Table 1. Descriptive statistics, item-total correlations, and internal consistency estimates for the WHO-5 and WHO-4 Items.
Tables 2, 3 present the frequency distributions of total scores for WHO-5 and WHO-4, respectively. Both tables revealed negatively skewed distributions, with a majority of students reporting high levels of psychological well-being. Around 57% of participants scored 12 or higher on WHO-5 (out of a maximum of 15), while approximately 63% scored 10 or higher on WHO-4 (out of a maximum of 12), indicating generally favorable psychological states in the sample. The amount of missing data was minimal (2.56% for WHO-5, 2.52% for WHO-4), further confirming the reliability of the data for subsequent analyses.
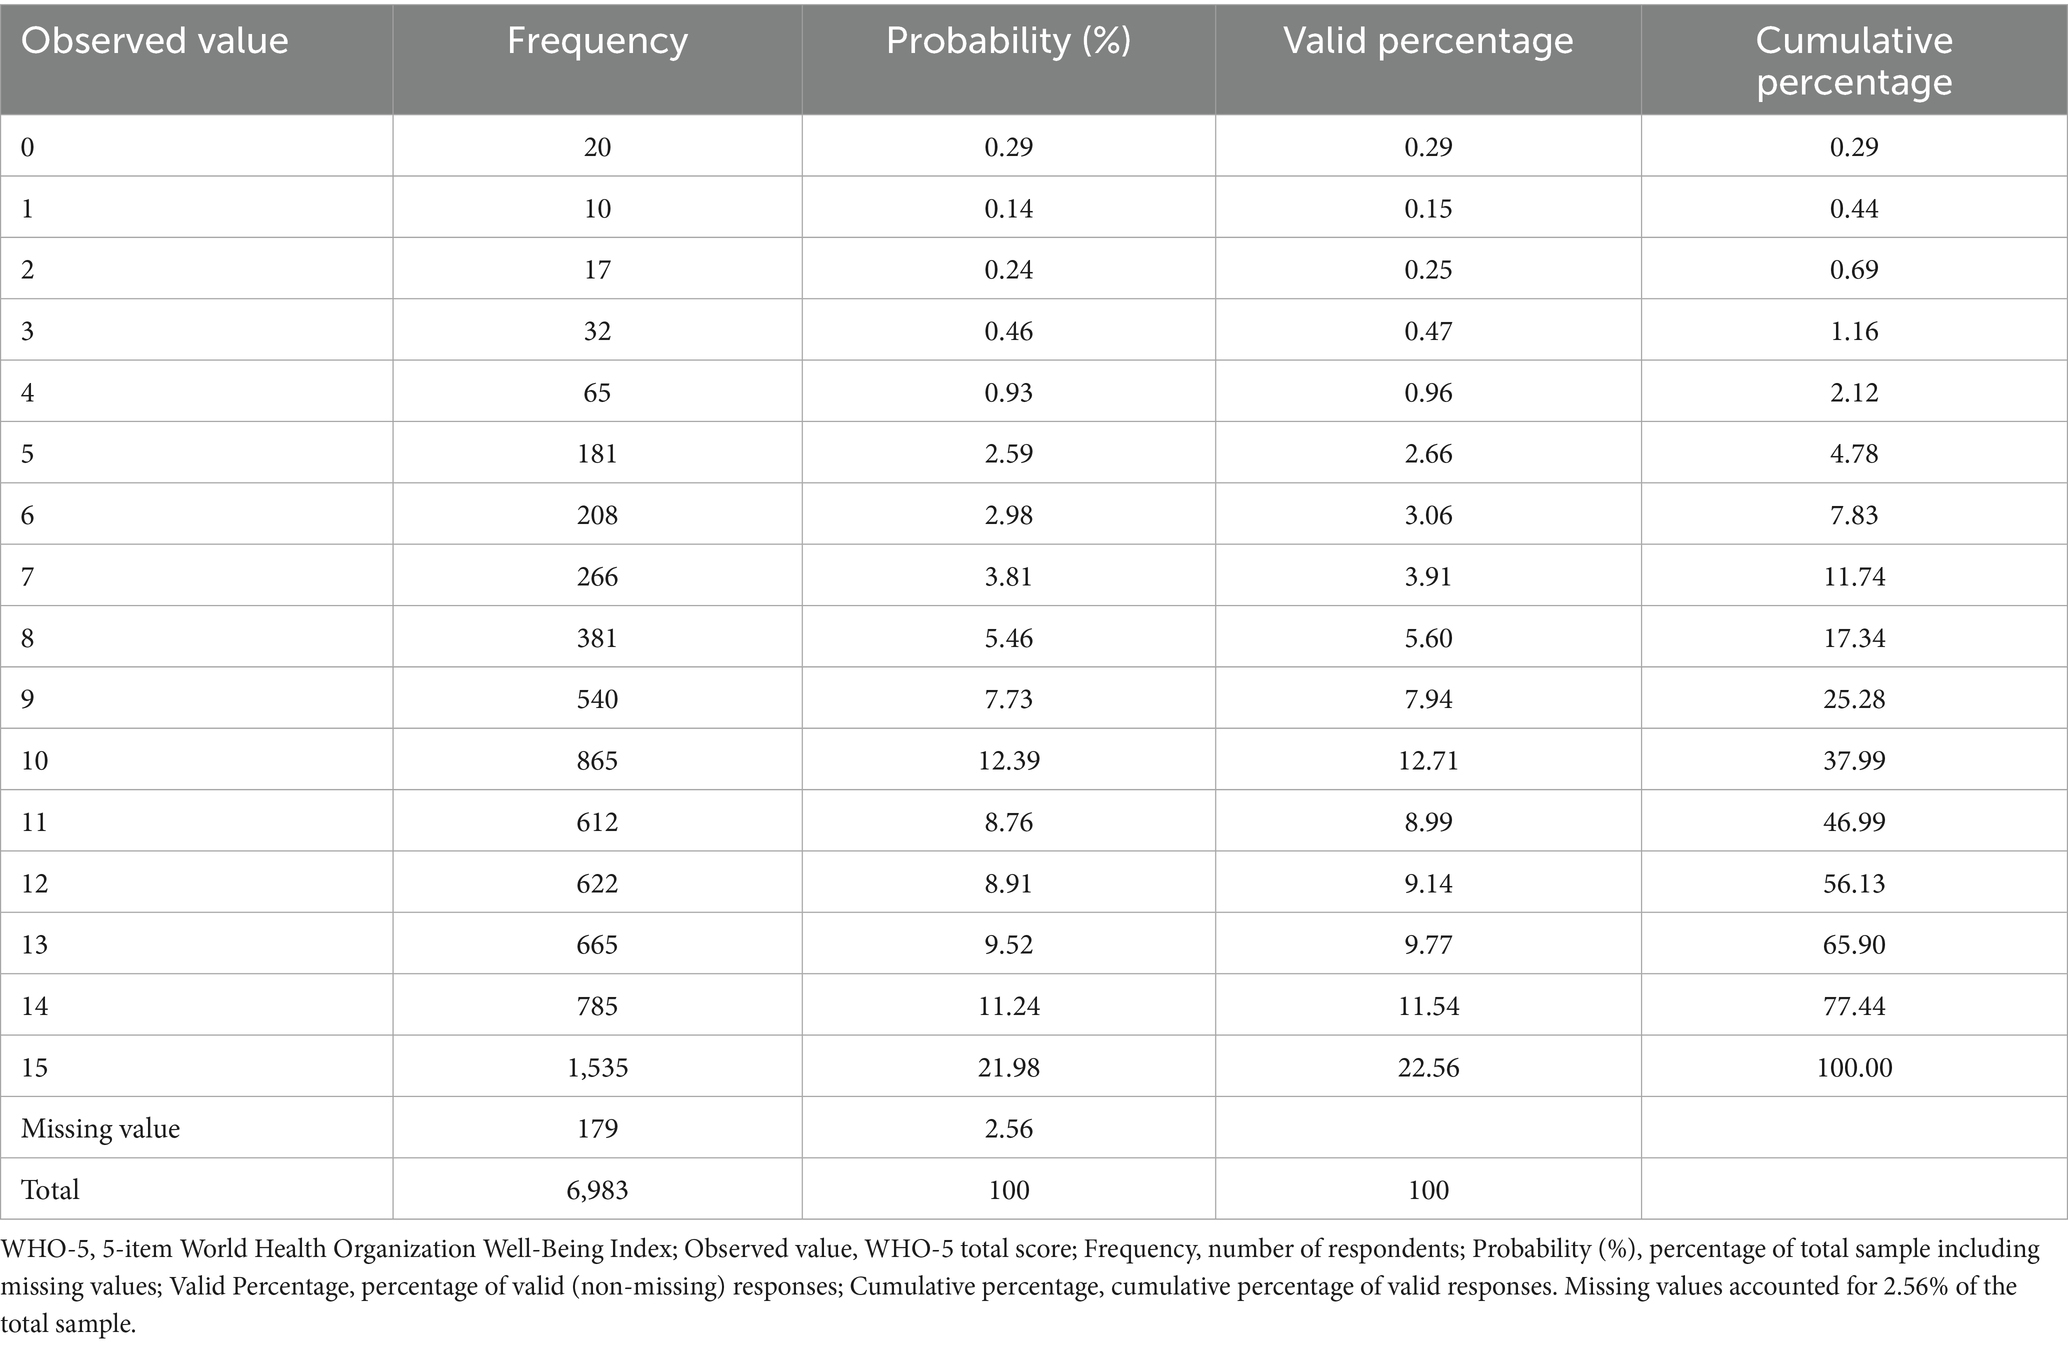
Table 2. Frequency distribution of WHO-5 total scores among Japanese school-aged children (n = 6,983).
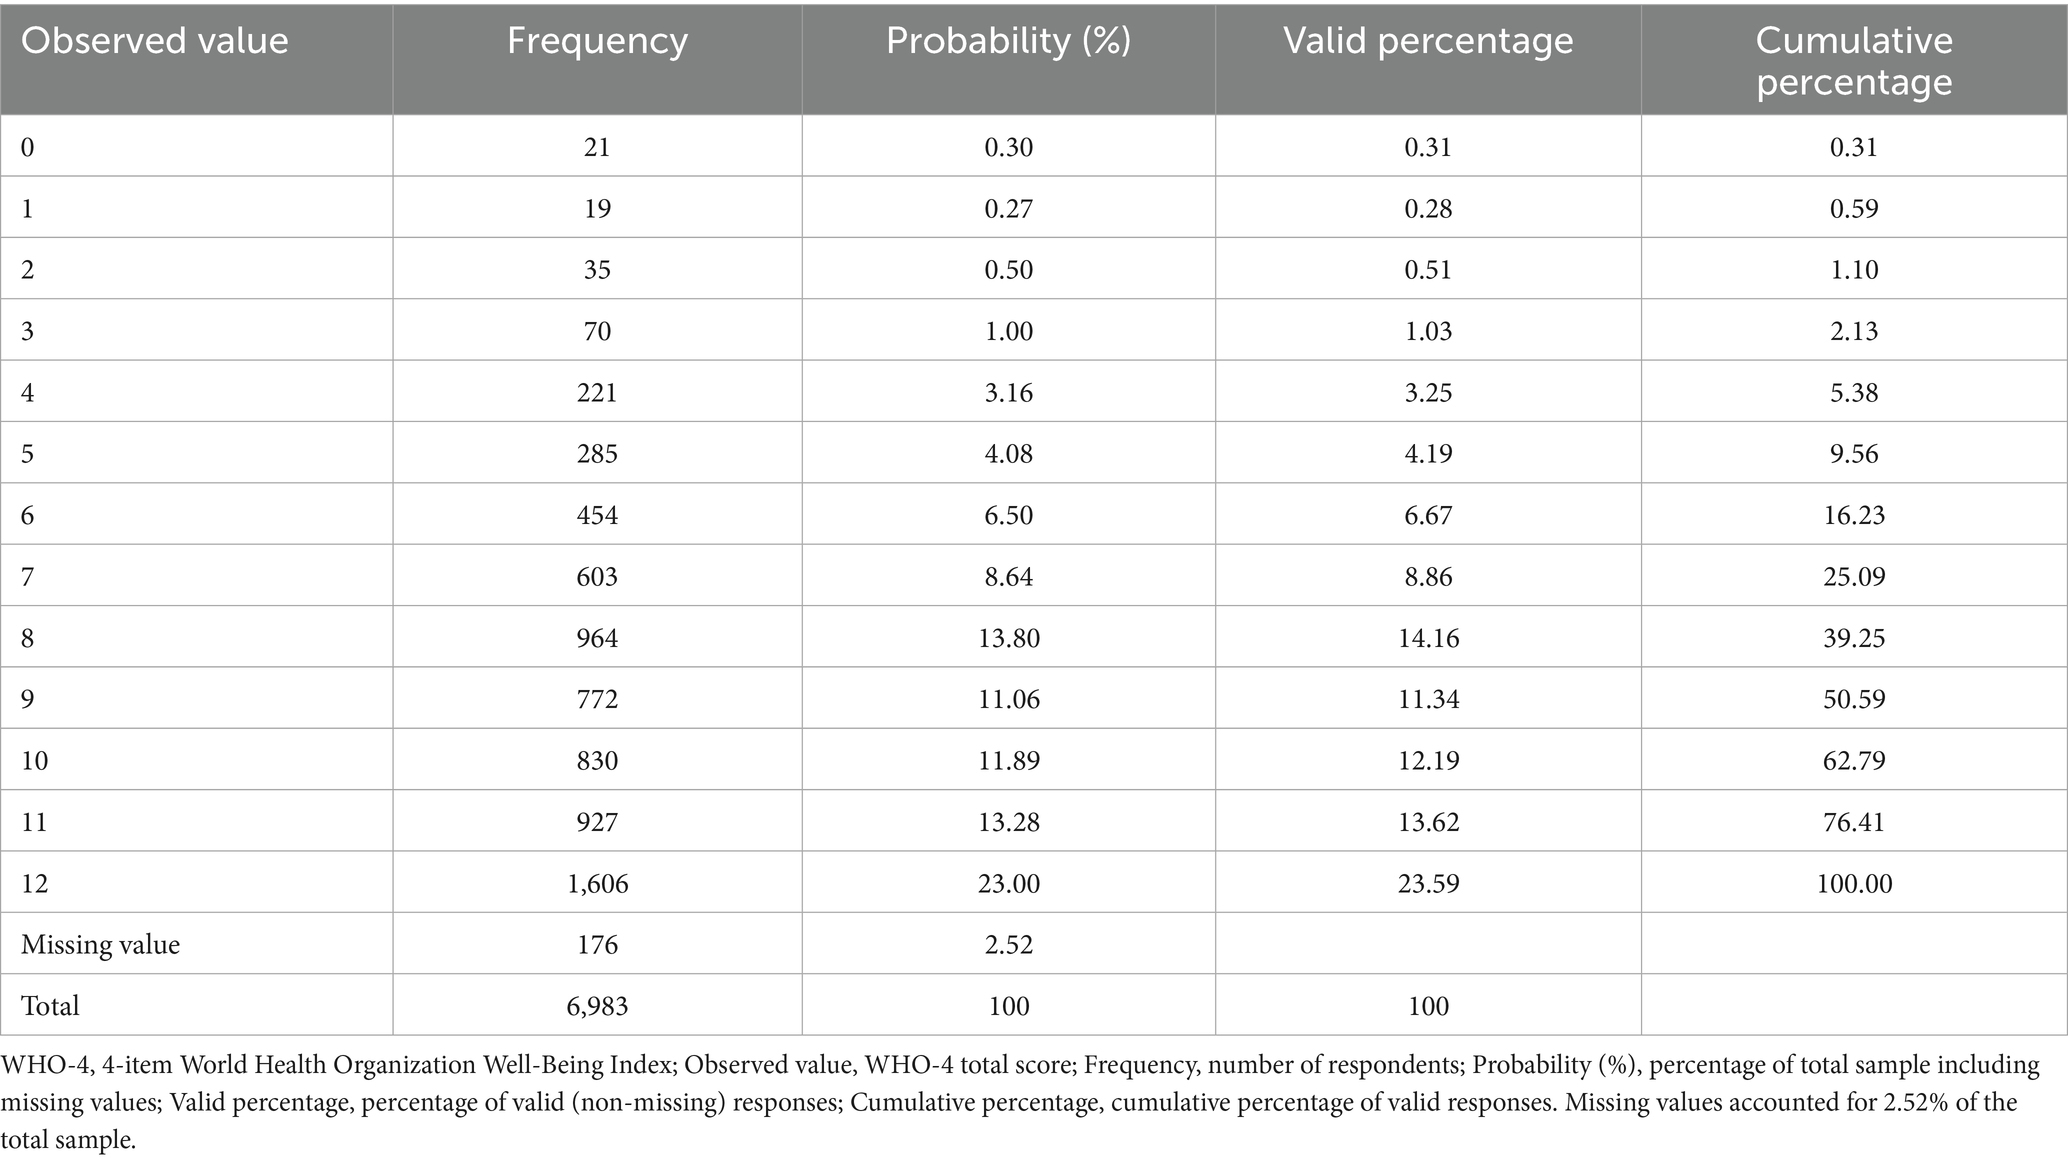
Table 3. Frequency distribution of WHO-4 total scores among Japanese school-aged children (n = 6,983).
3.2 Reliability and internal consistency
The WHO-5 scale demonstrated strong internal consistency, with a McDonald’s ω of 0.864 (95% confidence interval [CI]: 0.859–0.869) and a Cronbach’s α of 0.867 (95% CI: 0.862–0.872). Similarly, the WHO-4 scale had a McDonald’s ω of 0.813 (95% CI: 0.805–0.820) and a Cronbach’s α of 0.818 (95% CI: 0.810–0.824). Both scales exceeded the recommended threshold of 0.80 for reliability coefficients, indicating robust internal consistency (36). These reliability statistics are detailed in Table 4. Analysis of the impact of removing individual items from the WHO-5 scale revealed minor fluctuations in the reliability coefficients (α range: 0.818–0.868). Deleting the WHO4 item resulted in the highest reliability coefficient (α = 0.868), suggesting a slightly weaker contribution compared to the other items. However, the marginal impact of item deletion indicates that each item contributes meaningfully to the overall internal consistency of the scale, supporting the structural validity observed in previous studies (1, 8). Detailed results of the item analysis are presented in Table 1.

Table 4. Internal consistency and concurrent validity of WHO-5 and WHO-4 with PHQ-A and KIDSCREEN-10.
3.3 Exploratory factor analysis
The eigenvalues showed a clear “elbow,” supporting a dominant first factor (WHO-5: 3.763, 0.486, 0.333, 0.274, 0.143; WHO-4: 2.938, 0.464, 0.333, 0.265). A one-factor EFA provided acceptable-to-good fit for both scales [WHO-5: χ2(5) = 144.685, RMSEA = 0.076 (90% CI 0.066–0.087), CFI = 0.997, TLI = 0.994, SRMR = 0.023; WHO-4: χ2(2) = 69.614, RMSEA = 0.084 (0.068–0.101), CFI = 0.996, TLI = 0.989, SRMR = 0.023]. Consistent with prior recommendations, model evaluation relied on multiple indices (RMSEA with 90% CIs, CFI, TLI, SRMR) (43, 51); the slightly elevated RMSEA for WHO-4 is expected in short, low-df models and does not contradict the overall one-factor solution (45).
All factor loadings were significant (p < 0.001). Loadings ranged 0.701–0.945 for WHO-5 (highest on Item 1 = 0.945) and 0.724–0.861 for WHO-4, indicating a clear unidimensional structure in both versions. Because WHO-4 excludes the strongest-loading item, its maximum loading and explained variance are modestly lower, yet the scale retains adequate measurement precision. Full item-level estimates are provided in Table 5.
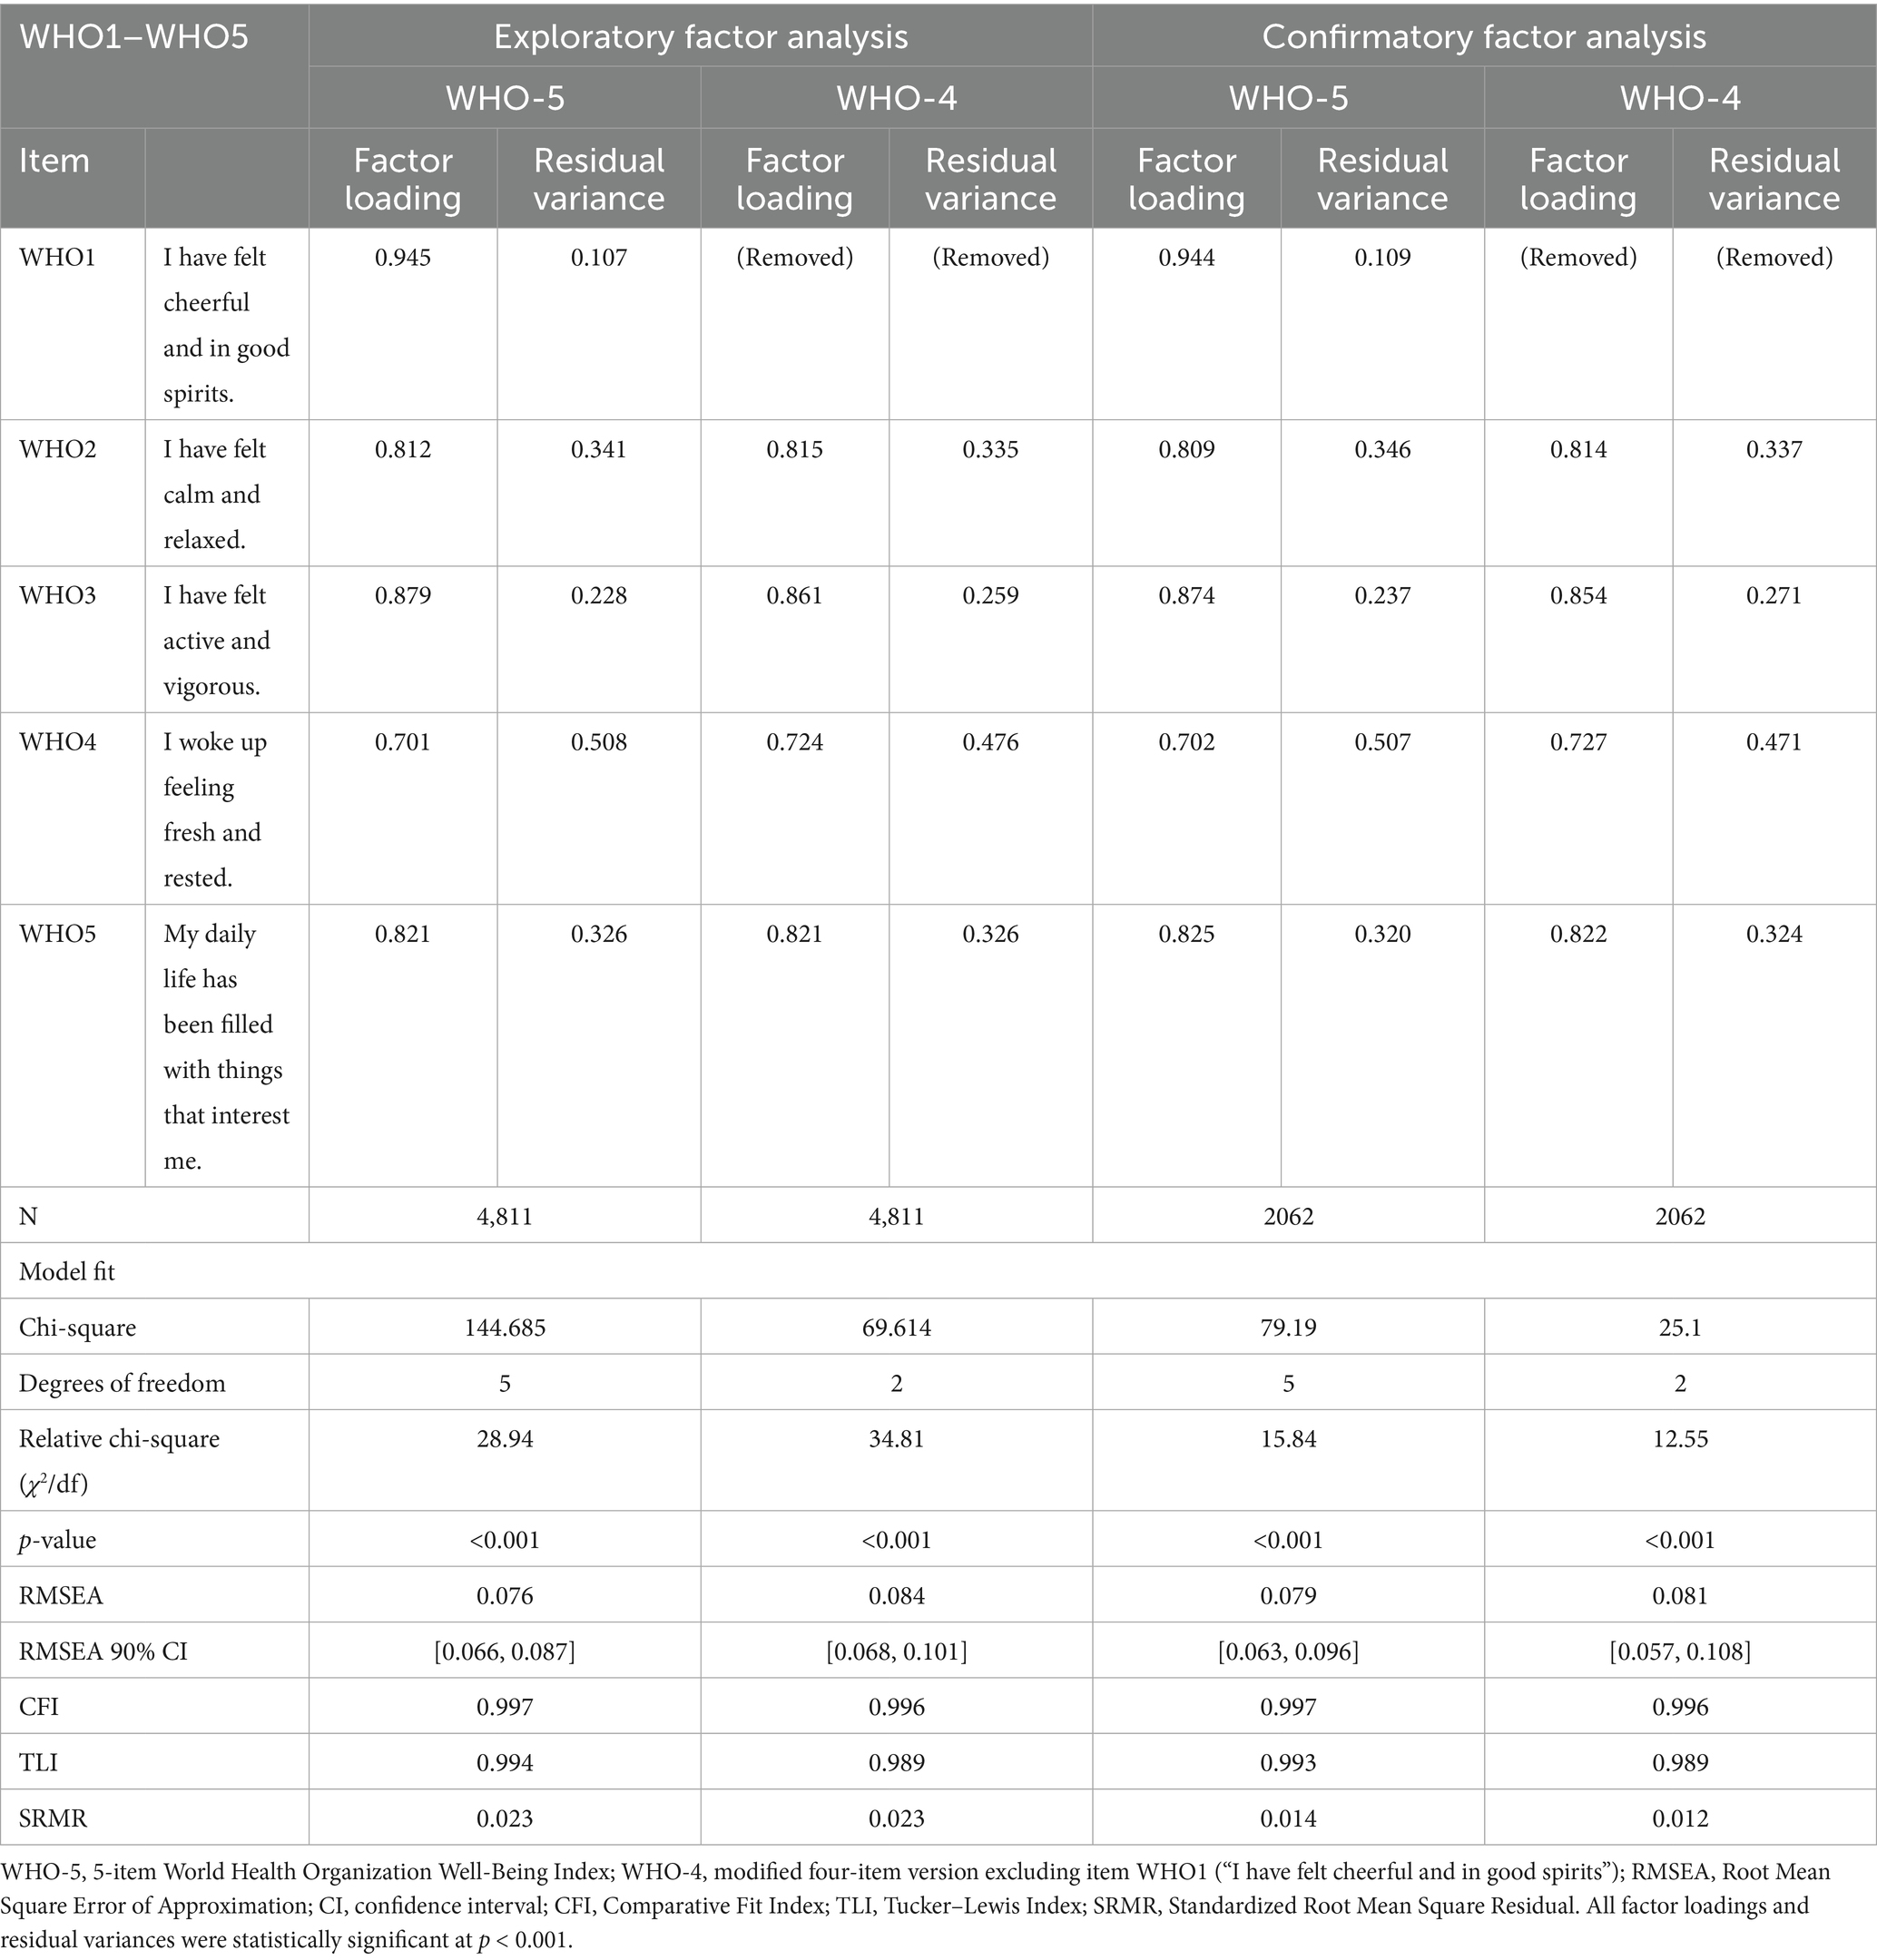
Table 5. Exploratory and confirmatory factor analysis of the WHO-5 and WHO-4 items among Japanese school-aged children.
3.4 Confirmatory factor analysis
The model fit indices indicated a good overall fit for both WHO-5 and WHO-4. For WHO-5, the chi-square statistic was 79.19 (df = 5, p < 0.001), RMSEA = 0.079 (90% CI: 0.063–0.096), CFI = 0.997, TLI = 0.993, and SRMR = 0.014. For WHO-4, the chi-square statistic was 25.1 (df = 2, p < 0.001), RMSEA = 0.081 (90% CI: 0.068–0.096), CFI = 0.996, TLI = 0.989, and SRMR = 0.012. Detailed model fit indices and factor loadings are presented in Table 5.
Although the RMSEA values for the WHO-4 model slightly exceed the conventional cutoff of 0.08 for an acceptable fit (38), previous research has indicated that RMSEA may be biased in models with low degrees of freedom (45), particularly when the number of indicators is fewer than 10, as in this study. Given the limited number of items in both WHO-5 and WHO-4, the slightly elevated RMSEA may not necessarily indicate a poor fit. Furthermore, the CFI and TLI values surpassed the widely accepted threshold of 0.95 for good model fit (43), and the SRMR values were well below the recommended cutoff of 0.08 (51), further supporting the adequacy of both models.
All standardized factor loadings were significant (p < 0.001), supporting a clear unidimensional structure in both versions. Consistent with the EFA, Item 1 showed the strongest loading in WHO-5; its exclusion accounts for the slightly lower maximum loading in WHO-4, while the short form retains adequate measurement precision. These findings suggest that while the WHO-4 scale remains a valid measure of well-being, the WHO-5 scale may offer a more robust representation of the construct due to the inclusion of WHO-1.
The R-square values were generally high for both scales, indicating strong measurement properties. WHO-5: R-square ranged 0.492 (Item 4)–0.893 (Item 1); residual variances were 0.107 (Item 1), 0.341 (Item 2), 0.228 (Item 3), 0.508 (Item 4), 0.326 (Item 5). WHO-4: R-square ranged 0.524 (Item 4)–0.741 (Item 3); residual variances were 0.335 (Item 2), 0.259 (Item 3), 0.476 (Item 4), 0.326 (Item 5). The higher R-square in WHO-5—especially for Item 1 (0.893)—indicates that omitting this strongest indicator in WHO-4 modestly reduces the maximum explained variance; nevertheless, WHO-4 maintains adequate explanatory power and remains a viable short form.
3.5 Measurement invariance of the WHO-5 and WHO-4 across grade groups
A stepwise measurement invariance analysis was conducted to determine if the WHO-5 and WHO-4 Well-Being Indexes function equivalently across elementary and junior high school students. The analysis assessed configural, metric, and scalar invariance models to evaluate the consistency of well-being measurements across grade groups. Results are summarized in Table 6.
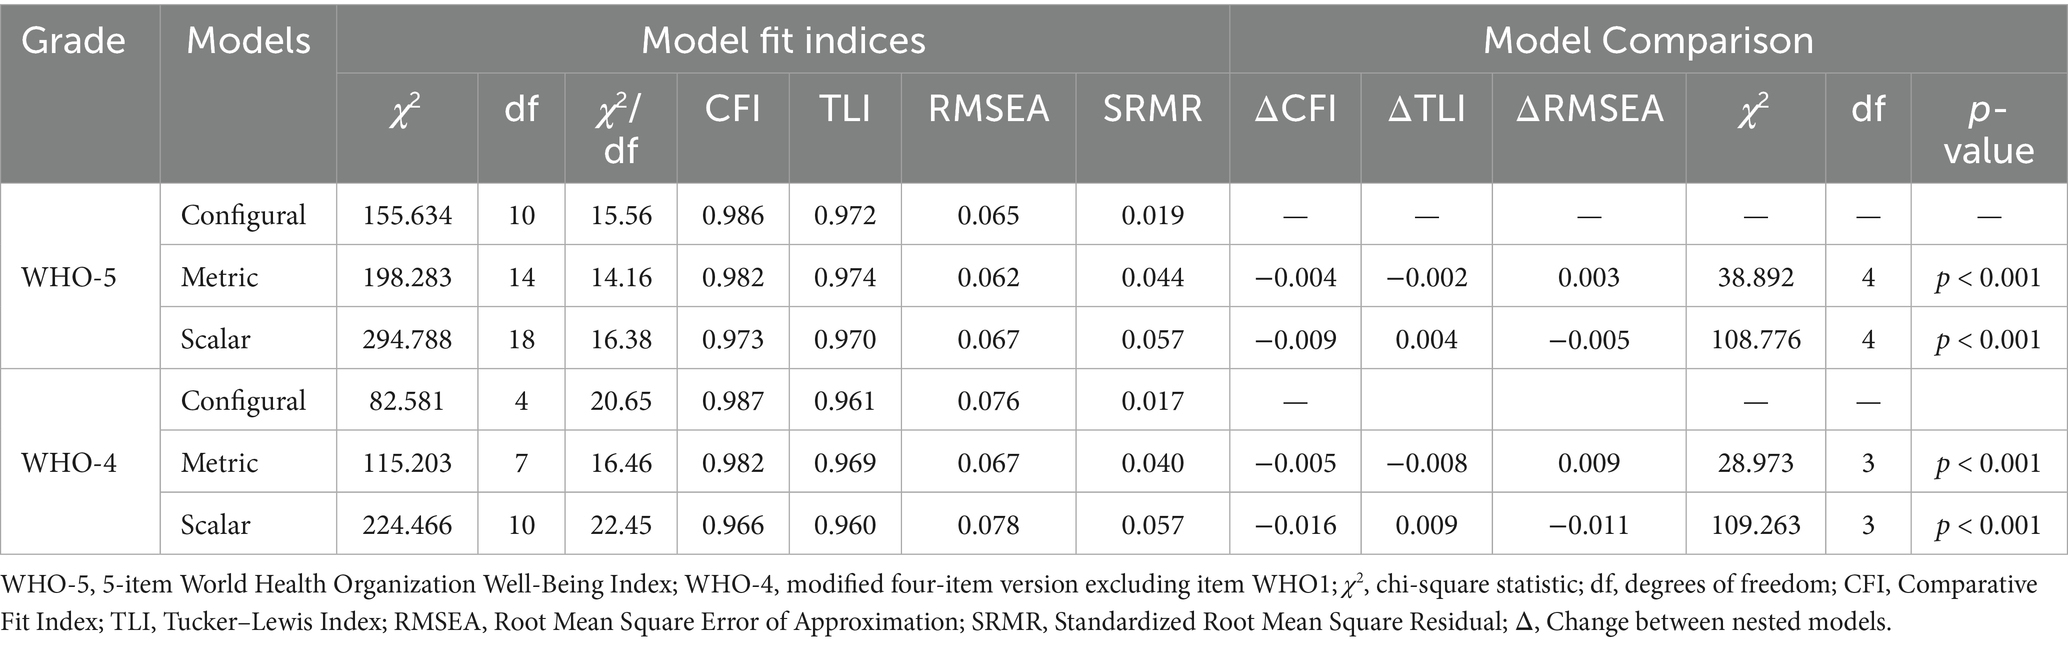
Table 6. Measurement invariance testing of WHO-5 and WHO-4 across grade levels in Japanese school-aged children.
The configural invariance model, which examined the overall factor structure of the WHO-5 and WHO-4 without imposing equality constraints, demonstrated an adequate fit. The WHO-5 model yielded a chi-square value of 155.634 (df = 10), RMSEA of 0.065 (90% CI: 0.056–0.074), CFI of 0.986, TLI of 0.972, and SRMR of 0.019, indicating that the single-factor model applied to both elementary and junior high school students. The WHO-4 model also demonstrated an acceptable fit with χ2(4) = 82.581, RMSEA = 0.076 (90% CI: 0.062–0.090), CFI = 0.987, TLI = 0.961, and SRMR = 0.017. These results suggest that well-being measurement was consistent across grade groups for both scales. However, the slightly higher RMSEA and lower TLI for the WHO-4 model may be due to the exclusion of WHO-1.
After establishing configural invariance, metric invariance was tested by constraining factor loadings to be equal across groups. For WHO-5, the chi-square difference test showed a significant difference between the metric and configural models [Δχ2(4) = 38.892, p < 0.001], but the overall model fit remained strong, with χ2(14) = 198.283, RMSEA = 0.062, CFI = 0.982, TLI = 0.974, and SRMR = 0.044. The change in CFI (ΔCFI = −0.004) was below the commonly used threshold of −0.01, supporting metric invariance. Similarly, for WHO-4, a significant difference was found between the metric and configural models [Δχ2(3) = 28.973, p < 0.001], with fit indices within acceptable limits [χ2(7) = 115.203, RMSEA = 0.067, CFI = 0.982, TLI = 0.969, SRMR = 0.040]. The change in CFI (ΔCFI = −0.005) further supports metric invariance, indicating that the relationships between the latent well-being construct and individual items were equivalent across grade groups for both WHO-5 and WHO-4.
Scalar invariance was assessed by constraining item intercepts to be equal across groups. For the WHO-5 scale, the chi-square difference test comparing the scalar and metric models showed a significant difference [Δχ2(4) = 108.776, p < 0.001]. However, the overall model fit remained acceptable, with χ2(18) = 294.788, RMSEA = 0.067, CFI = 0.973, TLI = 0.970, and SRMR = 0.057. The change in CFI (ΔCFI = −0.009) was within the −0.01 threshold, supporting full scalar invariance for meaningful comparisons of latent well-being across grade groups. In contrast, for the WHO-4 scale, the scalar model showed a significant decrease in fit compared to the metric model, with Δχ2(3) = 109.263, p < 0.001, and a CFI decline of −0.016, exceeding the recommended threshold. These results indicate that the WHO-4 scale does not fully meet the criteria for scalar invariance, indicating potential differences in response tendencies between elementary and junior high school students.
Overall, the results of measurement invariance analysis indicate that the WHO-5 scale offers a more stable and generalizable assessment of well-being across different grade levels, meeting the criteria for full scalar invariance. In contrast, the WHO-4 scale only demonstrated partial scalar invariance, implying that score differences may not solely reflect variations in latent well-being but could be influenced by variations in item response patterns among grade groups. This implies that adjustments for partial scalar invariance may be needed to ensure the comparability of latent means when using the WHO-4 scale. The slightly higher RMSEA values observed in all models for the WHO-4 scale indicate that the removal of WHO-1 may have impacted the scale’s structural integrity. Therefore, the WHO-5 scale appears to be a more robust and reliable measure for assessing well-being in elementary and junior high school students.
3.6 Measurement invariance of WHO-5 and WHO-4 across gender groups
To assess the comparability of the WHO-5 and WHO-4 Well-Being Index across gender groups, a series of measurement invariance tests were conducted. The analysis followed a hierarchical approach, assessing the configural, metric, and scalar invariance models sequentially. The results are summarized in Table 7.
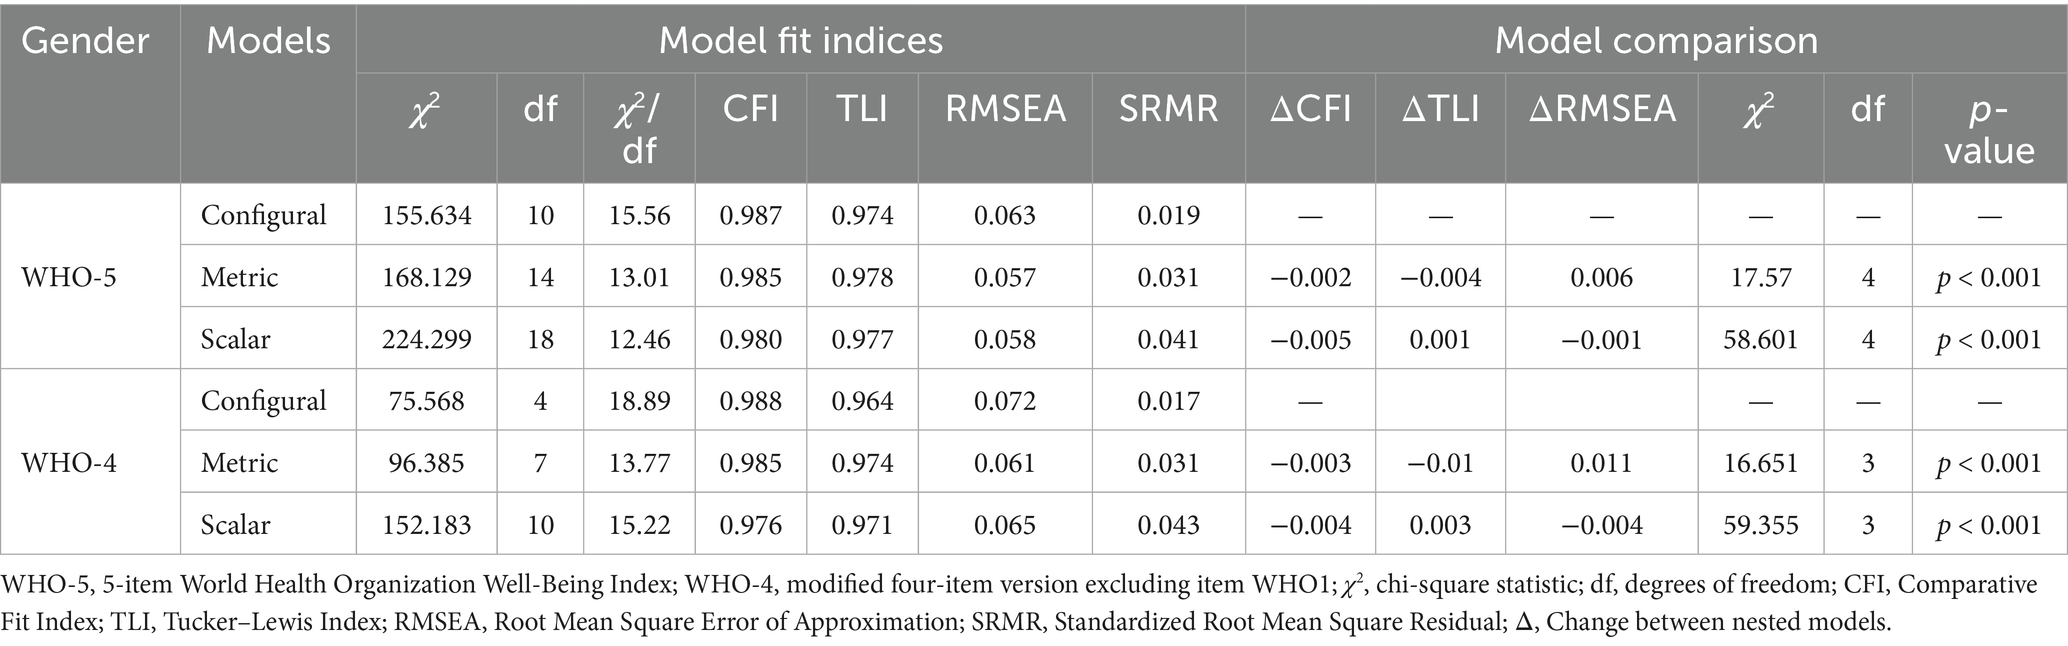
Table 7. Measurement invariance testing of WHO-5 and WHO-4 across gender groups in Japanese school-aged children.
The configural invariance model demonstrated an adequate fit for both the WHO-5 and WHO-4. The WHO-5 model showed a chi-square value of 155.634 (df = 10), RMSEA = 0.063 (90% CI: 0.054–0.072), CFI = 0.987, TLI = 0.974, and SRMR = 0.019, confirming that the single-factor structure applied to both males and females. Similarly, the WHO-4 model exhibited acceptable fit indices, with χ2(4) = 75.568, RMSEA = 0.072 (90% CI: 0.059–0.087), CFI = 0.988, TLI = 0.964, and SRMR = 0.017. These findings indicate that the latent well-being construct is similarly structured across gender groups in both versions of the scale.
To examine whether the factor loadings were equivalent across gender groups, metric invariance was examined by constraining the factor loadings to be equal. For the WHO-5 model, the chi-square difference test comparing the metric and configural models yielded a significant result [Δχ2(4) = 17.57, p < 0.001]. However, the overall model fit remained strong, with χ2(14) = 168.129, RMSEA = 0.057 (90% CI: 0.049–0.065), CFI = 0.985, TLI = 0.978, and SRMR = 0.031. The change in CFI (ΔCFI = −0.002) was below the commonly accepted threshold of −0.01, supporting metric invariance. Similarly, for the WHO-4 model, metric invariance was supported despite a significant chi-square difference [Δχ2(3) = 16.651, p = 0.0008], as the model fit indices remained within an acceptable range χ2(7) = 96.385, RMSEA = 0.061 (90% CI: 0.051–0.072), CFI = 0.985, TLI = 0.974, SRMR = 0.031, with a ΔCFI = −0.003. These results indicate that the relationships between the latent well-being factor and individual items were equivalent across gender groups in both the WHO-5 and WHO-4 models.
Finally, scalar invariance was tested by constraining item intercepts to be equal across gender groups. For the WHO-5 scale, the chi-square difference test comparing the scalar and metric models was statistically significant [Δχ2(4) = 58.601, p < 0.001]. However, the overall model fit remained acceptable, with χ2(18) = 224.299, RMSEA = 0.058 (90% CI: 0.051–0.065), CFI = 0.980, TLI = 0.977, and SRMR = 0.041. The change in CFI (ΔCFI = −0.005) did not exceed the −0.01 threshold, supporting full scalar invariance. Similarly, for the WHO-4 scale, the scalar invariance model also showed a significant chi-square difference [Δχ2(3) = 59.355, p < 0.001], but the changes in CFI (ΔCFI = −0.004) remained within an acceptable range. The final model fit for the WHO-4 scale was χ2(10) = 152.183, RMSEA = 0.065 (90% CI: 0.056–0.074), CFI = 0.976, TLI = 0.971, and SRMR = 0.043. These findings indicate that both the WHO-5 and WHO-4 scales meet the criteria for full scalar invariance.
Overall, these findings suggest that both the WHO-5 and WHO-4 scales demonstrate full scalar invariance across gender groups, enabling direct comparisons of latent well-being scores between males and females. The stability of the CFI and the minor impact on RMSEA values further support the robustness of these measures. The achievement of full scalar invariance by both scales suggests that any observed mean differences in well-being scores between genders reflect true differences in the latent construct rather than measurement artifacts. These findings underscore the suitability of both the WHO-5 and WHO-4 scales for gender-based comparisons of well-being, providing strong empirical evidence for their measurement equivalence.
3.7 Convergent validity
To assess convergent validity, Pearson’s correlation coefficients were computed between the WHO-5, WHO-4, and relevant constructs. The WHO-5 scale exhibited a strong correlation with the WHO-4 scale (r = 0.990), a negative correlation with depressive symptoms (PHQ-A; r = −0.603), and a positive correlation with subjective well-being (KIDSCREEN-10; r = 0.757). Similarly, the WHO-4 scale was negatively correlated with PHQ-A (r = −0.598) and positively correlated with KIDSCREEN-10 (r = 0.741). Based on Cohen’s criteria (52), these coefficients reflect large effect sizes, supporting the convergent validity of both the WHO-5 and WHO-4 scales. Detailed correlation coefficients and confidence intervals are presented in Table 4.
3.8 Receiver operating characteristic curve analysis
The ROC analysis results, as summarized in Table 8 and illustrated in Figures 1–3, indicated that both the WHO-4 and WHO-5 scales demonstrated strong discriminative accuracy in identifying depression across various severity levels (moderate, moderately severe, and severe). For moderate depression, the AUC was 0.84 (95% CI: 0.82–0.85) for WHO-4 and 0.84 (95% CI: 0.82–0.85) for WHO-5; the paired DeLong test indicated no significant difference (ΔAUC = 0.00, 95% CI: −0.01–0.01, p > 0.05). This is consistent with the classic interpretation that substantial overlap of 95% confidence intervals rarely implies a statistically significant difference (53).
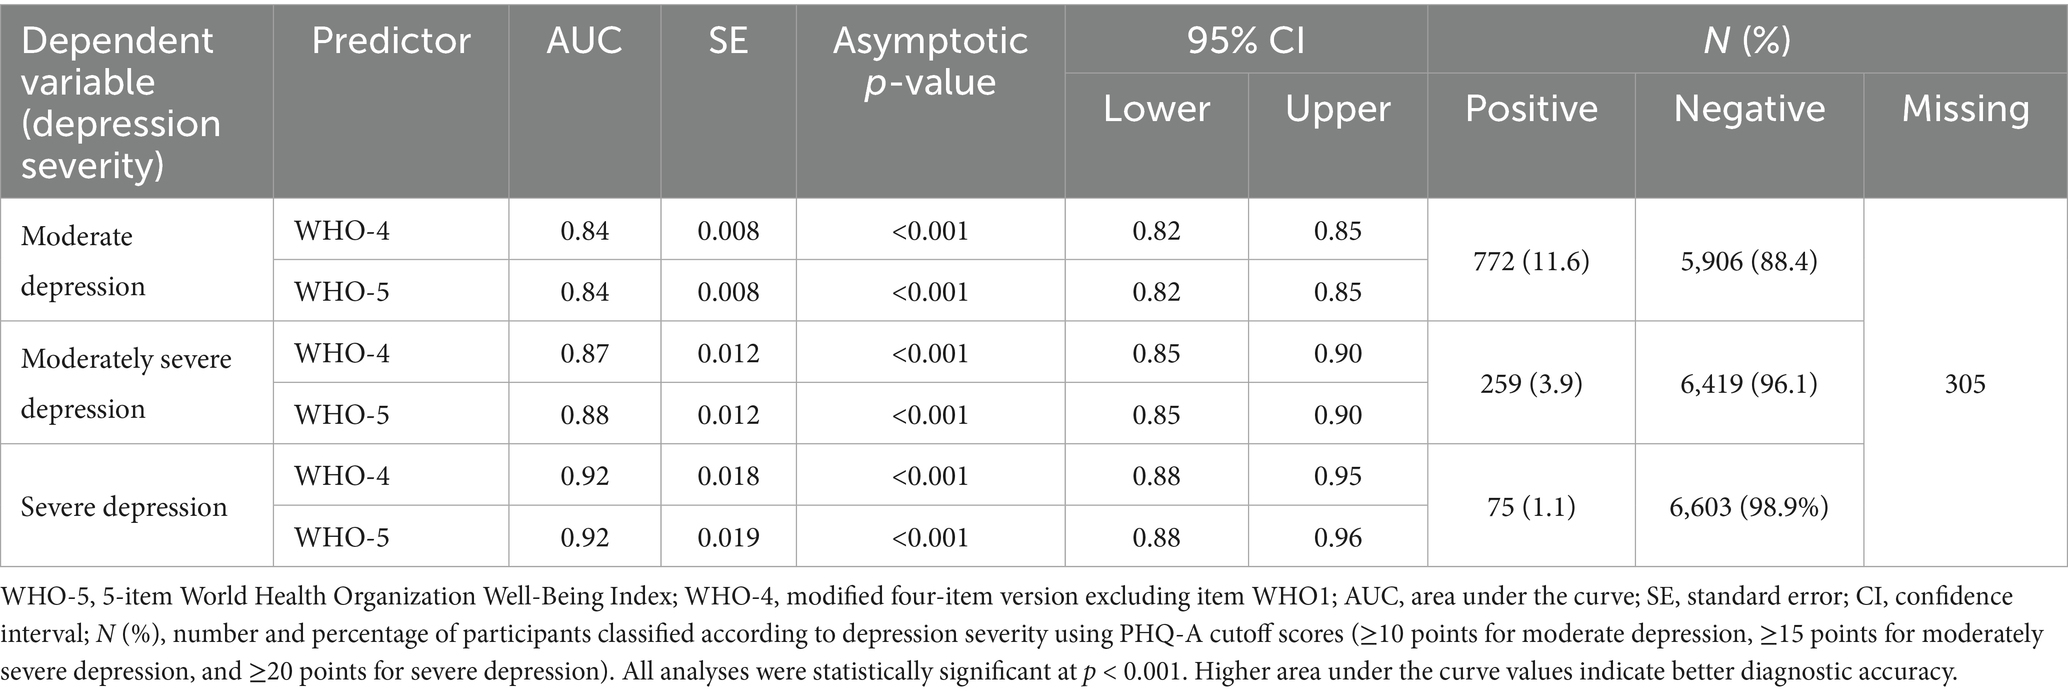
Table 8. Diagnostic accuracy of WHO-4 and WHO-5 for detecting different levels of depression severity in Japanese school-aged children.
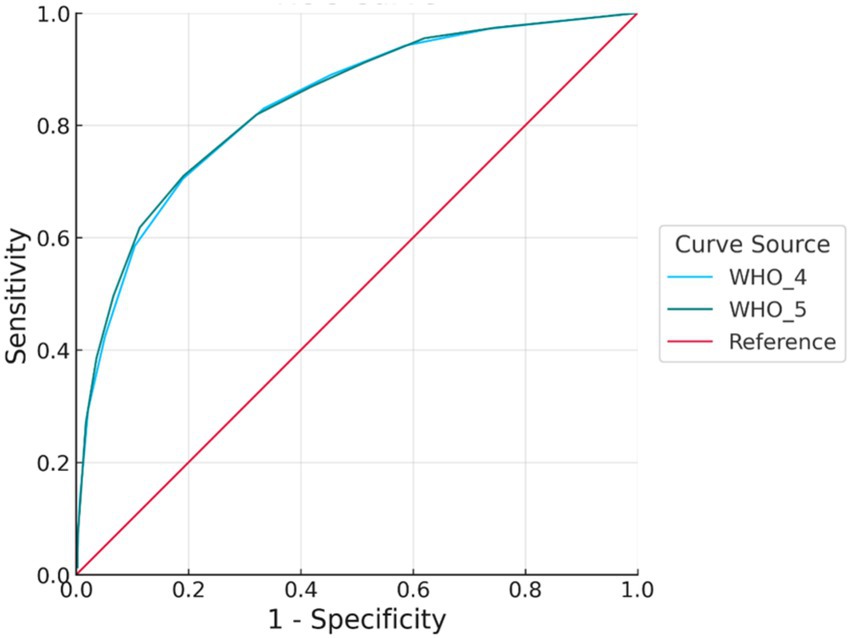
Figure 1. ROC curve for moderate depression. Receiver operating characteristic (ROC) curves for the WHO-4 and WHO-5 well-being indices in detecting moderate depression. The x-axis represents the false positive rate (1 − specificity), and the y-axis represents the true positive rate (sensitivity). The WHO-5 showed marginally better discriminative performance than the WHO-4, though the difference was minimal. ROC, receiver operating characteristic; WHO-4, 4-item version of the World Health Organization-Five Well-Being Index; WHO-5, 5-item version of the World Health Organization-Five Well-Being Index; AUC, area under the curve.
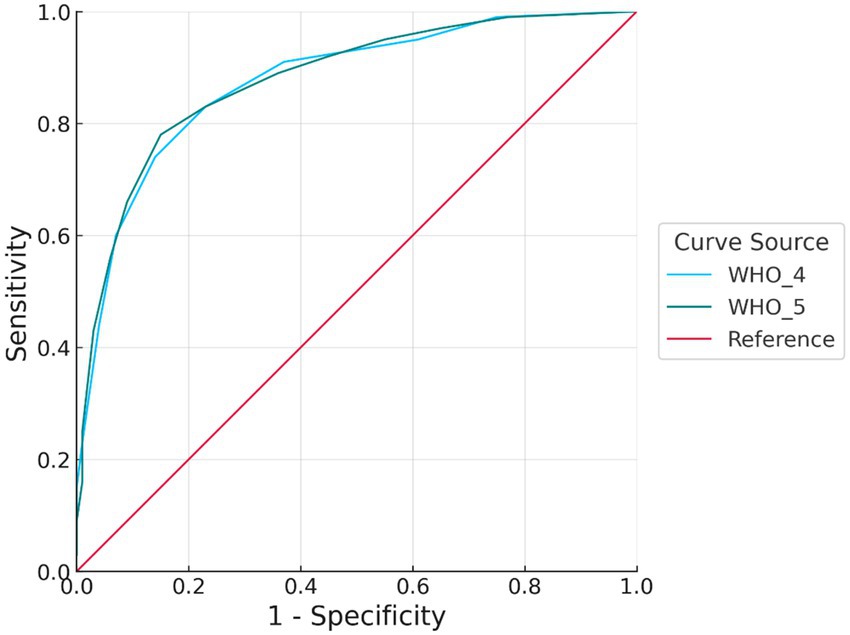
Figure 2. ROC curve for moderately severe depression. Both WHO-4 and WHO-5 demonstrated high discriminative ability, with ROC curves approaching the upper left corner. WHO-5 showed slightly better sensitivity at comparable levels of specificity, suggesting a marginal advantage in identifying moderately severe depressive symptoms. ROC, receiver operating characteristic; WHO-4, 4-item version of the World Health Organization-Five Well-Being Index; WHO-5, 5-item version of the World Health Organization-Five Well-Being Index; AUC, area under the curve.
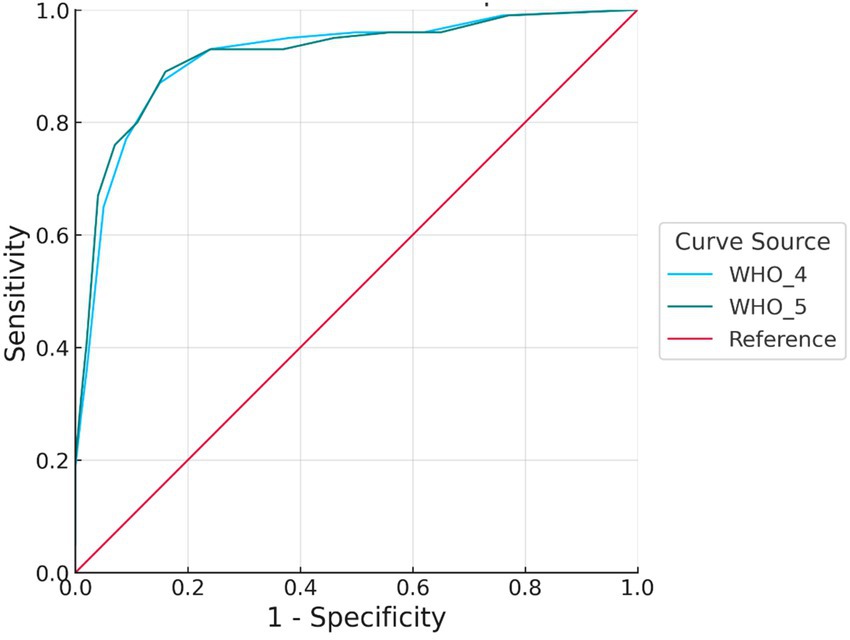
Figure 3. ROC curve for severe depression. Both WHO-4 and WHO-5 demonstrated high accuracy, particularly at lower false positive rates. WHO-5 exhibited slightly higher sensitivity than WHO-4 across several cut points, suggesting its potential advantage in screening for severe depressive symptoms. ROC, receiver operating characteristic; WHO-4, 4-item version of the World Health Organization-Five Well-Being Index; WHO-5, 5-item version of the World Health Organization-Five Well-Being Index; AUC, area under the curve.
A similar trend was observed for moderately severe depression, with an AUC of 0.87 (95% CI: 0.85–0.90) for WHO-4 and 0.88 (95% CI: 0.85–0.90) for WHO-5; the paired DeLong test indicated no significant difference (ΔAUC = 0.01, 95% CI: −0.00–0.02, p > 0.05). Although WHO-5 showed slightly higher accuracy, the substantial overlap of the confidence intervals and the very small ΔAUC indicate that the difference is not statistically or clinically meaningful.
In the case of severe depression, both scales demonstrated very high discriminative performance, with an AUC of 0.92 (95% CI: 0.88–0.95) for WHO-4 and an AUC of 0.92 (95% CI: 0.88–0.96) for WHO-5; the paired DeLong test indicated no significant difference (ΔAUC = 0.00, 95% CI: −0.02–0.02, p > 0.05). At this severity level, the accuracy of the two scales was nearly identical, with no meaningful differences.
Overall, the WHO-5 scale consistently exhibited slightly higher discriminative accuracy than the WHO-4 scale across all levels of depression severity, although these differences were not statistically significant. Both scales demonstrate practical effectiveness in identifying depression. The WHO-4 scale could be sufficiently useful as a general screening tool for broadly detecting depressive symptoms; however, the WHO-5 scale may be preferred in situations where specificity and minimizing false positives are crucial. In clinical settings, the choice between the WHO-4 and WHO-5 scales should be based on the specific screening objectives and the required diagnostic accuracy (46).
To address potential heterogeneity in measurement precision by developmental stage, we additionally conducted age-stratified ROC analyses (Elementary: Grades 4–6; Junior-high: Grades 7–9). For both WHO-4 and WHO-5, discrimination remained good to excellent within each stratum, and the 95% confidence intervals of the AUCs overlapped across age groups. On this basis, we proceeded with pooled analyses for subsequent models. Stratum-specific AUCs and case/control counts are provided in the Supplementary Tables.
3.9 Optimal cutoff points for the WHO-4 and WHO-5 scales by depression severity
Optimal cutoff points for detecting depression at different severity levels (moderate, moderately severe, and severe) using WHO-4 and WHO-5 scales were determined based on sensitivity, specificity, Youden’s index, LR+, LR−, and overall classification accuracy (46, 47, 53). The detailed results are summarized in Table 9.
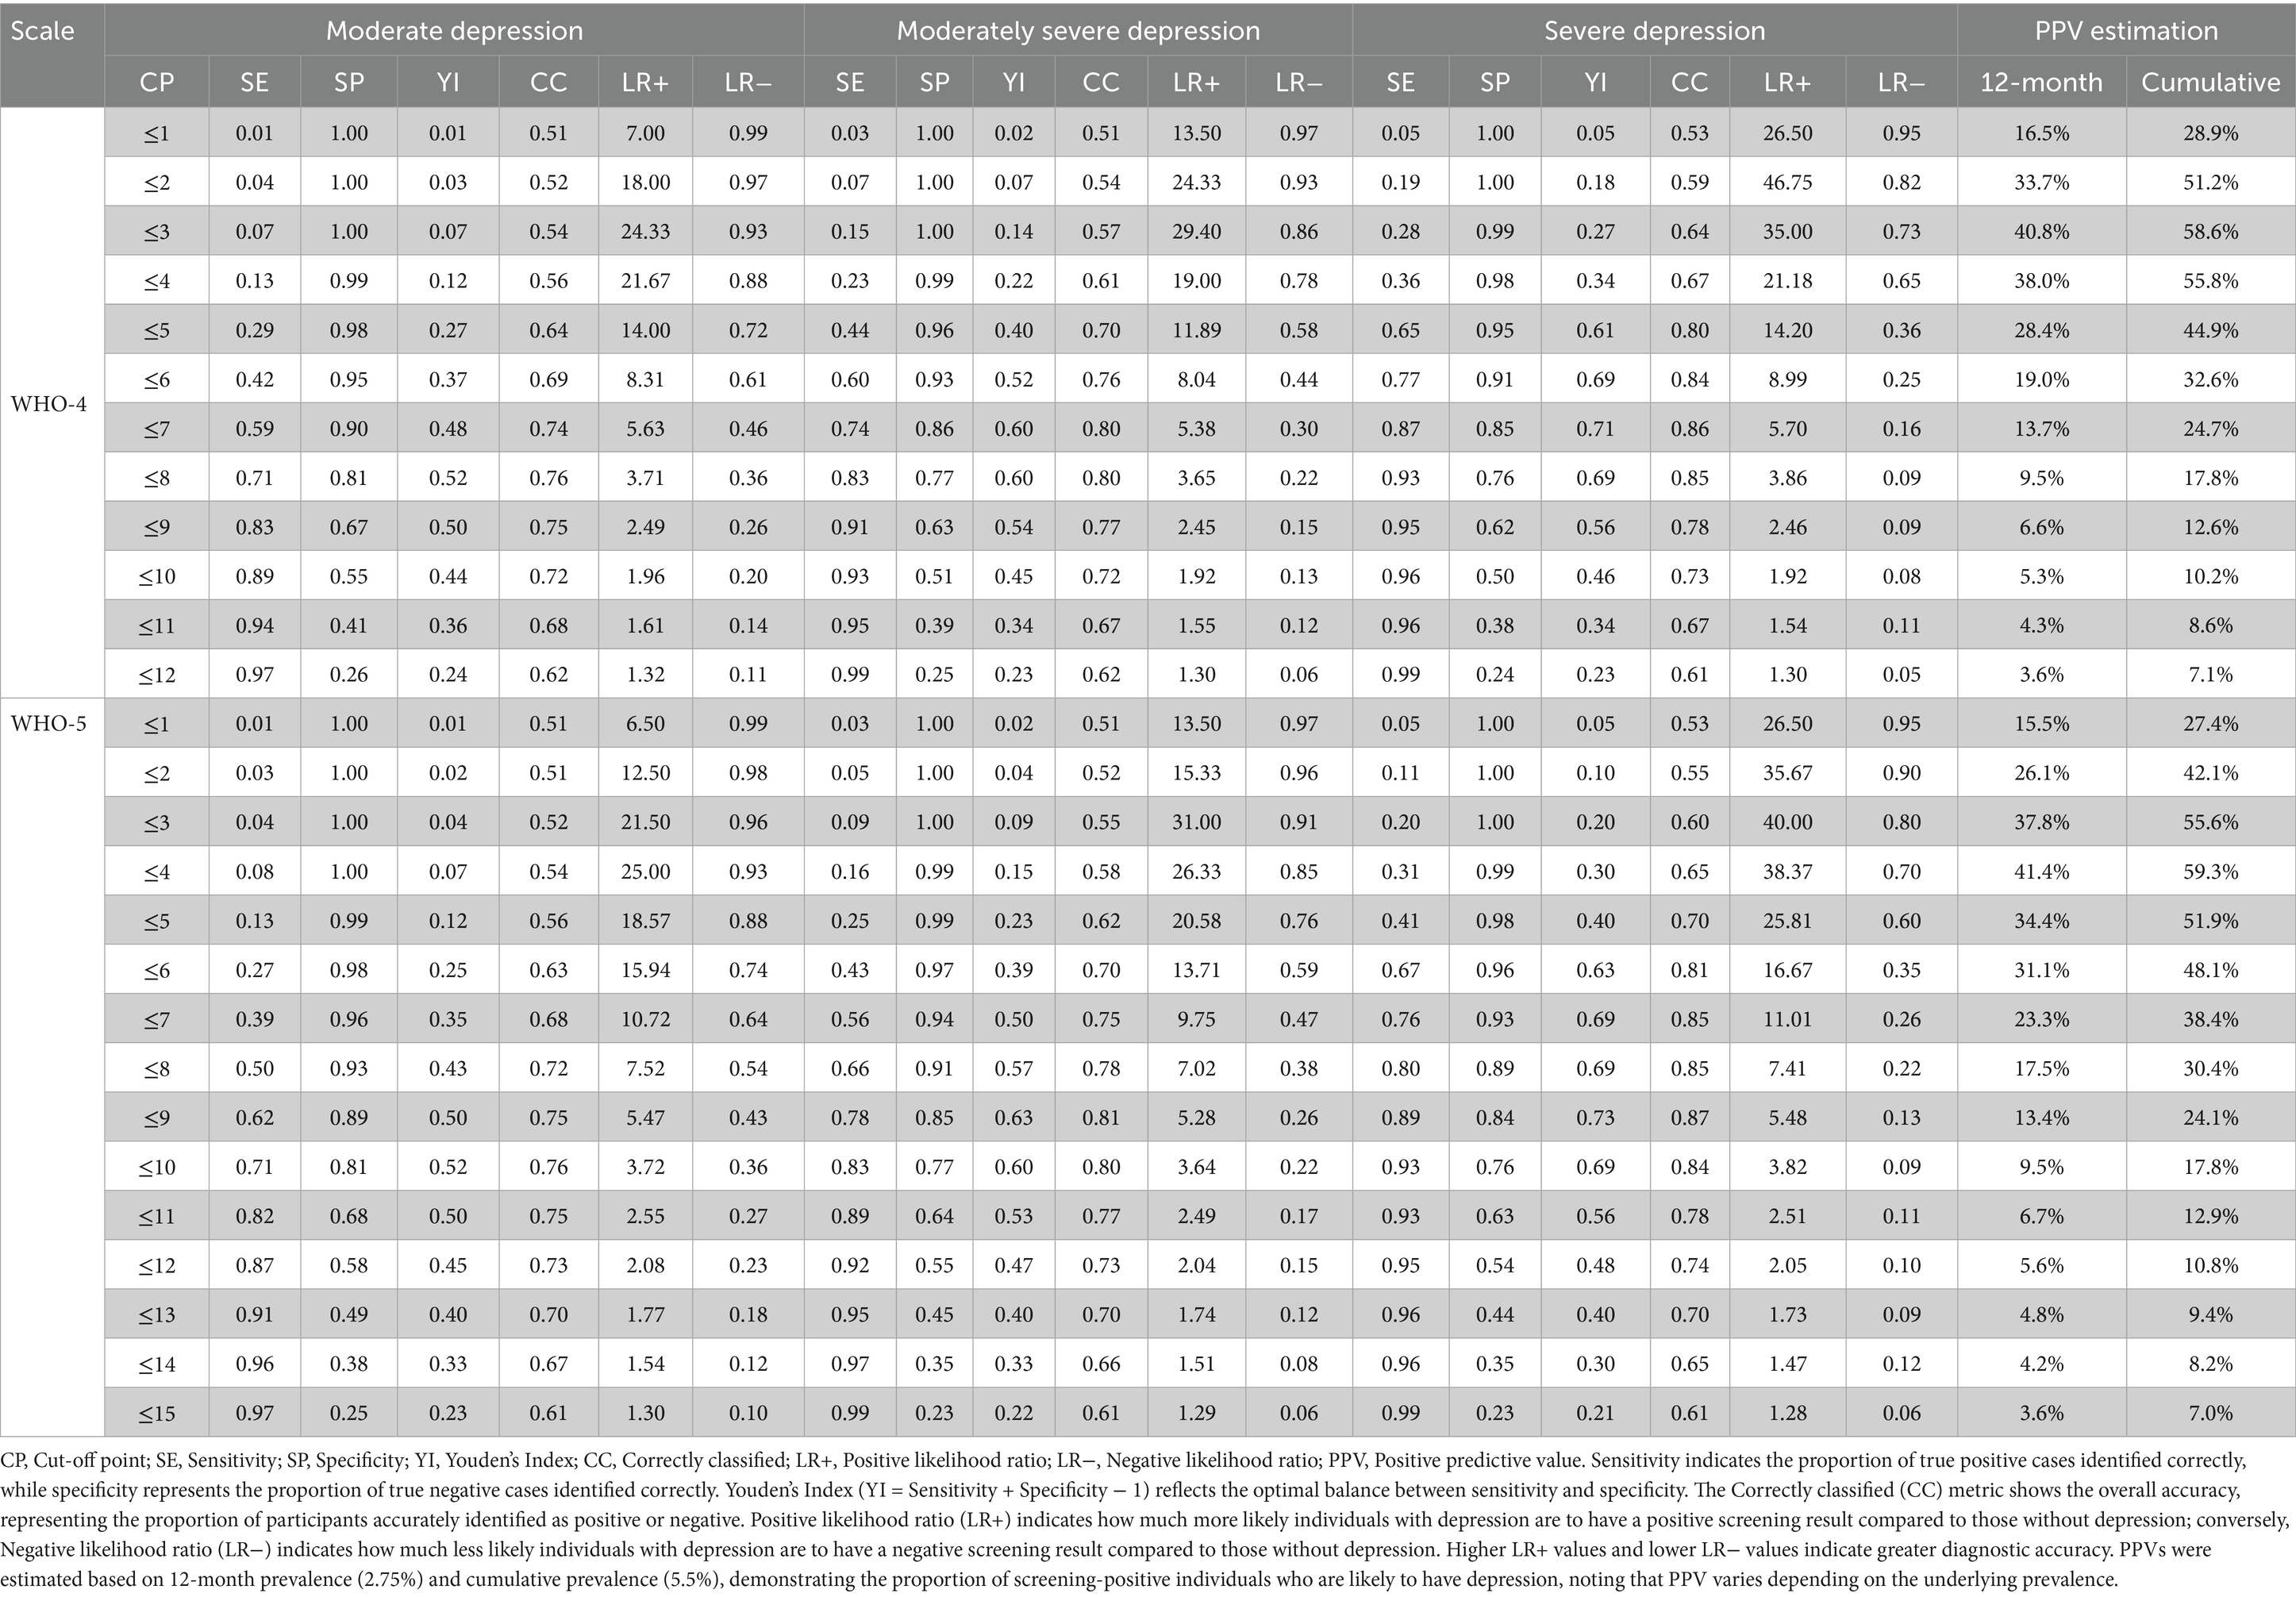
Table 9. Sensitivity, specificity, likelihood ratios, and positive predictive values of WHO-4 and WHO-5 at various cut-off points for detecting moderate, moderately severe, and severe depression among Japanese school-aged Children.
For moderate depression, the recommended clinical screening thresholds were set at ≤8 points for WHO-4 (sensitivity = 0.71, specificity = 0.81, Youden’s index = 0.52, correctly classified = 76%, LR+ = 3.71, LR− = 0.36) and ≤10 points for WHO-5 (sensitivity = 0.71, specificity = 0.81, Youden’s index = 0.52, correctly classified = 76%, LR+ = 3.72, LR − = 0.36). Both thresholds demonstrated balanced diagnostic utility suitable for clinical and general screening contexts (48, 49).
For moderately severe depression, the optimal thresholds were slightly higher, at ≤7 points for WHO-4 (sensitivity = 0.74, specificity = 0.86, Youden’s index = 0.60, correctly classified = 80%, LR+ = 5.38, LR− = 0.30) and ≤9 points for WHO-5 (sensitivity = 0.78, specificity = 0.85, Youden’s index = 0.63, correctly classified = 81%, LR+ = 5.28, LR− = 0.26). These thresholds provided improved diagnostic accuracy, featuring strong likelihood ratios and acceptable false-negative rates (53).
For severe depression, the identified optimal thresholds were also ≤7 points for WHO-4 (sensitivity = 0.87, specificity = 0.85, Youden’s index = 0.71, correctly classified = 86%, LR+ = 5.70, LR− = 0.16) and ≤9 points for WHO-5 (sensitivity = 0.89, specificity = 0.84, Youden’s index = 0.73, correctly classified = 87%, LR+ = 5.48, LR− = 0.13). These thresholds yielded excellent diagnostic accuracy with minimal false negatives, making them particularly suitable for identifying severe cases requiring immediate intervention (46, 53).
In practical scenarios like community-based primary screening, where high sensitivity is prioritized to minimize the risk of missed cases (false negatives), the recommended cutoff points were adjusted slightly upward (toward higher scores) to ensure greater sensitivity, accepting minor reductions in specificity. Specifically, for moderate depression, the recommended thresholds were adjusted to ≤9 points for WHO-4 (sensitivity = 0.83, specificity = 0.67) and ≤11 points for WHO-5 (sensitivity = 0.82, specificity = 0.68). For moderately severe depression, thresholds of ≤8 points for WHO-4 (sensitivity = 0.83, specificity = 0.77) and ≤10 points for WHO-5 (sensitivity = 0.83, specificity = 0.77) were recommended. In the context of severe depression, community-based screening thresholds were similarly set at ≤8 points for WHO-4 (sensitivity = 0.93, specificity = 0.76) and ≤10 points for WHO-5 (sensitivity = 0.93, specificity = 0.76), providing excellent sensitivity for early identification in broader community settings (48, 49).
Based on a comprehensive analysis of various severity levels and considering sensitivity, specificity, and overall accuracy, it is recommended to establish unified optimal cutoff points for practical clinical and community-based use at ≤8 points for WHO-4 and ≤10 points for WHO-5. These standardized thresholds demonstrate consistent and robust diagnostic performance while effectively balancing the trade-offs between false positives and false negatives (46). In community settings where early detection is crucial to minimize missed cases, slightly higher unified thresholds are suggested: ≤9 points for WHO-4 and ≤11 points for WHO-5. These adjusted thresholds improve the chances of early identification, enabling timely preventive interventions (54–57).
4 Discussion
The present study significantly advances the literature by validating the WHO-5 Well-Being Index and its abbreviated version (WHO-4) among a large, community-based sample of Japanese school-aged children. Through rigorous psychometric analyses, we confirmed the reliability of both scales, factorial validity, measurement invariance across gender and age groups, convergent validity, and optimal screening thresholds for psychological distress. This study addresses important gaps regarding the suitability of the WHO-5 scale for younger, nonclinical populations in East Asia, particularly in educational settings where early identification of psychological distress is crucial. By using a simplified four-point Likert scale to reduce cognitive load, our approach innovatively expands the practical utility and accessibility of the WHO-5 scale among younger respondents, which is beneficial for large-scale school screenings (10, 11).
The close correspondence between α and ω indicates limited heterogeneity in item loadings and thus strong structural coherence (58). The obtained reliability estimates are consistent with prior validations of the WHO-5 and comparable work in diverse populations, supporting generalizability and cross-cultural stability (1, 8, 18, 20). The use of Bayesian estimation further enhanced the interpretability of the reliability coefficients by providing precise credible intervals, supporting the robustness of the findings (37). Item removal analysis indicated that deleting any single item from the WHO-5 scale did not meaningfully improve reliability, suggesting that each item contributes effectively to the overall internal consistency of the scale. Although item WHO4 showed a slightly lower corrected item-total correlation, its removal did not substantially affect reliability, supporting the retention of all items in practical applications.
Factorial analyses confirmed a clear unidimensional structure, consistent with existing literature that identifies the WHO-5 scale as measuring a single construct of subjective psychological well-being (1, 3). Both EFA and CFA consistently supported this single-factor structure, further reinforcing the established factorial validity of the WHO-5 scale in diverse populations (19, 20). Measurement invariance analyses revealed full scalar invariance across gender for both WHO-5 and WHO-4, indicating that gender-based comparisons of well-being are unbiased. However, while WHO-5 demonstrated full scalar invariance across grade groups, WHO-4 only showed partial scalar invariance. Full scalar invariance is critical to ensure that gender- and age-based comparisons of latent means accurately reflect true differences in well-being without bias (17, 22, 23). The partial scalar invariance observed in WHO-4 suggests that caution and potential adjustments are necessary when interpreting cross-grade comparisons, highlighting the superiority of WHO-5 for broader developmental applications.
A significant methodological innovation in our study was the modification of the standard 6-point Likert scale to a simplified 4-point scale to reduce cognitive burden in children, as younger respondents may struggle with extensive response options (10, 11). Although this scaling change prevented direct numeric comparisons with previous studies, it did not compromise discriminative metrics such as sensitivity, specificity, and the AUC. Indeed, our observed AUCs in the range of 0.85–0.90 were consistent with prior research using the standard WHO-5 format (7, 59), demonstrating that the overall diagnostic power remained intact despite the scale modification.
Our ROC analysis confirmed that both WHO-5 and WHO-4 have good accuracy in detecting depression across varying severity levels. This study is the first to formally evaluate WHO-4’s screening performance in a large community-based sample of school-aged children, suggesting its utility as a practical short-form tool in educational settings. Optimal cutoff scores were identified by considering sensitivity-specificity trade-offs, clinical utility, and predictive values influenced by the prevalence of depression. Positive predictive value (PPV) strongly depends on contextual prevalence rates (60–62), and we incorporated global epidemiological prevalence estimates to interpret the screening results. Specifically, the 12-month prevalence for adolescents aged 10–15 years was estimated at 2.75%, based on WHO reports (63) and meta-analytic findings (64). The cumulative prevalence was set at 5.5%, reflecting longitudinal data indicating a lifetime prevalence of approximately 11% among adolescents aged 13–18 (65).
As shown in Table 9, sensitivity, specificity, and PPV varied significantly based on the chosen thresholds for the WHO-4 and WHO-5 scales. Thresholds with the highest specificity (e.g., WHO-4 ≤ 3, WHO-5 ≤ 6) had very low sensitivity, posing a risk of missing cases. Conversely, thresholds identified as statistically optimal using Youden’s index (WHO-4 ≤ 8, WHO-5 ≤ 10) offered a balanced diagnostic accuracy, making them suitable for initial screening. However, it is crucial to consider practical and clinical factors alongside statistical optimization. Indeed, Brehaut et al. (54) emphasized the importance of thresholds that account for local prevalence rates, resource availability, and the impact of missed diagnoses.
Therefore, slightly adjusted thresholds (WHO-4 ≤ 9, WHO-5 ≤ 11) were recommended to improve sensitivity and minimize false negatives, prioritizing early detection and timely intervention in community-based settings like schools. This adjustment aligns closely with public health principles outlined in Wilson and Jungner’s screening criteria (66, 67). While these adjusted thresholds inevitably reduce PPV through an increased false-positive rate, this trade-off is justified by the clinical and ethical imperative to identify vulnerable children early, provided that there are adequate psychological support services, trained professionals, and effective referral systems in place.
Indeed, the effectiveness of screening programs depends on selected thresholds and the availability of follow-up resources and intervention capacity (68–70). Inadequate infrastructure can result in unintended consequences such as increased anxiety, stigma from mental health labeling, or delayed intervention due to overwhelmed resources (66, 70). This highlights the need for flexible screening strategies that consider local resources, prevalence rates, and ethical considerations regarding the psychological impact on those screened. For instance, in resource-limited school settings, a more specific threshold may be preferred to avoid overlooking existing services, while in well-equipped settings with robust follow-up capabilities, higher sensitivity thresholds are needed for early detection.
Ultimately, the selection of optimal screening thresholds should be guided by clear objectives, careful assessment of local prevalence, available resources, and consideration of potential psychological and ethical implications. Previous WHO-5 studies have often used a single cutoff point irrespective of severity. In contrast, our identification of severity-specific thresholds offers tailored guidance based on severity, a novel contribution that enriches the existing literature on mental health screening. While we report recommended operating cut-offs, threshold selection should remain adaptable to local prevalence and follow-up capacity; in this spirit, we tabulated the full range of candidate cut-offs with their operating characteristics so that districts can calibrate decisions to their resources. Therefore, our findings offer clear and practical recommendations for clinical practice and community-based mental-health policies, effectively bridging statistical precision and clinical utility in school-based depression screening.
These results underscore the inherent limitations of single-stage screenings and emphasize the necessity of context-sensitive, multitiered approaches. When implementing school-wide screenings, it is crucial to select thresholds in light of local resources and follow-up capacity. In resource-limited settings, more conservative (higher-specificity) thresholds can increase PPV and concentrate scarce follow-up on higher-risk cases; conversely, in well-resourced settings, more inclusive (higher-sensitivity) thresholds may facilitate early intervention (66, 68).
Finally, our findings have significant implications for school-wide mental health initiatives, supporting the routine integration of the WHO-5 scale—and potentially the WHO-4 scale as a streamlined alternative—for early depression screening. At a policy level, our results justify district-wide screening frameworks that assign complementary roles to the two versions: WHO-5 for unbiased cross-grade monitoring (given its full scalar invariance) and WHO-4 as a streamlined option when maximizing coverage is prioritized in routine workflows. Many adolescents experiencing psychological distress go unnoticed in school settings, and using brief, positively framed well-being questionnaires like the WHO-5 scale can enhance honest reporting, reduce stigma, and enable early intervention (59, 71). Specifically, the positive framing of the WHO-5 items may reduce the stigma associated with overt mental health questions, enhancing the acceptability and accuracy of student responses in school-wide mental health programs (1, 3, 20). Effective school-based screening programs require robust follow-up infrastructure to translate screening results into tangible mental-health benefits (69, 70). Framing the instruments in this way facilitates routine integration into school health policy (universal screening with stepped follow-up) and enables population-level dashboards to track grade-level trends and guide resource allocation.
Despite the significant strengths of our study, it is important to acknowledge several limitations. First, the cross-sectional design of our study limited our ability to assess the predictive validity and longitudinal stability of the WHO-5 and WHO-4 measures. Future longitudinal studies are necessary to determine their predictive capabilities for mental health outcomes over time. Second, external validity is bounded: although the sampling frame—restricted to public elementary and junior-high schools—supports internal validity, generalizability to private-school settings, to areas with different socioeconomic profiles, or to non-Japanese contexts remains uncertain, particularly because individual-level SES was not collected. Future studies should recruit multi-site samples across prefectures and school types, incorporate individual or area-level SES indicators, and undertake cross-national replications to establish broader applicability.
Additionally, criterion validity in this study was based solely on a self-report reference (PHQ-A). To address this limitation, future research should include brief, blinded subsample clinical validation using standardized diagnostic interviews to confirm AUCs (with 95% CIs) and sensitivity/specificity at prespecified cut points, and to examine potential age-related heterogeneity under a clinical reference. Lastly, while our study identified optimal cutoffs balancing sensitivity and specificity, the appropriateness of these thresholds depends on contextual factors such as local prevalence rates, resource availability, and specific screening goals. Therefore, practitioners should interpret and adjust these cutoffs flexibly, considering their specific operational contexts and available resources (54, 55, 57).
In conclusion, our study supports the psychometric robustness and practical utility of the WHO-5 and WHO-4 scales as screening tools for psychological well-being in Japanese school-aged children. Addressing the identified limitations through longitudinal designs, clinical diagnostic validation, and geographical replications in future research will enhance their applicability and clinical utility.
5 Conclusion
The present study offers comprehensive validation evidence supporting the WHO-5 and WHO-4 scales as effective, reliable, and culturally appropriate screening tools for identifying psychological distress among Japanese school-aged children. Our findings establish optimal cutoff thresholds that balance sensitivity and specificity, enabling evidence-based decisions tailored to specific contextual needs and resource capacities within school-based mental health programs. Practitioners are encouraged to adapt these thresholds thoughtfully, considering their screening objectives, local prevalence rates, and available follow-up infrastructure. Future research should further validate these tools through longitudinal studies, clinical diagnostic comparisons, and replication in diverse populations and settings to ensure their ongoing relevance and effectiveness in global mental health screening efforts.
Data availability statement
The dataset analyzed in this study is part of an ongoing prospective cohort study and is therefore not publicly available at present. Researchers who wish to use the data may contact the corresponding author with a reasonable request; data sharing will be considered in line with the study’s ethical approvals and data-sharing agreements.
Ethics statement
The studies involving humans were approved by Committee of Medical Ethics of Hirosaki University Graduate School of Medicine. The studies were conducted in accordance with the local legislation and institutional requirements. Written informed consent for participation in this study was provided by the participants’ legal guardians/next of kin.
Author contributions
MaA: Funding acquisition, Visualization, Resources, Validation, Conceptualization, Project administration, Methodology, Writing – review & editing, Data curation, Writing – original draft, Investigation, Formal analysis. MT: Data curation, Methodology, Conceptualization, Writing – review & editing, Funding acquisition, Investigation, Project administration. HM: Data curation, Writing – review & editing, Conceptualization, Project administration, Investigation, Funding acquisition. TN: Conceptualization, Methodology, Writing – review & editing, Supervision. MO: Writing – review & editing, Project administration, Data curation, Investigation. MiA: Writing – review & editing, Investigation, Data curation, Project administration. RM: Writing – review & editing, Funding acquisition, Methodology. MW: Project administration, Conceptualization, Writing – review & editing. KN: Project administration, Conceptualization, Writing – review & editing, Supervision, Funding acquisition, Resources.
Funding
The authors declare that financial support was received for the research and/or publication of this article. This work was supported by the Hirosaki Institute of Neuroscience in Japan (KN). Additionally, this research received funding from the Japan Agency for Medical Research and Development (AMED) under the Project for Baby and Infant in Research of Health and Development to Adolescent and Young Adult–BIRTHDAY (grant number JP23gn0110071, KN, MaA), and from the Japan Society for the Promotion of Science (JSPS) KAKENHI (grant numbers 23K22358, MaA; 23K22349, MT; 24K20744, RM).
Acknowledgments
We are grateful to the students and their guardians who participated in this study, as well as to the teachers and Board of Education staff of Hirosaki City for their invaluable assistance in facilitating and overseeing the survey. We extend our sincere appreciation to Dr. Inagaki and his co-authors for kindly granting permission to adapt the Japanese version of the WHO-5 Well-Being Index for use with children. We are especially thankful for their generosity in allowing us to modify the version originally developed for older adults. Finally, we would like to thank our colleagues and collaborators for their insightful feedback and continuous support throughout the research process.
Conflict of interest
The authors declare that the research was conducted in the absence of any commercial or financial relationships that could be construed as a potential conflict of interest.
Generative AI statement
The authors declare that no Gen AI was used in the creation of this manuscript.
Any alternative text (alt text) provided alongside figures in this article has been generated by Frontiers with the support of artificial intelligence and reasonable efforts have been made to ensure accuracy, including review by the authors wherever possible. If you identify any issues, please contact us.
Publisher’s note
All claims expressed in this article are solely those of the authors and do not necessarily represent those of their affiliated organizations, or those of the publisher, the editors and the reviewers. Any product that may be evaluated in this article, or claim that may be made by its manufacturer, is not guaranteed or endorsed by the publisher.
Supplementary material
The Supplementary material for this article can be found online at: https://www.frontiersin.org/articles/10.3389/fpubh.2025.1662332/full#supplementary-material
References
1. Topp, CW, Østergaard, SD, Søndergaard, S, and Bech, P. The WHO-5 well-being index: a systematic review of the literature. Psychother Psychosom. (2015) 84:167–76. doi: 10.1159/000376585,
2. World Health Organization. 1998. Wellbeing measures in primary health care/the DepCare project: Report on a WHO meeting: Stockholm, Sweden, 12–13 February 1998. Regional office for Europe. Geneva: World Health Organization. Regional Office for Europe. Available online at: https://iris.who.int/handle/10665/349766
3. Bech, P, Olsen, LR, Kjoller, M, and Rasmussen, NK. Measuring well-being rather than the absence of distress symptoms: a comparison of the SF-36 mental health subscale and the WHO-five well-being scale. Int J Methods Psychiatr Res. (2003) 12:85–91. doi: 10.1002/mpr.145,
4. Diener, E, Suh, EM, Lucas, RE, and Smith, HL. Subjective well-being: three decades of progress. Psychol Bull. (1999) 125:276–302. doi: 10.1037/0033-2909.125.2.276
5. Huppert, FA. Psychological well-being: evidence regarding its causes and consequences. Appl Psychol Health Well Being. (2009) 1:137–64. doi: 10.1111/j.1758-0854.2009.01008.x
6. Lyubomirsky, S, King, L, and Diener, E. The benefits of frequent positive affect: does happiness lead to success? Psychol Bull. (2005) 131:803–55. doi: 10.1037/0033-2909.131.6.803,
7. Krieger, T, Zimmermann, J, Huffziger, S, Ubl, B, Diener, C, Kuehner, C, et al. Measuring depression with a well-being index: further evidence for the validity of the WHO well-being index (WHO-5) as a measure of the severity of depression. J Affect Disord. (2014) 156:240–4. doi: 10.1016/j.jad.2013.12.015,
8. Awata, S, Bech, P, Koizumi, Y, Seki, T, Kuriyama, S, Hozawa, A, et al. Validity and utility of the Japanese version of the WHO-five well-being index in the context of detecting suicidal ideation in elderly community residents. Int Psychogeriatr. (2007) 19:77–88. doi: 10.1017/S1041610206004212,
9. Ghazisaeedi, M, Mahmoodi, H, Arpaci, I, Mehrdar, S, and Barzegari, S. Validity, reliability, and optimal cut-off scores of the WHO-5, PHQ-9, and PHQ-2 to screen depression among university students in Iran. Int J Ment Health Addict. (2022) 20:1824–33. doi: 10.1007/s11469-021-00483-5,
10. Borgers, N, Hox, J, and Sikkel, D. Response effects in surveys on children and adolescents: the effect of number of response options, negative wording, and neutral mid-point. Qual Quant. (2004) 38:17–33. doi: 10.1023/B:QUQU.0000013236.29205.a6
11. Mellor, D, and Moore, KA. The use of Likert scales with children. J Pediatr Psychol. (2014) 39:369–79. doi: 10.1093/jpepsy/jst079,
12. Ravens-Sieberer, U, Devine, J, Bevans, K, Riley, AW, Moon, J, Salsman, JM, et al. Subjective well-being measures for children were developed within the PROMIS project: presentation of first results. J Clin Epidemiol. (2014) 67:207–18. doi: 10.1016/j.jclinepi.2013.08.018,
13. Tomyn, AJ, Fuller-Tyszkiewicz, MD, Cummins, RA, and Norrish, JM. The validity of subjective wellbeing measurement for children: evidence using the personal wellbeing index—school children. J Happiness Stud. (2017) 18:1859–75. doi: 10.1007/s10902-016-9804-3
14. Casas, F, and Rees, G. Measures of children's subjective well-being: analysis of the potential for cross-national comparisons. Child Indic Res. (2015) 8:49–69. doi: 10.1007/s12187-014-9293-z
15. Cho, EY-N, and Yu, F-Y. A review of measurement tools for child wellbeing. Child Youth Serv Rev. (2020) 119:105576. doi: 10.1016/j.childyouth.2020.105576
16. Levis, B, Benedetti, A, and Thombs, BDDEPRESsion Screening Data (DEPRESSD) Collaboration. Accuracy of patient health Questionnaire-9 (PHQ-9) for screening to detect major depression: individual participant data meta-analysis. BMJ. (2019) 365:l1476. doi: 10.1136/bmj.l1476,
17. Putnick, DL, and Bornstein, MH. Measurement invariance conventions and reporting: the state of the art and future directions for psychological research. Dev Rev. (2016) 41:71–90. doi: 10.1016/j.dr.2016.06.004,
18. Sischka, PE, Martin, G, Residori, C, Hammami, N, Page, N, Schnohr, C, et al. Cross-national validation of the WHO-5 well-being index within adolescent populations: findings from 43 countries [Advance online publication. Assessment. (2025):10731911241309452. doi: 10.1177/10731911241309452
19. Fung, SF, Kong, CYW, Liu, YM, Huang, Q, Xiong, Z, Jiang, Z, et al. Validity and psychometric evaluation of the Chinese version of the 5-item WHO well-being index. Front Public Health. (2022) 10:872436. doi: 10.3389/fpubh.2022.872436,
20. Cosma, A, Költő, A, Chzhen, Y, Kleszczewska, D, Kalman, M, and Martin, G. Measurement invariance of the WHO-5 well-being index: evidence from 15 European countries. Int J Environ Res Public Health. (2022) 19:9798. doi: 10.3390/ijerph19169798,
21. Brown, TA. Confirmatory factor analysis for applied research. 2nd ed. New York: Guilford Press (2015).
22. Chen, FF. Sensitivity of goodness of fit indexes to lack of measurement invariance. Struct Equ Modeling. (2007) 14:464–504. doi: 10.1080/10705510701301834
23. Cheung, GW, and Rensvold, RB. Evaluating goodness-of-fit indexes for testing measurement invariance. Struct Equ Modeling Multidiscip J. (2002) 9:233–55. doi: 10.1207/S15328007SEM0902_5
24. Quansah, F, Hagan, JE Jr, Ankomah, F, Agormedah, EK, Nugba, RM, Srem-Sai, M, et al. Validation of the WHO-5 well-being scale among adolescents in Ghana: evidence-based assessment of the internal and external structure of the measure. Children. (2022) 9:991. doi: 10.3390/children9070991,
25. Hirota, T, Adachi, M, Takahashi, M, Mori, H, Shinkawa, H, Sakamoto, Y, et al. Cohort profile: the assessment from preschool to puberty–longitudinal epidemiological (APPLE) study in Hirosaki, Japan. Int J Epidemiol. (2022) 50:1782–1783h. doi: 10.1093/ije/dyab112,
26. Adachi, M, Takahashi, M, Shinkawa, H, Mori, H, Nishimura, T, and Nakamura, K. Longitudinal association between smartphone ownership and depression among schoolchildren under COVID-19 pandemic. Soc Psychiatry Psychiatr Epidemiol. (2022) 57:239–43. doi: 10.1007/s00127-021-02196-5,
27. Takahashi, M, Adachi, M, Nishimura, T, Hirota, T, Yasuda, S, Kuribayashi, M, et al. Prevalence of pathological and maladaptive internet use and the association with depression and health-related quality of life in Japanese elementary and junior high school-aged children. Soc Psychiatry Psychiatr Epidemiol. (2018) 53:1349–59. doi: 10.1007/s00127-018-1605-z,
28. Inagaki, H, Ito, K, Sakuma, N, Sugiyama, M, Okamura, T, and Awata, S. Reliability and validity of the simplified Japanese version of the WHO-five well-being index (S-WHO-5-J). Nihon Koshu Eisei Zasshi. (2013) 60:294–301. doi: 10.11236/jph.60.5_294
29. Kroenke, K, Spitzer, RL, and Williams, JB. The PHQ-9: validity of a brief depression severity measure. J Gen Intern Med. (2001) 16:606–13. doi: 10.1046/j.1525-1497.2001.016009606.x,
30. Johnson, JG, Harris, ES, Spitzer, RL, and Williams, JBW. The patient health questionnaire for adolescents: validation of an instrument for the assessment of mental disorders among adolescent primary care patients. J Adolesc Health. (2002) 30:196–204. doi: 10.1016/S1054-139X(01)00333-0,
31. Adachi, M, Takahashi, M, Hirota, T, Shinkawa, H, Mori, H, Saito, T, et al. Distributional patterns of item responses and total scores of the patient health questionnaire for adolescents in a general population sample of adolescents in Japan. Psychiatry Clin Neurosci. (2020) 74:628–9. doi: 10.1111/pcn.13148,
32. Ravens-Sieberer, U, Erhart, M, Rajmil, L, Herdman, M, Auquier, P, Bruil, J, et al. Reliability, construct and criterion validity of the KIDSCREEN-10 score: a short measure for children and adolescents’ well-being and health-related quality of life. Qual Life Res. (2010) 19:1487–500. doi: 10.1007/s11136-010-9706-5,
33. Nezu, S, Iwasaka, H, Saeki, K, Obayashi, K, Ishizuka, R, Goma, H, et al. Reliability and validity of Japanese versions of KIDSCREEN-27 and KIDSCREEN-10 questionnaires. Environ Health Prev Med. (2016) 21:154–63. doi: 10.1007/s12199-016-0510-x,
34. Dunn, TJ, Baguley, T, and Brunsden, V. From alpha to omega: a practical solution to the pervasive problem of internal consistency estimation. Br J Psychol. (2014) 105:399–412. doi: 10.1111/bjop.12046,
35. Hayes, AF, and Coutts, JJ. Use omega rather than Cronbach’s alpha for estimating reliability. But…. Commun Methods Meas. (2020) 14:1–24. doi: 10.1080/19312458.2020.1718629
36. Tavakol, M, and Dennick, R. Making sense of Cronbach’s alpha. Int J Med Educ. (2011) 2:53–5. doi: 10.5116/ijme.4dfb.8dfd,
37. Pfadt, JM, van den Bergh, DVD, Sijtsma, K, and Wagenmakers, EJ. A tutorial on Bayesian single-test reliability analysis with JASP. Behav Res Methods. (2023) 55:1069–78. doi: 10.3758/s13428-021-01778-0,
38. MacCallum, RC, Widaman, KF, Preacher, KJ, and Hong, S. Sample size in factor analysis: the role of model error. Multivariate Behav Res. (2001) 36:611–37. doi: 10.1207/S15327906MBR3604_06,
39. Worthington, RL, and Whittaker, TA. Scale development research: a content analysis and recommendations for best practices. Counsel Psychol. (2006) 34:806–38. doi: 10.1177/0011000006288127
40. Browne, MW. An overview of analytic rotation in exploratory factor analysis. Multivar Behav Res. (2001) 36:111–50. doi: 10.1207/S15327906MBR3601_05
41. Kaiser, HF. The application of electronic computers to factor analysis. Educ Psychol Meas. (1960) 20:141–51. doi: 10.1177/001316446002000116
42. Cattell, RB. The scree test for the number of factors. Multivariate Behav Res. (1966) 1:245–76. doi: 10.1207/s15327906mbr0102_10,
43. Hu, LT, and Bentler, PM. Cutoff criteria for fit indexes in covariance structure analysis: conventional criteria versus new alternatives. Struct Equat Model Multidiscipl J. (1999) 6:1–55. doi: 10.1080/10705519909540118
44. Byrne, BM. Structural equation modeling with AMOS: basic concepts, applications, and programming. 2nd ed. New York: Routledge/Taylor & Francis Group (2010).
45. Kenny, DA, Kaniskan, B, and McCoach, DB. The performance of RMSEA in models with small degrees of freedom. Sociol Methods Res. (2015) 44:486–507. doi: 10.1177/0049124114543236
46. Hosmer, DW, Lemeshow, S, and Sturdivant, RX. Applied logistic regression. 3rd ed. New York: John Wiley & Sons (2013).
47. Youden, WJ. Index for rating diagnostic tests. Cancer. (1950) 3:32–5. doi: 10.1002/1097-0142(1950)3:1<32::AID-CNCR2820030106>3.0.CO;2-3,
48. Deeks, JJ, and Altman, DG. Diagnostic tests 4: likelihood ratios. BMJ. (2004) 329:168–9. doi: 10.1136/bmj.329.7458.168,
49. Jaeschke, R, Guyatt, GH, Sackett, DL, Guyatt, G, Bass, E, Brill-Edwards, P, et al. Users' guides to the medical literature: III. How to use an article about a diagnostic test B. What are the results and will they help me in caring for my patients? JAMA. (1994) 271:703–7. doi: 10.1001/jama.1994.03510330081039
50. Kim, H-Y. Statistical notes for clinical researchers: assessing normal distribution (2) using skewness and kurtosis. Restor Dent Endod. (2013) 38:52–4. doi: 10.5395/rde.2013.38.1.52,
51. Kline, RB. Principles and practice of structural equation modeling. 4th ed. New York: Guilford Press (2016).
52. Cohen, J. Statistical Power analysis for the behavioral science. 2nd ed. Hillsdale, NJ: Lawrence Erlbaum Associates (1988) doi: 10.4324/9780203771587.
53. Hanley, JA, and McNeil, BJ. The meaning and use of the area under a receiver operating characteristic (ROC) curve. Radiology. (1982) 143:29–36. doi: 10.1148/radiology.143.1.7063747,
54. Brehaut, E, Neupane, D, Levis, B, Wu, Y, Sun, Y, Ioannidis, JPA, et al. ‘Optimal’ cutoff selection in studies of depression screening tool accuracy using the PHQ-9, EPDS, or HADS-D: a meta research study. Int J Methods Psychiatr Res. (2023) 32:e1956. doi: 10.1002/mpr.1956,
55. Löwe, B, Spitzer, RL, Gräfe, K, Kroenke, K, Quenter, A, Zipfel, S, et al. Comparative validity of three screening questionnaires for DSM-IV depressive disorders and physicians’ diagnoses. J Affect Disord. (2004) 78:131–40. doi: 10.1016/S0165-0327(02)00237-9,
56. Spitzer, RL, Kroenke, K, and Williams, JBWPatient Health Questionnaire Primary Care Study Group. Validation and utility of a self-report version of PRIME-MD: the PHQ primary care study. Primary care evaluation of mental disorders. Patient health questionnaire. JAMA. (1999) 282:1737–44. doi: 10.1001/jama.282.18.1737,
57. Streiner, DL, Norman, GR, and Cairney, J. Health measurement scales: a practical guide to their development and use. 5th ed. New York: Oxford University Press (2015).
58. Sijtsma, K. On the use, the misuse, and the very limited usefulness of Cronbach’s alpha. Psychometrika. (2009) 74:107–20. doi: 10.1007/s11336-008-9101-0,
59. Halliday, JA, Hendrieckx, C, Busija, L, Browne, JL, Nefs, G, Pouwer, F, et al. Validation of the WHO-5 as a first-step screening instrument for depression in adults with diabetes: results from diabetes MILES – Australia. Diabetes Res Clin Pract. (2017) 132:27–35. doi: 10.1016/j.diabres.2017.07.005,
60. Habibzadeh, F, Habibzadeh, P, and Yadollahie, M. On determining the most appropriate test cut-off value: the case of tests with continuous results. Biochem Med. (2016) 26:297–307. doi: 10.11613/BM.2016.034,
61. Trevethan, R. Sensitivity, specificity, and predictive values: foundations, pliabilities, and pitfalls in research and practice. Front Public Health. (2017) 5:307. doi: 10.3389/fpubh.2017.00307,
62. Zimmerman, M. Positive predictive value: a clinician’s guide to avoid misinterpreting the results of screening tests. J Clin Psychiatry. (2022) 83:22com14513. doi: 10.4088/JCP.22com14513,
63. World Health Organization (2021). Mental health of adolescents. Available online at: https://www.who.int/news-room/fact-sheets/detail/adolescent-mental-health
64. Polanczyk, GV, Salum, GA, Sugaya, LS, Caye, A, and Rohde, LA. Annual research review: a meta-analysis of the worldwide prevalence of mental disorders in children and adolescents. J Child Psychol Psychiatry. (2015) 56:345–65. doi: 10.1111/jcpp.12381,
65. Avenevoli, S, Swendsen, J, He, JP, Burstein, M, and Merikangas, KR. Major depression in the national comorbidity survey-adolescent supplement: prevalence, correlates, and treatment. J Am Acad Child Adolesc Psychiatry. (2015) 54:37–44.e2. doi: 10.1016/j.jaac.2014.10.010,
66. Andermann, A, Blancquaert, I, Beauchamp, S, and Déry, V. Revisiting Wilson and Jungner in the genomic age: a review of screening criteria over the past 40 years. Bull World Health Organ. (2008) 86:317–9. doi: 10.2471/BLT.07.050112,
67. Wilson, J.M.G., and Jungner, G. (1968) “Principles and practice of screening for disease,” Public health papers no. 34 Geneva World Health Organization. Available online at: https://apps.who.int/iris/handle/10665/37650
68. Kagee, A, Tsai, AC, Lund, C, and Tomlinson, M. Screening for common mental disorders in low resource settings: reasons for caution and a way forward. Int Health. (2013) 5:11–4. doi: 10.1093/inthealth/ihs004,
69. Karcher, NR, Hicks, R, Schiffman, J, Asarnow, JR, Calkins, ME, Dauberman, JL, et al. Youth mental health screening and linkage to care. Psychiatr Serv. (2023) 74:727–36. doi: 10.1176/appi.ps.202200008,
70. Young, JF, Miller, MR, and Khan, N. Screening and managing depression in adolescents. Adolesc Health Med Ther. (2010) 1:87–95. doi: 10.2147/AHMT.S7539,
Keywords: WHO-5 well-being index, psychological well-being, cross-cultural validation, confirmatory factor analysis, measurement invariance, depression screening, school-aged children, community sample
Citation: Adachi M, Takahashi M, Mori H, Nishimura T, Osada M, Adachi M, Monden R, Wakuta M and Nakamura K (2025) Psychometric validation of the WHO-5 and WHO-4 well-being index scales for assessing psychological well-being and detecting depression in Japanese school-aged children: a community-based study. Front. Public Health. 13:1662332. doi: 10.3389/fpubh.2025.1662332
Edited by:
Lisa Amalia Denza Webster, Leeds Trinity University, United KingdomReviewed by:
Oliver Ramos-Alvarez, University of Cantabria, SpainLuiz Sérgio Silva, Federal University of Minas Gerais, Brazil
Darren Dookeeram, The University of the West Indies St. Augustine, Trinidad and Tobago
Copyright © 2025 Adachi, Takahashi, Mori, Nishimura, Osada, Adachi, Monden, Wakuta and Nakamura. This is an open-access article distributed under the terms of the Creative Commons Attribution License (CC BY). The use, distribution or reproduction in other forums is permitted, provided the original author(s) and the copyright owner(s) are credited and that the original publication in this journal is cited, in accordance with accepted academic practice. No use, distribution or reproduction is permitted which does not comply with these terms.
*Correspondence: Masaki Adachi, YWRhY2hpQHBzeS5tZWlqaWdha3Vpbi5hYy5qcA==