 Yanbin Du
 Hua Zhou2,3*†
- 1College of Mathematics and Statistics, Henan University of Science and Technology, Luoyang, Henan Province, China
- 2Endocrinology and Metabolism Center, Henan Key Laboratory of Rare Diseases, The First Affiliated Hospital, College of Clinical Medicine of Henan University of Science and Technology, Luoyang, Henan Province, China
- 3Henan Academy of Innovations in Medical Science, Zhengzhou, Henan Province, China
Background: With the rapid advancement of industrialization and urbanization, air pollution is becoming increasingly serious, posing a huge threat to human health. There is limited literatures to study the relationship between air pollution and thyroid diseases. Therefore, this study aims to investigate the association between air pollutions (PM2.5, PM10, SO2, NO2, O3, and CO) and thyroid goiter.
Methods: A 9-year time series data was collected from the Luoyang Air Testing Website from 2014 to 2022. A generalized additive model (GAM) based on Poisson regression was established and stratification analysis were used to explore the differences in the population by gender, age, place of residence, and season.
Results: There were 37,630 hospital admissions for goiter in Luoyang from January 1, 2014 to July 30, 2022. Among them, there are 29,571 female (78.58%) and 8,059 male (21.42%); There are different lag effects of air pollutants on the thyroid goiter, and the relative risk (RR) of thyroid goiter showed a non-linear increasing trend with the increase of pollutants concentration on the optimal lag day. A 10 μg/m3 increase in PM2.5, PM10, O3, and NO2 concentrations (1 mg/m3 increase in CO) was associated with a 1.0092%(95%CI: 1.0032–1.015), 1.0044% (95%CI: 1.0008–1.0081), 0.9928%(95%CI: 0.9867–0.9988), 1.0596% (95%CI: 1.0413–1.0783) and 1.624%(95%CI: 1.1347–2.3243) risk of thyroid goiter, respectively. Besides, the effect of SO2 on goiter was not statistically significant. The stratified analysis results showed that women, age >45 years old, and urban populations may be more sensitive to pollutants, and people may be more sensitive to pollutants in autumn.
Conclusions: This time-series study suggested that long-term exposure to air pollutions may be associated with an increased risk of thyroid diseases, especially NO2 and CO have a greater impact on goiter than PM. These associations were stronger for patients more than 45 years old and during the autumn, especially for women. These findings suggest the importance of reducing air pollutant concentrations and protecting the environment.
1 Introduction
The thyroid gland is a very important endocrine organ in the human body, located in the anterior lower part of the neck. The job of the thyroid is the synthesis of thyroid hormones which are responsible for the metabolism in the body. Thyroid lesions can cause significant harm to the human body, goiter is a common clinical sign and manifestation of various thyroid diseases. It's reported by Al-Rekabi and Habban that thyroid tumor rate was 21.6% from patients with goiter (1). According to the latest assessment report released by the International Agency for Research on Cancer (IARC) of the World Health Organization (WHO), there are more than 821,000 new cases of thyroid cancer, and the overall incidence rate ranks seventh in the world (2). According to the report released by China Cancer Center in 2022, the standardized incidence rate of thyroid cancer in China has increased from 1.4/100,000 person years in 1990 to 14.65/100,000 person years in 2016, with a 10 fold increase in incidence rate (3). In 2022, thyroid cancer ranked third in the number of new cancer cases in China, it's urgent need to seek risk factors for thyroid disease.
With the rapid advancement of industrialization and urbanization, air pollution is becoming increasingly serious, posing a huge threat to human health. Especially pollutants such as fine particulate matter (PM2.5), ozone (O3), and nitrogen dioxide (NO2) in the air have been widely studied and confirmed to be closely related to various respiratory diseases (4–6), cardiovascular diseases (7, 8), and cancer (9–11). According to the WHO, the impact of air pollution causes approximately 7 million deaths annually (12). Air pollutants have a wide range of impacts on human health, therefore, reducing air pollution and improving air quality are crucial for maintaining human health.
The only confirmed risk factor for thyroid cancer currently known is ionizing radiation. However, recent several studies have shown that some air pollutants may be related to thyroid dysfunction (13–15) and the increased incidence rate of thyroid diseases (16, 17). Overall, there is limited literature to study the impact of air pollution on thyroid diseases, especially goiter. Therefore, exploring the link between air pollution and goiter is of great significance.
2 Materials and methods
2.1 Data sources
Henan Province is located in the middle and lower reaches of the Yellow River in the middle east of China and the south of the North China Plain, between 31°23′-36°22′N and 110°21′-116°39′E. Luoyang City is located in the western part of Henan Province, it is situated between longitude 112°16′-112°7′ and latitude 34°2′-34°5′, with a length of approximately 179 km from east to west and a width of approximately 168 km from north to south. The detailed geographical location of Henan Province is shown in Figure 1.
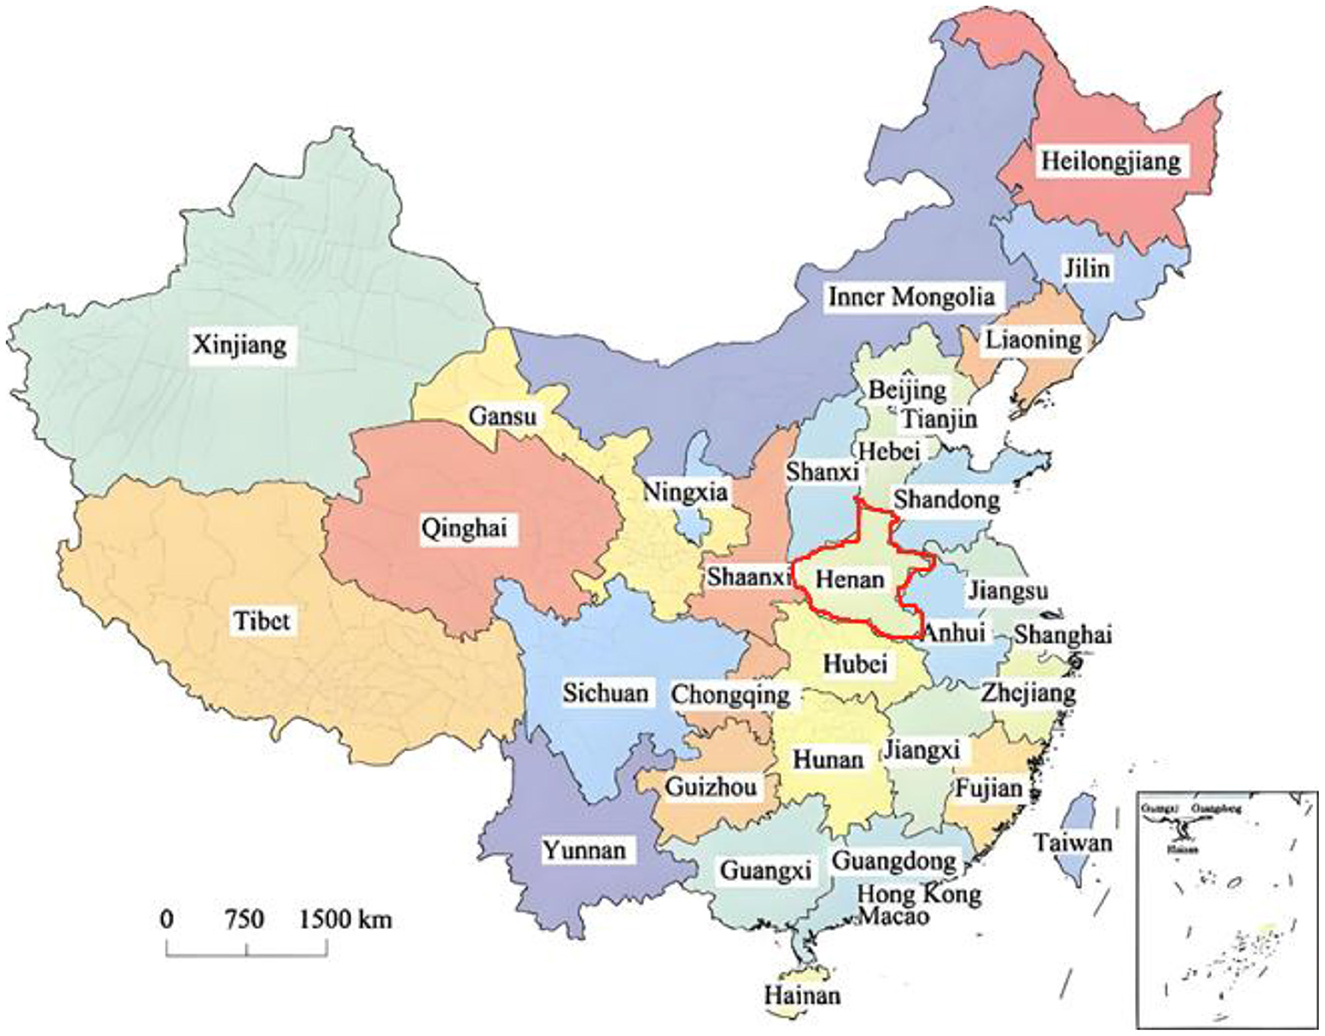
Figure 1. The geographical distribution of Henan Province.
We collected daily concentration data of six air pollutants (PM2.5, PM10, NO2, SO2, O3, and CO) in Luoyang from January 1, 2014 to July 30, 2022 and data from the Luoyang Air Testing Website (https://citydev.gbqyun.com/index/luoyang). There are ten air quality monitoring stations in Luoyang city, the daily concentration of air pollutants was simply an arithmetic mean measure across all the monitoring stations, as in most time-series studies. Daily mean temperature data in Luoyang were from the National Meteorological Information Center (http://data.cma.cn/).
Daily hospital admissions data were collected from the First Affiliated Hospital of Henan University of Science and Technology and The Third People's Hospital, which the two most representative hospitals in Luoyang. The clinical diagnostic criteria for Thyroid diseases from International Classification of Diseases. The patient's goiter was determined by ultrasound, and iodine deficiency patients were excluded. Patients' basic information included gender, age and residence.
2.2 GAM model
A generalized additive model (GAM) with a Poisson distribution was adopted to analyze the impact of air pollutions on daily hospital admissions of goiter. The effect of different time lags was examined including eight single-day lags: (i) lag 0, the pre sent day; (ii) lag 1, the previous day; (iii) lag 2, the day before lag 1; (iv) lag 3, the day before lag 2; (v) lag 4, the day before lag 3; (vi) lag 5, the day before lag 4, (vii) lag 6, the day before lag 5, (viii) lag 7, the day before lag 6, and seven moving average exposure lags: (i) lag 01, the 2-day moving average of the present and previous day; (ii) lag 02, the 3-day moving average of the present and previous 2 days; (iii) lag 03, the 4-day moving average of the present and previous 3 days. (iv) lag 04, the 5-day moving average of the present and previous 4 days. (v) lag 05, the 6-day moving average of the present and previous 5 days. (vi) lag 06, the 7-day moving average of the present and previous 6 days.
GAM is a flexible regression analysis method that allows for the inclusion of non-linear relationships in the model and describes these relationships through non-parametric smooth functions (18). Firstly, we established a basic model that includes the long-term trend of time, the day of the week effect, and the holiday effect, as follows:
Among them, Yt is the actual number of people in the hospital on the t-th day (following the Poisson distribution); μt = E[Yt]is the expected number of hospitalizations on the t-th day; β is the regression coefficient; Xt is the atmospheric pollutant element on the t-th day; S represents a non-parametric smoothing function, where dft represents the degree of freedom of the long-term and seasonal trends of time;
In order to capture short-term fluctuations, the model incorporates holiday variables (hol) and week variables (dow); Holiday variables are simplified into binary categories, where hol = 1 represents holidays and hol = 0 represents non-holidays. The α in the model is the intercept term. In order to better capture the relationship and trend of changes between independent variables, cubic spline smoothing is used to map the discrete values of the independent variables to a continuous function, so that the model can better fit the data, i.e. k = 3; The degree of freedom of the annual non-parametric smoothing function for time is set to 7, a natural spline function with 6 degrees of freedom for daily mean temperature (19).
2.3 Statistical analysis
The relative risks (RR) with 95% confidence interval (CI) in thyroid diseases admissions associated with a 10.0 μg/m3 increase in daily concentration of NO2, SO2, and O3, and a 1.0 mg/m3 increase in daily concentration of CO were estimated, RR was calculated using the following formula (20):
where β is the regression coefficient from the GAM model, SE is the standard error.
Implementing stratified analysis to explore the impact of environmental pollutants on the risk of thyroid tumors in different subgroup variables included gender (male and female), age (<45, 45–65, and >65 years), and season (Spring, Summer, Autumn, and Winter).
By adjusting the degrees of freedom of the time smoothing function, we can monitor the sensitivity of the estimated effect values to changes in degrees of freedom and determine the stability of the model (21). R software (Version 3.2.3) was used to perform analysis, all the statistical tests were two-tailed and a P < 0.05 was considered statistically significant.
3 Result
3.1 Distribution characteristics of air pollutants and thyroid goiter
There were 37,630 hospital admissions for goiter in Luoyang from January 1, 2014 to July 30, 2022. Among them, there are 29,571 female (78.58%), 8,059 male (21.42%); 14,141 people (37.58%) from rural areas and 23,489 people (62.42%) from urban areas; The average age of the patient is 51 years old, 15,349 (40.79%) people are under 45 years old, 17,498 (46.5%) people are between 45 and 64 years old, and 4,783(12.71%) people are over 65 years old.
Analysis of the air pollutants indicated the daily mean concentrations were 62.92 μg/m3 for PM2.5, 109.34 μg/m3 for PM10, 39.26 μg/m3 for NO2, 24.47 μg/m3 for SO2, 96.97 μg/m3 for O3, and 13.37 mg/m3 for CO (Table 1). The time series analysis of pollutant concentration suggests a decreasing and Seasonal trend in PM2.5, PM10, SO2, and CO from 2014 to 2022 (Figure 2).
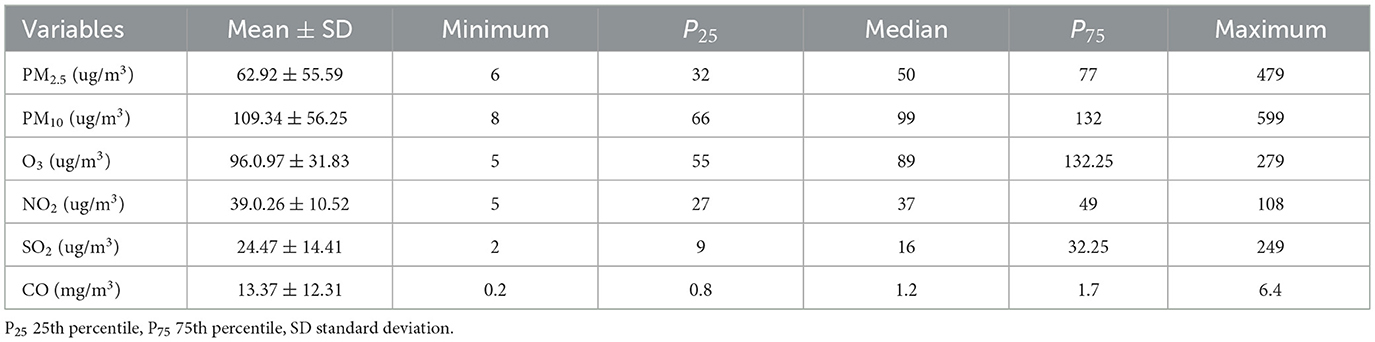
Table 1. Descriptive statistics for the daily number of air pollution concentrations.
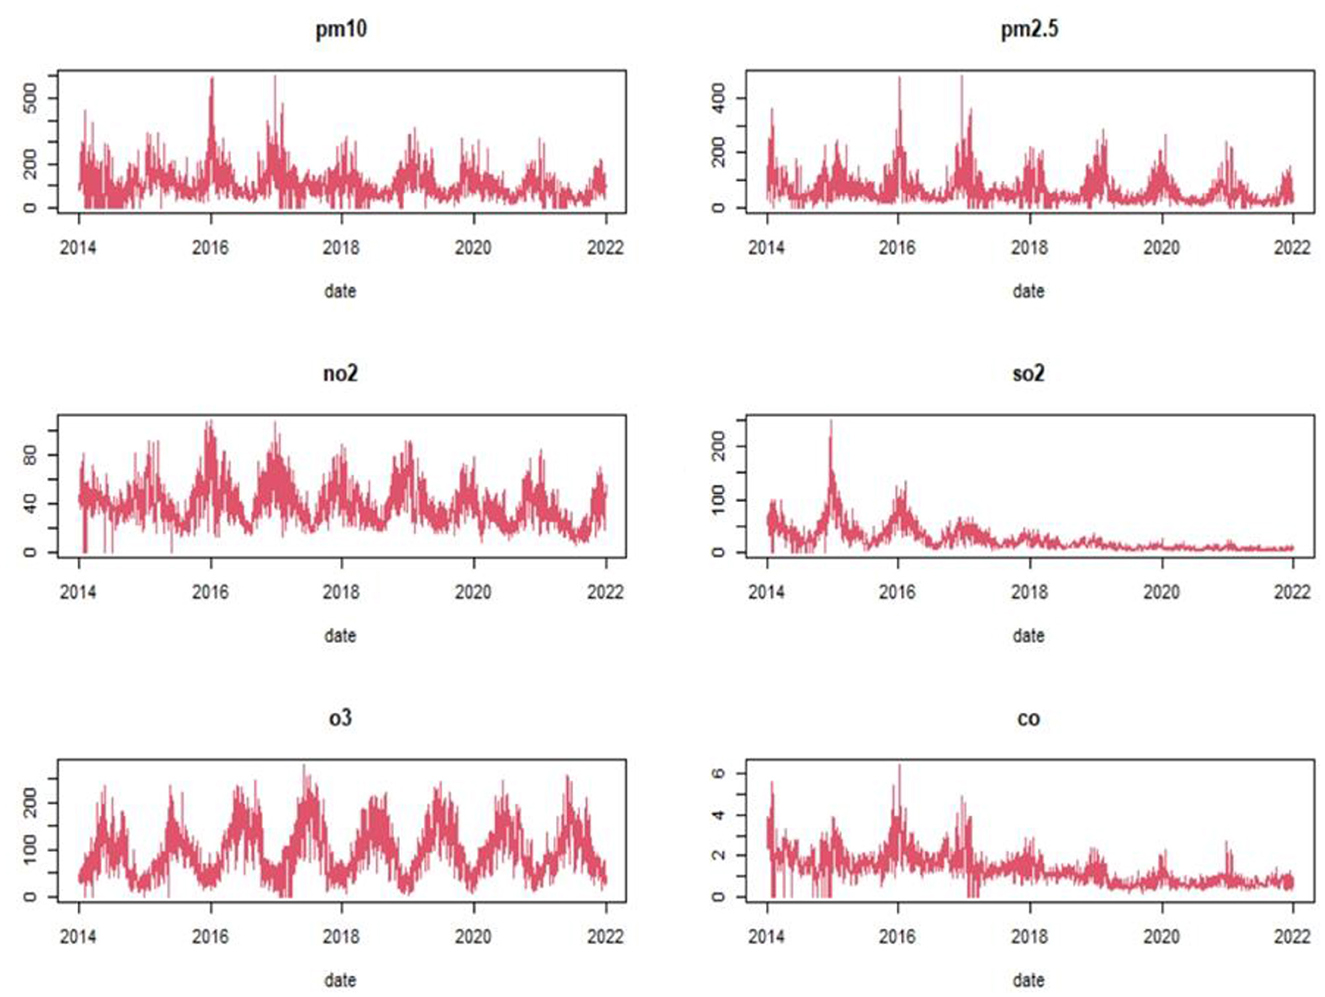
Figure 2. Time series changes in six pollutants concentration from 2014 to 2022.
3.2 Correlation analysis between various pollutants
We calculated Spearman correlation coefficient (r) to examine the relationships of air pollutions (Figure 3). The results indicated that daily PM2.5 and PM10 concentrations had positive correlations with NO2 (PM2.5: r = 0.67, P < 0.001; PM10: r = 0.71, P < 0.001), SO2 (PM2.5: r = 0.4, P < 0.001; PM10: r = 0.43, P < 0.001), and CO (PM2.5: r = 0.65, P < 0.001; PM10: r = 0.61). O3 and other atmospheric pollutants show a negative correlation (r < 0, P < 0.001).
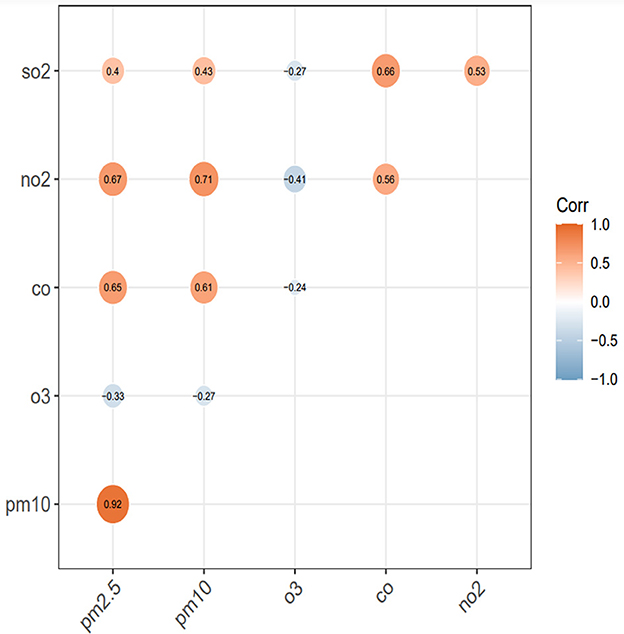
Figure 3. Spearman correlation coefficient matrix between six pollutants.
3.4 The lag effect of pollutants on the incidence of goiter
The impact of six pollutants had different lag effects on goiter (Table 2). The lag effect for PM2.5 and CO (lag1–3days) was significant and relatively longer for NO2 (lag0–3) and O3 (lag2–7). For PM10, the lag effect was significant only at lag1 and lag3. The accumulated lag effect for PM2.5 (lag01–06days), PM10 (lag01–03days), O3 (lag04–07), NO2 (lag00–07) and CO (lag01–05days) was significant and relatively longer. Besides, the lag effect for SO2 on goiter was not statistically significant.
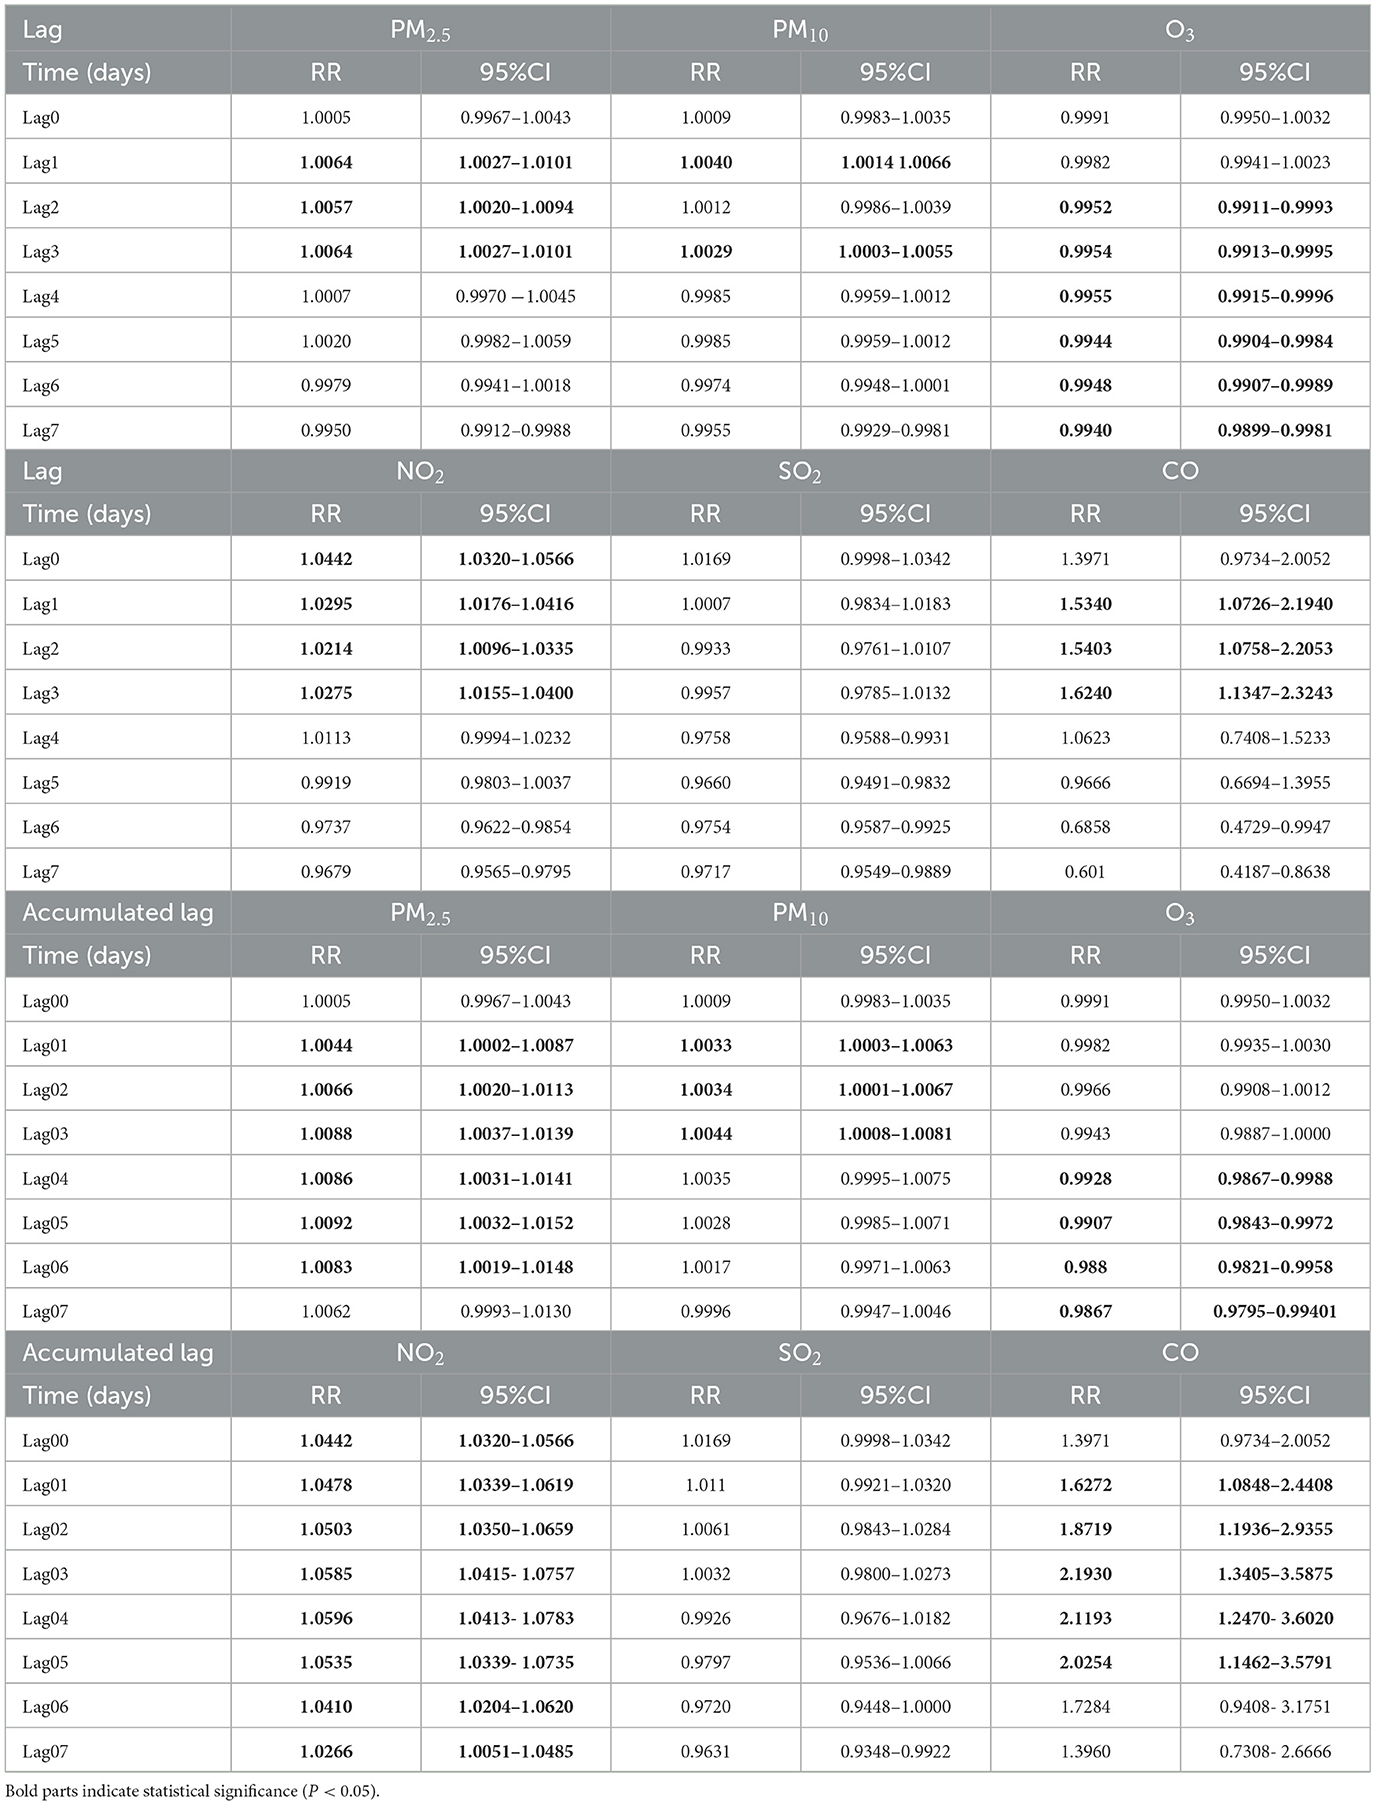
Table 2. Delayed effect of single pollutant on goiter based on GAM model.
Specifically, a 10μg/m3 increase in PM2.5, PM10, NO2 and a 1μg/m3 increase in CO was associated with 0.92% (RR: 1.0092; 95%CI: 1.0032–1.015),0.44% (RR:1.0044; 95% CI: 1.0008–1.0081), 5.96% (RR: 1.0596; 95% CI: 1.0413, 1.0783) and 62.4% (RR: 1.624; 95% CI: 1.1347, 2.3243) increased risk of goiter on the optimal lag day.
3.5 Response-relationship between pollutants and the number of patients with goiter
The dose-response relationship between pollutants concentration and goiter were shown in Figure 4. As the concentration of PM2.5 and PM10 increases, the risk of goiter showed a near linear increase trend, and an exponential increase trend with NO2 and SO2 increase. O3 exhibits a protective effect against goiter, and as O3 concentration increases, the risk of goiter decreases continuously. As the concentration of CO increases, the risk of disease shows a trend of first increasing and then slowly decreasing.
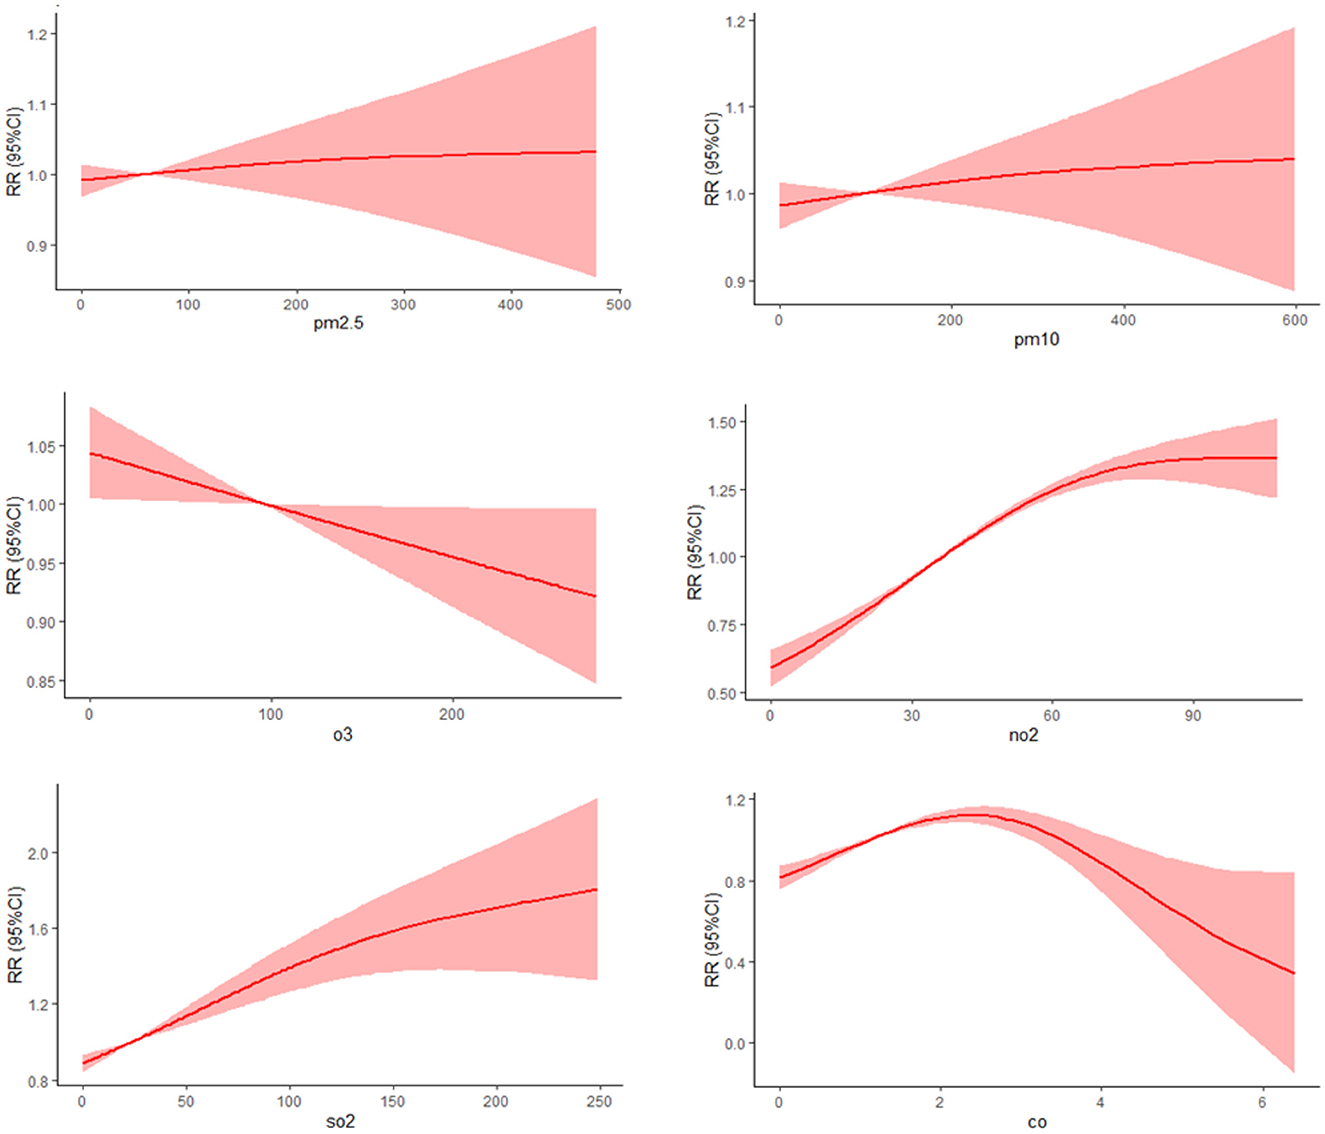
Figure 4. Dose relationship curve between air pollutants and goiter.
3.6 Stratified analyses by gender, age, and season
In gender stratification, PM2.5 and CO have statistical significance for the female population, while NO2 has statistical significance for both males and females. Women are more sensitive to NO2 than men. When NO2 concentration increases by 10 μg/m3, the RR of goiter in female and male populations are 1.065(1.046,1.084) and 1.042(1.006,1.079), respectively; When the concentration of PM2.5 and CO increases by 10 μg/m3 and 1 mg/m3 separately, the RR of goiter in the female population are 1.01(1.003,1.016) and 1.937 (1.179,3.183) (Figure 5).
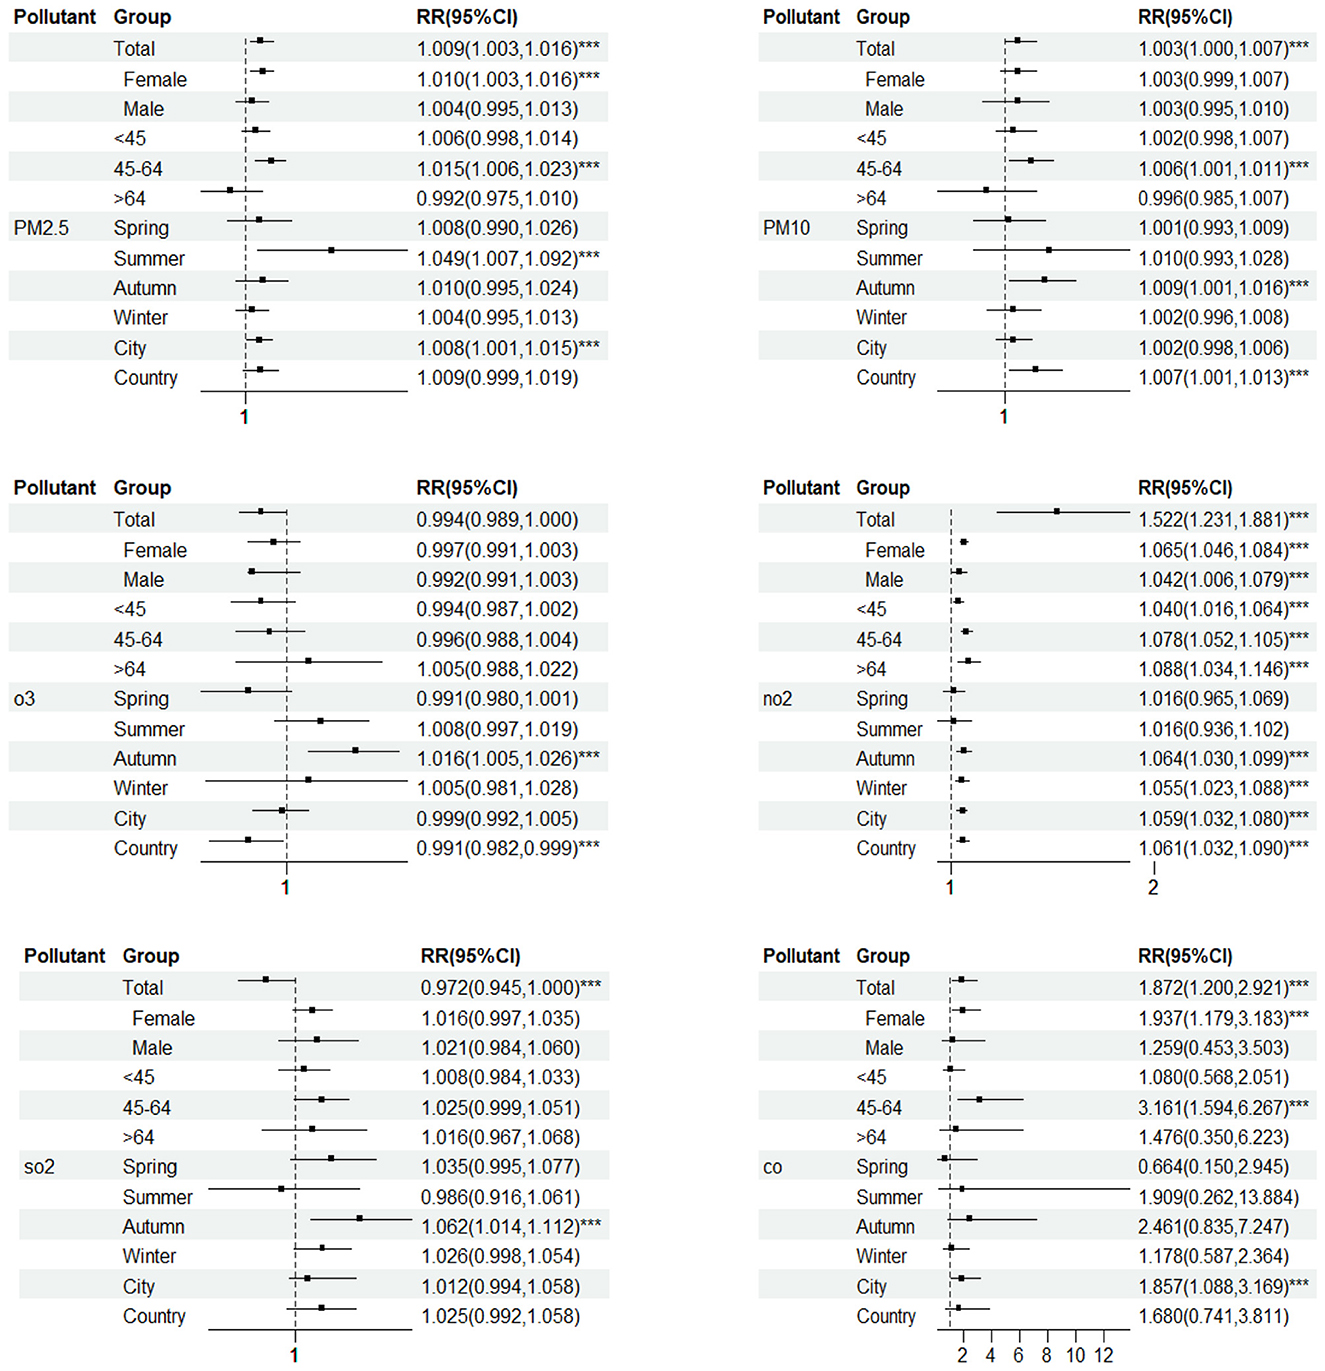
Figure 5. The health effects of pollutants on different population groups. ***Represents statistically significant (P < 0.05).
In different age groups, PM2.5, PM10, and CO have significant effects on the population aged 45–65. When the concentration of pollutants increases by 10 μg/m3 (CO increases by 1mg/m3), the RR of goiter increased by 1.48%, 0.61%, and 3.1609 times, respectively; NO2 has statistical significance in all age groups. When NO2 concentration increases by 10 μg/m3, the RR of goiter in <45 years old, 45–64 years old, and >65 years old age groups increased by 3.96%, 7.79%, and 8.8%, respectively (Figure 5).
PM2.5 had a significant effect on goiter in Summer. When the pollutant concentration increases by 10 μ g/m3, the RR of goiter increased by 4.87%; However, PM10, NO2, and SO2 have a more significant impact on goiter in autumn. When the pollutant concentration increases by 10 μ g/m3, the RR of goiter increased by 0.87%, 6.38%, and 12.44%, respectively; In winter, NO2 has a more significant impact on goiter. When the concentration of pollutants increases by 10 μg/m3, the RR of goiter increased by 5.48% (Figure 5).
3.7 Dual pollutant analysis
There is an interactive effect between pollutants on diseases. Except for O3, other pollutants have a certain synergistic effect on thyroid goiter. Adding PM10 to PM2.5 has the significant impact on goiter, with a 1.0111% (95% CI: 1.0051, 1.0171) risk for goiter; Adding NO2 to PM2.5 with a 1.0701% (95% CI: 1.0512, 1.0894) risk for goiter; Adding PM2.5, PM10, O3, NO2, SO2 separately to CO may increase the risk of thyroid goiter by 2.5746 times(RR:2.5746, 95% CI: 1.4894–4.4505), 2.34 times(RR:2.34, 95% CI: 1.3845–3.955), 2.1893 times(RR:2.1893, 95% CI: 1.3383–3.5815),1.6727 times (RR:1.6727, 95% CI: 1.0053–2.7832) and 2.2812 times (RR:2.2812, 95% CI: 1.3908–3.7416). However, O3 exhibited antagonistic effects against other pollutants.
3.8 Model fitting results and verification
The GAM model was used to fit each pollutant data separately, and all smoothing terms reached significance at the p < 0.05 level (Table 3). After adjusting the interference factor temperature in the model, the relative risk has decreased slightly, but it is still statistically significant. The adjusted R2 values of each model in Table 3 are around 80%, indicating a good fitting effect of the GAM model.
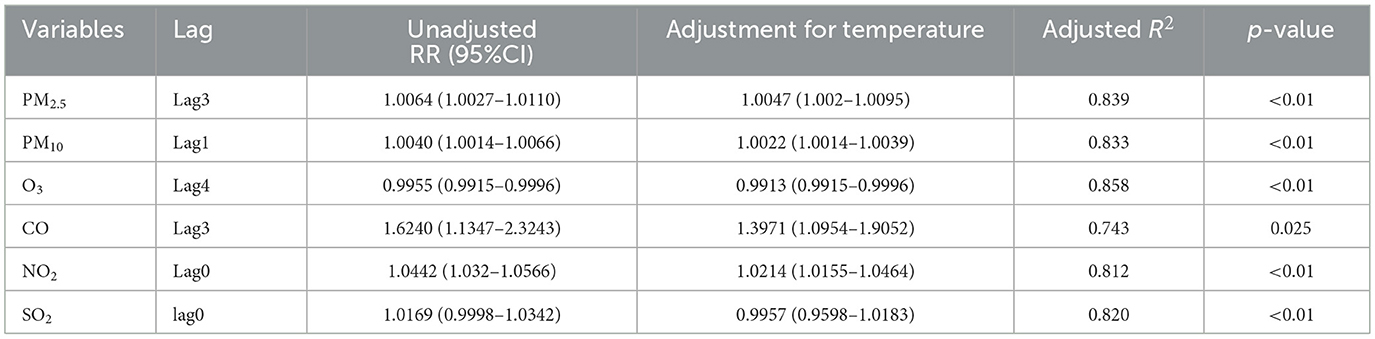
Table 3. Adjusted RR for the association of air pollutants and thyroid goiter.
3.9 Sensitivity analysis
The degrees of freedom for selecting time are 5, 6, 7, 8, and 9, respectively. The effects of PM2.5, PM10, NO2, and CO on the risk of goiter are statistically significant, and according to the increase in degrees of freedom, it can be seen that there is little change in the RR with 95% confidence interval, indicating that the model is relatively stable (Table 4).
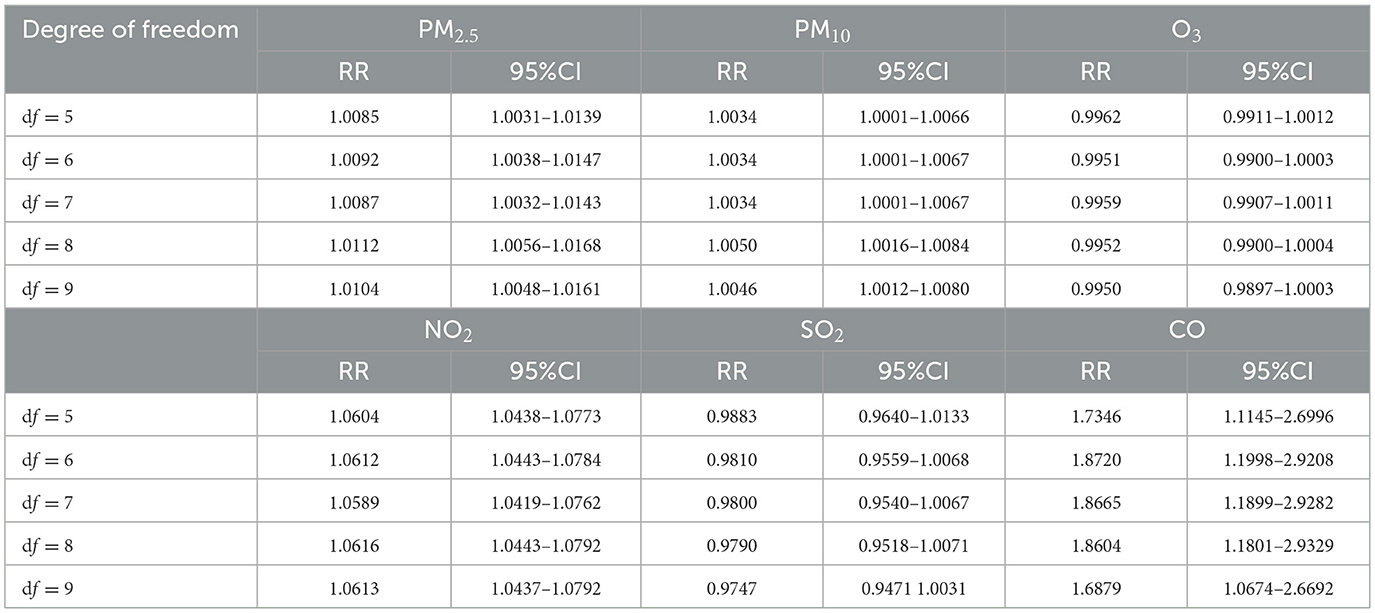
Table 4. The effect of increasing pollutants concentration by 10 μg/m3 (CO increase by 1 mg/m3) at different degrees of freedom on goiter.
4 Discussion
The present study suggests that long-term exposure to air pollutions (PM2.5, PM10, NO2, CO) may be associated with an increased risk of goiter diseases based on a 9 years of time series data in Luoyang.
In our study, we found that females patients with goiter are predominant, 78.58% female, 21.42% male, which goes with study in Diwaniyah Teaching hospital of Iraq by Adel Mosa et al. in which 74.3% of patients was females (1). In our study, the mean age of patients was 51 years old, this is more than that reported by Mishra (48 year) (22). The commonest ages at presentation were (45–64 years), this is almost consistent with previous studies (23, 24). Most patients (62.42%) come from urban areas, which may be due to more severe air pollution in cities.
In line with several previous studies (25, 26), we found that PM2.5 had a greater impact on thyroid diseases than PM10 at all lag structures. Compared to PM10, PM2.5 adsorbs toxic substances and heavy metals more readily due to its larger relative surface area, it remains suspended in the atmosphere for longer periods, and it enters the skin and even the bloodstream more easily (27). However, the impact of CO and NO2 on the goiter exceeds that of PM2.5, NO2, and CO are toxic gases that are reported to cause harm to the human respiratory, cardiovascular, and nervous systems. We found a significant correlation between NO2, CO and thyroid goiter. A 10μg/m3 increase in NO2 concentration and a 1μg/m3 increase in CO was associated with 5.96% and 62.4% increased risk of goiter. CO can form carboxyhemoglobin with free thyroxine in the body, and this hemoglobin can serve as a target for cancer cells to some extent, causing hyperthyroidism and further inducing cancer (28). The study also found that long term inhalation of high concentrations of NO2 may increase the risk of thyroid cancer (29).
In gender stratification, PM2.5, NO2, and CO have a more significant impact on the female population. Although we haven't fully understood the mechanism, numerous pieces of evidence indicate that air pollution is more harmful to women than men, multiple studies also support this conclusion (30, 31). According to the WHO, in 2012, over 60% of premature deaths caused by indoor air pollution were women and children. Our age-stratified analysis found that PM2.5, PM10, NO2 and CO have significant effects on the population aged 45–65, this may be due to the fact that this age group has the highest number of patients, and multiple studies have reported that air pollutants cause the greatest harm to middle-aged and older people (29, 32). We found a significant association between pollutions and thyroid goiter in autumn, but not in warm seasons, consistent with previous studies on PM and respiratory diseases (27). A recent study also has found significant seasonal variations in thyroid stimulating hormone (TSH) and thyroid hormone levels (T3, FT3, T4, FT4) (33).
Concentrations exposure-response relationships showed a near linear increased trend between PM and goiter, and an exponential increased trend with NO2 and SO2 increase; China is one of the most polluted countries in the world due to the rapid industrialization and urbanization. However, as the concentration of CO increases, the risk of disease shows a trend of first increasing and then slowly decreasing. Chen et al. (34) also reported the same result in their study on the impact of CO on the incidence of conjunctivitis, with a weaker effect at higher concentrations. This non-linear relationship may be because people avoid spending time outside or wear a dust mask when outside when the air is heavily polluted (25).
Our two-pollutant model indicated that the association between pollutions and thyroid diseases remained positive and the risk increased, but not significant after adjusting for O3. The addition of NO2 to other pollutants showed statistical significance within 1–7 days. The addition of NO2 to PM2.5, PM10, and CO all reached their maximum effect values on the third day, while the addition of SO2 reached its maximum effect on the 4th day. The addition of CO to PM2.5, PM10, O3, and SO2 has statistical significance from 1 to 5 days, and reaches the maximum effect value on the third day. These results indicate that there is a synergistic effect between PM2.5, PM10, NO2, and CO, while O3 has an antagonistic effect with other pollutants. Fervers et al. (35) also reported similar results regarding air pollutants and breast cancer risk.
5 Potential mechanism
There are several possible reasons to explain the impact of air pollutants on thyroid goiter. Hypothyroidism or chronic inflammation resulting in decreased thyroid function, elevated TSH levels in patients, and further growth of the thyroid gland after TSH elevation, resulting in gradual increase in thyroid volume, is currently a common thyroid goiter (36); According to reports, air pollution has a significant impact on hypothyroidism (37); Inflammatory lesions can cause bleeding, increased fluid in the thyroid gland, or other conditions that lead to an increase in thyroid volume; Thyroid tumors, including benign and malignant tumors, can lead to goiter. It's reported by Al-Rekabi and Habban (1), thyroid tumor rate was 21.6% from patients with goiter and Eusebio Chiefari reported this proportion was 12.5% in Italy (38). Several studies also found that air pollution increases the risk of thyroid tumors (39, 40).
6 Limitations
Despite providing direct evidence for the association between air pollution and thyroid goiter, this study has several limitations. Firstly, this study was conducted based on existing air quality monitoring data of Luoyang and goiter records in hospitals, there may be a data gap, which may impact the results and lead to either underestimation or overestimation of air pollutants exposure levels. Secondly, this study did not fully consider other environmental factors that may affect goiter, such as humidity, atmospheric pressure, etc., which may interact with air pollutants and influenza the incidence of goiter. Further research is needed to explore the association of climate conditions with thyroid diseases.
7 Conclusion
The main results of this study suggested that long-term exposure to air pollutants (PM2.5, PM10, NO2, and CO) may be associated with an increased risk of thyroid diseases. These associations were stronger for people more than 45 years old and during the autumn, especially for women. These findings have important implications for policymakers to take concrete actions to reduce atmospheric pollutions concentrations and protect the environment.
Data availability statement
The raw data supporting the conclusions of this article will be made available by the authors, without undue reservation.
Ethics statement
This study was conducted in accordance with the principles in the Declaration of Helsinki. The data used in this dissertation were inpatient data collected for administrative purposes and did not contain any identifiable personal information. The Institutional Review Board (IRB) of the First Affiliated Hospital, Henan University of Science and Technology, granted exemptions from obtaining ethical approval and consent to participate because the data collected did not involve any direct or indirect identification of participants. The researchers ensured the privacy and confidentiality of the data throughout the study, adhering to the guidelines and regulations set forth in the Declaration of Helsinki.
Author contributions
YD: Methodology, Software, Writing – original draft. HZ: Data curation, Funding acquisition, Investigation, Writing – review & editing. YC: Data curation, Methodology, Writing – original draft.
Funding
The author(s) declare financial support was received for the research and/or publication of this article. This work was supported by the Key scientific and technological projects in Henan Province (Grant Number 242102320071).
Conflict of interest
The authors declare that the research was conducted in the absence of any commercial or financial relationships that could be construed as a potential conflict of interest.
Generative AI statement
The author(s) declare that no Gen AI was used in the creation of this manuscript.
Any alternative text (alt text) provided alongside figures in this article has been generated by Frontiers with the support of artificial intelligence and reasonable efforts have been made to ensure accuracy, including review by the authors wherever possible. If you identify any issues, please contact us.
Publisher's note
All claims expressed in this article are solely those of the authors and do not necessarily represent those of their affiliated organizations, or those of the publisher, the editors and the reviewers. Any product that may be evaluated in this article, or claim that may be made by its manufacturer, is not guaranteed or endorsed by the publisher.
References
1. Al-Rekabi AM, Habban HG. The rate of thyroid tumor among patients with goiter referred to Al-Diwaniyah Teaching Hospital. Indian J Public Health Res Dev. (2018) 9:391. doi: 10.5958/0976-5506.2018.01486.9
2. Díez JJ, P, Durán-Poveda M. Surgical management of low-risk papillary thyroid cancer in real life in Spain: a nationwide survey of endocrine neck surgeons and endocrinologists. Endocrine. (2024) 83:422–31. doi: 10.1007/s12020-023-03488-3
3. Yang J, Lv Z. China is moving towards the standardised management of paediatric differentiated thyroid cancer. Eur J Nucl Med Mol Imaging. (2024) 51:226–9. doi: 10.1007/s00259-023-06471-2
4. Qilong C, Ying L, Xueting N. China's air quality and respiratory disease mortality based on the spatial panel model. Int J Environ Res Public Health. (2017) 14:1081. doi: 10.3390/ijerph14091081
5. Chang Q, Zhang H, Zhao Y. Ambient air pollution and daily hospital admissions for respiratory system–related diseases in a heavy polluted city in Northeast China. Environ Sci Pollut Res. (2020) 27:10055–64. doi: 10.1007/s11356-020-07678-8
6. Sun J, Zhang N, Yan X, Wang M, Wang J. The effect of ambient fine particulate matter (PM2. 5) on respiratory diseases in China: a systematic review and meta-analysis. Stochast Environ Res Risk Assess. (2020) 34, 593–610. doi: 10.1007/s00477-020-01786-0
7. Garelnabi M, Uzoigwe J, Prum T, Bresnahan E. The emerging role of outdoor and indoor air pollution in cardiovascular disease. N Am J Med Sci. (2013) 5:445–53. doi: 10.4103/1947-2714.117290
8. Vahedian M, Khanjani N, Mirzaee M, Koolivand A. Ambient air pollution and daily hospital admissions for cardiovascular diseases in Arak, Iran. ARYA Atheroscler. (2017) 13:117–34.
9. Neupane BK, Acharya BK, Cao C, Xu M, Taylor PK, Wang S, et al. Lung cancer risk and its potential association with PM2. 5 in Bagmati province, Nepal—a spatiotemporal study from 2012 to 2021. Front Public Health. (2024) 12:1490973. doi: 10.3389/fpubh.2024.1490973
10. Wei H, Liang F, Cheng W, Zhou R, Wu X, Feng Y, et al. The mechanisms for lung cancer risk of PM2. 5: induction of epithelial-mesenchymal transition and cancer stem cell properties in human non-small cell lung cancer cells. Environ Toxicol. (2017) 32:2341–51. doi: 10.1002/tox.22437
11. Neupane BK, Acharya BK, Cao C, Xu M, Bhattarai H, Yang Y, et al. A systematic review of spatial and temporal epidemiological approaches, focus on lung cancer risk associated with particulate matter. BMC Public Health. (2024) 24:2945. doi: 10.1186/s12889-024-20431-x
12. Song Z, Wang C, Hou Y, Wang B, Chen W. Correction to: Time series analysis of PM2. 5pollution risk based on the supply and demand of PM2. 5removal service: a case study of the urban areas of Beijing. Environ Monitor Assess. (2024) 196:637. doi: 10.1007/s10661-024-12905-7
13. Liang R, Fan L, Lai X, Shi D, Wang H, Shi W, et al. Air pollution exposure, accelerated biological aging, and increased thyroid dysfunction risk: evidence from a nationwide prospective study. Environ Int. (2024) 188:108773. doi: 10.1016/j.envint.2024.108773
14. Zhao Y, Cao Z, Li H, Su X, Yang Y, Liu C, et al. Air pollution exposure in association with maternal thyroid function during early pregnancy. J Hazard Mat. (2019) 367:188–93. doi: 10.1016/j.jhazmat.2018.12.078
15. Korevaar, Tim IM. Fine particle air pollution may alter newborn thyroid function. Clin Thyroidol. (2016) 28:337–9. doi: 10.1089/ct.2016;28.337-339
16. Zahra M, Jafar H, Méndez-Arriaga F, Ghaem H. Environmental factors and incidence of thyroid cancer in the world (1990–2019): an ecological study. Environ Sci Pollut Res. (2023) 30:100072–7. doi: 10.1007/s11356-023-29435-3
17. Zeng Y, He H, Wang X, Zhang M, An Z. Climate and air pollution exposure are associated with thyroid function parameters: a retrospective cross-sectional study. J Endocrinol Invest. (2021) 44:1515–23. doi: 10.1007/s40618-020-01461-9
18. Chen YJ, Hou WM, Dong JJ. Time series analyses based on the joint lagged effect analysis of pollution and meteorological factors of hemorrhagic fever with renal syndrome and the construction of prediction model. PLoS Neglect Trop Dis. (2023) 17:e0010806. doi: 10.1371/journal.pntd.0010806
19. Kim J, Yang HE. Generalized additive model of air pollution to daily mortality. Key Eng Mat. (2005) 277–9:487–91. doi: 10.4028/www.scientific.net/KEM.277-279.487
20. Wang H, Yan W, Zhang G, Dong J, Wang J. Association between air pollution and hospital admissions for chronic obstructive pulmonary disease: a time series analysis in Dingxi, China, 2018–2020. Air Qual Atmos Health. (2024) 17:865–76. doi: 10.1007/s11869-023-01486-y
21. Qu H, Wang J. Effect of atmospheric pollution on the health of soccer players using generalized additive models. Soft Comput. (2024) 28:2271–89. doi: 10.1007/s00500-023-09590-y
22. Mishra AMK. Thyroid malignancy in endemic nodular goitres: prevalence, pattern and treatment. Eur J Surg Oncol (EJSO). 27:699. doi: 10.1053/ejso.2001.1155
23. Sawka AM, Thabane L, Parlea L, Ibrahim-Zada I, Tsang RW, Brierley JD, et al. Second primary malignancy risk after radioactive iodine treatment for thyroid cancer: a systematic review and meta-analysis. Thyroid. (2009) 19:451–7. doi: 10.1089/thy.2008.0392
24. Lin YS, Wu HY, Yu MC, Hsu CC, Chao TC. Patient outcomes following surgical management of multinodular goiter: Does multinodularity increase the risk of thyroid malignancy? Medicine. (2016) 95:e4194. doi: 10.1097/MD.0000000000004194
25. Tian Y, Liu H, Wu Y, Si Y, Li M, Wu Y, et al. Ambient particulate matter pollution and adult hospital admissions for pneumonia in urban China: a national time series analysis for 2014 through 2017. PLoS Med. (2019) 16:e1003010. doi: 10.1371/journal.pmed.1003010
26. Yao C, Wang Y, Williams C, Xu C, Kartsonaki C, Lin Y, et al. The association between high particulate matter pollution and daily cause-specific hospital admissions: a time-series study in Yichang, China. Environ Sci Pollut Res Int. (2020) 27:5240–50. doi: 10.1007/s11356-019-06734-2
27. Peng W, Li H, Peng L, Wang Y, Wang W. Effects of particulate matter on hospital admissions for respiratory diseases: an ecological study based on 12. 5 years of time series data in Shanghai. Environ Health. (2022) 21:12. doi: 10.1186/s12940-021-00828-6
28. Giannoula E, Melidis C, Frangos S, Papadopoulos N, Koutsouki G, Iakovou I. Ecological study on thyroid cancer incidence and mortality in association with European union member states' air pollution. Int J Environ Res Public Health. (2020) 18:153. doi: 10.3390/ijerph18010153
29. Zhou J, Liang B, Liu Y, Wang S, Xu H, Li K, et al. Exploring temporal trends and influencing factors for thyroid cancer in Guangzhou, China: 2004–2018. Endocrine. (2024) 84:509–23. doi: 10.1007/s12020-023-03578-2
30. Tseng CY, Huang YC, Su SY, Huang JY, Lai CH, Lung CC, et al. Cell type specificity of female lung cancer associated with sulfur dioxide from air pollutants in Taiwan: An ecological study. BMC Public Health. (2012) 12:4. doi: 10.1186/1471-2458-12-4
31. Tong X, Ho KF. Indoor air pollutants exposure and determinant factors controlling households air quality for elderly people in Hong Kong. ISEE Conf Abs. (2018) 2018. doi: 10.1289/isesisee.2018.P01.1470
32. Cattaneo A, Campo L, Iodice S, Spinazzè A, Olgiati L, Borghi F, et al. Environmental and biological monitoring of personal exposure to air pollutants of adult people living in a metropolitan area. Sci Total Environ. (2021) 767:144916. doi: 10.1016/j.scitotenv.2020.144916
33. Shuai JH, Leng ZF, Wang P, Ji YC. Correlation analysis of serum thyroglobulin, thyroid-stimulating hormone levels, and thyroid-cancer risk in thyroid nodule surgery. World J Clin Cases. (2023) 11:6407–14. doi: 10.12998/wjcc.v11.i27.6407
34. Chen R. A Study on the Impact of Air Pollution on the Incidence of Conjunctivitis in Typical Urban Populations in China. Guangdong: Jinan University (2020).
35. Fervers B, Giampiccolo C, Coudon T, Praud D, Grassot L, Faure E, et al. Joint effects of long-term exposure to multiple air pollutants and breast cancer risk. J Clin Oncol. (2024) 42:10572. doi: 10.1200/JCO.2024.42.16_suppl.10572
36. Brčić L, Gračan S, Barić A, Gunjača I, Torlak Lovrić V, Kolčić I, et al. Association of established thyroid-stimulating hormone and free thyroxine genetic variants with Hashimoto's thyroiditis. Immunol Invest. (2017) 46:625–38. doi: 10.1080/08820139.2017.1308547
37. Hashemipour M, Kelishadi R, Amin MM, Poursafa P, Rashidi M, Mehrnejat N, et al. The association between familial and environmental factors and prevalence of congenital hypothyroidism in center of Iran. Environ Sci Pollut Res Int. (2021) 28:8434–41. doi: 10.1007/s11356-020-10959-x
38. Chiefari E, Innaro N, Gervasi R, Mirabelli M, Giuliano S, Donnici A, et al. Incidental thyroid carcinoma in an endemic goiter area in Italy: histopathological features and predictors of a common finding. Endocrine. (2024) 84:589–97. doi: 10.1007/s12020-023-03659-2
39. Zhang Y, Wang K, Qin W, Jin C, Song Y, Jia P, et al. Six air pollutants associated with increased risk of thyroid nodules: a study of 49 million Chinese adults. Front Endocrinol. (2021) 12:753607. doi: 10.3389/fendo.2021.753607
Keywords: air pollution, goiter, generalized additive model, lag effect, environmental health
Citation: Du Y, Zhou H and Chen Y (2025) The impact of air pollutants on the risk of goiter based on a 9-year time series data. Front. Public Health 13:1663263. doi: 10.3389/fpubh.2025.1663263
Received: 10 July 2025; Accepted: 25 August 2025;
Published: 10 September 2025.
Edited by:
Arthit Phosri, Mahidol University, ThailandReviewed by:
Watcharin Joemsittiprasert, New York Institution for Continuing Education, United StatesBasanta Kumar Neupane, Chinese Academy of Sciences (CAS), China
Copyright © 2025 Du, Zhou and Chen. This is an open-access article distributed under the terms of the Creative Commons Attribution License (CC BY). The use, distribution or reproduction in other forums is permitted, provided the original author(s) and the copyright owner(s) are credited and that the original publication in this journal is cited, in accordance with accepted academic practice. No use, distribution or reproduction is permitted which does not comply with these terms.
*Correspondence: Hua Zhou, emhvdXlhbkBoYXVzdC5lZHUuY24=
†ORCID: Hua Zhou orcid.org/0000-0001-9149-5157