 Huan Ding†
 Qi Zhang
 Zhuping Xu
- Department of Chronic Infectious Disease Control and Prevention, The Affiliated Wuxi Center for Disease Control and Prevention of Nanjing Medical University, Wuxi Center for Disease Control and Prevention, Wuxi, China
Background: Hepatitis C is an inflammation of the liver caused by the hepatitis C virus (HCV) and represents a major public health challenge. This study aimed to explore the epidemiological characteristics and spatiotemporal distribution of hepatitis C in Wuxi City, a developed and low-epidemic area of eastern China, from 2007 to 2021.
Methods: Data were obtained from the Chinese Information System for Disease Control and Prevention, while genotype information was derived from a retrospective survey. Statistical analyses were conducted using SPSS software to identify characteristic differences. Joinpoint regression analysis was applied to examine long-term temporal trends, and the concentration degree was used to quantify seasonal intensity. Kernel density and hotspot analyses were applied to identify spatial distribution patterns and clusters.
Results: A total of 4,771 cases were recorded, with an average annual incidence rate of 5.44 per 100,000 population. The incidence was significantly higher in males than in females (odds ratio = 1.49, χ2 = 144.58, p < 0.05). The incidence of HCV infection increased progressively with age. Genotype 1b (74.5%) was the most prevalent, followed by genotype 3 (15.2%), with subtype 3b being dominant. Sex and age were significantly associated with variations in genotype distribution (both p < 0.001). During the study period, the incidence rate increased from 2.18 to 9.15 per 100,000 population, with an average annual percentage change of 10.50% (95% confidence interval: 6.42–14.74%). No distinct seasonal pattern was observed, with a concentration degree (M) of 0.095. Spatially, HCV cases were mainly concentrated in the city center, and the hotspot areas showed little change across the three study periods.
Conclusion: The incidence of HCV in Wuxi City has increased steadily from 2007 to 2021, with genotypes 1b and 3 being predominant. Spatial clustering was mainly concentrated in urban centers, highlighting the need for targeted prevention and control strategies to support the goal of eliminating HCV as a public health threat by 2030.
1 Introduction
Hepatitis C virus (HCV) is a bloodborne virus pathogen that poses major public health challenges due to its unfavorable long-term clinical outcomes, including chronic hepatitis, liver cirrhosis, and hepatocellular carcinoma (1). In 2016, the World Health Organization (WHO) launched the Global Health Sector Strategy for Viral Hepatitis, which was renewed in 2022, with the aim of eliminating hepatitis B and C as public health threats by 2030. Nevertheless, as of 2019, an estimated 58 million people live with chronic HCV infection, resulting in approximately 399,000 deaths worldwide (2).
Although the overall prevalence of hepatitis C in China is relatively low, the country has the largest number of patients globally. Approximately 7.6 million individuals are chronically infected with HCV (3), and the incidence continues to increase (4). Because HCV infection is often asymptomatic, many infected individuals are unaware of their condition (5). Consequently, the true prevalence of chronic HCV infection is likely underestimated.
The global prevalence of HCV infection varies considerably across WHO regions. The Eastern Mediterranean Region reports the highest prevalence (2.3%), while the Southeast Asia Region reports the lowest (0.5%). The Western Pacific Region, which includes China, has an intermediate prevalence of 0.7% (6). Consistent with the global pattern, studies have demonstrated substantial geographical disparities within China. For instance, using the Yangtze River as a boundary, the prevalence in the northern region (0.53%) is higher than that in the southern region (0.29%) (3).
Given the marked genetic diversity of HCV, the virus can be classified into genotypes, subtypes, strains, and quasispecies, contributing further to regional heterogeneity (7). To date, at least eight genotypes and more than 90 subtypes have been identified. Genotypes 1, 2, and 3 are the most widely distributed globally, whereas genotypes 4 and 5 predominate in Africa and the Middle East, and genotype 6 is primarily found in Southeast Asia. In contrast, genotypes 7 and 8 are rare and have been detected in only a few individuals (8). In China, subtypes 1b and 2a are most prevalent, with subtype 1b being the dominant strain (9–11). Notably, the geographic distribution of HCV genotypes serves as an important epidemiological marker for tracing infection sources within specific populations (12).
Spatiotemporal analysis provides a robust approach for tracing the transmission routes, predicting epidemic trends, evaluating outbreak risks, and formulating prevention and control strategies for HCV infection. By analyzing the temporal trends and spatial distributions, researchers can better understand the epidemic patterns and prevention requirements of hepatitis C and identify priority areas for intervention. Several studies employing spatial–temporal analysis (13, 14) have revealed that hotspots shifted gradually from northeast to western China between 2003 and 2015. These hotspots were predominantly concentrated in economically underdeveloped or border regions, with rural areas showing higher incidence rates than urban areas. However, Yang et al. (15) reported that the urbanization rate was the most critical factor influencing HCV incidence in Jiangsu Province, and that hotspots were progressively shifting from northern to southern regions of the Province.
Wuxi City is one of the 13 prefecture-level cities in Jiangsu Province. However, the spatiotemporal patterns and genotype distribution of HCV in Wuxi remain unclear. Key questions, such as whether spatial clustering exists and where hotspot areas are located, have not been answered. Therefore, this study aimed to address these gaps by conducting a comprehensive spatiotemporal analysis of HCV infection. The findings may enhance understanding of hepatitis C epidemiology and provide valuable insights for more effective prevention and control strategies.
2 Methods
2.1 Study area
Wuxi City, located in southern Jiangsu Province, lies between the Yangtze River to the north and Taihu Lake to the south (Figure 1). It covers an area of 4627.5 km2 and consists of six municipal districts and two county-level municipalities (Jiangyin and Yixing), with a total permanent population of 7.46 million. Wuxi has a highly developed economy and ranked among the top Chinese cities in 2020, with a per capita gross domestic product (GDP) exceeding $ 20,000 (16).
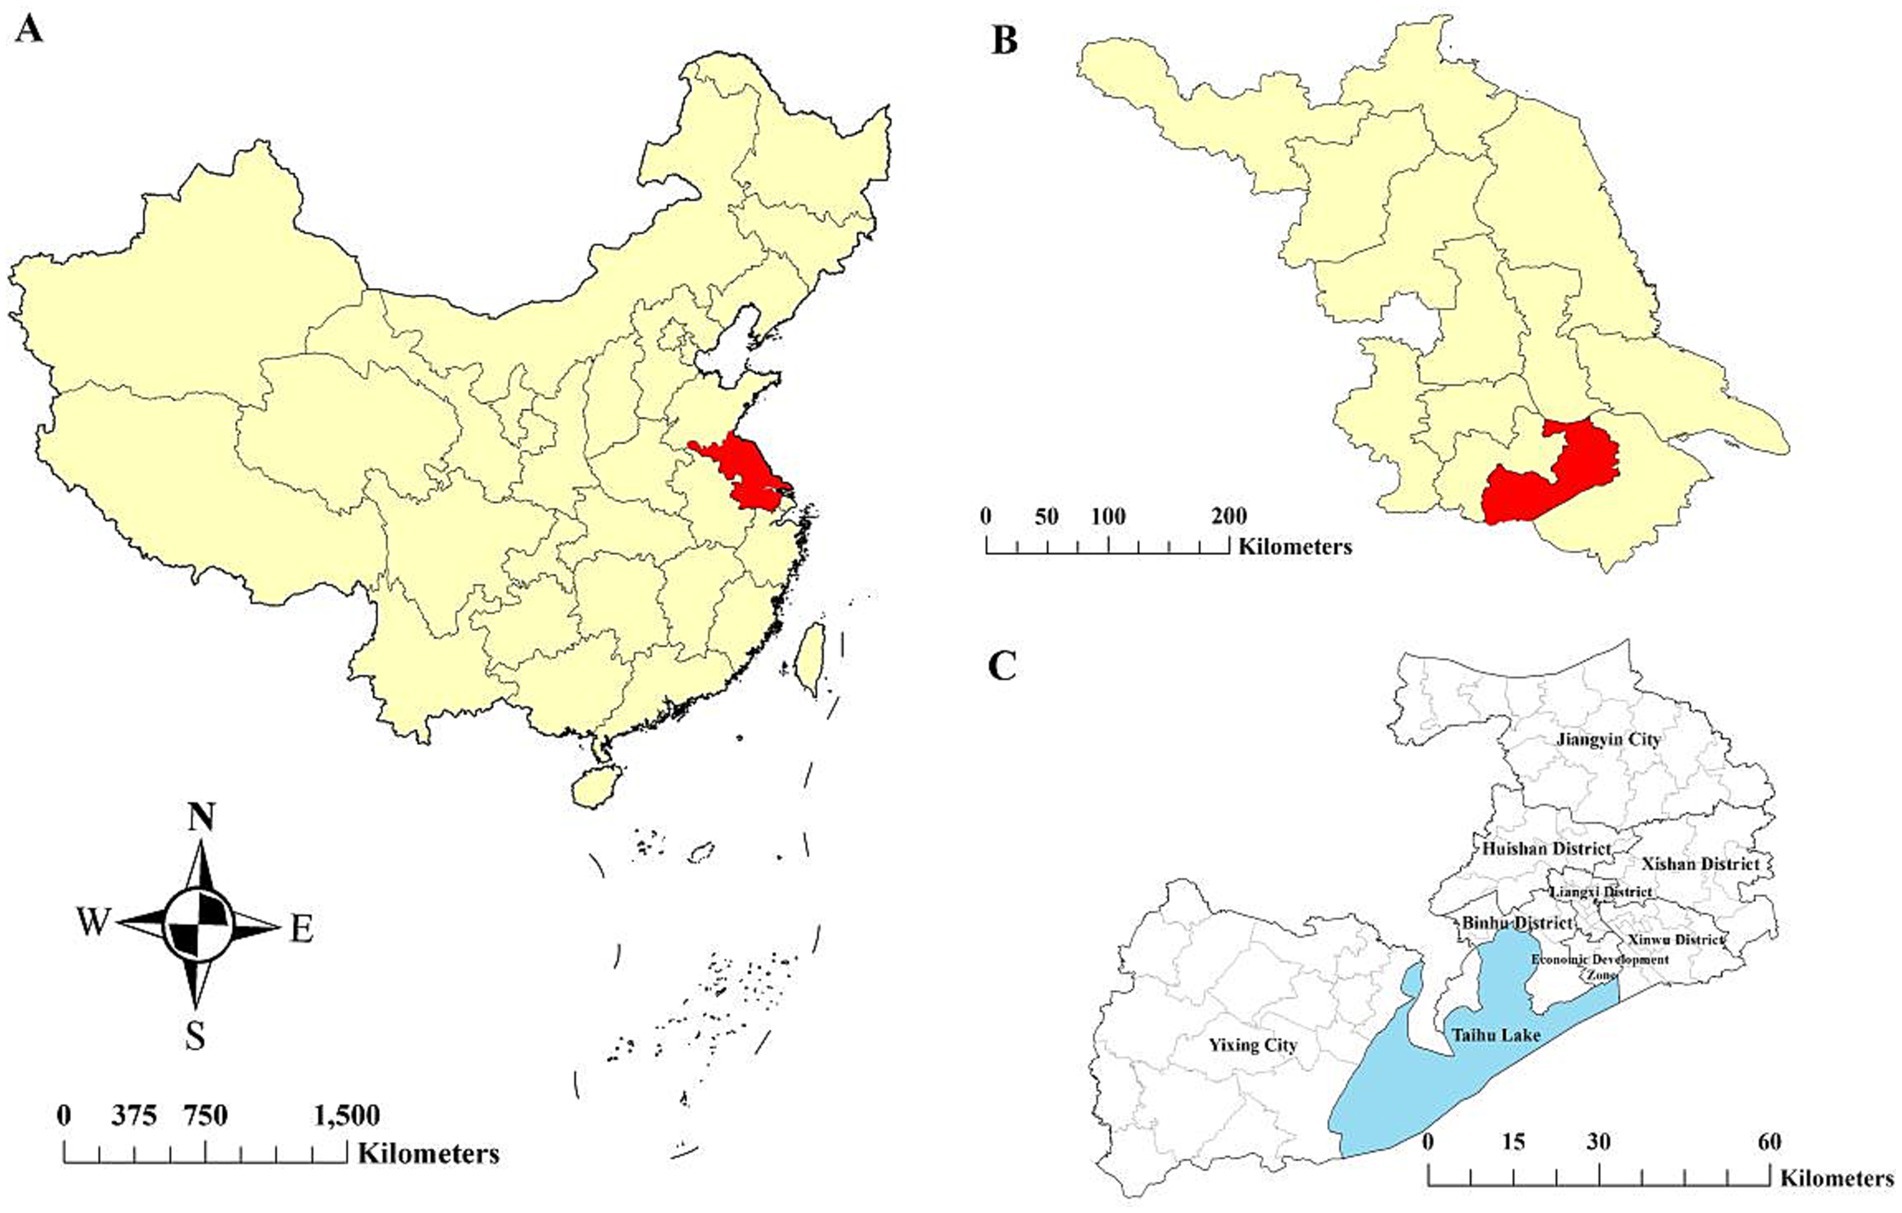
Figure 1. Location of the study area. (A) Jiangsu Province in China, (B) Wuxi City in Jiangsu Province, and (C) six districts and two county-level cities within Wuxi City.
2.2 Criteria for case diagnosis
According to the Diagnostic Criteria for Hepatitis C (WS 213–2018) (17), Hepatitis C cases include confirmed and clinically diagnosed cases. Confirmed cases are defined as those with detectable HCV RNA in the blood. Clinically diagnosed cases are defined as anti-HCV positive individuals who meet any of the following criteria: (a) epidemiological history of exposure; (b) clinical manifestations consistent with hepatitis C; and (c) abnormal biochemical test results.
2.3 Data sources
Data on registered HCV cases from 2007 to 2021 were obtained from the Chinese Information System for Disease Control and Prevention. The analysis was conducted based on the current residential addresses of reported cases. Genotype data were acquired from a 2021 survey of previously reported HCV cases in Wuxi City. Demographic data were sourced from the Wuxi City Statistical Yearbook.
2.4 Data analysis
2.4.1 Descriptive analysis
Descriptive analysis was performed to characterize the demographic distribution of HCV infection. Using SPSS software (version 20.0), we applied the Pearson Chi-square test, the linear-by-linear association test, or Fisher’s exact test to assess group differences. Statistical significance was defined as p < 0.05, and odds ratios (ORs) were calculated to quantify associations.
2.4.2 Temporal analysis
2.4.2.1 Joinpoint regression
A joinpoint regression model (18) was employed to examine the long-term temporal trend in HCV incidence in Wuxi from 2007 to 2021. In this model, crude HCV incidence rates served as the dependent variable, and calendar year was the independent variable. The best-fit model was selected based on the Bayesian information criterion, calculated using a k-joinpoint model reported by Zhang et al. (19). The annual percentage change, average annual percentage change, and 95% confidence intervals (CIs) were calculated as primary outcome indicators. Analyses were conducted using the Joinpoint Regression Program (version 4.9.1.0; US National Cancer Institute Surveillance Research Program).
2.4.2.2 Concentration degree
The concentration degree (20) was used to assess the seasonal intensity of HCV onset, reflecting the degree of temporal aggregation of the disease within a year. The concentration degree value (M) was calculated from the ratio of the number of cases in each month to the total number of cases in the entire year. The formula was as follows:
Where M represents the concentration degree, Ri denotes the dispersion degree, and ri is the ratio of the number of cases in month i to the total number of cases in the year. The value of M ranges from 0 to 1, with M > 0.90 indicating a distinct seasonal pattern, 0.90 ≥ M > 0.50 suggesting a strong seasonal trend, 0.50 ≥ M > 0.30 implying a moderate seasonality, and M ≤ 0.30 reflecting a relatively uniform distribution with weak seasonality.
2.4.3 Spatial analysis
Kernel density estimation was employed to analyze the spatial distribution of HCV cases. Kernel density estimation treats each sample point as a central nucleus and calculates the density per unit area within a defined search radius (bandwidth) to represent the spatial concentration of geographic elements (21). In a given region, a higher number of occurrences of a particular event indicates a greater spatial frequency of that event, whereas a lower count reflects a lower spatial frequency. The density was calculated using the following formula:
Where f(x, y) represents the density value at the spatial coordinate position (x, y), n is the number of HCV cases within the distance scale, h denotes the bandwidth, k is the kernel density function, and di(x, y) represents the distance from HCV case i to (x, y). ArcGIS software (version 10.4; ESRI) was used for kernel density analysis of the HCV spatial distribution characteristics in Wuxi City.
2.4.4 Cluster analysis
Hot spot analysis using the Getis-Ord Gi* statistic (22) was performed to detect spatial clustering patterns, identifying statistically significant hot and cold spots. HCV case data were first aggregated by sub-districts, and incidence rates were calculated. The Getis-Ord Gi* statistic was then computed for each subdistrict based on the equation reported by Zhang et al. (19). Statistical inference was performed using the z-test: values of Gi* > 0 and z > 1.96 indicated spatial clustering of high incidence (hot spots), while Gi* < 0 and z < −1.96 indicated clustering of low incidence (cold spots). A z-score near 0 indicated no spatial clustering. The hot spot analyses were conducted using ArcGIS software (version 10.4; ESRI), with 999 random permutations to assess statistical significance at 95% CIs.
3 Results
3.1 Population distribution
As shown in Table 1, a total of 4,771 cases of HCV were reported from 2007 to 2021 in Wuxi City, corresponding to an average annual incidence rate of 5.44 per 100,000 population. Among these cases, 2,838 were males, with a male-to-female ratio of 1.47:1. The incidence rate was significantly higher in males than in females (OR = 1.49, χ2 = 144.58, p < 0.05). The incidence of HCV infection increased constantly with age. Using the preceding age group as the reference category, the OR values for the 20–39, 40–59, and ≥60 age groups were 8.24, 2.04, and 1.57, respectively (all p < 0.001). Although individuals aged 40–59 accounted for the largest proportion of HCV cases over the 15-year period (43.7%, 2087/4771), the incidence rate was highest among those aged ≥60, reaching 9.81 per 100,000 population. Among all reported cases, confirmed cases accounted for 80.59% (3603/4471), and males had a significantly higher incidence rate than females within this subgroup (OR = 1.52, χ2 = 103.03, p < 0.05).
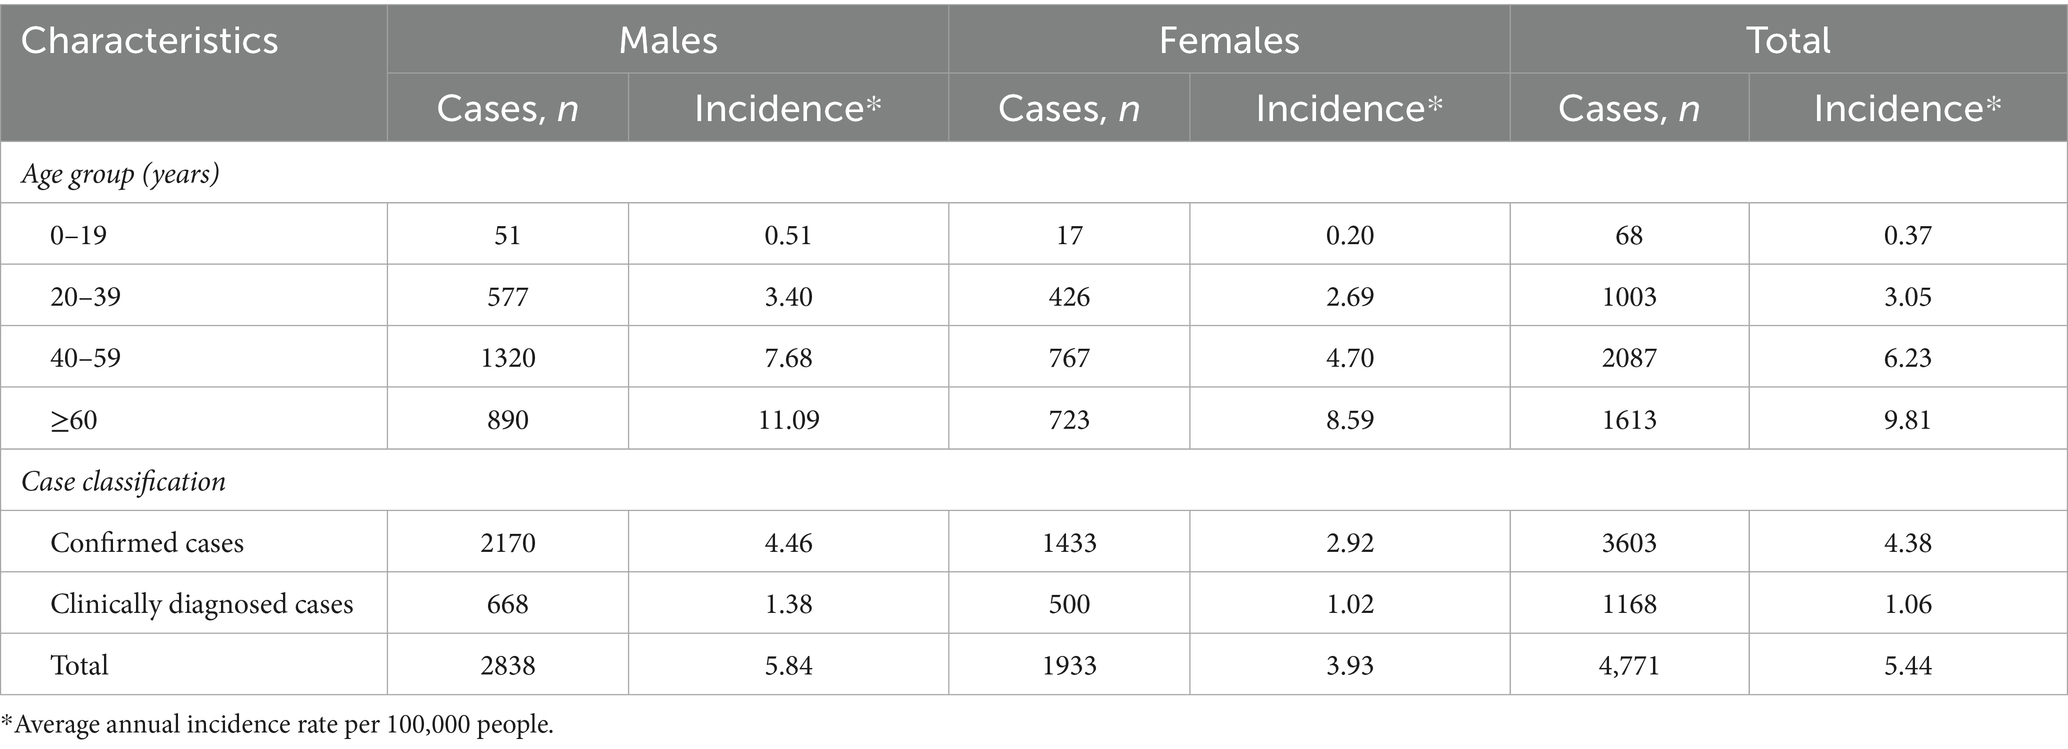
Table 1. The number and incidence of HCV cases with different characteristics in Wuxi City from 2007 to 2021.
3.2 Genotype distribution
Based on the cumulative number of reported HCV cases, the study area (six municipal districts and two county-level municipalities) was stratified into high-, medium-, and low-prevalence categories. From each stratum, 600, 400, and 200 cases were randomly sampled, respectively, yielding 3,000 cases. After excluding individuals who could not be contacted, had died, or no longer resided locally, 1,013 patients were included in the final analysis. Among these, 288 were nucleic acid-positive, and genotyping results were available for 243 cases.
As shown in Table 2, genotype 1b was the most common (74.5%), followed by genotype 3 (15.2%), with subtype 3b being predominant. Genotypes 2a and 6 accounted for 6.6 and 3.7%, respectively. The distribution of HCV genotypes was significantly influenced by sex and age (both p < 0.001). Among reasons for HCV antibody testing, the proportion of high-risk individuals undergoing passive screening was higher than that of those tested after developing clinical symptoms. However, the difference was not statistically significant (p = 0.735).
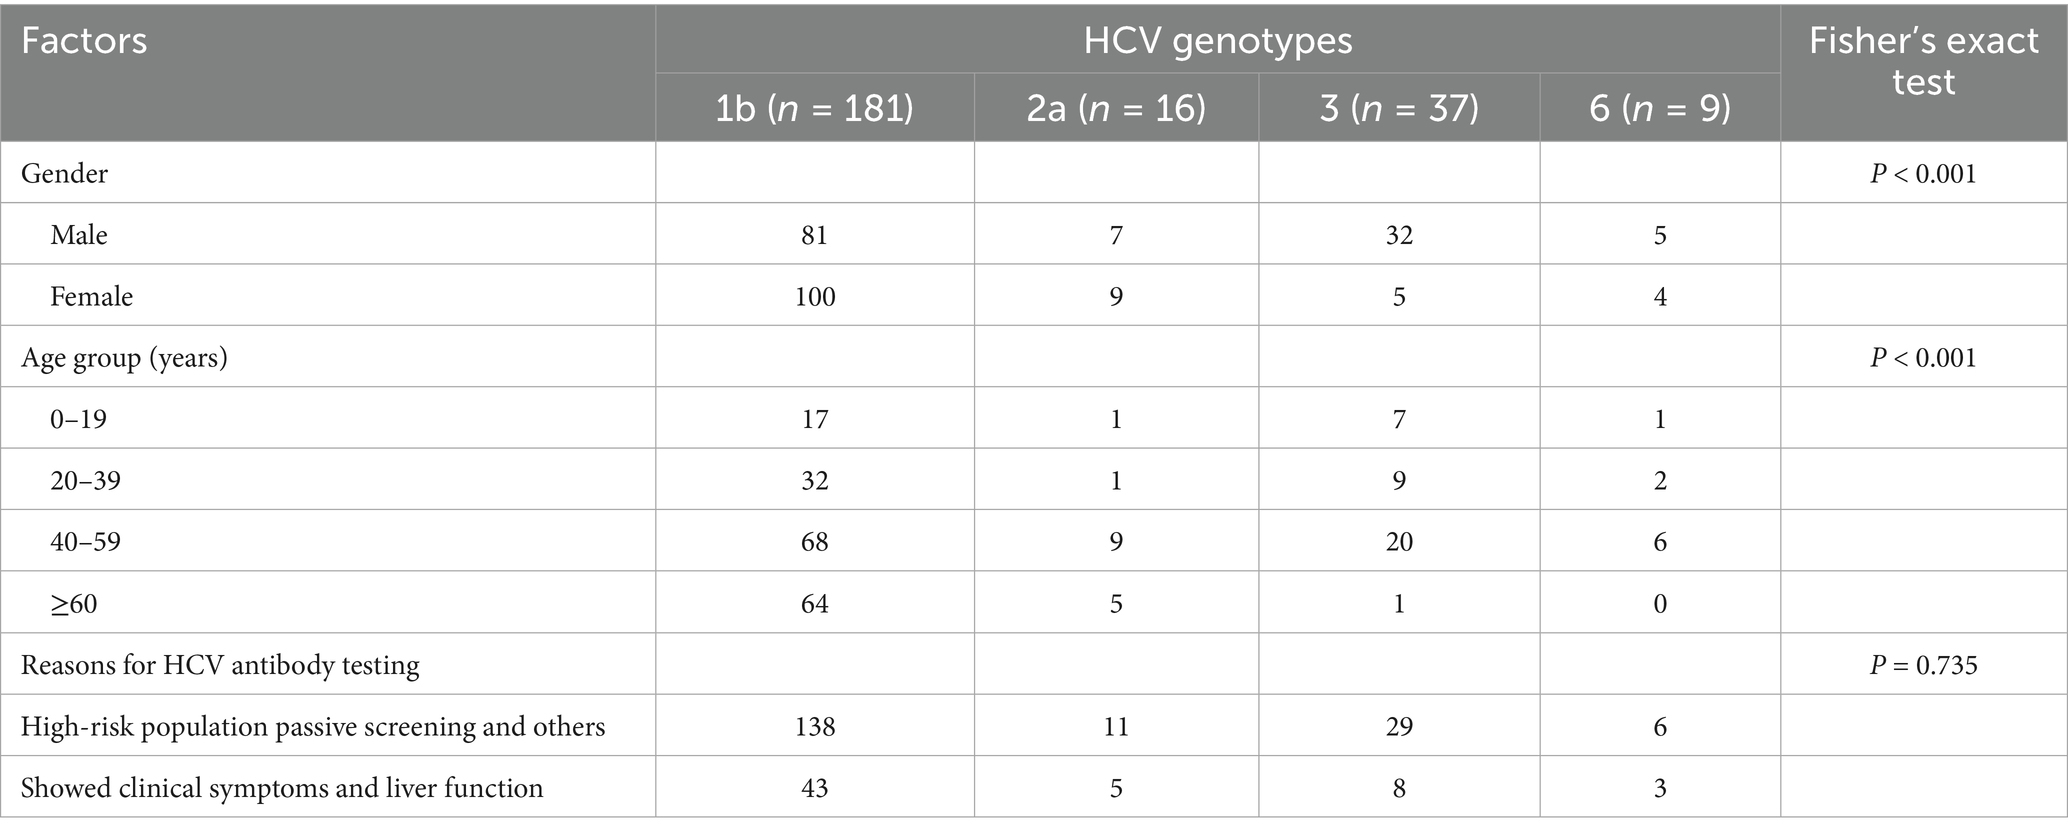
Table 2. The genotype distribution and influencing factors of HCV cases in Wuxi City, 2007–2021.
3.3 Temporal distribution
As illustrated in Figure 2, the incidence rate of HCV infection in Wuxi City increased from 2.18 to 9.15 per 100,000 population between 2007 and 2021, with an average annual percentage change of 10.50% (95% CI: 6.42–14.74%). Joinpoint regression analysis identified two distinct phases. From 2007 onward, the incidence increased annually, with an annual percentage change of 12.43% (95% CI: 8.59–16.02%), reaching a peak during 2016–2017. Subsequently, the rate continued to increase gradually, with an annual percentage change of 5.83% (95% CI: −0.7–15.9%) from 2017 to 2021. Although a marked decline was observed in 2018, the joinpoint trend analysis did not reveal a statistically significant downward trend during this period.
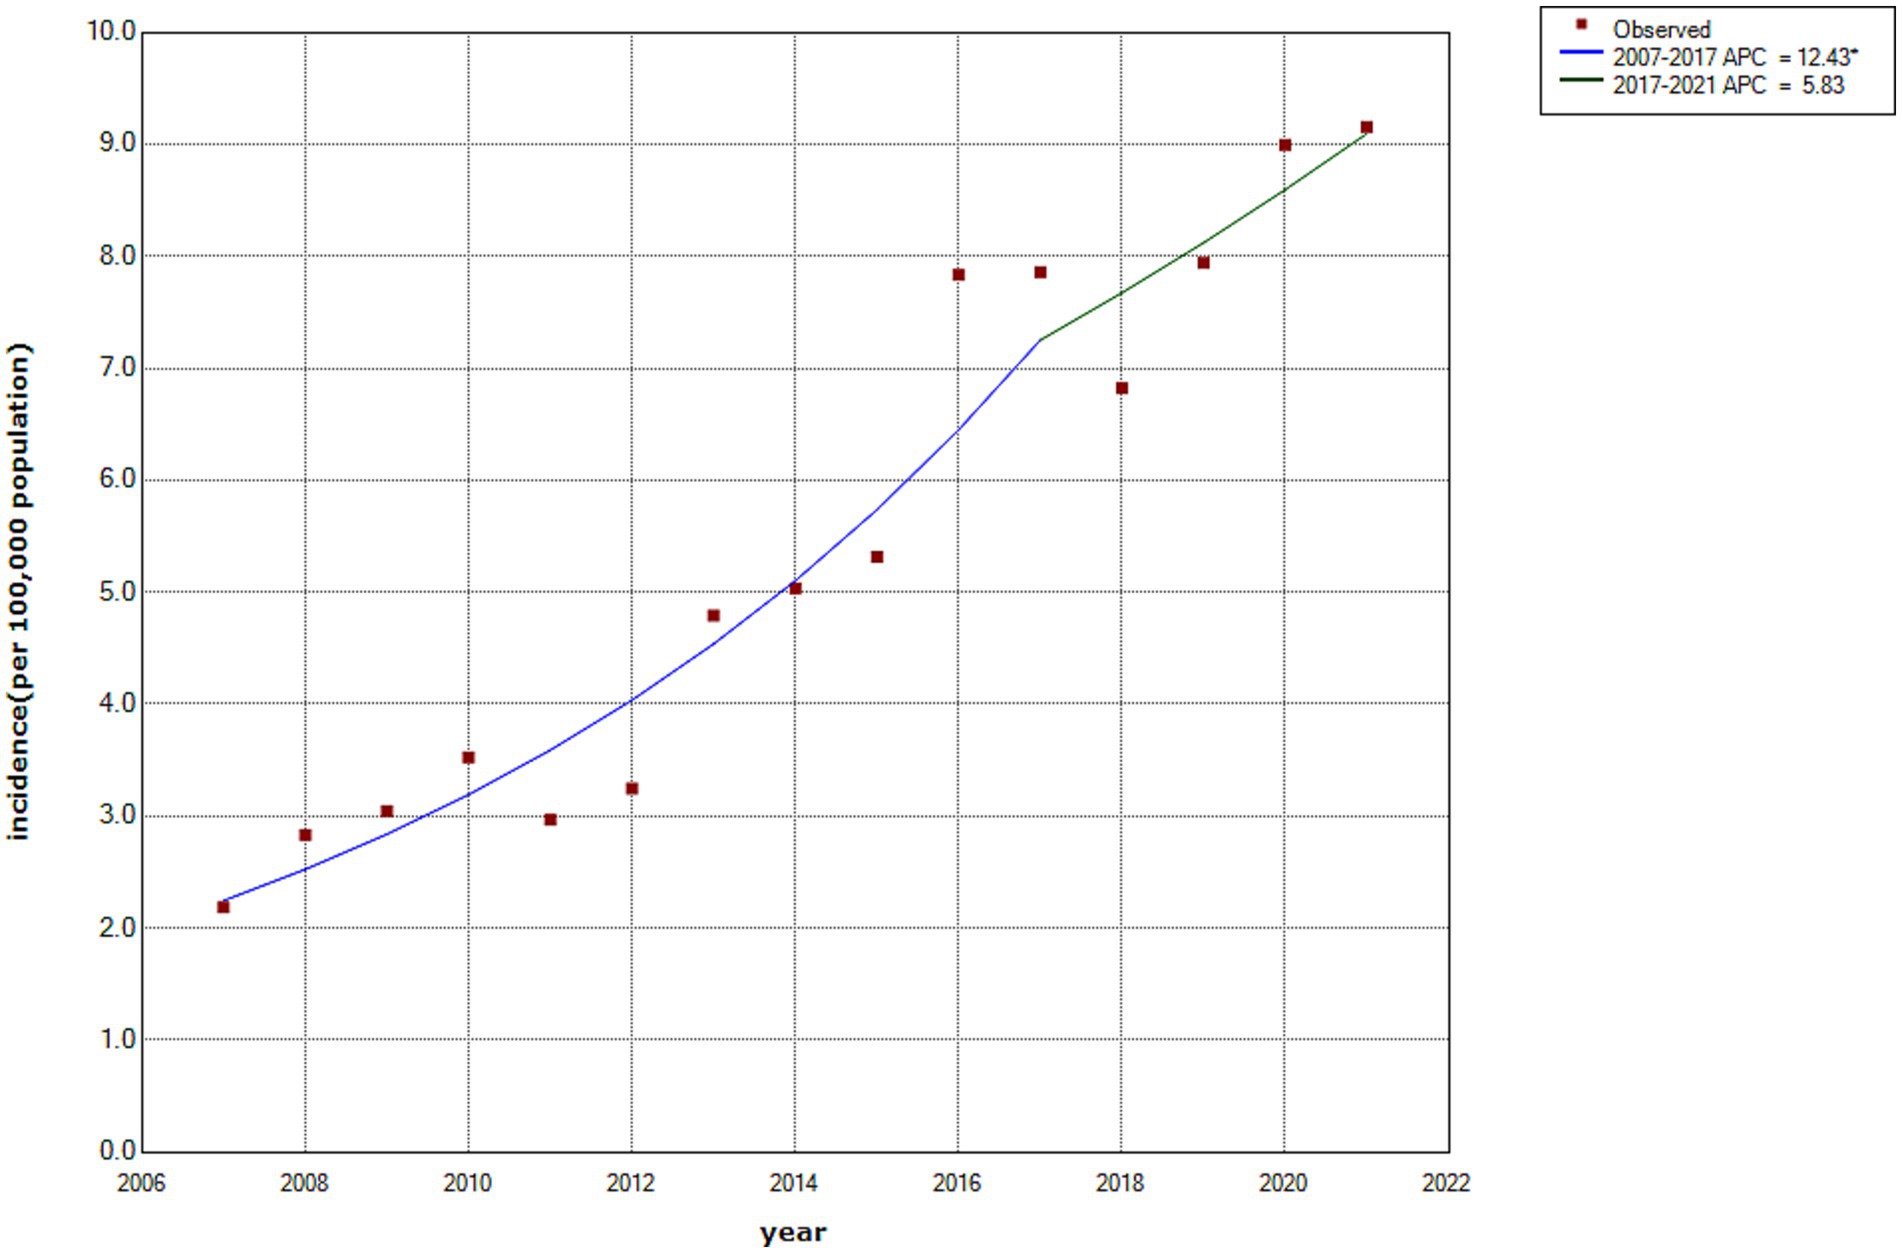
Figure 2. Temporal trend of HCV incidence in Wuxi City, 2007–2021.
Monthly reporting from 2007 to 2021 showed the fewest HCV cases in February. As shown in Figure 3A, the seasonal trend exhibited no clear seasonal pattern and presented a multimodal distribution. The overall M value, calculated using the formula described earlier, was 0.095 (95% CI: 0.071–0.117). In contrast, annual M values ranged from 0.037 to 0.185, indicating weak seasonal intensity in HCV cases (Figure 3B) and incidence (Figure 3C).
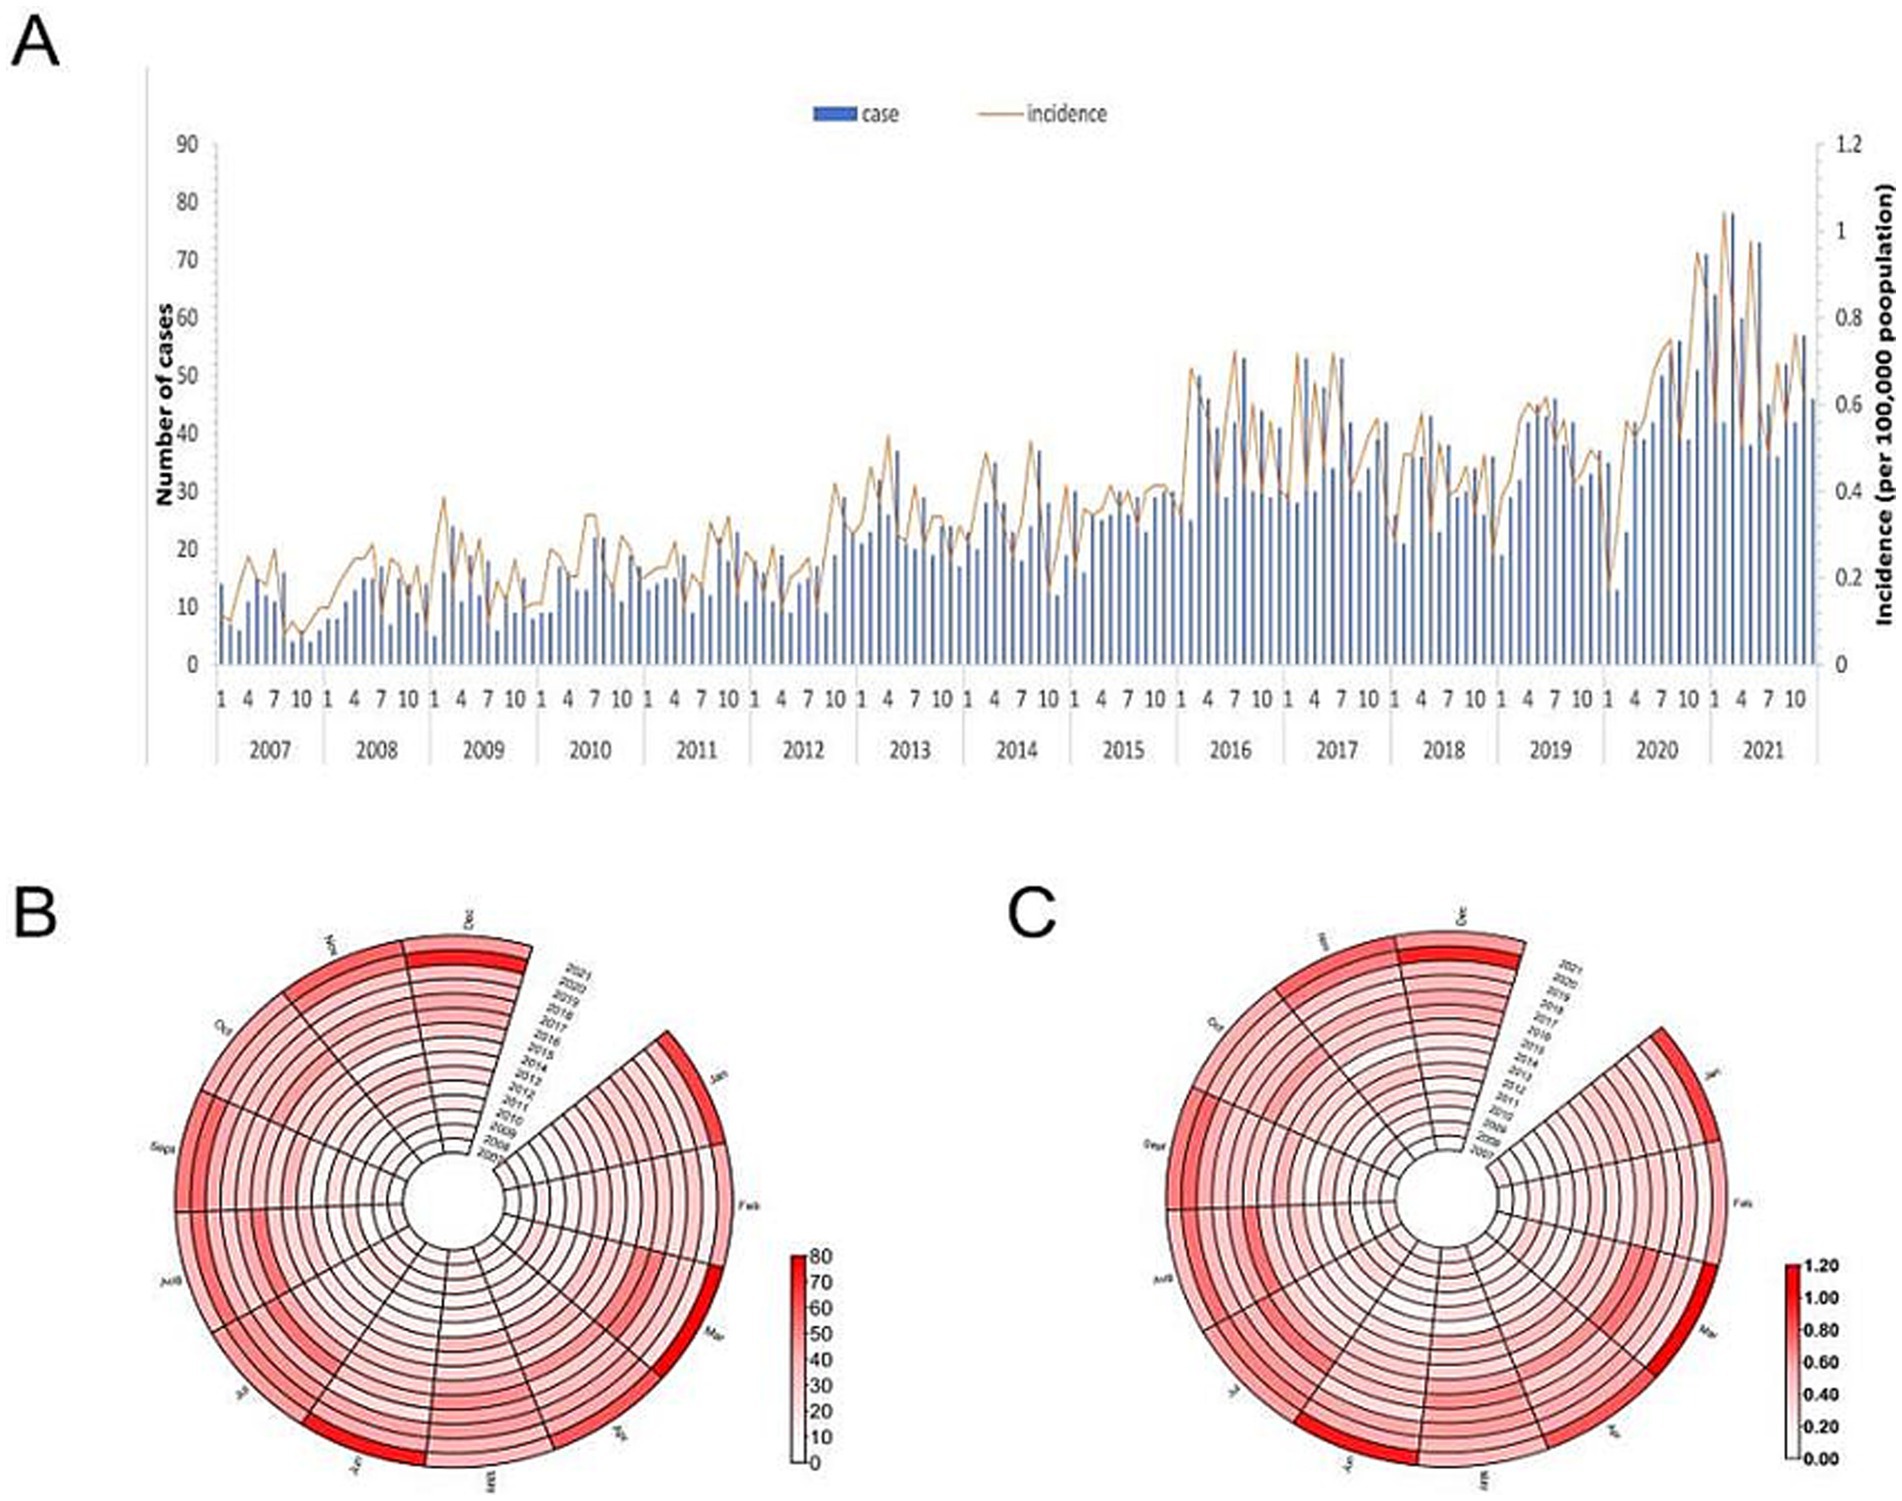
Figure 3. (A) Number and the incidence of HCV cases reported each month, (B) Monthly distribution of HCV cases, and (C) Monthly distribution of HCV incidence in Wuxi city, 2007-2021.
3.4 Spatial distribution
Figure 4 depicts the spatial distribution of HCV cases in Wuxi City at the township level from 2007 to 2021, revealing pronounced spatial clustering in the central downtown area of Liangxi District. Comparing kernel density values across three time periods (2007–2011, 2012–2016, and 2017–2021) showed that high-density areas gradually expanded and that the values increased, particularly during 2017–2021. Similar spatial clustering patterns were also observed in Yixing, a county-level municipality located Southwest of Wuxi.
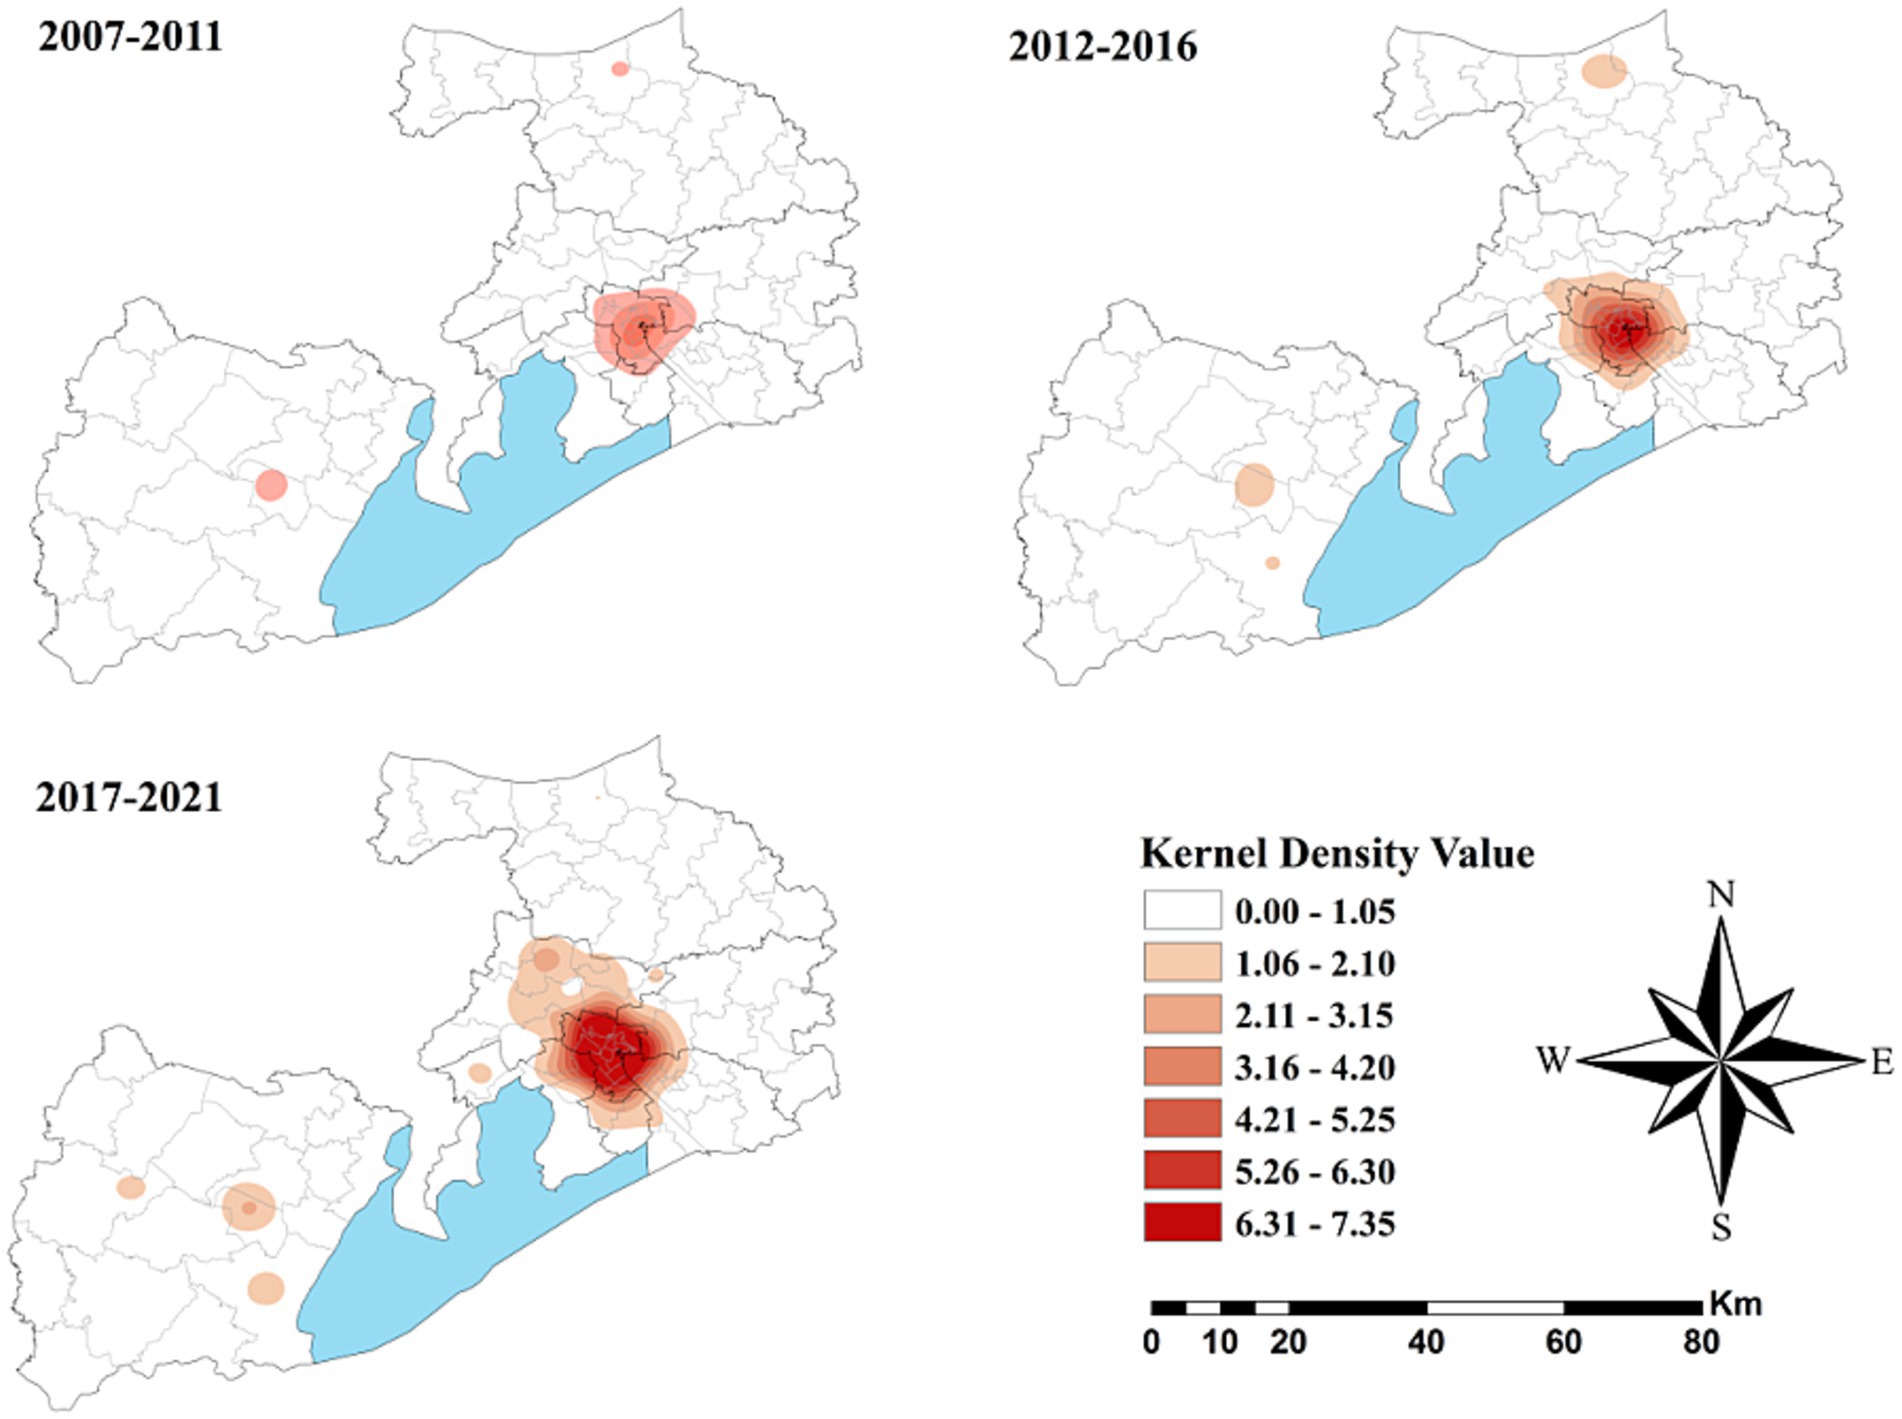
Figure 4. Spatial distribution of HCV cases in Wuxi City at the county level, 2007–2021.
3.5 Cluster analysis
As shown in Figure 5, no statistically significant cold spots were observed during the study period. However, significant hot spots were consistently clustered in the Liangxi District and surrounding sub-districts across all three periods, with minimal spatial change over time.
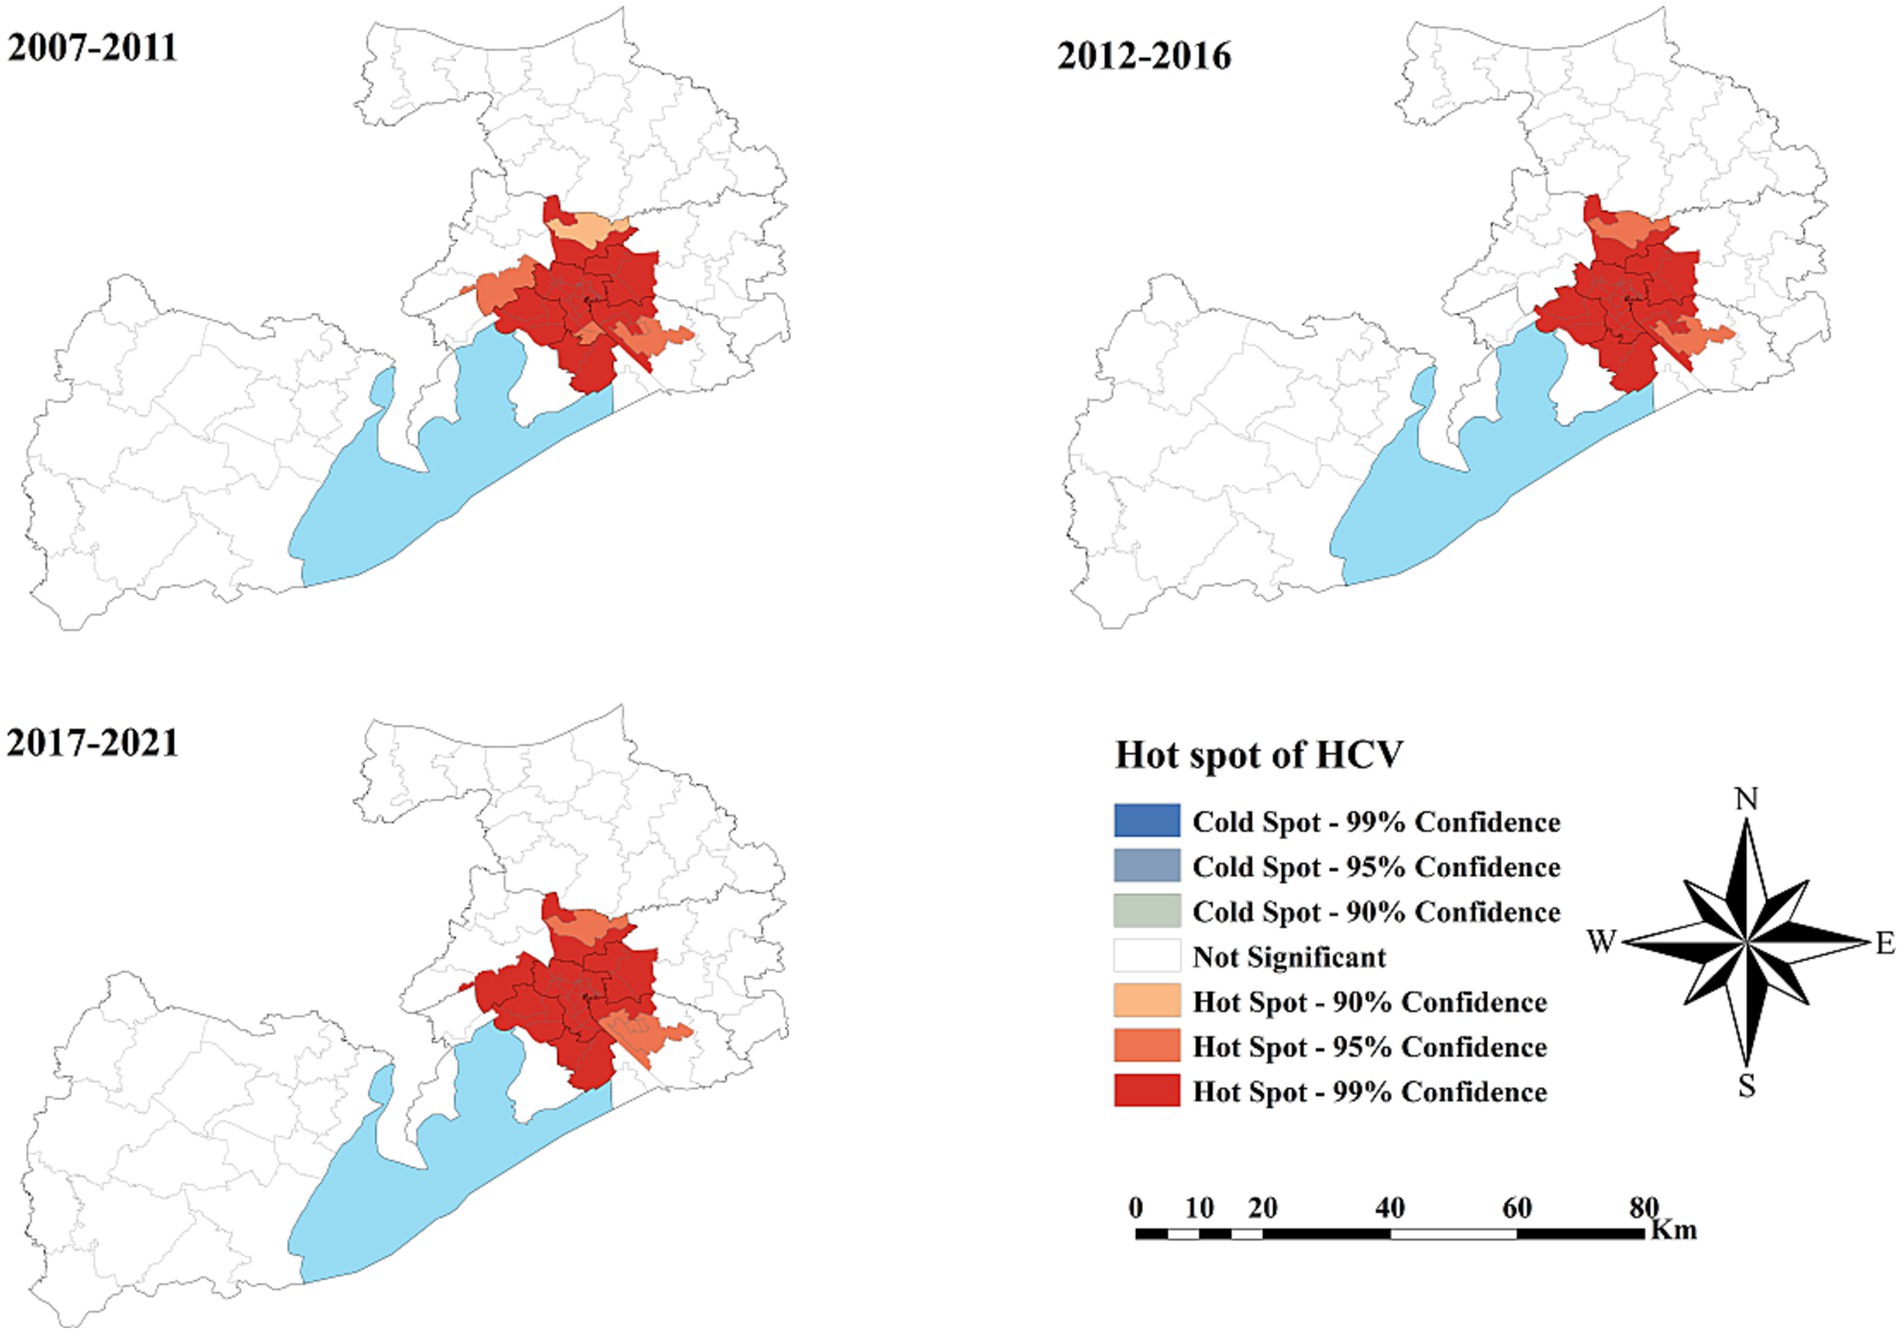
Figure 5. The spatial cluster of the hepatitis C virus incidence rate in Wuxi City at the county level, 2007–2021.
4 Discussion
Since the identification of HCV in 1989, the Chinese government has implemented several measures to prevent and control its transmission (23). In the early decades, blood transfusion was the predominant transmission route of HCV in China. To address this, the National Health Commission of the People’s Republic of China (24) was enacted to strengthen supervision of blood collection and supply institutions. Beginning in 2015, HCV RNA screening became mandatory for all blood donations, including those from anti-HCV antibody-negative donors. Consequently, the dominant transmission route has shifted, and blood transfusion is no longer the primary contributor. Nonetheless, injecting drug use and unsafe sexual practices continue to facilitate the spread of HCV from high-risk groups to the general population, thereby contributing to the ongoing increase in HCV prevalence (15, 25).
Our study found that the average annual incidence rate of HCV infection in Wuxi City was 5.44 per 100,000 population, lower than the national average but higher than rates in Nanjing, Suzhou, and other cities in Jiangsu Province (26–30). From 2007 to 2021, the incidence in Wuxi City showed an overall upward trend, consistent with national and provincial data (26, 27). Several factors may explain this pattern. First, the upward trend likely reflects enhanced surveillance, greater awareness, and expanded screening over the 15-year period. To further curb viral hepatitis epidemics, two key policies were issued: “China Viral Hepatitis Prevention and Control Plan (2017–2020)” (31) and “Action Programme to eliminate the Public Health hazards of Hepatitis C (2021–2030)” (32). These programs emphasized “due inspection” of medical institutions and key groups, “willing inspection” for the general population, and “full coverage of nucleic acid testing” for HCV antibody-positive individuals (23), thereby improving case detection. Second, the gradual increase observed after 2017 was likely associated with the implementation of the latest version of the Diagnostic Criteria for Hepatitis C (WS 213–2018) (17) and improved reporting quality of infectious diseases in medical institutions. Under the updated criteria, individuals testing positive for anti-HCV antibodies must undergo nucleic acid testing, and only nucleic acid-positive individuals are reported as confirmed cases.
Our findings also indicated no significant seasonality in HCV incidence in Wuxi, consistent with previous studies (33–35). However, a sharp decline was observed in February 2020. This pattern may be explained by two factors. First, the “Spring Festival effect” identified in time-series analyses of notifiable diseases by Wei Shan at Fudan University (36), refers to reduced healthcare-seeking behavior during the Spring Festival period in February, when individuals prioritize family gatherings and travel. Second, during early 2020, strict COVID-19 control measures, including community/home isolation and traffic restrictions, substantially affected the reporting of notifiable infectious diseases (37).
Similar to other studies, the incidence rate of HCV infection was higher among males than in females (26–30). A study on HCV prevalence among Asian Americans in California also identified male sex as an independent risk factor for HCV infection (38). This difference may be attributed to the higher prevalence of risk behaviors among men, such as injection drug use and unprotected sexual activity. Age-group analysis showed that most cases occurred in individuals aged 40–59 and >60 years. This pattern can be explained by two factors. First, HCV is often asymptomatic for decades and may only progress to chronic disease later in life, creating a lag between infection and detection. Second, older adults have more frequent medical encounters, increasing their likelihood of undergoing HCV screening and passive detection.
Previous research has shown that genotype 3 is predominant in Southwest China (10). In our study, genotype 3 was the second most common in Wuxi City, possibly due to population mobility. As a highly developed city, Wuxi attracts migrant workers from underdeveloped regions, including Southwest China. Moreover, genotype 3 is more common among injecting drug users and individuals living with HIV infection (39, 40). Sentinel surveillance by the Jiangsu Provincial Centers for Disease Control and Prevention has shown that southern Jiangsu, including Wuxi, has higher populations of drug users and people living with HIV compared with northern Jiangsu (15). The distribution of HCV genotypes also varied by sex and age, possibly due to differences in behavioral and transmission routes among demographic groups.
Spatial distribution analysis revealed pronounced heterogeneity across Wuxi City during the 15-year study period. Kernel density mapping showed that HCV cases were mainly concentrated in the downtown area of Liangxi District, particularly during 2017–2021. The highest reported incidence was concentrated in the city center, possibly due to greater population density, active commercial activities, and a higher prevalence of invasive cosmetic procedures like tattooing and ear piercing, performed without adequate disinfection. Cluster analysis identified consistent hot spots in Liangxi District and surrounding sub-districts, but no significant cold spots. These stable hot spot patterns suggest that the underlying drivers of high HCV incidence in city centers have persisted over time (41). Establishing a four-component prevention and control system, comprising prevention, monitoring, screening, and treatment, should therefore be prioritized in key areas.
This study had certain limitations. First, the data were derived from reported cases; changes in diagnostic criteria for hepatitis C may have introduced selection bias. Second, incidence was calculated based on the resident population, which may underestimate infection rates in areas with large migrant populations. Future research should aim to obtain more accurate data on the floating population to refine estimates of HCV infection incidence and assess risk disparities between residents and migrants. Finally, socioeconomic status, healthcare accessibility, and testing policies were not included in the analysis, which may partly explain spatial clustering. Future studies should incorporate multivariable spatial modeling and relevant socioeconomic and healthcare covariates to better understand the determinants of HCV distribution.
5 Conclusion
This study identified the epidemiological characteristics, temporal trends, and spatial distribution of HCV infection in Wuxi City, a developed but low-epidemic area of eastern China. The incidence of HCV increased gradually between 2007 and 2021, with subtypes 1b and 3 as the most prevalent genotypes. Spatial clustering was concentrated in urban centers, which should be prioritized for targeted surveillance and intervention. Implementing focused prevention and control strategies will be essential to achieve the goal of eliminating HCV as a public health threat by 2030.
Data availability statement
The raw data supporting the conclusions of this article will be made available by the authors, without undue reservation.
Ethics statement
A survey conducted on the current diagnosis of previously reported HCV cases in the study was approved by the ethics committee of the National Center for STD and AIDS Prevention and Control and the Chinese Center for Disease Control and Prevention. The approval reference number is X210827664. Written informed consent was obtained from all participants. The studies were conducted in accordance with the local legislation and institutional requirements. The participants provided their written informed consent to participate in this study. Written informed consent was obtained from the individual(s) for the publication of any potentially identifiable images or data included in this article.
Author contributions
HD: Data curation, Software, Writing – original draft, Writing – review & editing. QZ: Data curation, Funding acquisition, Methodology, Software, Supervision, Writing – review & editing. SS: Conceptualization, Supervision, Writing – review & editing. SG: Funding acquisition, Methodology, Resources, Writing – review & editing. SZ: Conceptualization, Data curation, Methodology, Writing – review & editing. ZX: Conceptualization, Investigation, Methodology, Software, Supervision, Validation, Writing – review & editing.
Funding
The author(s) declare that financial support was received for the research and/or publication of this article. This work was supported by the General Program of Wuxi Medical Center, Nanjing Medical University (WMCG202318), Wuxi Medical Development Discipline (FZXK2021010) and Wuxi Science and Technology Development Fund’s “Light of Taihu Lake” Science and Technology Research Program (Basic Research) (K20231045).
Acknowledgments
We would like to thank Editage (www.editage.cn) for English language editing.
Conflict of interest
The authors declare that the research was conducted in the absence of any commercial or financial relationships that could be construed as a potential conflict of interest.
Generative AI statement
The authors declare that no Gen AI was used in the creation of this manuscript.
Any alternative text (alt text) provided alongside figures in this article has been generated by Frontiers with the support of artificial intelligence and reasonable efforts have been made to ensure accuracy, including review by the authors wherever possible. If you identify any issues, please contact us.
Publisher’s note
All claims expressed in this article are solely those of the authors and do not necessarily represent those of their affiliated organizations, or those of the publisher, the editors and the reviewers. Any product that may be evaluated in this article, or claim that may be made by its manufacturer, is not guaranteed or endorsed by the publisher.
References
1. Shepard, CW, Finelli, L, and Alter, M. Global epidemiology of hepatitis C virus infection. Lancet Infect Dis. (2005) 5:558–67. doi: 10.1016/S1473-3099(05)70216-4
2. World Health Organization New WHO study: making diagnosis of hepatitis C more accessible and closer to the community using point-of-care HCV viral load assays. (2023). Available online at: https://www.who.int/news/item/24-01-2023-new-who-study-making-diagnosis-of-hcv-more-accessible-and-closer-to-the-community-using-poc-hcv-viral-load-assays (Accessed December 20, 2024).
3. Yuansheng, C, Li, L, Fuqiang, C, Wenge, X, Lu, W, Zhiyuan, J, et al. A sero-epidemiological study on hepatitis C in China. Chin J Epidemiol. (2011) 32:888–91. doi: 10.3760/cma.j.issn.0254-6450.2011.09.009
4. Bian, DD, Zhou, HY, Liu, S, Liu, M, Duan, C, Zhang, JY, et al. Current treatment status and barriers for patients with chronic HCV infection in mainland China: a national multicenter cross-sectional survey in 56 hospitals. Medicine (Baltimore). (2017) 96:e7885. doi: 10.1097/MD.0000000000007885
5. López-Martínez, R, Arias-García, A, Rodríguez-Algarra, F, Castellote-Bellés, L, Rando-Segura, A, Tarraso, G, et al. Significant improvement in diagnosis of hepatitis C virus infection by a one-step strategy in a central laboratory: an optimal tool for hepatitis C elimination? J Clin Microbiol. (2019) 58:e01815–9. doi: 10.1128/JCM.01815-19
7. Gaudy, C, and Goudeau, A. The genetic diversity of hepatitis C virus and its implications for pathogenesis and resistance to treatment. Virologie. (2005) 9:343–55. doi: 10.1684/vir.2011.2397
8. Martinez, MA, and Franco, S. Therapy implications of hepatitis C virus genetic diversity. Viruses. (2020) 13:41. doi: 10.3390/v13010041
9. Chinese Medical Association Hepatology Branch, C.M.A.I.D.B. Guidelines for the prevention and treatment of hepatitis C (2022 edition). Chin J Hepatol. (2022) 30:1332–48.
10. Chen, Y, Yu, C, Yin, X, Guo, X, Wu, S, Hou, J, et al. Hepatitis C virus genotypes and subtypes circulating in mainland China. Emerg Microbes Infect. (2017) 6:e95. doi: 10.1038/emi.2017.77
11. Du, G, Li, X, Musa, TH, Ji, Y, Wu, B, He, Y, et al. The nationwide distribution and trends of hepatitis C virus genotypes in mainland China. J Med Virol. (2019) 91:401–10. doi: 10.1002/jmv.25311
12. Zein, NN. Clinical significance of hepatitis C virus genotypes. Clin Microbiol Rev. (2000) 13:223–35. doi: 10.1128/CMR.13.2.223
13. Zhu, B, Liu, J, Fu, Y, Zhang, B, Mao, Y, et al. Spatio-temporal epidemiology of viral hepatitis in China (2003-2015): implications for prevention and control policies. Int J Environ Res Public Health. (2018) 15:661. doi: 10.3390/ijerph15040661
14. Wang, L, Xing, J, Chen, F, Yan, R, Ge, L, Qin, Q, et al. Spatial analysis on hepatitis C virus infection in mainland China: from 2005 to 2011. PLoS One. (2014) 9:e110861. doi: 10.1371/journal.pone.0110861
15. Yang, D, Zhang, C, Chen, Y, Lu, J, Chen, Y, Zhang, Z, et al. Distribution of hepatitis C virus in eastern China from 2011 to 2020: a Bayesian spatiotemporal analysis. Front Public Health. (2024) 12:1282575. doi: 10.3389/fpubh.2024.1282575
16. United Nations Department of Economic and Social Affairs (UN DESA). World statistics pocketbook 2021. New York: United Nations (2021).
17. National Health and Family Planning Commission of the People's Republic of China. WS 213-2018 diagnosis for hepatitis C. Chin J Viral Dis. (2018) 8:248–51. doi: 10.16505/j.2095-0136.2018.0060
18. Kim, HJ, Fay, MP, Feuer, EJ, Midthune, DN, et al. Permutation tests for joinpoint regression with applications to cancer rates. Stat Med. (2000) 19:335–51. doi: 10.1002/(SICI)1097-0258(20000215)19:3<335::AID-SIM336>3.0.CO;2-Z
19. Zhang, Q, Ding, H, Gao, S, Zhang, S, Shen, S, Chen, X, et al. Spatiotemporal changes in pulmonary tuberculosis incidence in a low-epidemic area of China in 2005-2020: retrospective spatiotemporal analysis. JMIR Public Health Surveill. (2023) 9:e42425. doi: 10.2196/42425
20. Huanhuan, D, and Xingrong, L. Analysis of seasonal characteristics of human brucellosis in Gansu Province based on the concentration and circular distribution method. Chin J Dis Control Prevent. (2022) 26:227–31. doi: 10.16462/j.cnki.zhjbkz.2022.02.018
21. Xu, G, Jiang, Y, Wang, S, Qin, K, Ding, J, Liu, Y, et al. Spatial disparities of self-reported COVID-19 cases and influencing factors in Wuhan. China Sustain Cities Soc. (2022) 76:103485. doi: 10.1016/j.scs.2021.103485
22. Getis, A, and Ord, JK. The analysis of spatial association by use of distance statistics. Geogr Anal. (2010) 24:189–206. doi: 10.1111/j.1538-4632.1992.tb00261.x
23. Jian, L, Lin, P, Xiaochun, W, and Zhongfu, L. Progress and Prospect of prevention and treatment of hepatitis C in China. Chin J Aids STD. (2022) 28:761–5. doi: 10.13419/j.cnki.aids.2022.07.01
24. National Health Commission of the People’s Republic of China. The Blood Donation Law of the People’s Republic of China[EB/OL]. (1997). Available online at: https://www.nhc.gov.cn/fzs/c100048/201808/ea9fb73f399d4cedb1b3438825646505.shtml
25. Ansaldi, F, Orsi, A, Sticchi, L, Bruzzone, B, Icardi, G, et al. Hepatitis C virus in the new era: perspectives in epidemiology, prevention, diagnostics and predictors of response to therapy. World J Gastroenterol. (2014) 20:9633–52. doi: 10.3748/wjg.v20.i29.9633
26. Hai-Bo, W, Zi-Xiao, Z, and Yi-Xiang, H. Analysis of epidemiological characteristics of viral hepatitis C in China, 2004-2011. Modern Prevent Med. (2015) 42:1173–5.
27. Haiyang, H, Gengfeng, F, Jing, H, Ying, Z, Lingen, S, Yuheng, C, et al. Epidemiological characteristics of hepatitis C in Jiangsu Province, 2005-2012. Chin J Dis Control Prevent. (2015) 19:393–5. doi: 10.16462/j.cnki.zhjbkz.2015.04.019
28. Xiaoyin, L, Yanqiu, Z, Xiaoqing, C, Jiaxin, W, Min, F, Weihua, Z, et al. Epidemiological characteristics of hepatitis C in Suzhou, Jiangsu, 2016−2022. Dis Surveill. (2023) 38:1067–71. doi: 10.3784/jbjc.202304270188
29. Lu, G, Zhengping, Z, Yuanyuan, X, Sushu, W, Xin, L, Li, L, et al. Analysis on epidemiological features of hepatitis C during 2010-2017 and epidemic predition in Nanjing City. Chin J Health Educ. (2019) 35:818–21. doi: 10.16168/j.cnki.issn.1002-9982.2019.09.011
30. ZhongYang, G, LiXin, S, and Yao, Q. Epidemiological characteristics of hepatitis C in Yancheng City, 2005—2020. Modern Prev Med. (2022) 49:1181–1184+1216. doi: 10.3969/j.issn.1003-8507.2022.7.xdyfyx202207006
31. National Health and Family Planning Commission, National Development and Reform Commission, Ministry of Education, Ministry of Science and Technology, Ministry of Industry and Information Technology, Ministry of Public Security,, et al. China viral hepatitis prevention and control plan (2017-2020). Chinese J Viral Dis. (2018) 8:1–5. doi: 10.16505/j.2095-0136.2018.0001
32. National Health Commission, Ministry of Science and Technology, Ministry of Industry and Information Technology, Ministry of Public Security, Ministry of Civil Affairs, Ministry of Justice. (2021). Action Programme to eliminate the public health hazards of hepatitis C (2021-2030). Available online at: https://www.nhc.gov.cn/jkj/c100062/202109/6bf87bfeb2f0424e8d6efc0425b91699.shtml (Accessed December 20, 2024).
33. Shicun, D, Guanglan, P, Weijun, W, Ming, F, Yulan, S, Jiping, L, et al. Epidemiology of viral hepatitis C in Qinghai, 2013-2017. Dis Surveill. (2019) 34:551–4. doi: 10.3784/j.issn.1003-9961.2019.06.017
34. Li, L, Bin, W, Ailing, Y, Aixia, T, and Yadong, Z. Epidemiological characteristics of hepatitis C in Gansu, 2008–2017. Dis Surveill. (2019) 34:555–8. doi: 10.3784/j.issn.1003-9961.2019.06.018
35. Na, L, Jixiang, F, Bohong, Q, Lining, H, Zixuan, L, Dan, W, et al. Epidemiological characteristics of hepatitis C in Jilin province, 2012-2021. Pract Prevent Med. (2023) 30:474–6. doi: 10.3969/j.issn.1006-3110.2023.04.020
36. Shan, W, Yihan, L, Meiyang, G, Guorong, W, Qingwu, J, Naiqing, Z, et al. Spring festival effects on the main notifiable communicable diseases in China. Fudan Univ J Med Sci. (2013) 40:153–8. doi: 10.3969/j.issn.1672-8467.2013.02.005
37. Hogan, AB, Jewell, BL, Sherrard-Smith, E, Vesga, JF, Watson, OJ, Whittaker, C, et al. Potential impact of the COVID-19 pandemic on HIV, tuberculosis, and malaria in low-income and middle-income countries: a modelling study. Lancet Glob Health. (2020) 8:e1132–41. doi: 10.1016/S2214-109X(20)30288-6
38. Lin, ON, Chang, C, Lee, J, Do, A, Martin, M, Martin, A, et al. HCV prevalence in Asian Americans in California. J Immigr Minor Health. (2016) 19:91–7. doi: 10.1007/s10903-016-0342-1
39. Robaeys, G, Bielen, R, Azar, DG, Razavi, H, Nevens, F, et al. Global genotype distribution of hepatitis C viral infection among people who inject drugs. J Hepatol. (2016) 65:1094–103. doi: 10.1016/j.jhep.2016.07.042
40. Ramos, B, Núñez, M, Toro, C, Sheldon, J, García-Samaniego, J, Ríos, P, et al. Changes in the distribution of hepatitis C virus (HCV) genotypes over time in Spain according to HIV serostatus: implications for HCV therapy in HCV/HIV-coinfected patients. J Infect. (2007) 54:173–9. doi: 10.1016/j.jinf.2006.02.006
Keywords: hepatitis C virus, epidemiology, spatiotemporal analysis, genotype distribution, public health surveillance, China
Citation: Ding H, Zhang Q, Shen S, Gao S, Zhang S and Xu Z (2025) Long-term spatial–temporal evolution of hepatitis C burden in eastern China: a retrospective case analysis from Wuxi City. Front. Public Health. 13:1665521. doi: 10.3389/fpubh.2025.1665521
Edited by:
Sonia Roman, University of Guadalajara, MexicoReviewed by:
Shiqiang Jin, Regeneron Pharmaceuticals, Inc., United StatesAndong Qin, Huai'an No.4 People's Hospital, China
Copyright © 2025 Ding, Zhang, Shen, Gao, Zhang and Xu. This is an open-access article distributed under the terms of the Creative Commons Attribution License (CC BY). The use, distribution or reproduction in other forums is permitted, provided the original author(s) and the copyright owner(s) are credited and that the original publication in this journal is cited, in accordance with accepted academic practice. No use, distribution or reproduction is permitted which does not comply with these terms.
*Correspondence: Zhuping Xu, WHpwMTU5NTE1ODk2OTZAMTYzLmNvbQ==
†These authors share first authorship