 Yuntao Shen1*
 Hebao Wei2
- 1Department of Orthopedics, Haining People's Hospital, Haining, Zhejiang, China
- 2Department of Orthopedics, Jiaxing Xiuzhou District People's Hospital, Jiaxing, Zhejiang, China
Background: Osteoporotic fractures represent a significant public health concern on a global scale. There is currently a lack of research on the association between low-carbohydrate-diet score and Osteoporotic fractures risk.
Methods: A cross-sectional analysis was performed involving 13,025 participants from the National Health and Nutrition Examination Survey, utilizing data collected from the years 2005 to 2010, 2013 to 2014, and 2017 to 2018. Logistic regression analyses were used to explore the association between the Low-Carbohydrate Diet score and Osteoporotic fractures risk. Restricted cubic spline analysis was conducted to evaluate the linearity or nonlinearity of the association. Subgroup and interaction analyses were also performed.
Results: Following the adjustment for confounding variables, a positive correlation was identified between elevated Low-Carbohydrate Diet scores and an increased risk of Osteoporotic fractures. Specifically, a one-point increment in Low-Carbohydrate Diet score corresponded to a 1.13% rise in Osteoporotic fractures risk (OR = 1.0113, 95% CI: 1.0015–1.0212, p = 0.0240). The risk of Osteoporotic fractures among individuals in the highest Low-Carbohydrate Diet quartile was significantly greater compared to those in the lowest quartile (OR = 1.2248, 95% CI: 1.0212–1.4388, p = 0.0295). The Restricted cubic spline analyses revealed a linear relationship between Low-Carbohydrate Diet score and Osteoporotic fractures risk. Subgroup and interaction analyses demonstrated that age, alcohol consumption, and hypertension had moderating effects on this association.
Conclusion: Higher Low-Carbohydrate Diet scores were associated with a greater risk of Osteoporotic fractures, offering a new perspective on the link between dietary patterns and fracture risk.
Introduction
Osteoporotic fractures (OF), also known as fragility fractures, are affecting a growing number of individuals globally. The lifetime risk of OF is about 20% for men over 50 years of age and 50% for women over in the same age group (1). Moreover, any new fracture in adults aged 50 years or older increases the risk of subsequent fractures, particularly within the first year following the initial event (2). Currently, the majority of individuals who experience an OF are not adequately assessed or treated for their risk of subsequent fractures (3). With ongoing population growth and aging, the annual number of fractures is projected to rise to 3.2 million by 2040, with associated costs exceeding $95 billion (4).
Diet is a modifiable risk factor, and various studies have demonstrated that dietary patterns may influence the incidence of fractures (5). A meta-analysis showed that adherence to a Mediterranean diet may reduce the risk of hip fractures, although the magnitude of risk reduction is modest (6). Current research on the impact of diet on bone health has concentrated on individual dietary components, particularly calcium and protein. An earlier study has shown that vitamin D3 and calcium can reduce the risk of hip and other non-vertebral fractures in older women (7). Furthermore, a meta-analysis found that high-dose vitamin D supplementation (≥ 800 IU/day) effectively reduced the incidence of hip and non-vertebral fractures in adults over than 65 years (8). An Australian study also found that increased calcium and protein intake through the consumption of dairy products can reduce the risk of falls and fractures in nursing home residents (9).
The low-carbohydrate-diet (LCD) score is a newly proposed macronutrient-based dietary scoring method to explore the relationship between diet and disease, and is considered more appropriate for assessing the risk of chronic diseases (10). The LCD score accounts for the proportional composition of all major dietary macronutrients, dividing fat, protein, and carbohydrates into 11 levels based on their percentage of total energy intake, with each macronutrient assigned a score ranging from 1 (minimum) to 10 (maximum). For carbohydrates, the scoring is reversed, with a minimum score of 10 and a maximum score of 0. The total LCD score is calculated by summing the scores of the three macronutrients (11). Previous studies have demonstrated associations between the LCD score and various health outcomes, including obesity, metabolic syndrome, diabetes, mental disorders, and cognitive performance in the older adults (10–15). However, no studies have yet investigated the relationship between the LCD score and the risk of OF.
The objective of this research is to use data from the NHANES to examine the association between LCD score and the risk of OF, as well as to analyze differences according to gender, age, lifestyle factors, and chronic disease status. The findings may offer new recommendations for dietary intake among middle-aged and older adult populations and provide a reference for effective prevention of OF in these groups.
Methods
Data sources and study population
In this cross-sectional study, participant information was sourced from the NHANES database. The NHANES data offers a representative sample of the noninstitutionalized population within the United States.
NHANES implements a multi-stage stratified sampling strategy grounded in probability principles, with data collection occurring every 2 years to maximize precision and representativeness. This research analyzed data from NHANES surveys administered in the periods 2005–2010, 2013–2014, and 2017–2018, comprising 50,463 participants. Participants were excluded for the following reasons: (1) age younger than 20 or older than 80 years; (2) pregnancy; (3) missing data on the primary exposure or outcome, specifically LCD score or fracture history; and (4) missing data on covariates (education, poverty income ratio, serum calcium, serum phosphorus, serum 25-hydroxyvitamin D [25(OH)D], physical activity, marital status, alcohol use, body mass index, coronary heart disease, or stroke). After applying these criteria, 13,025 participants remained in the final analytic sample (Figure 1).
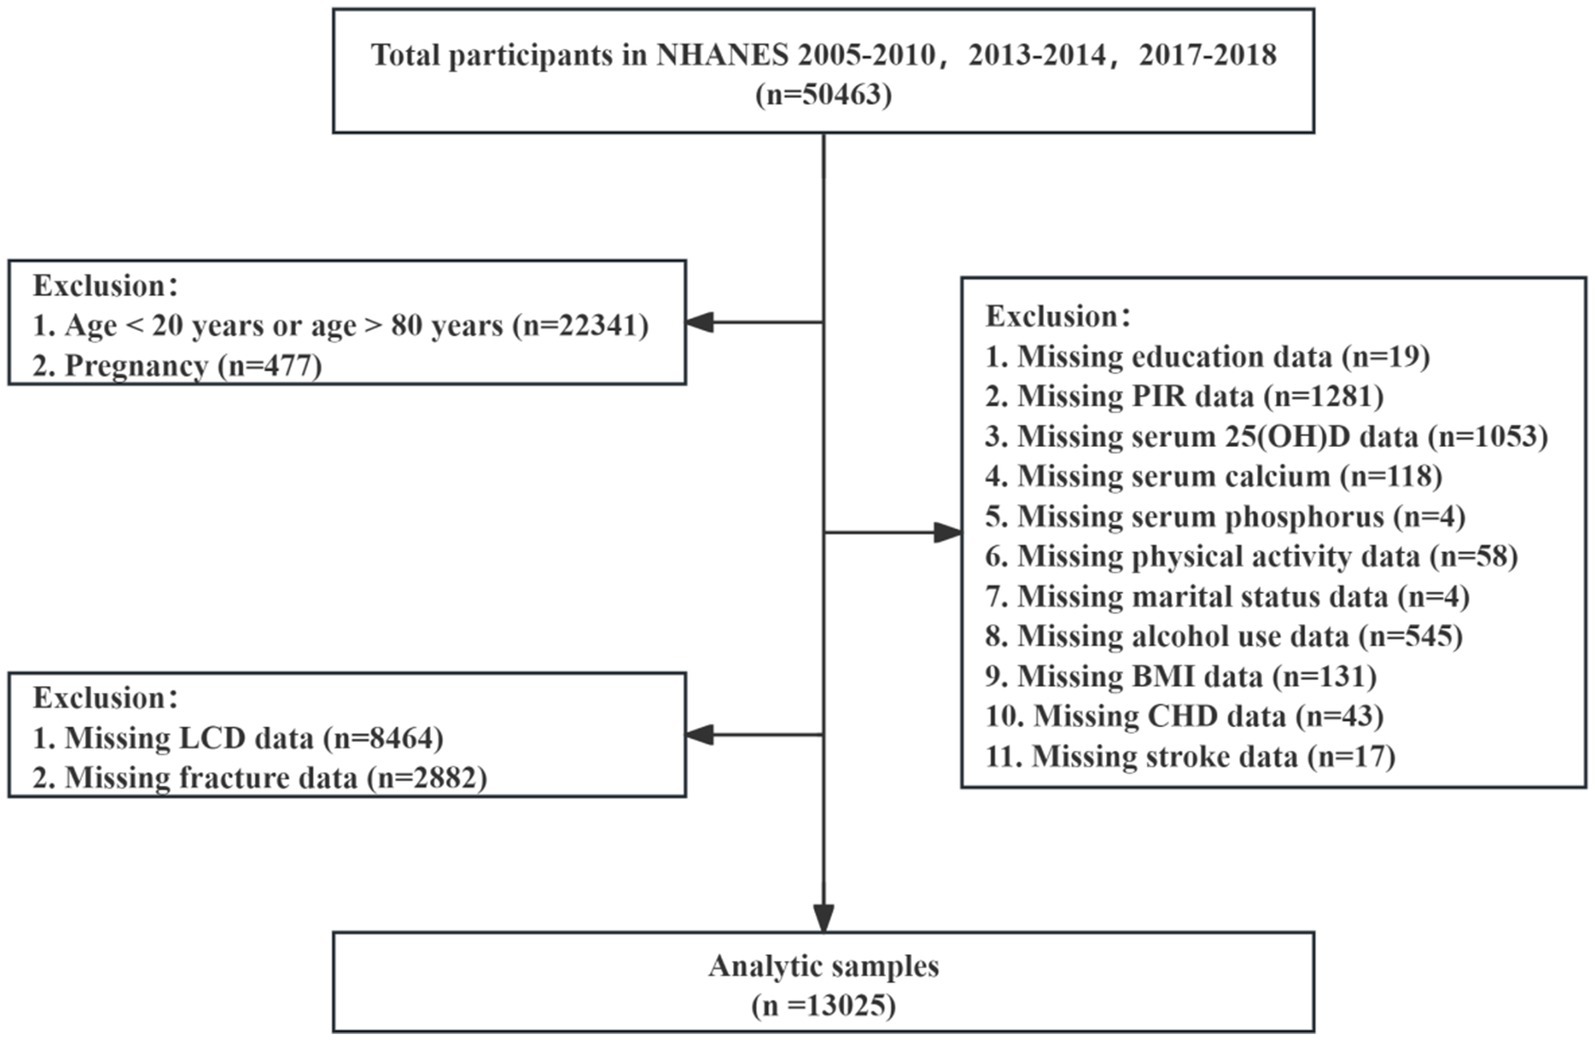
Figure 1. Flow diagram of selection of study participants.
Calculation of the LCD score
The average dietary intake was assessed through two 24-h dietary recall interviews, concentrating on the consumption of fat, protein, carbohydrates, and total energy. Dietary intake data were derived from the NHANES dietary interview component. Trained bilingual interviewers administered 24-h recalls in private rooms at the Mobile Examination Centers (MEC) using standardized measuring guides to estimate portion sizes. Since 2002, a second recall has been conducted 3–10 days later by telephone. Dietary data were collected using the U.S. Department of Agriculture’s Automated Multiple-Pass Method (AMPM), and nutrient intakes were calculated with the USDA Food and Nutrient Database for Dietary Studies (FNDDS). We used the NHANES-provided daily carbohydrate, protein, and fat intakes to compute the LCD score according to the established formula.
The LCD score was established through a thorough evaluation of these three macronutrients. Initially, the quantities of fat, protein, and carbohydrates (measured in grams) were converted into kilocalories using established conversion factors (9 kcal/g for fat and 4 kcal/g for both protein and carbohydrates). Subsequently, the proportion of total energy derived from each macronutrient was calculated. Participants with the highest percentage of energy intake from fat and protein were assigned a score of 10, while those with the lowest received a score of 0. Conversely, for carbohydrates, individuals with the lowest percentage of energy intake were awarded a score of 10, and those with the highest received a score of 0. The final LCD score was the cumulative total of these three nutrient scores, resulting in a possible score range from 0 to 30. A higher LCD score indicated an increased intake of fat and protein, accompanied by a decreased consumption of carbohydrates (11). In this analysis, participants were divided into four categories according to the quartiles of their LCD scores: < 4 points, 4–10 points, 10–16 points, and >16 points.
OF assessment
Osteoporotic fractures were ascertained through personal interviews. During the NHANES survey, trained interviewers conducted computer-assisted personal interviews (CAPI) in participants’ homes. Self-reported osteoporotic fractures were identified by asking participants: “Has a doctor ever told you that you had a fracture of the hip, wrist, or spine?” Responses indicating “yes” were classified as positive. It is important to note that the reliance on self-reported data may introduce recall bias, which should be considered when interpreting the findings (16).
Selection of covariates
The study incorporated various covariates that may potentially affect the relationship between the LCD score and the risk of OF. The covariates examined in this research included: age, race/ethnicity, educational attainment, poverty income ratio(PIR), gender, serum 25(OH)D (nmol/L), serum calcium (mg/dL), serum phosphorus (mg/dL), milk product consumption, smoking status, physical activity levels, marital status, alcohol consumption, Body Mass Index (BMI), and the presence of hypertension, diabetes, Coronary Heart Disease (CHD), stroke and total energy intake. For comprehensive definitions of these covariates, please refer to the Supplementary material.
Statistical analysis
Owing to the survey’s intricate sampling design, all statistical analyses incorporated sampling weights. Continuous variables were summarized using weighted means accompanied by standard deviations, while intergroup comparisons were conducted through weighted t-tests. Categorical variables were represented as weighted percentages and analyzed using weighted chi-square tests. The relationship between LCD scores and OF was examined utilizing weighted logistic regression analyses. Three models were developed: Model 1 was unadjusted; Model 2 included adjustments for gender, age, race, PIR, and education; Model 3 was additionally adjusted for the aforementioned variables as well as smoking status, alcohol consumption, physical activity, marital status, BMI, hypertension, diabetes, serum calcium, serum phosphorus, serum 25(OH)D, milk product consumption, CHD, and stroke, energy. To assess potential effect modification by clinically relevant factors, subgroup analyses were performed across strata of gender, age, BMI, physical activity, smoking and drinking status, hypertension, diabetes, CHD, and stroke. These subgroup variables were pre-specified based on their clinical relevance and previous literature suggesting their potential role in modifying dietary effects on bone health. Additionally, restricted cubic spline (RCS) analyses were applied to evaluate both linear and nonlinear relationships between LCD scores and OF risk. All statistical analyses were performed using R software (version 4.2.1), with p < 0.05 considered statistically significant.
Results
Baseline characteristics
In total, 13,025 participants (6,353 men and 6,672 women; average age: 53.20 years) were incorporated into the analysis. The clinical characteristics of the participants, categorized based on their OF status, are presented in Table 1.
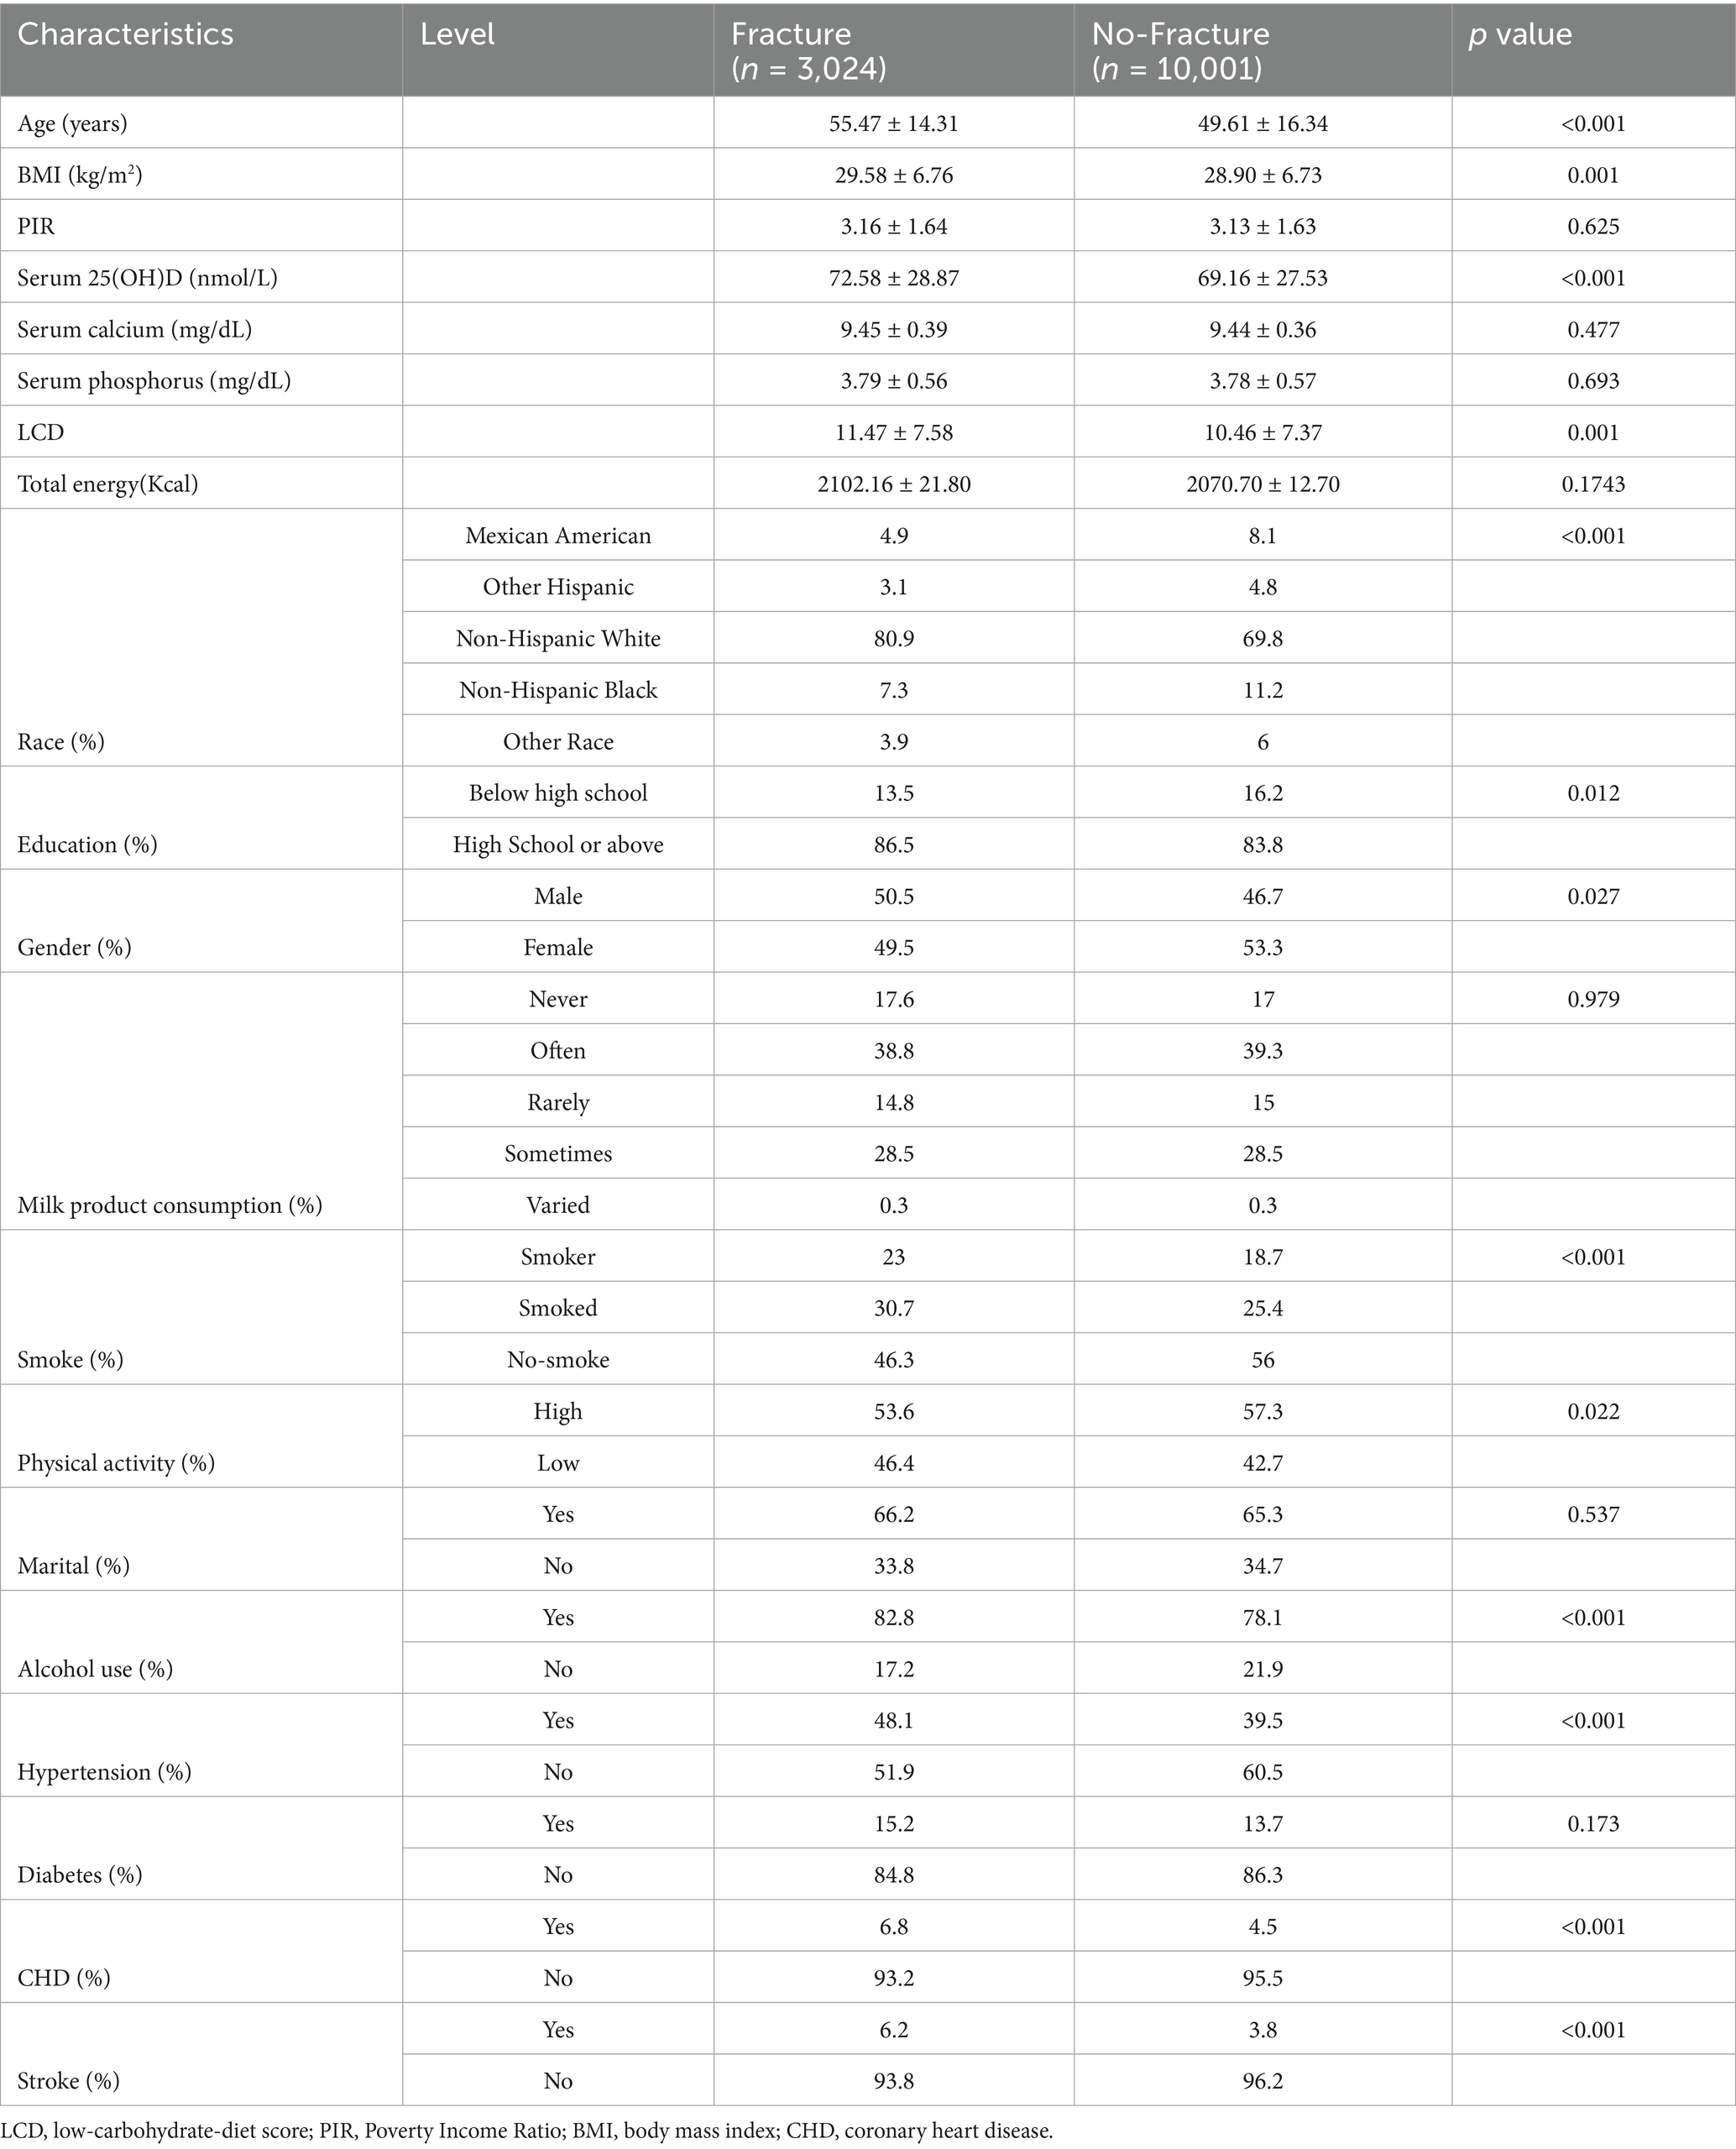
Table 1. The characteristics of participants according to fracture.
In comparison to participants without OF, those with OF were older and exhibited higher LCD scores, elevated serum 25(OH)D concentrations, and greater BMI values (all p < 0.05). No substantial differences were found between the two groups regarding PIR, serum calcium, serum phosphorus, dairy product intake, marital status, or prevalence of diabetes (all p > 0.05). Nonetheless, statistically significant disparities were noted in race, educational level, gender, smoking and alcohol consumption status, physical activity, hypertension, CHD, and stroke (all p < 0.05).
Associations between LCD score and OF
In order to assess the association between LCD and the risk of OF, we constructed three weighted logistic regression models, as shown in Table 2. The analysis of the LCD score as a continuous variable revealed a consistent and significant relationship with the risk of OF across all three models. Specifically, an increase of one point in the LCD score was linked to a 1.13% elevation in the risk of OF.
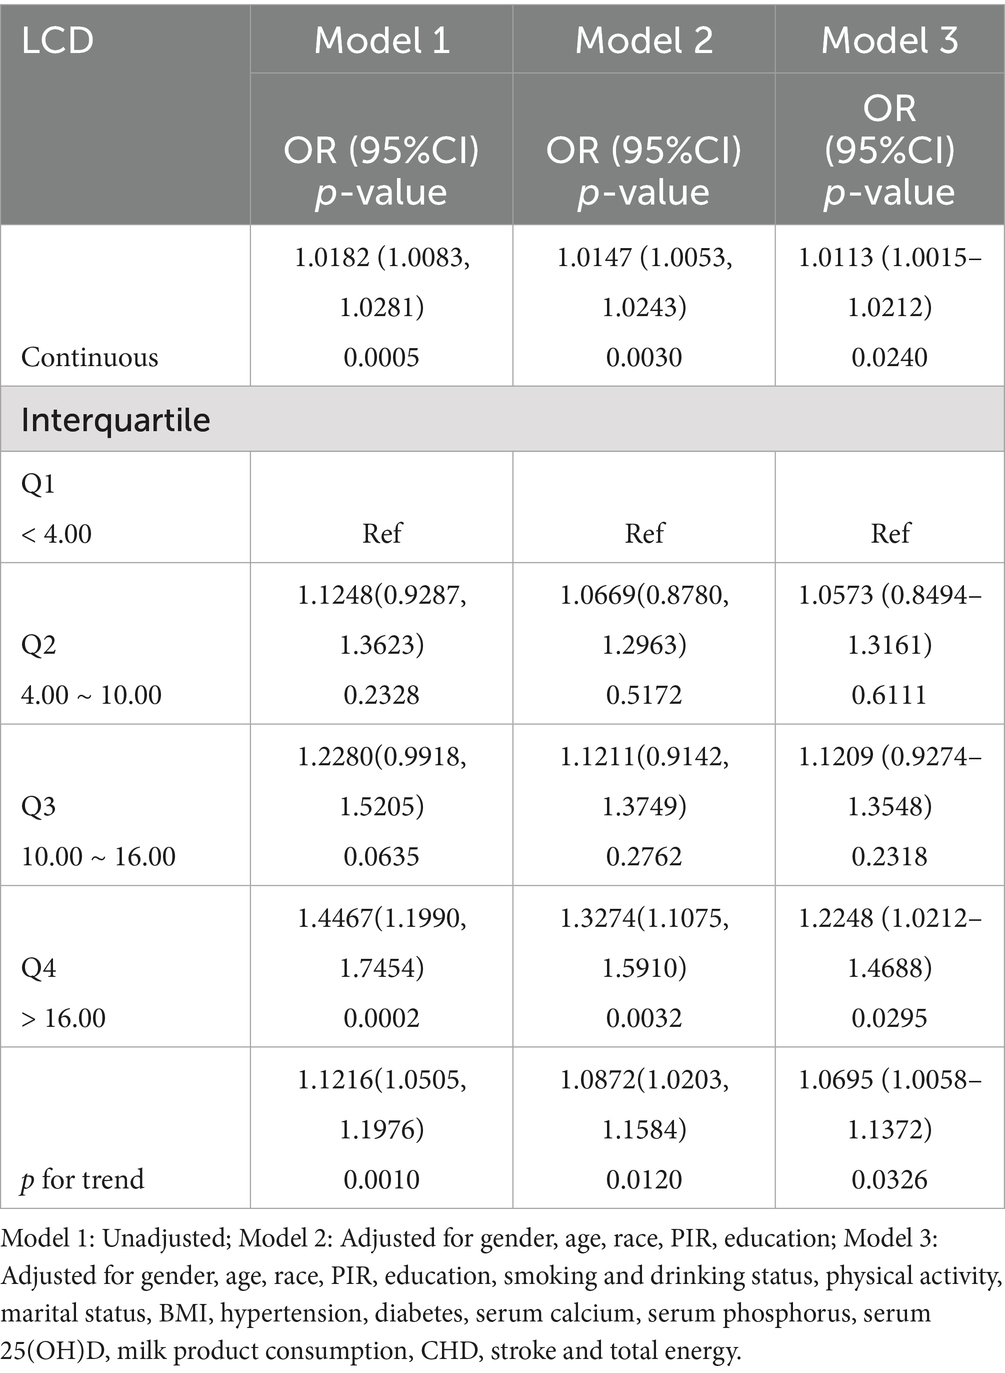
Table 2. Associations between LCD score and OF.
Furthermore, the LCD score was stratified into quartiles, with the lowest quartile (Q1) designated as the reference group to evaluate associations with OF risk. In the multivariable-adjusted model, the odds ratios (ORs) for OF in Q2, Q3, and Q4 were 1.0573 (95% CI: 0.8494–1.3161), 1.1209 (95% CI: 0.9274–1.3548), and 1.2248 (95% CI: 1.0212–1.4688), respectively. These findings indicate that higher LCD scores are linked to a greater risk of OF (p for trend < 0.05). RCS analysis did not provide evidence of a significant nonlinear relationship between LCD and OF (Figure 2), suggesting a predominantly linear relationship.
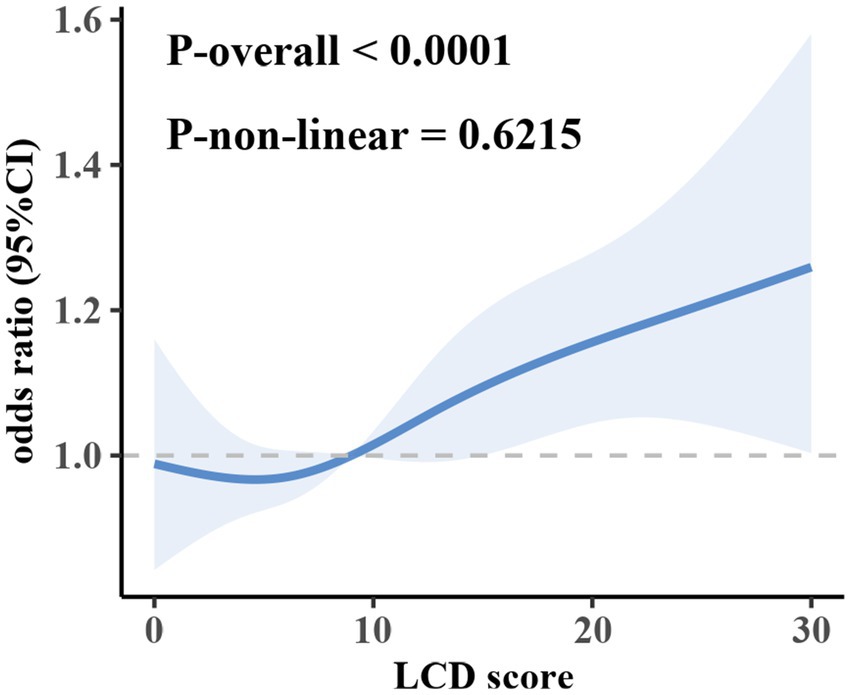
Figure 2. Association of the LCD score and the risk of OF.
Subgroup analysis
In subgroup analyses, we examined the influence of gender, age, BMI, physical activity, smoking and drinking status, hypertension, diabetes, CHD, and stroke on the association between LCD score and OF risk (Figure 3). The results indicated significant interactions of age, drinking status, and hypertension with LCD score in relation to OF risk. In the age ≤45 subgroup, the OR was 1.0266 (95% CI: 1.0103–1.0432), while in the >45 group, the OR was 1.0033 (95% CI: 0.9923–1.0143), with an interaction p-value of 0.0110, indicating a significant age-related effect modification. Regarding drinking status, the OR among drinkers was 1.0173 (95% CI: 1.0066–1.0281), compared to 0.9823 (95% CI: 0.9626–1.0024) among non-drinkers, with an interaction p-value of 0.0099, suggesting a moderating effect of alcohol consumption. For hypertension, the OR in the hypertensive group was 1.0012 (95% CI: 0.9891–1.0134), and in the non-hypertensive group, it was 1.0193 (95% CI: 1.0063–1.0324), with an interaction p-value of 0.0183, indicating that hypertension also moderated the association. The analysis did not reveal any notable interactions within the remaining subgroups.
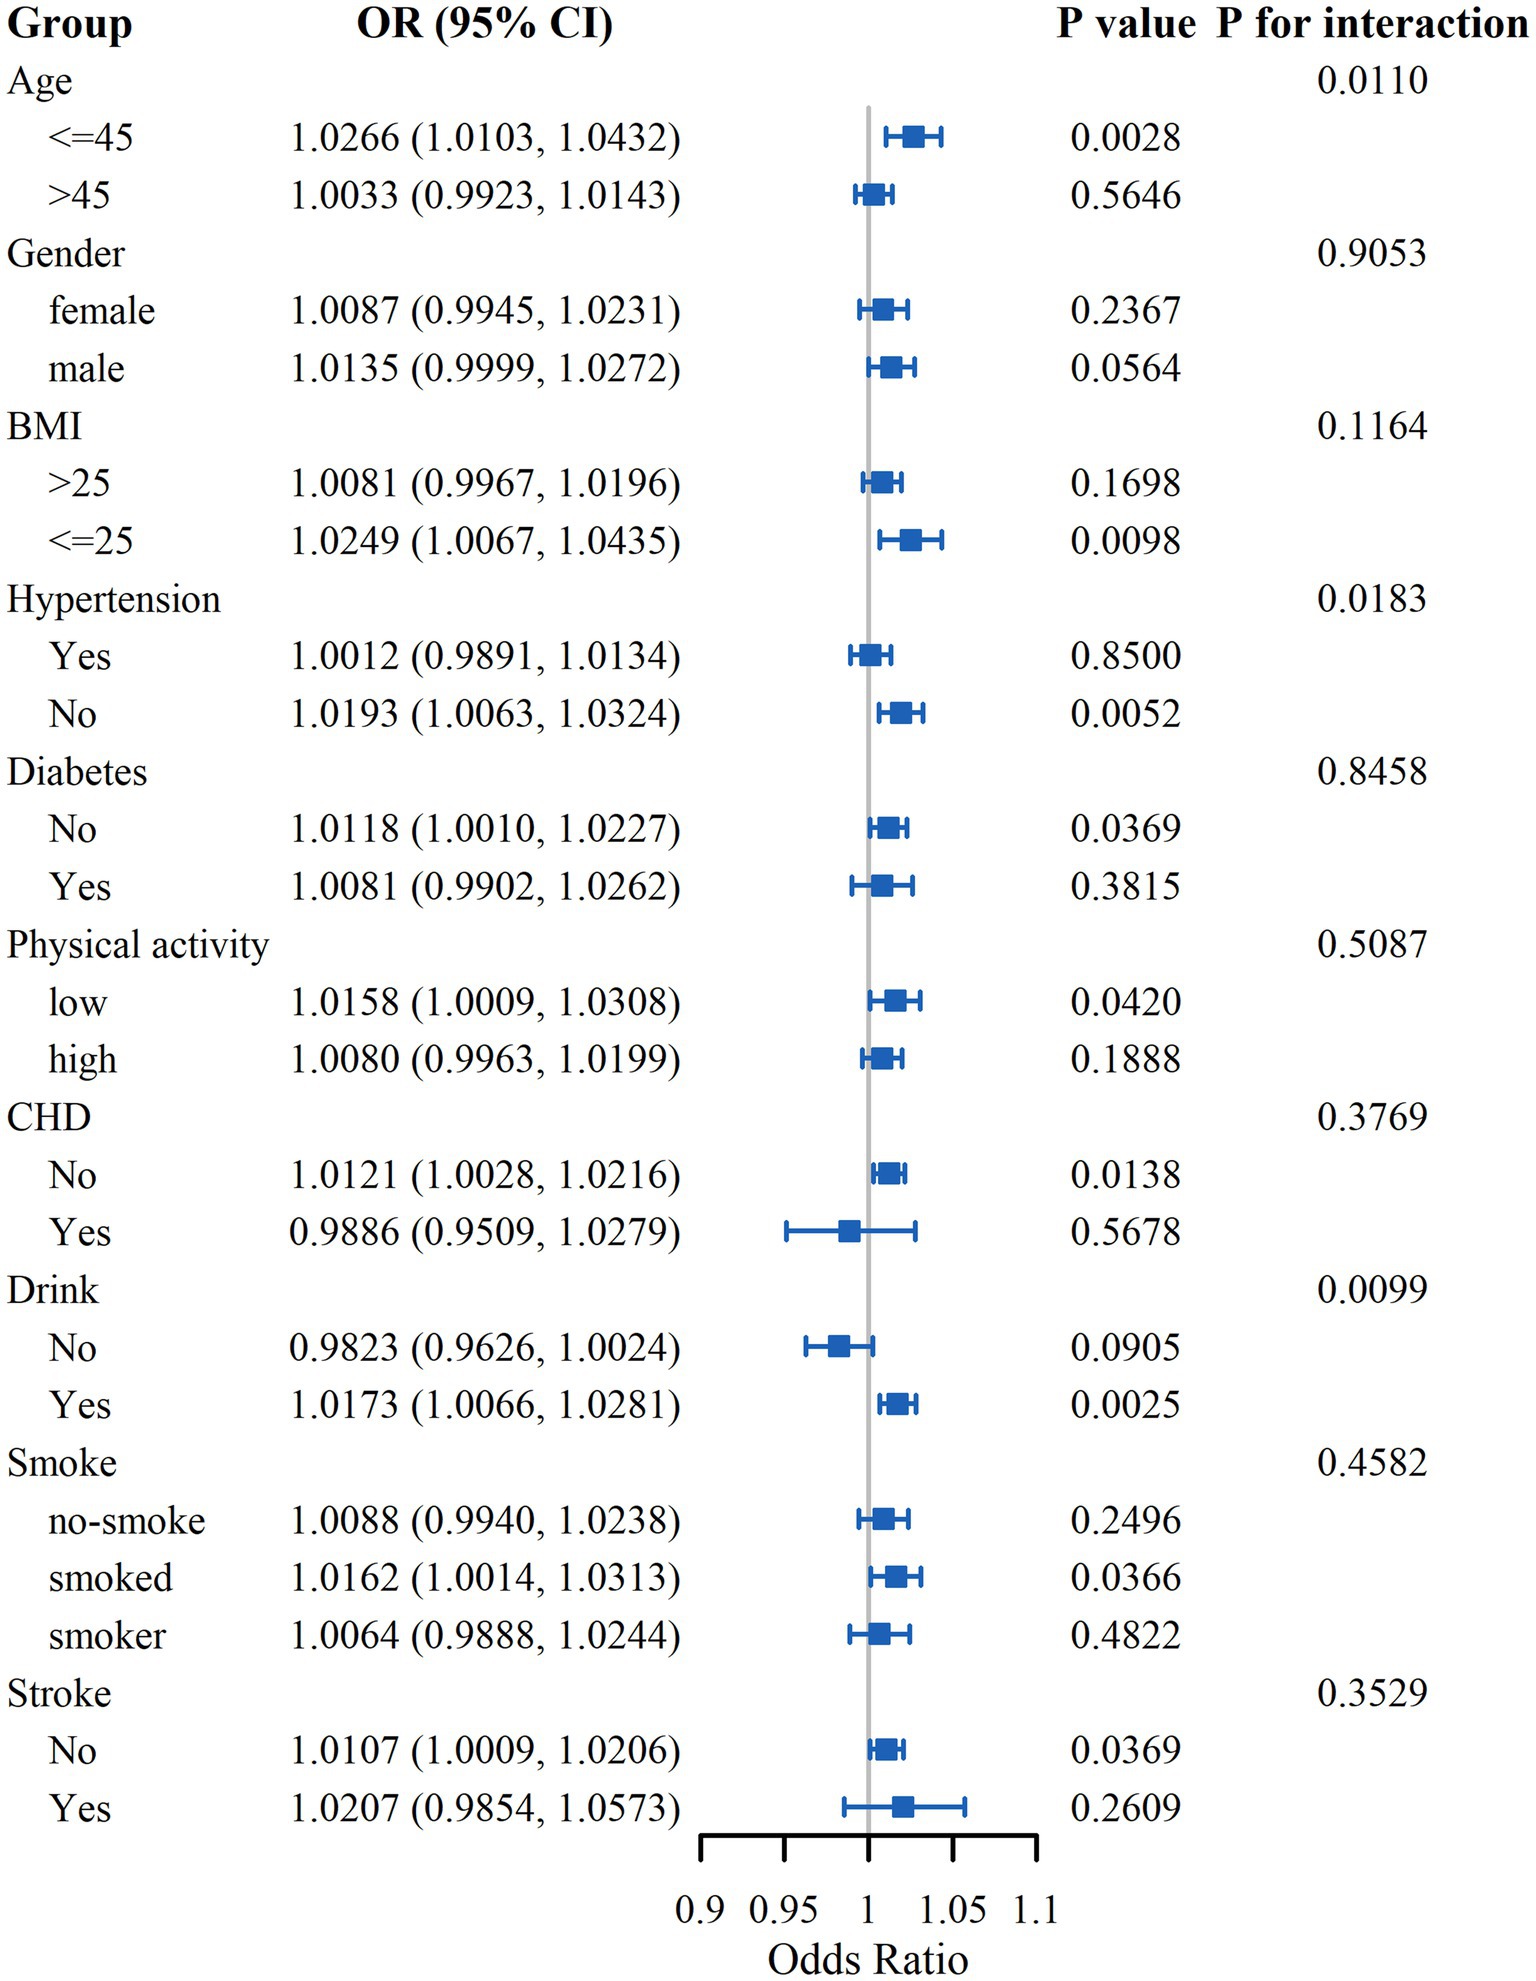
Figure 3. Subgroup analysis of the association between LCD score and OF risk.
Discussion
This study utilized the extensive NHANES dataset to comprehensively examine the relationship between LCD score and the OF risk. The findings revealed that individuals in Q4 of LCD score exhibited a significantly elevated risk of OF in comparison to those in Q1, even after controlling for various covariates. This association was especially evident among participants under the age of 45, those who consumed alcohol, and participants without hypertension. Additionally, RCS analysis suggested a linear correlation between LCD score and the OF risk.
Although the OR for fracture comparing the highest versus lowest quartile of LCD was statistically significant (OR = 1.22), the effect size remains relatively modest. In contrast, well-established risk factors such as age and BMI consistently demonstrate stronger associations with musculoskeletal outcomes. For example, one previous study found that men who transitioned from obesity to a non-obese status over a 10-year period experienced an 81.6% reduction in osteoporosis risk (OR = 0.184, 95% CI: 0.037–0.914, p = 0.039) and a 69.8% reduction in wrist fracture risk (OR = 0.302, 95% CI: 0.120–0.757, p = 0.012) (17). These comparisons suggest that while LCD may represent a potential risk factor for fracture, its effect is likely secondary to major determinants such as weight history. Thus, the clinical relevance of LCD should be interpreted within the context of these more influential factors.
The findings of this study further suggest that the observed association between LCD score and OF risk may be driven primarily by dietary composition, rather than carbohydrate restriction per se. A meta-analysis reported no significant association between carbohydrate intake and fracture risk when comparing the highest and lowest consumption groups (18). In contrast, recent evidence indicates that higher protein intake may be associated with a reduced risk of hip fracture under certain conditions (19). Fat quality also appears to play an important role:higher intake of saturated fatty acids has been linked to increased fracture risk (20). Whereas moderate linoleic acid intake and elevated circulating levels of polyunsaturated fatty acids—particularly omega-3 fatty acids such as EPA—have been associated with reduced risk (21). Taken together, these findings suggest that the LCD score reflects a complex dietary pattern, and its association with fracture risk likely arises from the combined effects of multiple macronutrients rather than any single nutrient.
Furthermore, previous studies have indicated that LCD can negatively affect high-intensity endurance exercise performance (22, 23). Additionally, compliance with a low-carbohydrate, high-fat dietary regimen has been associated with elevated levels of low-density lipoprotein cholesterol among healthy, normal-weight young women (24). Young individuals typically exhibit more active bone metabolism and higher levels of physical activity, making them more sensitive to nutritional fluctuations. This may explain why LCD score has a more pronounced effect on fracture risk among individuals under 45 years old. Meta-analyses of prospective cohort studies have consistently shown that alcohol consumption is positively associated with overall fracture risk (25, 26), and when combined with a low-carbohydrate diet, may further exacerbate fracture risk. Conversely, in populations with hypertension, certain antihypertensive medications, such as thiazide diuretics, may reduce fracture risk (27, 28), and patients with chronic conditions may pay greater attention to dietary quality to manage their disease. Consequently, the influence of the LCD score on the risk of OF is more pronounced in non-hypertensive populations. However, it is important to note that these subgroup analyses were exploratory in nature, and no correction for multiple testing (e.g., Bonferroni or FDR) was applied. Therefore, the observed interaction effects should be interpreted as hypothesis-generating and require confirmation in future studies.
Additionally, the interdependent nature of nutrients must be considered, as their effects may be influenced by multicollinearity among dietary components, complicating the assessment of individual nutrient impacts. The assessment of bone health and the associated risk of hip fractures is influenced not only by the isolated effects of individual nutrients but also by their interactions, the overall dietary intake, and the individual’s nutritional status (29). The LCD score employed in this study comprehensively evaluates dietary patterns based on the intake of the three major macronutrients. To the best of our understanding, this study represents the inaugural examination of the correlation between LCD score and the risk of OF. Assessing comprehensive dietary patterns, rather than concentrating exclusively on specific nutrients, may provide more actionable guidance for individuals seeking to reduce femur fracture risk through dietary modification. Nevertheless, due to the inherent complexity of dietary patterns, further research is required to clarify how different dietary patterns influence fracture risk.
This research presents several limitations. Firstly, its cross-sectional design limits the ability to infer causality between LCD score and OF risk. Second, both the covariates and the calculation of LCD score were primarily based on self-reported questionnaire data, which may introduce recall or interview bias. Additionally, participants with incomplete data were excluded from the analysis, and it remains unclear whether their exclusion may have influenced the results. Finally, as the data were derived from a U.S. population, the applicability of these findings to other geographical regions or demographic groups necessitates additional exploration.
Conclusion
This study identified a significant relationship between LCD score and OF risk, with age, alcohol intake, and hypertension status serving as key moderating variables. The observed linear relationship indicates that individuals under 45 years of age, those who consume alcohol, and those without hypertension should pay particular attention to adjusting the proportions of macronutrient intake in their diets. Due to the complexity of dietary nutrition, further research is warranted to elucidate the relationship between dietary patterns and OF risk.
Data availability statement
The data and materials in the current study are available from the corresponding author on reasonable request.
Author contributions
YS: Conceptualization, Writing – original draft, Writing – review & editing. HW: Data curation, Writing – review & editing.
Funding
The author(s) declare that no financial support was received for the research and/or publication of this article.
Conflict of interest
The authors declare that the research was conducted in the absence of any commercial or financial relationships that could be construed as a potential conflict of interest.
Generative AI statement
The authors declare that no Gen AI was used in the creation of this manuscript.
Any alternative text (alt text) provided alongside figures in this article has been generated by Frontiers with the support of artificial intelligence and reasonable efforts have been made to ensure accuracy, including review by the authors wherever possible. If you identify any issues, please contact us.
Publisher’s note
All claims expressed in this article are solely those of the authors and do not necessarily represent those of their affiliated organizations, or those of the publisher, the editors and the reviewers. Any product that may be evaluated in this article, or claim that may be made by its manufacturer, is not guaranteed or endorsed by the publisher.
Supplementary material
The Supplementary material for this article can be found online at: https://www.frontiersin.org/articles/10.3389/fpubh.2025.1668024/full#supplementary-material
References
1. Clynes, MA, Harvey, NC, Curtis, EM, Fuggle, NR, Dennison, EM, and Cooper, C. The epidemiology of osteoporosis. Br Med Bull. (2020) 133:105–17. doi: 10.1093/bmb/ldaa005
2. LeBoff, MS, Greenspan, SL, Insogna, KL, Lewiecki, EM, Saag, KG, Singer, AJ, et al. The clinician's guide to prevention and treatment of osteoporosis. Osteoporos Int. (2022) 33:2049–102. doi: 10.1007/s00198-021-05900-y
3. Khan, AA, Slart, RHJA, Ali, DS, Bock, O, Carey, JJ, Camacho, P, et al. Osteoporotic fractures: diagnosis, evaluation, and significance from the international working group on DXA best practices. Mayo Clin Proc. (2024) 99:1127–41. doi: 10.1016/j.mayocp.2024.01.011
4. Lewiecki, EM, Ortendahl, JD, Vanderpuye-Orgle, J, Grauer, A, Arellano, J, Lemay, J, et al. Healthcare policy changes in osteoporosis can improve outcomes and reduce costs in the United States. JBMR Plus. (2019) 3:e10192. doi: 10.1002/jbm4.10192
5. Rizzoli, R, Biver, E, and Brennan-Speranza, TC. Nutritional intake and bone health. Lancet Diabetes Endocrinol. (2021) 9:606–21. doi: 10.1016/S2213-8587(21)00119-4
6. Kunutsor, SK, Laukkanen, JA, Whitehouse, MR, and Blom, AW. Adherence to a Mediterranean-style diet and incident fractures: pooled analysis of observational evidence. Eur J Nutr. (2018) 57:1687–700. doi: 10.1007/s00394-017-1432-0
7. Chapuy, MC, Arlot, ME, Duboeuf, F, Brun, J, Crouzet, B, Arnaud, S, et al. Vitamin D3 and calcium to prevent hip fractures in elderly women. N Engl J Med. (1992) 327:1637–42. doi: 10.1056/NEJM199212033272305
8. Bischoff-Ferrari, HA, Willett, WC, Orav, EJ, Lips, P, Meunier, PJ, Lyons, RA, et al. A pooled analysis of vitamin D dose requirements for fracture prevention. N Engl J Med. (2012) 367:40–9. doi: 10.1056/NEJMoa1109617
9. Iuliano, S, Poon, S, Robbins, J, Bui, M, Wang, X, De Groot, L, et al. Effect of dietary sources of calcium and protein on hip fractures and falls in older adults in residential care: cluster randomised controlled trial. BMJ. (2021) 375:n2364. doi: 10.1136/bmj.n2364
10. Sangsefidi, ZS, Salehi-Abarghouei, A, Sangsefidi, ZS, Mirzaei, M, and Hosseinzadeh, M. The relation between low carbohydrate diet score and psychological disorders among Iranian adults. Nutr Metab. (2021) 18:16. doi: 10.1186/s12986-021-00546-3
11. Halton, TL, Willett, WC, Liu, S, Manson, JAE, Albert, CM, Rexrode, K, et al. Low-carbohydrate-diet score and the risk of coronary heart disease in women. N Engl J Med. (2006) 355:1991–2002. doi: 10.1056/NEJMoa055317
12. Wang, H, Lv, Y, Ti, G, and Ren, G. Association of low-carbohydrate-diet score and cognitive performance in older adults: National Health and nutrition examination survey (NHANES). BMC Geriatr. (2022) 22:983. doi: 10.1186/s12877-022-03607-1
13. Namazi, N, Larijani, B, and Azadbakht, L. Low-carbohydrate-diet score and its association with the risk of diabetes: a systematic review and Meta-analysis of cohort studies. Horm Metab Res. (2017) 49:565–71. doi: 10.1055/s-0043-112347
14. Gao, JW, Hao, QY, Zhang, HF, Li, XZ, Yuan, ZM, Guo, Y, et al. Low-carbohydrate diet score and coronary artery calcium progression: results from the CARDIA study. Arterioscler Thromb Vasc Biol. (2021) 41:491–500. doi: 10.1161/ATVBAHA.120.314838
15. Sangsefidi, ZS, Lorzadeh, E, Nadjarzadeh, A, Mirzaei, M, and Hosseinzadeh, M. The association between low-carbohydrate diet score and metabolic syndrome among Iranian adults. Public Health Nutr. (2021) 24:6299–308. doi: 10.1017/S1368980021003074
16. Afarideh, M, Sartori-Valinotti, JC, and Tollefson, MM. Association of Sun-Protective Behaviors with Bone Mineral Density and Osteoporotic Bone Fractures in US adults. JAMA Dermatol. (2021) 157:1437–46. doi: 10.1001/jamadermatol.2021.4143
17. Jia, P, and Yuan, J. Weight change patterns across adulthood in relation to osteoporosis and fracture among non-obese individuals. Arch Osteoporos. (2023) 19:2. doi: 10.1007/s11657-023-01362-3
18. Mozaffari, H, Daneshzad, E, and Azadbakht, L. Dietary carbohydrate intake and risk of bone fracture: a systematic review and meta-analysis of observational studies. Public Health. (2020) 181:102–9. doi: 10.1016/j.puhe.2019.12.001
19. Webster, J, Greenwood, DC, and Cade, JE. Foods, nutrients and hip fracture risk: a prospective study of middle-aged women. Clin Nutr. (2022) 41:2825–32. doi: 10.1016/j.clnu.2022.11.008
20. Mozaffari, H, Djafarian, K, Mofrad, MD, and Shab-Bidar, S. (2018). Dietary Fat, Saturated Fatty Acids, and Monounsaturated Fatty Acids Intake and Risk of Bone Fracture: A Systematic Review and Meta-Analysis of Observational Studies. Osteoporos Int. 29, 1949–1961.
21. Niazi, S, Mazloomi, M, Ostovar, A, Fahimfar, N, Nematy, H, Rezaie, M, et al. Fatty acid dietary intakes and blood concentrations in relation to hip fracture risk in adults: a systematic review and meta-analysis of prospective cohort studies. Osteoporos Int. (2025) 4:7587. doi: 10.1007/s00198-025-07587-x
22. Burke, LM, Ross, ML, Garvican-Lewis, LA, Welvaert, M, Heikura, IA, Forbes, SG, et al. Low carbohydrate, high fat diet impairs exercise economy and negates the performance benefit from intensified training in elite race walkers. J Physiol. (2017) 595:2785–807. doi: 10.1113/JP273230
23. Burke, LM, Whitfield, J, Heikura, IA, Ross, MLR, Tee, N, Forbes, SF, et al. Adaptation to a low carbohydrate high fat diet is rapid but impairs endurance exercise metabolism and performance despite enhanced glycogen availability. J Physiol. (2021) 599:771–90. doi: 10.1113/JP280221
24. Burén, J, Ericsson, M, Damasceno, N, and Sjödin, A. A ketogenic low-carbohydrate high-fat diet increases LDL cholesterol in healthy, young, Normal-weight women: a randomized controlled feeding trial. Nutrients. (2021) 13:814. doi: 10.3390/nu13030814
25. Ke, Y, Hu, H, Zhang, J, Yuan, L, Li, T, Feng, Y, et al. Alcohol consumption and risk of fractures: a systematic review and dose-response Meta-analysis of prospective cohort studies. Adv Nutr. (2023) 14:599–611. doi: 10.1016/j.advnut.2023.03.008
26. Asoudeh, F, Salari-Moghaddam, A, Larijani, B, and Esmaillzadeh, A. A systematic review and meta-analysis of prospective cohort studies on the association between alcohol intake and risk of fracture. Crit Rev Food Sci Nutr. (2022) 62:5623–37. doi: 10.1080/10408398.2021.1888691
27. Solomon, DH, Mogun, H, Garneau, K, and Fischer, MA. Risk of fractures in older adults using antihypertensive medications. J Bone Miner Res. (2011) 26:1561–7. doi: 10.1002/jbmr.356
28. Ruths, S, Bakken, MS, Ranhoff, AH, Hunskaar, S, Engesæter, LB, and Engeland, A. Risk of hip fracture among older people using antihypertensive drugs: a nationwide cohort study. BMC Geriatr. (2015) 15:153. doi: 10.1186/s12877-015-0154-5
Keywords: low-carbohydrate diet, osteoporotic fractures, National Health and Nutrition Examination Survey, macronutrients, adults and older adults
Citation: Shen Y and Wei H (2025) Association of low-carbohydrate-diet score and osteoporotic fractures: National Health and Nutrition Examination Survey. Front. Public Health. 13:1668024. doi: 10.3389/fpubh.2025.1668024
Edited by:
Mohammad Daher, Hôtel-Dieu de France, LebanonReviewed by:
Edyta Łuszczki, University of Rzeszow, PolandJuliana Ebling Brondani, Federal University of Minas Gerais, Brazil
Copyright © 2025 Shen and Wei. This is an open-access article distributed under the terms of the Creative Commons Attribution License (CC BY). The use, distribution or reproduction in other forums is permitted, provided the original author(s) and the copyright owner(s) are credited and that the original publication in this journal is cited, in accordance with accepted academic practice. No use, distribution or reproduction is permitted which does not comply with these terms.
*Correspondence: Yuntao Shen, c2hlbnl1bnRhbzIzODdAMTYzLmNvbQ==