 Zhen Wang1,2
 Guanglin Wang
- 1Department of Orthopedics Surgery, West China Hospital, Trauma Medical Center, Sichuan University, Chengdu, China
- 2Department of Orthopedics, West China Hospital, Sichuan University, Chengdu, China
- 3Department of Gynecology, West China Second Hospital, Sichuan University, Chengdu, China
Background: Fall-induced hip fractures in perimenopausal women (FHFPW) are major clinical and public health concern, contributing significantly to global morbidity. This study examines the global impact of FHFPW, focusing on the prevalence, incidence, and years lived with disability (YLDs) across different age groups, regions, and levels of Socio-demographic index (SDI) from 1990 to 2021. The aim is to provide epidemiological data that can inform health policies, and enhance strategies for the prevention and treatment of hip fractures in perimenopausal women.
Methods: We extracted registered data on incidence cases, prevalence cases, and YLD cases, along with the corresponding rates and their 95% uncertainty intervals (UIs), from the Global Burden of Disease (GBD) 2021 database. All rates in this study were expressed per 100,000 population. The estimated annual percentage change (EAPC) was used to assess changes in the burden of FHFPW and Spearman’s correlation tests were used to examine the relationship between SDI and the burden of FHFPW. The average annual percentage change (AAPC) was further calculated to evaluate temporal trends.
Results: The disease burden of FHFPW was substantially higher in the 50-54-year age group than in the 45-49-year group. In 2021, there were 300,104 cases among women aged 50–54 years, compared with 164,196 cases in the 45-49-year group. From 1990 to 2021, although the absolute numbers of prevalent cases, incident cases, and YLDs increased, the corresponding incidence, prevalence, and YLDs rates declined. The burden was greater in high-SDI regions, particularly in Oceania, where the prevalence in the 50-54-year group demonstrated the most striking increase (+295.7%). Joinpoint analysis further indicated that, overall, prevalence and YLDs rates showed a downward trend, whereas incidence in the 50-54-year group within high-SDI regions exhibited the most pronounced rise (AAPC = 0.8%; p < 0.001).
Conclusion: The global burden of disease for FHFPW remains high and tends to increase further; age is an important influencing factor. The burden of disease shows significant regional variations, with a higher burden of disease in regions with high SDI.
1 Introduction
Fall-induced hip fractures among perimenopausal women (FHFPW) are defined as fractures directly resulting from falls during the perimenopausal transition, a stage characterized by reduced secretion of oestrogen, dehydroepiandrosterone (DHEAS), and thyroid-stimulating hormone (TSH) (1–4). These hormonal changes exert substantial effects on bone health, increasing susceptibility to osteoporosis and fragility fractures (1–4). One study also identified lower serum levels of 25-hydroxyvitamin D as a significant risk factor for hip fractures, with an adjusted relative risk of 1.58 (5).
The clinical implications of hormonal changes extend beyond biological effects, encompassing considerable economic consequences, as exemplified by FHFPW (6, 7). A simulation of life expectancy, fracture risk, and economic impact estimated that Chinese women aged 50 years would experience an average of 0.135 hip fractures per person over their remaining lifetime. The residual lifetime risk of a hip fracture for a 50-year-old woman was estimated at 37.36%. These fractures lead to excess losses of 0.11 quality-adjusted life years (QALYs) and lifetime costs of $714.6, culminating in a total net monetary benefit loss of $1,104.4 (8). Globally, the direct annual cost of treating osteoporotic fractures in Canada, Europe, and the United States ranges from $500 billion to $6,500 billion, excluding indirect costs like disability and lost productivity (9).
The incidence of hip fractures has risen globally over the past three decades, particularly among individuals aged 55 years and older, highlighting the persistent burden of these injuries. In 2019, falls accounted for the highest proportion of grade 3 injuries leading to hip fractures in this age group (10, 11). Although studies report a decline in age-standardized hip fracture incidence in women [Annual Average Percentage Change (AAPC) = −1.1%] and a slight increase in men (AAPC = 0.1%) between 1990 and 2019. The socioeconomic and familial burden of FHFPW may be particularly pronounced. As many perimenopausal women remain active in the workforce and shoulder family responsibilities, hip fractures in this group impose not only substantial medical and rehabilitation costs but also indirect losses due to reduced productivity, increased dependency, and psychological stress (12). However, current studies have primarily focused on older populations or the overall burden of osteoporotic fractures, while the specific global burden of fall-induced hip fractures among FHFPW has not yet been systematically investigated.
This study aims to assess trends in the prevalence, incidence, and years lived with disability (YLDs) of FHFPW at global, regional, and national levels from 1990 to 2021 by using registered data in GBD 2021. These findings will provide a basis for developing targeted prevention and treatment strategies.
2 Methods
2.1 Data acquisition
The Global Burden of Disease (GBD) 2021 study utilized the latest epidemiological data and standardized methodologies to comprehensively assess health losses caused by 369 diseases, injuries, and impairments across 204 countries and territories, accounting for 88 risk factors. The study design and methods have been thoroughly detailed in previous GBD publications (13). All data in our study were obtained from the GBD 2021 registry and further analyzed.
2.2 Study definitions
2.2.1 Disease definition
Falls are clearly defined as injury events resulting from an individual inadvertently coming to rest on the ground or another lower level, coded in International Classification of Diseases (ICD)-10 as W00-W19, with sequelae including hip fracture, traumatic brain injury, spinal cord injury, and other residual health outcomes. Hip fractures are coded as ICD-10 S72.0–72.2, and when these two codes occur within the same healthcare episode, cases of fall-related hip fracture can be identified (14, 15). It is important to note, however, that the GBD framework does not rely on strict parallel occurrence of these codes in individual records. Instead, it integrates multiple sources of information (hospital discharge data, vital registration, surveys, and other datasets) and applies modeling techniques to estimate incidence and prevalence.
2.2.2 Bayesian meta-regression tool version 2.1
GBD estimates inherently carry uncertainty arising from several factors, including sampling error of input data, adjustments and standardization methods, uncertainty in model coefficients, variability in severity distributions and disability weights, and differences in sample size across data sources (15). To quantify this uncertainty in the final estimates, 1,000 draws were taken from the posterior distribution of the Bayesian meta-regression tool version 2.1 (DisMod-MR 2.1), and corresponding 95% uncertainty intervals (UIs) were generated in registered data. Specifically, prevalence in GBD was estimated using DisMod-MR 2.1 by integrating incidence data with disease duration, while YLDs was calculated by multiplying prevalence by the corresponding disability weight and adjusting for comorbidities to quantify the loss of healthy life years (13). Additionally, only the nonfatal burden of hip fracture was measured in GBD 2021; thus, this study reports incidence, prevalence, and YLDs but not cause-specific mortality or YLLs.
2.2.3 Socio-demographic index
The Socio-demographic index (SDI), introduced in 2015 by the Institute for Health Metrics and Evaluation (IHME) at the University of Washington, serves as a key metric for linking social development to population health outcomes (15). It is derived as the geometric mean of three core indicators: the total fertility rates up to age 25 (TFU25), the average years of education among individuals aged 15 and older (EDU15+), and lagged per capita distributive income (LDI). An SDI score of 0 corresponds to the highest fertility rates, lowest educational attainment, and lowest income levels, while a score of 1 indicates the opposite. Based on these scores, countries are grouped into five categories: high SDI, medium-high SDI, medium SDI, medium-low SDI, and low SDI.
2.3 Estimated annual percentage change and percentage change
The estimated annual percentage change (EAPC) is a well-established and widely used indicator that has been extensively applied in previous studies to track temporal trends in measures such as incidence and prevalence (16). In this study, we estimated trends in FHFPW incidence, prevalence, and YLDs from 1990 to 2021 by fitting a regression model to the natural logarithm of rates over time, with the slope of the fitted line used to calculate the EAPC (17). A trend was considered increasing if the lower 95% confidence interval (95% CI) of the EAPC exceeded 0, decreasing if the upper 95% CI was below 0, and statistically insignificant if the 95% CI included 0.
(x: year, y: natural logarithm of the rate (e.g., mortality, prevalence, morbidity, DALYs), α: intercept, β: slope, ε: random error).
2.4 Joinpoint regression modeling
We used Joinpoint regression modeling, a statistical method commonly used in epidemiology to assess time trends in disease prevalence and incidence. The optimal number of Joinpoints was determined using the Bayesian Information Criterion (BIC), allowing for up to three Joinpoints (18). Statistical significance was assessed with Monte Carlo permutation tests (p < 0.05), and model adequacy was evaluated through residual analysis and visual inspection for epidemiological plausibility (18). The default modeling method—the grid search method—calculates the annual percentage change (APC) and its 95% CI to describe trends over time. In addition, the average annual percentage change (AAPC) from 1990 to 2021 was calculated to provide an overall assessment of trends.
2.5 Statistical analyses
In this study, we described the absolute burden, incidence, prevalence, YLDs, and their corresponding EAPCs attributable to FHFPW, stratified by age group and region (13). Spearman’s correlation analysis was conducted to examine the associations between SDI and the FHFPW disease burden. Temporal trends were further evaluated using the Joinpoint regression to calculate the AAPC with 95% CIs.
2.6 Statistical software
All analyses were performed using R software (version 4.4.1).
3 Results
3.1 Global level
3.1.1 Prevalence trends
In 2021, the global prevalence of FHFPW in persons aged 45–49 years was 164,196 (95% UI: 132,953–199,964), up from 96,718 in 1990, representing a 69.8% increase (95% UI: 45.1–94.5%). However, the prevalence rate declined from 85.0 to 69.7 per 100,000, with an overall decrease of 18.0% (95% UI: −29.9 to −6.1%) and an EAPC of −0.9 (95% CI: −0.9 to −0.8). In the 50–54 age group, cases rose from 126,511 to 300,104 (88.2% increase; 95% UI: 54.9–121.4%), while the prevalence rate decreased from 152.0 to 134.6 per 100,000 (−11.5%; 95% UI: −27.1 to −4.2%) with an EAPC of −0.5 (95% CI: −0.6 to −0.4) (Table 1). From 1990 to 2021, prevalence and incidence numbers increased in both age groups, with a faster rise in the 50–54 group. YLD counts were stable in the 45–49 group but showed a gradual increase in the 50–54 group (Figure 1). Over the same period, prevalence rates declined slightly, incidence rates remained stable, and YLD rates decreased modestly in both groups (Figure 1). Overall, prevalence, incidence, and YLDs were consistently higher in the 50–54 age group (Supplementary Tables S1, S2).
Table 1. Prevalence of fall-induced hip fractures in perimenopausal women in 1990 and 2021 and change from 1990 to 2021.
Figure 1. Prevalence of FHFPW by time and region, incidence, YLDs. (A) Case number of FHFPW for the 45-49 and 50-54 age groups for each year from 1900 through 2021. (B) Rates of FHFPW for the 45-49 and 50-54 age groups for each year from 1900 through 2021. (C) Case number of FHFPW for 2021 by region. (D) Case number of FHFPW for 2021 by FHFPW rates by region.
3.2 Regional level
3.2.1 Prevalence trends
The global burden of FHFPW varied substantially across regions and was strongly associated with SDI. In the 45–49 age group, the High SDI region had the highest prevalence (56,483; 95% UI: 44,736–71,518), while Oceania showed the largest relative increase (295.0%). Similarly, in the 50–54 age group, the High SDI region reported the highest prevalence (124,710; 95% UI: 96,244–168,498), with Oceania again exhibiting the greatest relative increase (295.7%) (Table 1; Figure 2). Other regions with high prevalence in 2021 included East Asia, High-income North America, South Asia, and Western Europe (Table 1; Figure 1). In the 45–49 age group, Western Europe had the highest prevalence (204.7 per 100,000), while Oceania showed the greatest relative increase (40.3%) and highest EAPC (1.0; 95% CI: 1.0–1.1). For the 50–54 age group, High-income North America reported the highest prevalence (439.67 per 100,000) and the largest increase (EAPC = 1.4; 95% CI: 1.3–1.6). Other regions with high prevalence included Western Europe, Australasia, and High-income Asia Pacific (Table 1; Figures 1, 2).
Figure 2. Changes in the burden of disease for FHFPW globally and by region. (A,B) Number percentage change in FHFPW from 1990 to 2021. (C,D) Rate percentage change in FHFPW from 1990 to 2021. (E,F) EAPC for FHFPW from 1990 to 2021.
3.2.2 Incidence patterns
Incidence cases varied markedly by region and age group. In the 45–49 age group, the High SDI region reported the highest number of cases (36,924; 95% UI: 20,921–62,197), while Oceania showed the largest relative increase (307.8%). For the 50–54 age group, cases again peaked in the High SDI region (76,550), with Oceania showing the greatest increase (295.2%; 95% UI: 141.8–448.6). Other regions with high case numbers included East Asia, High-income North America, South Asia, and Western Europe (32,212–43,799) (Supplementary Table S1; Figures 1, 2). High-income North America consistently had the highest incidence rates, reaching 140.5 per 100,000 in the 45–49 age group (relative increase: 52.9%; EAPC = 1.7, 95% CI: 1.5–1.8) and 307.3 per 100,000 in the 50–54 age group (increase: 94.1%; EAPC = 2.6, 95% CI: 2.4–2.8). Other regions with high incidence rates included Australasia and Western Europe (144.7–222.6 per 100,000) (Supplementary Table S1; Figure 1).
3.2.3 YLDs patterns
For YLD counts, South Asia recorded the highest in the 45–49 age group (5,821; 95% UI: 3,890–8,056), while the High SDI region led in the 50–54 age group (9,971; 95% UI: 6,146–14,935). Oceania showed the largest relative increase in both groups (>260%). East Asia, High-income North America, and Western Europe also contributed substantially, with 2021 YLDs ranging from 4,314 to 5,792 (Supplementary Table S2; Figure 1). For YLD rates, Oceania was highest in the 45–49 age group (18.07 per 100,000; EAPC = 0.9, 95% CI: 0.8–0.9), whereas High-income North America ranked first in the 50–54 group (36.4 per 100,000; EAPC = 1.7, 95% CI: 1.5–1.9). Other regions with high rates in 2021 included Western Europe, Australasia, and Southern Latin America (22.5–31.0 per 100,000) (Supplementary Table S2; Figure 2).
3.3 SDI level
3.3.1 Spearman’s correlation between FHFPW burden and SDI
Spearman’s rank-order analyses showed that FHFPW burden was positively associated with SDI. In both the 45–49 and 50–54 age groups, prevalence, incidence, and YLD numbers exhibited only weak positive correlations (all p < 0.001). By contrast, rates showed stronger associations: prevalence rates had the strongest positive correlation with SDI (p < 0.001), while YLD rates demonstrated weaker but still significant positive correlations (p < 0.001) (Figure 3; Supplementary Figure S1).
Figure 3. Correlation analysis between SDI and rates. (A-C) Correlation analysis in age group 45-49 years between FHFPW rate and SDI. (D-F) Correlation analysis in age group 50-54 years between FHFPW rate and SDI.
3.3.2 Prevalence trends by SDI region
Trends in FHFPW from 1990 to 2021 across SDI levels were analyzed using Joinpoint regression. In the 45–49 age group, prevalence rates declined across all SDI regions, with the largest decrease in the High-middle SDI region (AAPC = −0.5%), most notable from 2007 to 2013 (AAPC = −2.3%) and followed by an increase from 2018 to 2021 (AAPC = 2.1%). The Middle SDI region showed the smallest overall decline (AAPC = −0.05%), with a sharp fall from 2001 to 2004 (AAPC = −4.8%) and an increase from 2011 to 2021 (AAPC = 2.1%) (Figure 4; Supplementary File 1). Incidence rates increased in High SDI (AAPC = 0.3%) and Middle SDI regions (AAPC = 0.4%) (Figure 4, Supplementary File 2). YLD rates decreased across all regions, most markedly in the High-middle SDI region (AAPC = −2.0%) and least in the High SDI region (AAPC = −0.7%) (Figure 4; Supplementary File 3). In the 50–54 age group, prevalence increased most in the High SDI region (AAPC = 0.3%), particularly from 2006 to 2011 (APC = 0.9%), then stabilized during 2011–2017 (APC = −0.01%) before declining in 2017–2021 (APC = −0.3%). Middle and Low SDI regions also showed upward prevalence trends, with AAPCs of 0.1 and 0.07%, respectively (Figure 4; Supplementary File 4).
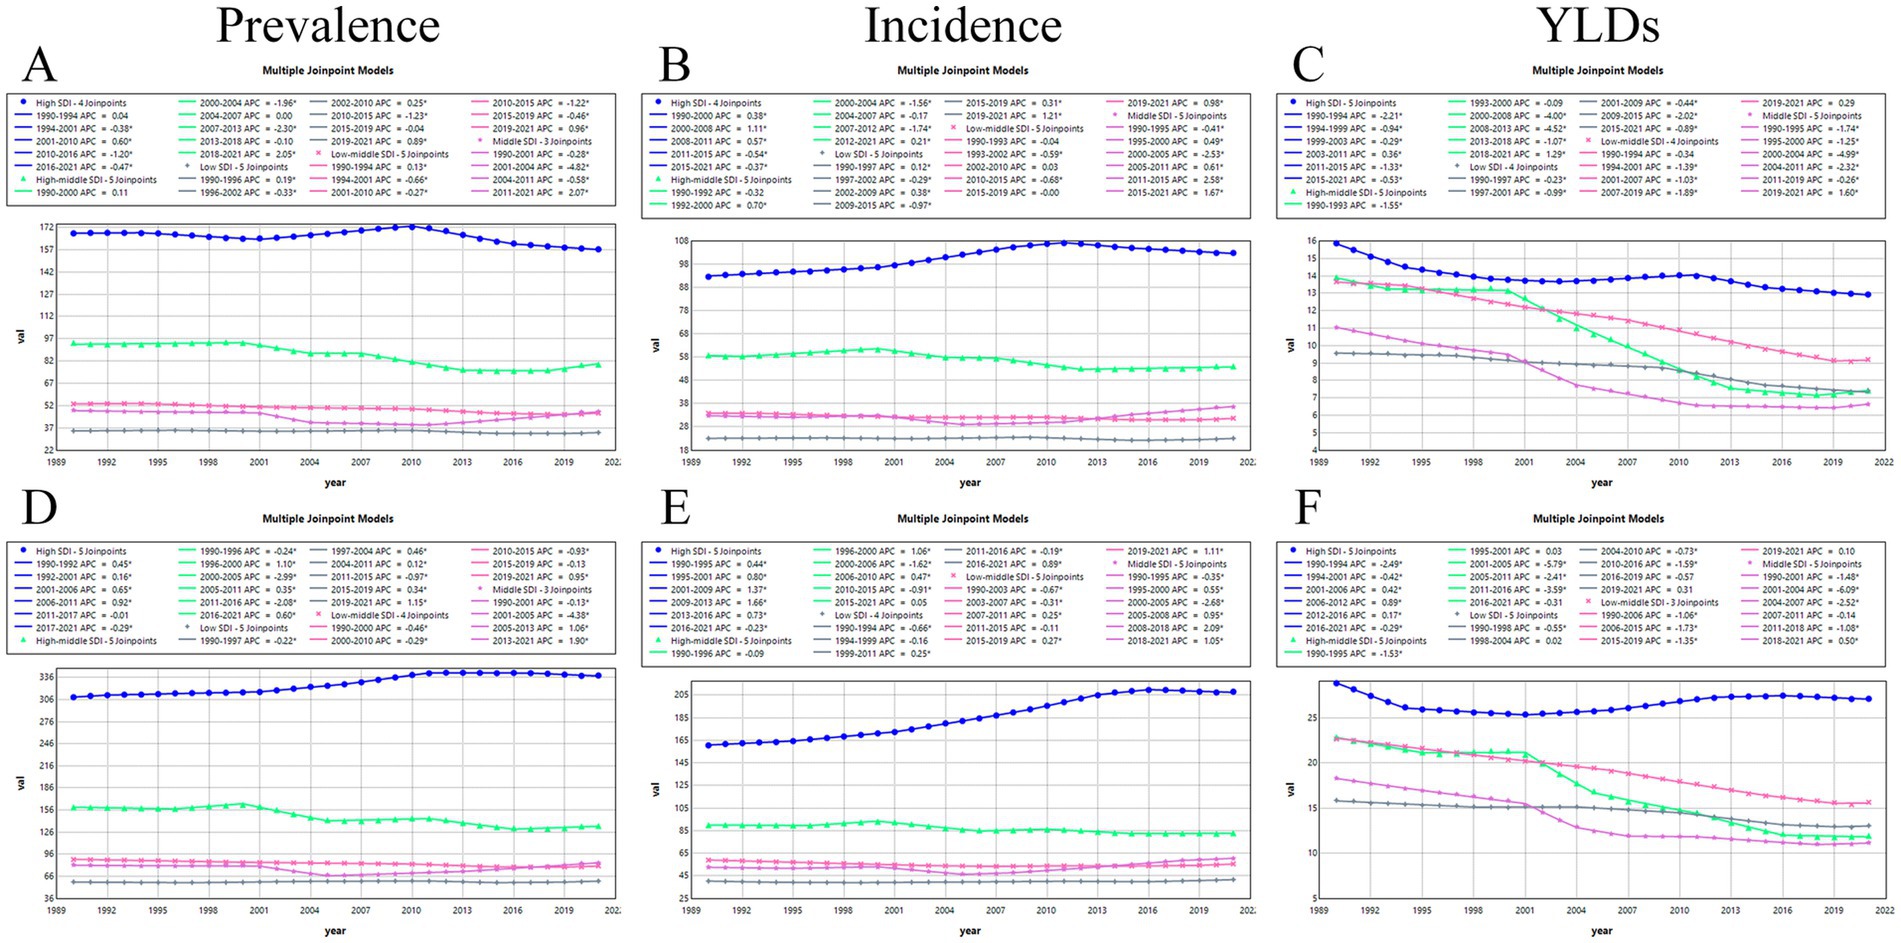
Figure 4. Joinpoint analysis. (A-C) Joinpoint analysis of prevalence, incidence and YLDs in the age group 45-49 years. (D-F) Joinpoint analysis of prevalence, incidence and YLDs in the age group 50-54 years.
3.3.3 Incidence trends by SDI region
For incidence rates, the strongest increase occurred in the High SDI region (AAPC = 0.82%), followed by the Middle SDI region (AAPC = 0.8%). The smallest increase was observed in the Low SDI region (AAPC = 0.1%). In contrast, both High-middle and Low-middle SDI regions showed declines, with AAPCs of −0.3% and −0.2%, respectively (Figure 4; Supplementary File 5).
3.3.4 YLD rate trends by SDI region
For YLD rates, all SDI regions showed decreasing trends from 1990 to 2021. The largest decline occurred in the High-middle SDI region (AAPC = −2.1%), while the smallest decline was observed in the High SDI region (AAPC = −0.2%). Notably, the High SDI region exhibited temporary upward trends between 2001 and 2006 (AAPC = 0.4), 2006–2012 (AAPC = 0.9%), and 2012–2016 (AAPC = 0.2%) (Figure 4; Supplementary File 6).
3.4 National level
3.4.1 Prevalence trends
At the national level, country-specific distributions of FHFPW prevalence from 1990 to 2021 were shown in Figure 5 and Supplementary Figure S2. In the 45–49 age group, the largest increases in prevalence number were observed in the United Arab Emirates (12.0 per 100,000), Qatar (10.5), Bahrain (5.4), Kuwait (5.1), and Jordan (4.6). In the 50–54 age group, the highest increases were in the United Arab Emirates (12.2), Qatar (11.4), Kuwait (6.1), Bahrain (5.3), and Jordan (4.5) (Supplementary Files 7, 8). For prevalence rates, the greatest increases in the 45–49 age group occurred in Spain (0.7), Cambodia (0.5), Papua New Guinea (0.4), Sri Lanka (0.4), and Cuba (0.4). In the 50–54 age group, the largest increases were seen in Spain (0.6), Cambodia (0.5), Sri Lanka (0.5), and the United States (0.50) (Supplementary Files 9, 10).
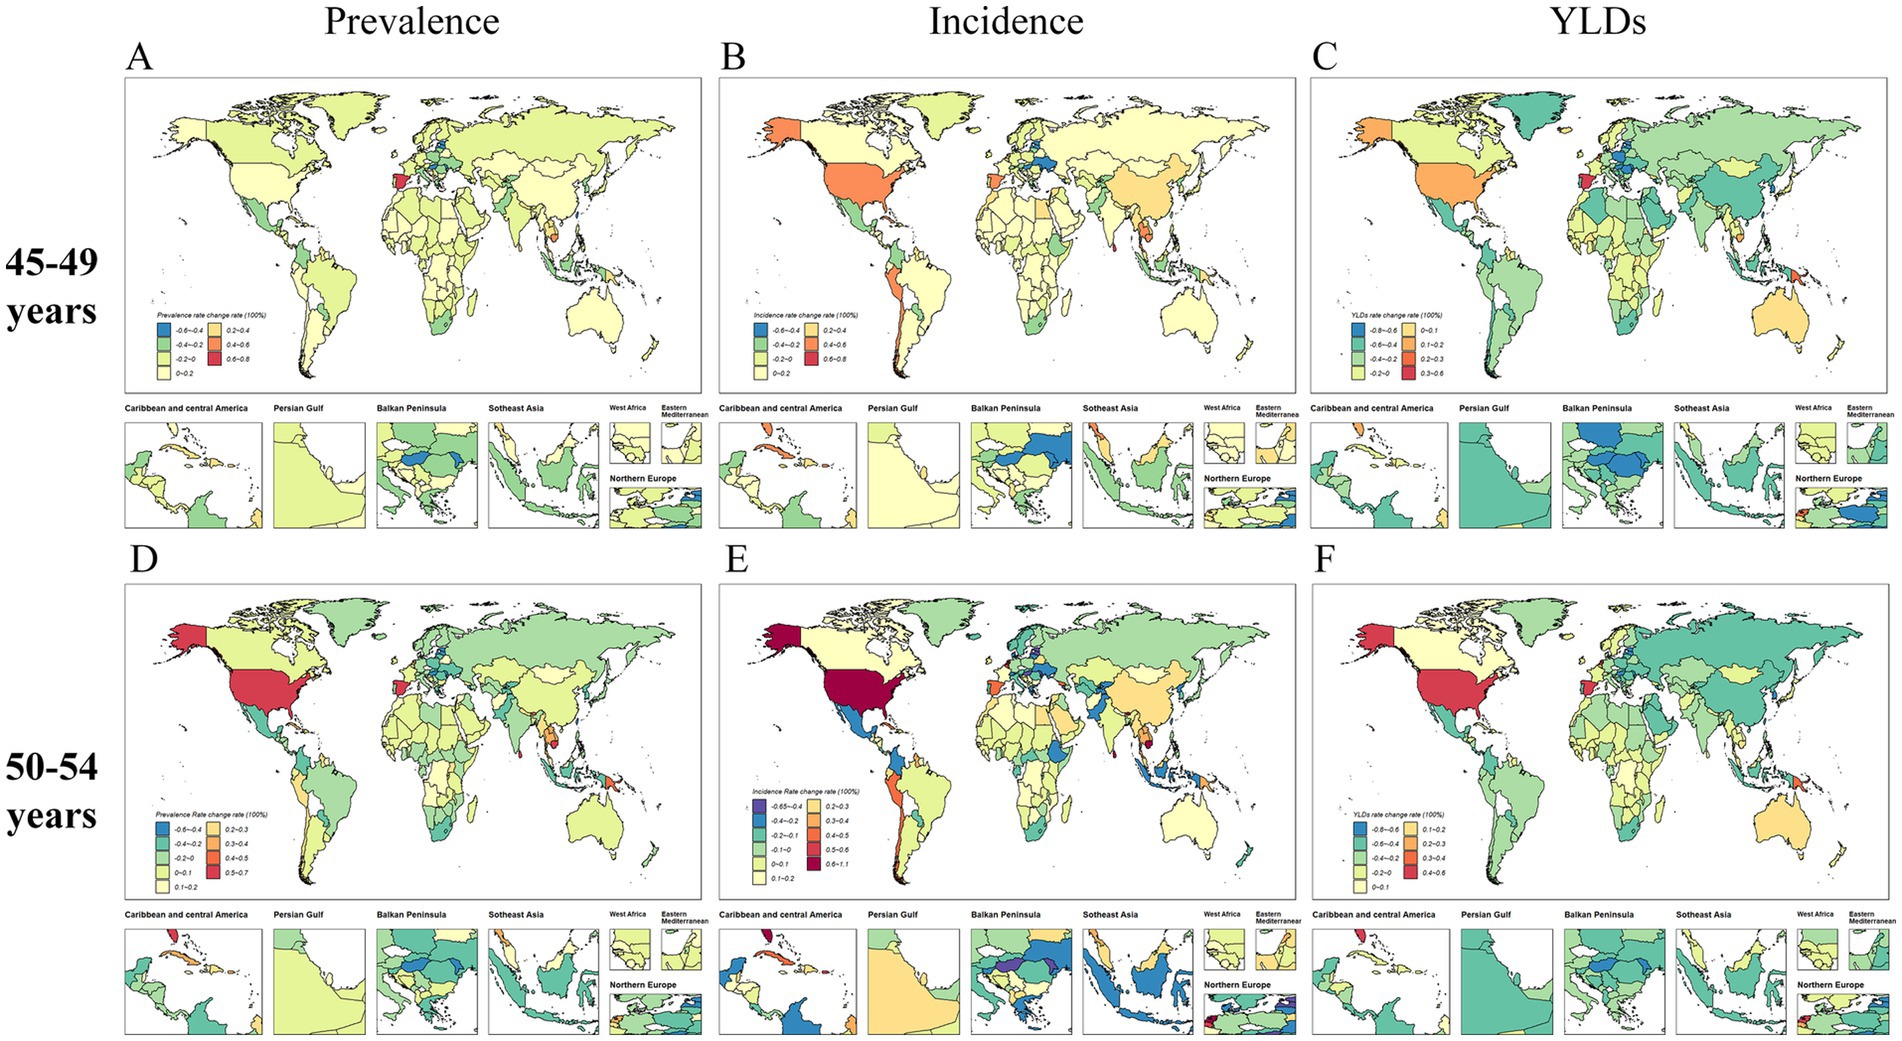
Figure 5. Global distribution of the rates of change in FHFPW disease burden from 1990 to 2021. (A-C) Global distribution of the rate of change in FHFPW disease burden rate in the 45-49 age group. (D-F) Global distribution of the rate of change in FHFPW disease burden rate in the 50-54 age group.
3.4.2 Incidence patterns
Regarding incidence cases, several countries showed high growth from 1990 to 2021(Figure 5; Supplementary Figure S2). In the 45–49 age group, the largest increases occurred in the United Arab Emirates (12.9), Puerto Rico (12.6), Kiribati (6.6), Bahamas (6.5), and Sao Tome and Principe (5.2). In the 50–54 age group, notable increases were observed in Qatar (12.7), United Arab Emirates (12.1), Kuwait (7.5), Bahrain (5.9), and Saudi Arabia (5.1) (Supplementary Files 11, 12). For incidence rates, the highest increases in the 45–49 age group were in Sri Lanka (0.7), Bhutan (0.6), the United States (0.6), Spain (0.6), and Cambodia (0.55). In the 50–54 age group, the largest increases were seen in the United States (1.0), Sri Lanka (0.8), Bhutan (0.7), Cambodia (0.6), and the Netherlands (0.6) (Supplementary Files 13, 14).
3.4.3 YLDs patterns
The number of YLDs also showed marked changes from 1990 to 2021(Figure 5; Supplementary Figure S2). In the 45–49 age group, the largest increases occurred in the United Arab Emirates (7.2), Qatar (4.5), Belize (3.4), Papua New Guinea (3.3), and Djibouti (2.9). In the 50–54 age group, notable increases were observed in the United Arab Emirates (7.3), Qatar (4.7), Kuwait (3.4), Papua New Guinea (3.3), and Belize (3.2) (Supplementary Files 15, 16). For YLD rates, the 45–49 age group showed the largest increases in Spain (0.5), Papua New Guinea (0.3), the Netherlands (0.2), the United States (0.2), and Andorra (0.1). In the 50–54 age group, the highest increases were observed in the United States (0.5), Spain (0.4), the Netherlands (0.4), Papua New Guinea (0.3), and Belgium (0.3) (Supplementary Files 17, 18).
4 Discussion
This study provides the first comprehensive assessment of the disease burden of FHFPW and yielded several key findings: (1) the burden was higher in the 50–54 than in the 45–49 age group, with overall prevalence, incidence, and YLDs cases increasing from 1990 to 2021 despite declining rates; (2) Disease burden correlated positively with SDI, particular in the 45–49 age and Oceania (3) Joinpoint analysis revealed the most pronounced rise in incidence rate in the 50–54 age group within high-SDI regions (AAPC = 0.8%; 95% CI: 0.8–0.9; p < 0.001); (4) Differences in the burden of FHFPW were also observed among countries within the same SDI region. Collectively, these findings provide an evidence base to guide health policy, resource allocation, and the development of targeted prevention strategies for FHFPW.
From 1990 to 2021, the absolute burden of hip fractures in women aged 45–54 years increased, whereas the corresponding prevalence and YLDs rates declined. This declining trend may partly be attributable to the rapid expansion of the population base, greater public awareness of fracture prevention, and decades of accumulated clinical expertise that have shortened treatment and recovery times for new cases, collectively indicating progress in diagnosis, prevention, treatment, and prognosis (19, 20). In addition, the reduced risk of hip fracture may be associated with declines in smoking and alcohol consumption rates, as well as with global warming (21, 22). These findings highlight underscore the importance of continued public health measures and clinical advancements in mitigating the burden of hip fractures.
Our study confirmed a higher burden of FHFPW in high-SDI regions, consistent with previous findings (13, 23–26). Joinpoint analysis further supported this pattern, revealing the most pronounced rise in incidence in high-SDI regions. This may reflect rapid urbanization and industrialization in economically developed areas, which drive lifestyle changes such as sedentary behavior, psychosocial stress, and reduced physical activity (27–29). These explanations remain speculative and warrant confirmation in future studies. Notably, regional differences were observed within high-SDI areas: in the 45–49 age group, prevalence and YLD rates were highest in Western Europe, whereas in the 50–54 age group, both prevalence, incidence, and YLD rates peaked in high-income North America. These findings suggest that, even at similar SDI levels, the age distribution of FHFPW burden differs across regions, highlighting the need for region-specific preventive strategies targeting peri-menopausal women aged 45–54.
This study found that over the past 32 years, Oceania experienced the most pronounced increases in FHFPW prevalence, incidence, and YLDs, far exceeding global levels, with YLDs in the 45–49 age group reaching 8.44 times the global average (30). In addition to the psychosocial stress commonly faced by peri-menopausal women, these trends may be linked to region-specific factors (16). On the one hand, although Australia and New Zealand have some of the highest ultraviolet indices worldwide, long-standing sun protection campaigns have reduced cutaneous vitamin D synthesis, and seasonal or high-latitude variations further exacerbate vitamin D deficiency in women, particularly in FHFPW population (5, 31). On the other hand, female obesity rates in Oceania rank among the highest globally, especially in Pacific Island nations (32). Obesity not only increases the risk of falls and hip fractures but is also frequently accompanied by vitamin D deficiency, sarcopenia, and metabolic syndrome, all of which compromise bone health (33). These findings underscore the need for public health strategies in Oceania, including education on appropriate sun exposure and weight management, to reduce the burden of FHFPW (34).
Although the prevalence of FHFPW in the 45–49 and 50–54 age groups across the five SDI regions showed an overall downward trend over the past 32 years, short-term increases were observed in most regions (except high-SDI) during 2019–2021, likely reflecting the impact of the COVID-19 pandemic (35, 36). Reduced sunlight exposure, decreased physical activity, medication shortages, and increased use of hormone therapies may have jointly contributed to this transient surge (37–40). However, in high—and middle-SDI regions, both incidence and prevalence increased, with the rise in prevalence being more pronounced than that in incidence. This pattern suggests a relatively low mortality risk and indicates that peri-menopausal women often survive long after experiencing hip fractures. Such findings underscore the importance of optimizing surgical interventions, postoperative management, and rehabilitation to improve long-term outcomes and quality of life. The declining trend in YLDs rates further supports this interpretation, suggesting that the years of healthy life lost due to hip fractures among peri-menopausal women are gradually decreasing. Overall, despite the continuing substantial burden of disease and incidence, current health policies, treatment strategies, and rehabilitation programs appear to have had a positive impact on postoperative outcomes and late-life quality of life (41–44).
We further examined cross-country variations in the burden of FHFPW from 1990 to 2021. Differences in health policies, financial investment, medical resources, and postoperative rehabilitation quality appear to directly influence disease burden (19, 27, 45, 46). Substantial heterogeneity was observed in the 50–54 age group: while most countries experienced an increasing burden, notable declines were concentrated in Northern and Eastern Europe, Central Asia, and Mediterranean regions, often among geographically proximate nations. Such patterns may reflect shared ethnic backgrounds, dietary habits, and the exchange of health policy strategies. In Europe, for instance, policy coordination is partly facilitated by European Union membership, whereas neighboring non-EU countries also exhibit parallel trends. However, there are also country-level outliers: for example, the Russian Federation and Belarus, despite their geographic proximity, show marked differences in the annual incidence of hip fractures among perimenopausal women, suggesting that country-specific factors such as policy implementation, healthcare accessibility, registration/coding practices, or environmental conditions may also play an important role (47–49). These findings suggest that both regional collaboration and population-specific characteristics influence the FHFPW burden.
Improving the identification of potential FHFPW is essential, and governments should establish healthcare policies that include, but are not limited to, the collection of dual-energy X-ray absorptiometry (DEXA) data from perimenopausal women, the establishment of databases, the sharing of data with family or community physicians, and the ongoing follow-up of key populations. At the same time, trauma centers should be established at all levels of hospitals, especially primary health care institutions, to improve the mechanism of patient transportation and to operate on patients within 24–48 h after injury, depending on their conditions. In addition, it is necessary to strengthen the working environment, living environment, and road facilities to reduce the risk of related falls.
5 Limitation
This study has several limitations. First, both incidence, prevalence and YLDs estimates were derived from registry-based GBD data rather than direct case ascertainment, and the true numbers may therefore differ due to potential underreporting, misclassification, or variations in coding practices. Second, the selected age groups (45–49 and 50–54 years) may not fully capture the typical burden of hip fractures, which usually peaks after 70 years of age. Third, the analysis did not differentiate individual ICD-10 codes but relied on broader clusters, which may reduce diagnostic specificity. These factors should be considered when interpreting our findings, and future population-based prospective studies are warranted to validate these observations.
6 Conclusion
The global burden of disease for fall-induced hip fractures in perimenopausal women shows an overall increasing trend from 1990 to 2021. The overall burden of disease is higher in the 50–54 age group than in the 45–49 age group. It is worth noting that the number of prevalence cases is increasing in most countries and regions, and although YLDs rates and EAPCs are decreasing in most countries and regions due to good health care development, the large increases in high-income North America and Oceania should not be ignored. There is also significant heterogeneity between regions with different SDI levels, with countries with high SDI generally showing higher prevalence, incidence and YLDs.
Data availability statement
The original contributions presented in the study are included in the article/Supplementary material, further inquiries can be directed to the corresponding authors.
Ethics statement
The requirement of ethical approval was waived by the Biomedical Ethics Review Committee of West China Hospital, Sichuan University for the studies involving humans because it used publicly accessible, anonymized data from the Global Burden of Disease Study 2021. The data are aggregated at the population level and do not involve individual patient information, thus not requiring individual informed consent or institutional ethical review. The studies were conducted in accordance with the local legislation and institutional requirements. Written informed consent for participation was not required from the participants or the participants’ legal guardians/next of kin because it utilized anonymized, aggregated data from the Global Burden of Disease Study 2021. The data do not contain any personal identifiers and were obtained from a publicly available database, eliminating the need for individual consent.
Author contributions
ZW: Conceptualization, Data curation, Formal analysis, Investigation, Methodology, Resources, Software, Visualization, Writing – original draft, Writing – review & editing. ZC: Conceptualization, Data curation, Formal analysis, Investigation, Methodology, Software, Visualization, Writing – original draft, Writing – review & editing. CZ: Conceptualization, Investigation, Methodology, Software, Visualization, Writing – review & editing. WLiu: Conceptualization, Methodology, Software, Writing – review & editing. JL: Conceptualization, Data curation, Methodology, Software, Writing – original draft. WLin: Conceptualization, Data curation, Investigation, Methodology, Software, Supervision, Visualization, Writing – original draft, Writing – review & editing. GW: Conceptualization, Data curation, Funding acquisition, Investigation, Methodology, Project administration, Resources, Software, Supervision, Visualization, Writing – original draft, Writing – review & editing.
Funding
The author(s) declare that financial support was received for the research and/or publication of this article. This study was supported by the Development and Clinical Demonstration of an Innovative Internal Fixation System for Femoral Neck Fractures (Grant: 2023YFC2508804), Key R&D Program of the China Ministry of Science and Technology (2024YFC2510600), Science and Technology Projects of Xizang Autonomous Region (XZ202301ZY0046G, XZ202501ZY0129), Sichuan Science and Technology Program (2023NSFSC1753), Commission of Sichuan Province Medical Science and Technology Program (24QNMP005), 1.3.5 project for disciplines of excellence, West China Hospital, Sichuan University (2023–309).
Acknowledgments
Bill & Melinda Gates Foundation (BMGF). The authors thank the GBD Research 2021 collaborators for their excellent work. We thank Sihui Chen of the Department of Neurology, West China Hospital, Sichuan University, for her excellent contribution to the statistical analysis of this study.
Conflict of interest
The authors declare that the research was conducted in the absence of any commercial or financial relationships that could be construed as a potential conflict of interest.
Generative AI statement
The author(s) declare that no Gen AI was used in the creation of this manuscript.
Any alternative text (alt text) provided alongside figures in this article has been generated by Frontiers with the support of artificial intelligence and reasonable efforts have been made to ensure accuracy, including review by the authors wherever possible. If you identify any issues, please contact us.
Publisher’s note
All claims expressed in this article are solely those of the authors and do not necessarily represent those of their affiliated organizations, or those of the publisher, the editors and the reviewers. Any product that may be evaluated in this article, or claim that may be made by its manufacturer, is not guaranteed or endorsed by the publisher.
Supplementary material
The Supplementary material for this article can be found online at: https://www.frontiersin.org/articles/10.3389/fpubh.2025.1674535/full#supplementary-material
References
1. Lo, JC, Burnett-Bowie, SA, and Finkelstein, JS. Bone and the perimenopause. Obstet Gynecol Clin N Am. (2011) 38:503–17. doi: 10.1016/j.ogc.2011.07.001
2. Brinton, RD, Yao, J, Yin, F, Mack, WJ, and Cadenas, E. Perimenopause as a neurological transition state. Nat Rev Endocrinol. (2015) 11:393–405. doi: 10.1038/nrendo.2015.82
3. Zeitlin, J, Parides, MK, Lane, JM, Russell, LA, and Kunze, KN. A clinical prediction model for 10-year risk of self-reported osteoporosis diagnosis in pre- and perimenopausal women. Arch Osteoporos. (2023) 18:78. doi: 10.1007/s11657-023-01292-0
4. LeBoff, MS, Greenspan, SL, Insogna, KL, Lewiecki, EM, Saag, KG, Singer, AJ, et al. The clinician’s guide to prevention and treatment of osteoporosis. Osteoporos Int. (2022) 33:2049–102. doi: 10.1007/s00198-021-05900-y
5. Lv, QB, Gao, X, Liu, X, Shao, ZX, Xu, QH, Tang, L, et al. The serum 25-hydroxyvitamin D levels and hip fracture risk: a meta-analysis of prospective cohort studies. Oncotarget. (2017) 8:39849–58. doi: 10.18632/oncotarget.16337
6. Liu, E. Hip fractures: mortality, economic burden, and organisational factors for improved patient outcomes. Lancet Healthy Longev. (2023) 4:e360–1. doi: 10.1016/S2666-7568(23)00102-2
7. Wang, X, Xu, X, Oates, M, Hill, T, and Wade, RL. Medical management patterns in a US commercial claims database following a nontraumatic fracture in postmenopausal women. Arch Osteoporos. (2022) 17:92. doi: 10.1007/s11657-022-01135-4
8. Jiang, Y, and Ni, W. Expected lifetime numbers, risks, and burden of osteoporotic fractures for 50-year old Chinese women: a discrete event simulation incorporating FRAX. J Bone Miner Metab. (2016) 34:714–22. doi: 10.1007/s00774-015-0724-9
9. Rashki Kemmak, A, Rezapour, A, Jahangiri, R, Nikjoo, S, Farabi, H, Soleimanpour, S, et al. Economic burden of osteoporosis in the world: a systematic review. Med J Islam Repub Iran. (2020) 34:154. doi: 10.34171/mjiri.34.154
10. Feng, JN, Zhang, CG, Li, BH, Zhan, SY, Wang, SF, and Song, CL. Global burden of hip fracture: the global burden of disease study. Osteoporos Int. (2024) 35:41–52. doi: 10.1007/s00198-023-06907-3
11. Dong, Y, Zhang, Y, Song, K, Kang, H, Ye, D, and Li, F. What was the epidemiology and global burden of disease of hip fractures from 1990 to 2019? Results from and additional analysis of the global burden of disease study 2019. Clin Orthop Relat Res. (2023) 481:1209–20. doi: 10.1097/CORR.0000000000002465
12. Brown, L, Hunter, MS, Chen, R, Crandall, CJ, Gordon, JL, Mishra, GD, et al. Promoting good mental health over the menopause transition. Lancet. (2024) 403:969–83. doi: 10.1016/S0140-6736(23)02801-5
13. GBD 2019 Fracture Collaborators. Global, regional, and national burden of bone fractures in 204 countries and territories, 1990-2019: a systematic analysis from the global burden of disease study 2019. Lancet Healthy Longev. (2021) 2:e580–92. doi: 10.1016/S2666-7568(21)00172-0
14. International Statistical Classification of Diseases and Related Health Problems (ICD). Available online at: https://www.who.int/standards/classifications/classification-of-diseases.
15. GBD 2021 Diseases and Injuries Collaborators. Global incidence, prevalence, years lived with disability (YLDs), disability-adjusted life-years (DALYs), and healthy life expectancy (HALE) for 371 diseases and injuries in 204 countries and territories and 811 subnational locations, 1990-2021: a systematic analysis for the global burden of disease study 2021. Lancet. (2024) 403:2133–61. doi: 10.1016/S0140-6736(24)00757-8
16. Cen, J, Wang, Q, Cheng, L, Gao, Q, Wang, H, and Sun, F. Global, regional, and national burden and trends of migraine among women of childbearing age from 1990 to 2021: insights from the global burden of disease study 2021. J Headache Pain. (2024) 25:96. doi: 10.1186/s10194-024-01798-z
17. Yang, X, Chen, H, Zhang, T, Yin, X, Man, J, He, Q, et al. Global, regional, and national burden of blindness and vision loss due to common eye diseases along with its attributable risk factors from 1990 to 2019: a systematic analysis from the global burden of disease study 2019. Aging. (2021) 13:19614–42. doi: 10.18632/aging.203374
18. Global burden of 369 diseases and injuries in 204 countries and territories, 1990-2019: a systematic analysis for the global burden of disease study 2019. Lancet. (2020) 396:1204–22. doi: 10.1016/S0140-6736(20)30925-9
19. Tabu, I, Ivers, R, and Costa, ML. Looking after patients with hip fracture in low- and middle-income countries. Bone Joint J. (2024) 106-B:1369–71. doi: 10.1302/0301-620X.106B12.BJJ-2024-0652
20. Adams, J, Jones, GD, Sadler, E, Guerra, S, Sobolev, B, Sackley, C, et al. Physiotherapists’ perspectives of barriers and facilitators to effective community provision after hip fracture: a qualitative study in England. Age Ageing. (2023) 52:afad130. doi: 10.1093/ageing/afad130
21. Jedynasty, K, Zięba, M, Adamski, J, Czech, M, Głuszko, P, Gozdowski, D, et al. Seasonally dependent change of the number of fractures after 50 years of age in Poland-analysis of combined health care and climate datasets. Int J Environ Res Public Health. (2022) 19:9467. doi: 10.3390/ijerph19159467
22. Swayambunathan, J, Dasgupta, A, Rosenberg, PS, Hannan, MT, Kiel, DP, and Bhattacharyya, T. Incidence of hip fracture over 4 decades in the Framingham heart study. JAMA Intern Med. (2020) 180:1225–31. doi: 10.1001/jamainternmed.2020.2975
23. Veronese, N, and Maggi, S. Epidemiology and social costs of hip fracture. Injury. (2018) 49:1458–60. doi: 10.1016/j.injury.2018.04.015
24. Barbour, KE, Boudreau, R, Danielson, ME, Youk, AO, Wactawski-Wende, J, Greep, NC, et al. Inflammatory markers and the risk of hip fracture: the Women’s Health Initiative. J Bone Miner Res. (2012) 27:1167–76. doi: 10.1002/jbmr.1559
25. Barbour, KE, Lui, LY, Ensrud, KE, Hillier, TA, LeBlanc, ES, Ing, SW, et al. Inflammatory markers and risk of hip fracture in older white women: the study of osteoporotic fractures. J Bone Miner Res. (2014) 29:2057–64. doi: 10.1002/jbmr.2245
26. Jackson, RD, and Mysiw, WJ. Insights into the epidemiology of postmenopausal osteoporosis: the Women’s Health Initiative. Semin Reprod Med. (2014) 32:454–62. doi: 10.1055/s-0034-1384629
27. Johnell, O, and Kanis, JA. An estimate of the worldwide prevalence and disability associated with osteoporotic fractures. Osteoporos Int. (2006) 17:1726–33. doi: 10.1007/s00198-006-0172-4
28. Cauley, JA, Chalhoub, D, Kassem, AM, and Fuleihan, GEH. Geographic and ethnic disparities in osteoporotic fractures. Nat Rev Endocrinol. (2014) 10:338–51. doi: 10.1038/nrendo.2014.51
29. Wade, SW, Strader, C, Fitzpatrick, LA, and Anthony, MS. Sex- and age-specific incidence of non-traumatic fractures in selected industrialized countries. Arch Osteoporos. (2012) 7:219–27. doi: 10.1007/s11657-012-0100-5
30. Bradt, DA, Bartley, B, Hibble, BA, and Varshney, K. Australasian disasters of national significance: an epidemiological analysis, 1900-2012. Emerg Med Australas. (2015) 27:132–8. doi: 10.1111/1742-6723.12357
31. Dunlop, E, Boorman, JL, Hambridge, TL, McNeill, J, James, AP, Kiely, M, et al. Evidence of low vitamin D intakes in the Australian population points to a need for data-driven nutrition policy for improving population vitamin D status. J Hum Nutr Diet. (2023) 36:203–15. doi: 10.1111/jhn.13002
32. Global, regional, and national prevalence of adult overweight and obesity, 1990-2021, with forecasts to 2050: a forecasting study for the global burden of disease study 2021. Lancet. (2025) 405:813–38. doi: 10.1016/S0140-6736(25)00355-1
33. Jiao, Y, Sun, J, Li, Y, Zhao, J, and Shen, J. Association between adiposity and bone mineral density in adults: insights from a National Survey Analysis. Nutrients. (2023) 15:3492. doi: 10.3390/nu15153492
34. Paccou, J, and Compston, JE. Bone health in adults with obesity before and after interventions to promote weight loss. Lancet Diabetes Endocrinol. (2024) 12:748–60. doi: 10.1016/S2213-8587(24)00163-3
35. Lui, DTW, Xiong, X, Cheung, CL, Lai, FTT, Li, X, Wan, EYF, et al. Risks of incident major osteoporotic fractures following SARS-CoV-2 infection among older individuals: a population-based cohort study in Hong Kong. J Bone Miner Res. (2024) 39:551–60. doi: 10.1093/jbmr/zjae041
36. Qiao, W, Lau, HE, Xie, H, Poon, VKM, Chan, CCS, Chu, H, et al. SARS-CoV-2 infection induces inflammatory bone loss in golden Syrian hamsters. Nat Commun. (2022) 13:2539. doi: 10.1038/s41467-022-30195-w
37. Pass, B, Vajna, E, Knauf, T, Rascher, K, Aigner, R, Eschbach, D, et al. COVID-19 and proximal femur fracture in older adults-a lethal combination? An analysis of the registry for geriatric trauma (ATR-DGU). J Am Med Dir Assoc. (2022) 23:576–80. doi: 10.1016/j.jamda.2021.09.027
38. Slullitel, PA, Lucero, CM, Soruco, ML, Barla, JD, Benchimol, JA, Boietti, BR, et al. Prolonged social lockdown during COVID-19 pandemic and hip fracture epidemiology. Int Orthop. (2020) 44:1887–95. doi: 10.1007/s00264-020-04769-6
39. Ding, L, Wei, J, and Wang, B. The impact of COVID-19 on the prevalence, mortality, and associated risk factors for mortality in patients with hip fractures: a Meta-analysis. J Am Med Dir Assoc. (2023) 24:846–54. doi: 10.1016/j.jamda.2023.03.011
40. Rincón-Hoyos, JA, Vallejo-Yepes, P, Restrepo-Giraldo, JN, Torres-Valencia, H, Buitrago-Vanegas, M, Valencia-Rivas, M, et al. Morbidity and mortality in hip surgery patients due to fracture during the COVID-19 pandemic. Injury. (2023) 54:110731. doi: 10.1016/j.injury.2023.04.018
41. Papadimitriou, N, Tsilidis, KK, Orfanos, P, Benetou, V, Ntzani, EE, Soerjomataram, I, et al. Burden of hip fracture using disability-adjusted life-years: a pooled analysis of prospective cohorts in the CHANCES consortium. Lancet Public Health. (2017) 2:e239–46. doi: 10.1016/S2468-2667(17)30046-4
42. Bertram, M, Norman, R, Kemp, L, and Vos, T. Review of the long-term disability associated with hip fractures. Inj Prev. (2011) 17:365–70. doi: 10.1136/ip.2010.029579
43. Ariza-Vega, P, Jiménez-Moleón, JJ, and Kristensen, MT. Change of residence and functional status within three months and one year following hip fracture surgery. Disabil Rehabil. (2014) 36:685–90. doi: 10.3109/09638288.2013.813081
44. McDonough, CM, Harris-Hayes, M, Kristensen, MT, Overgaard, JA, Herring, TB, Kenny, AM, et al. Physical therapy Management of Older Adults with hip Fracture. J Orthop Sports Phys Ther. (2021) 51:CPG1. doi: 10.2519/jospt.2021.0301
45. Klappenbach, R, Lartigue, B, Beauchamp, M, Boietti, B, Santero, M, Bosque, L, et al. Hip fracture registries in low- and middle-income countries: a scoping review. Arch Osteoporos. (2023) 18:51. doi: 10.1007/s11657-023-01241-x
46. Johansen, A, Hall, AJ, Ojeda-Thies, C, Poacher, AT, and Costa, ML. Standardization of global hip fracture audit could facilitate learning, improve quality, and guide evidence-based practice. Bone Joint J. (2023) 105-B:1013–9. doi: 10.1302/0301-620X.105B9.BJJ-2023-0281
47. Werner, M, Macke, C, Gogol, M, Krettek, C, and Liodakis, E. Differences in hip fracture care in Europe: a systematic review of recent annual reports of hip fracture registries. Eur J Trauma Emerg Surg. (2022) 48:1625–38. doi: 10.1007/s00068-021-01797-8
48. Lesnyak, O, Ershova, O, Belova, K, Gladkova, E, Sinitsina, O, Ganert, O, et al. Epidemiology of fracture in the Russian Federation and the development of a FRAX model. Arch Osteoporos. (2012) 7:67–73. doi: 10.1007/s11657-012-0082-3
Keywords: perimenopausal women, falls, hip fractures, orthopedics, global burden of disease
Citation: Wang Z, Chen Z, Zhang C, Liu W, Liu J, Lin W and Wang G (2025) Global trends in fall-induced hip fractures among perimenopausal women 1990 to 2021: results from the global burden of disease study 2021. Front. Public Health. 13:1674535. doi: 10.3389/fpubh.2025.1674535
Edited by:
Bojan Masanovic, University of Montenegro, MontenegroReviewed by:
Kasidid Lawongsa, Phramongkutklao Hospital, ThailandYamei Wang, Radius Health Inc., United States
Copyright © 2025 Wang, Chen, Zhang, Liu, Liu, Lin and Wang. This is an open-access article distributed under the terms of the Creative Commons Attribution License (CC BY). The use, distribution or reproduction in other forums is permitted, provided the original author(s) and the copyright owner(s) are credited and that the original publication in this journal is cited, in accordance with accepted academic practice. No use, distribution or reproduction is permitted which does not comply with these terms.
*Correspondence: Guanglin Wang, d2dsZnJhbmtAd2Noc2N1LmNu; Wei Lin, bGlud2VpQHNjdS5lZHUuY24=