 Jing Yan
 Qiujun Qin1
- 1Shanghai Health Development Research Center (Shanghai Medical Information Center), Shanghai, China
- 2School of Public Health, Fudan University, Shanghai, China
- 3Financial Management Affairs Center of Shanghai Municipal Health Commission, Shanghai, China
Background: As one of the most severe clinical manifestations of osteoporosis, osteoporotic hip fractures often require surgical treatment and result in high medical costs. The hospitalization expenses for patients with osteoporotic hip fractures in China have been on the rise; however, there are few reports on the structural variations in hospitalization costs for these patients and the correlation between total and individual expenses. This research aims to analyze the structure of hospitalization costs and their changes over an extended period in Shanghai, China, and to investigate the impact of the national volume-based procurement (NVBP) policy on costs associated with osteoporotic hip fractures.
Methods: Data were obtained from the Shanghai Health Statistics Center, which includes hospitalization records for patients at all medical institutions in Shanghai from January 2017 to December 2022. Structural variation analysis was utilized to assess the shifts in yearly hospitalization cost composition, while new gray correlation analysis was employed to explore the degree of association between individual and total costs across both overall and various levels of hospitals. Additionally, we evaluated the effects of the NVBP on total and individual hospitalization costs using interrupted time series analysis.
Results: While there was a decline in 2022, medical consumable costs accounted for over 59% of total inpatient costs for osteoporotic hip fractures and consistently demonstrated the highest correlation with total hospitalization costs in Shanghai from 2017 to 2021. Drug costs not only had the highest contribution rate to overall inpatient expenses during the years 2017–2018 (44.22%) and 2020–2021 (36.76%) but also held the top position in the contribution rate of structural variation (CRSV) from 2017 to 2022 (45.77%). The stratification results at the hospital level indicated that drug costs in tertiary and secondary hospitals declined over 6 years, while primary hospitals only saw reductions in a few years. Furthermore, medical consumable costs for tertiary and secondary hospitals decreased in 2021–2022, with CRSVs of 23.36 and 37.91%; however, primary hospitals had higher medical consumable costs during this period. After the NVBP policy was implemented, total hospitalization costs significantly decreased by 5,022.088 yuan (p < 0.001). Additionally, hospitalization costs exhibited a significant downward trend over time, decreasing by 596.114 yuan after the intervention (p < 0.001). Medical consumable costs also exhibited a declining pattern regarding both immediate effects and long-term patterns after the reform, with an average decrease of 290.448 yuan (p < 0.001).
Conclusion: Although the medical consumable costs related to osteoporotic hip fractures made up the largest portion of total expenditures for inpatients, their share declined due to the implementation of the NVBP. Despite the significant structural variation in drug costs, they still represented the second-largest part of total hospitalization expenditures. Future policy should focus on addressing the rising hospitalization costs of osteoporotic hip fractures, particularly those associated with medical consumables and drugs. Besides, additional regulations should be established based on the cost structures of medical institutions at various levels.
1 Introduction
Osteoporosis is a systemic bone disease marked by low bone mass, deterioration of the bone microstructure, increased bone fragility, and increased risk of fractures (1, 2). In 2019, osteoporosis was predicted to affect 25.5 million women and 6.5 million men in the European Union, including Switzerland and the United Kingdom (3). An epidemiological study conducted in China shows that the overall osteoporosis prevalence in women aged 40 and older is 20.6%, compared to 5.0% in men within the same age group (4). Additionally, postmenopausal women and men aged 50 and older exhibit higher osteoporosis rates, at 32.1% and 6.9%, respectively (4). Osteoporotic fracture is a critical sign of osteoporosis. Half of women and one in five men might suffer from a fragility fracture in their lifetime beyond the age of 50, making osteoporotic fractures a serious public health concern (4). Hip, forearm, humeral, and vertebral fractures are the main osteoporotic fracture sites (5–7). Hip fractures are regarded as a nation’s indicator of osteoporosis and a helpful proxy for calculating the global osteoporosis burden (8). The primary cause of hip fractures is falls, which is associated with low bone density (9, 10). Hip fractures are among the most serious osteoporotic fractures; they are painful and almost always require surgery and hospitalization (11, 12). In the first year following a hip fracture, up to 20% of patients die, mainly due to severe underlying medical issues, and fewer than half of the survivors return to their pre-hip fracture level of function (12).
Osteoporotic hip fractures have the highest hospitalization costs compared to vertebral and wrist fractures, imposing considerable clinical and financial strains on the healthcare system (13). A study from Canada found that, 5 years after a hip fracture, healthcare costs for patients remained higher than before the fracture, with median costs of $12,670 for women and $7,933 for men (14). Between 2014 and 2020, the overall cost of hospitalization in Ireland for hip fractures was approximately €296 million, with the annual cost increasing from around €34 million in 2014 to €44 million in 2020 (15). Hospitalization costs for hip fracture patients in Shanghai increased from 2015 to 2020, with over 90% opting for surgery (16). In China, medical consumables costs make up the largest portion of hospitalization costs for osteoporotic fracture patients, with medicine costs second (17–19). High medical costs can exacerbate healthcare inequalities, influenced by social factors such as income and education levels (20, 21). To tackle the increasing healthcare costs, many countries have implemented price and purchasing policies that mainly focus on establishing reference pricing systems, regulating doctors’ prescribing behaviors, and volume-based pricing and procurement policies (22–24).
In China, several policies have been implemented to manage medical expenses for osteoporotic hip fractures, including the zero-markup drug policy, adjustments to medical services prices, and restrictions on medical consumable markup rates, zero-markup policy for medical consumables, and national volume-based procurement (NVBP) policy (19, 25–33). In 2019, a policy was implemented in Shanghai, China, mandating that public medical institutions sell medical consumables at the current purchase price, without any increase (31). Furthermore, guidance on the development of NVBP and the use of high-value medical consumables was created in 2021 by the Chinese government, and the NVBP for artificial joints was initiated in Shanghai on June 30, 2022 (25, 31). In addition to controlling medical consumable costs, the Chinese government has also introduced a series of cost-control policies regarding drug expenses. The fixed percentage markup drug policy was introduced in Shanghai, China, to eliminate a 10–15% markup on drugs as a transitional measure (19, 26, 27, 29). Following this, the zero mark-up policy on all drugs was fully implemented in 2017, which means drug mark-ups are no longer used to compensate healthcare providers, thereby reducing irrational expenditures.
Previous studies have only reported the overall trend of hospitalization costs for osteoporotic hip fracture patients, but lacked an analysis of the structure of these costs and their variations over different years, which may mask unreasonable increases in certain individual expenses and make it difficult to provide a basis for policy formulation and evaluation (11, 16). Meanwhile, most studies calculated only the proportion of each cost category without examining the degree of association between individual cost categories and total hospitalization costs, making it challenging to reflect the dynamic relationship between these expenses (18, 34). Additionally, earlier research has primarily focused on the medical expenses at tertiary hospitals, leaving a gap in reporting on the healthcare costs of inpatients in primary and secondary hospitals and the changes in their cost structures over an extended period (13, 35, 36). Furthermore, current studies have emphasized analyzing the impact of drug price policies, whereas only a few have utilized interrupted time series to explore the NVBP for medical consumables (19, 27, 29). Therefore, this study analyzed the structure and long-term trends of hospitalization costs for osteoporotic hip fracture inpatients from 2017 to 2022. We used gray correlation analysis to identify key cost components and categorized hospitals by level to examine shifts in cost composition and correlations among hospital types. The study also discussed policy factors influencing these changes and assessed the impact of the NVBP on costs.
2 Methods
2.1 Data source
The study data were obtained from the Shanghai Health Statistics Center, which includes hospitalization records for patients at all medical institutions in Shanghai from 2017 to 2022. The data in this study included gender, age, length of admission, disease code, level of surgery, name of surgery and operation, type of insurance, and cost of hospitalization. Patients with osteoporotic hip fractures were identified based on ICD-10 codes.
2.2 Study population
The inclusion criteria of the study sample were as follows: admission during the follow-up period (2017–2022) with hip fracture diagnostic codes (ICD-10 code: S72). The exclusion criteria were (1) pathologic diagnosis of high-energy injury (such as car accidents, falls from heights, etc.), (2) medical institution level 0, (3) missing information such as age, (4) the number of days between the discharge of the last hip fracture hospitalization and the next admission being less than 180 days, and (5) length of hospitalization less than 1 day. This study ultimately included 82,640 hospitalized patients with osteoporotic hip fractures.
2.3 Outcome measures
The total hospitalization costs included medical consumables (such as disposable medical fees for examinations, surgeries, and treatments), drugs (including antibiotics and other drugs), treatment (covering surgical and non-surgical procedures), diagnosis (encompassing pathology, laboratory, imaging, and clinical diagnosis), comprehensive medical services (consists of general medical services costs general treatment operation fees, nursing fees, and other charges), and other costs (containing rehabilitation, traditional Chinese medicine, blood and blood products fees, and additional charges). The hospitalization costs in this study were adjusted to 2022 constant prices based on the Consumer Price Index for Healthcare in Shanghai.
The classification of surgical level in this study is as follows: first-degree surgery is low-risk, simple operations with minimal technical difficulty; second-degree surgery carries some risk, possess average complexity, and present some technical challenges; third-degree surgery involves high risk, significant complexity, and substantial difficulty, requiring considerable resources; and fourth-degree surgery also has high risk and complexity, extreme difficulty, and often entail substantial ethical considerations (25).
2.4 Statistical analysis
2.4.1 Structural variation analysis
The analysis of the degree of structural variations reflects trends in the internal structure of costs through three indicators: value of structure variation (VSV), degree of structure variation (DSV), and contribution rate of structural variation (CRSV) (37).
VSV is the primary indicator for evaluating the extent and direction of changes in the internal structure of total costs, representing the difference between the beginning and end of an item over a specified period. The formula is as follows:
In the above formula, i represents the cost category, 0 indicates the beginning of a specific period, and 1 marks the end of that period. When VSV > 0, it indicates that the item’s proportion is increasing over time; otherwise, it suggests a decreasing trend.
DSV represents the total values of the changes in the cost structure of each category during a specific time, primarily reflecting the overall variations in cost category throughout that time frame. It is calculated in the following way:
A higher DSV indicates a larger degree of structural change over the period.
CRSV represents the absolute VSV of each cost category as a proportion of the degree of structural change. It measures the relative contribution of the VSV of each cost category to the overall degree of structural variation. The CRSV is calculated as:
The higher the CRSV, the more significant the cost category drives the total cost’s structural variation.
2.4.2 New gray relational analysis
The new gray correlation analysis simplifies the steps in processing dimensionless data using the gray correlation analysis method. It directly calculates the correlation coefficient between each comparison sequence and the reference sequence by employing the absolute value difference, which more intuitively expresses the degree of correlation between the factors. The calculation steps are as follows:
• Step 1: Define the reference series and the comparison series.
Use the hospitalization costs as the reference series , where k = 1–6, representing the years 2017–2022, respectively; use the individual cost category as the comparison series , where i = 1–6, representing medical consumables, drugs, treatment, diagnosis, comprehensive medical services, and other costs, respectively.
• Step 2: Calculate the difference sequence between each comparison sequence and the reference sequence, and find the maximum and minimum absolute values of the differences.
• Step 3: Calculate the correlation coefficient.
• Step 4: Calculate the correlation of individual cost category and rank them.
2.4.3 Interrupted time series analysis
Interrupted time series design controls for the regression trend before the intervention to assess its impact on the series. It compares and tests the immediate level changes in the outcome variable before and after the intervention at the intervention point, as well as the changes in the regression slopes before and after the intervention, thereby evaluating the effectiveness of the intervention (38). This study used segmented linear regression model to regress the periods before and after the intervention. The model formula is as follows:
is the average cost of hospitalization. is a time count variable. The unit of time in this study is half month, from January 2021 to December 2022, a total of 48 time points, with nodes “0, 1, 2……, 48”. refers to the dummy variable of whether the policy occurred, which is recorded as “0” before the intervention and “1” after the intervention, with July 2022 (i.e., time point = 37) as the intervention node; denotes the time count variable after the occurrence of the policy, with “0” denoting the pre-intervention period and “1, 2, 3……, 11” denoting the post-intervention period. is the random error term.
denotes the pre-policy inpatient costs; represents the trend of the expenses before the policy was implemented; denotes the difference between the outcome and the counterfactual outcome when the policy is assumed to have been implemented, representing the immediate effect of the policy; and is the amount of change in slope, indicating the policy implementation’s impact on costs in the long term. All statistical analyses were performed using Stata, version 17. The level of significance was set at p < 0.05.
3 Results
3.1 Basic information of patients with osteoporotic hip fractures during 6 years
This study included 82,640 osteoporotic hip fracture patients in Shanghai: 30,944 men and 51,696 women, mostly over 65 years old. 36.3% of patients were hospitalized for 8–14 days, while merely 5.3% spent 31 days or more. Over half of the patients underwent surgery, most commonly third-degree (46.9%) and fourth-degree (33.6%). Most patients were admitted to grade-A tertiary hospitals (59.9%), then grade-B secondary hospitals (36.2%), with the fewest hospitalized in primary hospitals (3.9%). Besides, 59.9% of patients’ medical costs were covered by the Urban Employee Basic Medical Insurance (UEBMI), whereas only 13.8% were covered by the Urban–Rural Residents Basic Medical Insurance (URRBMI) (Table 1).
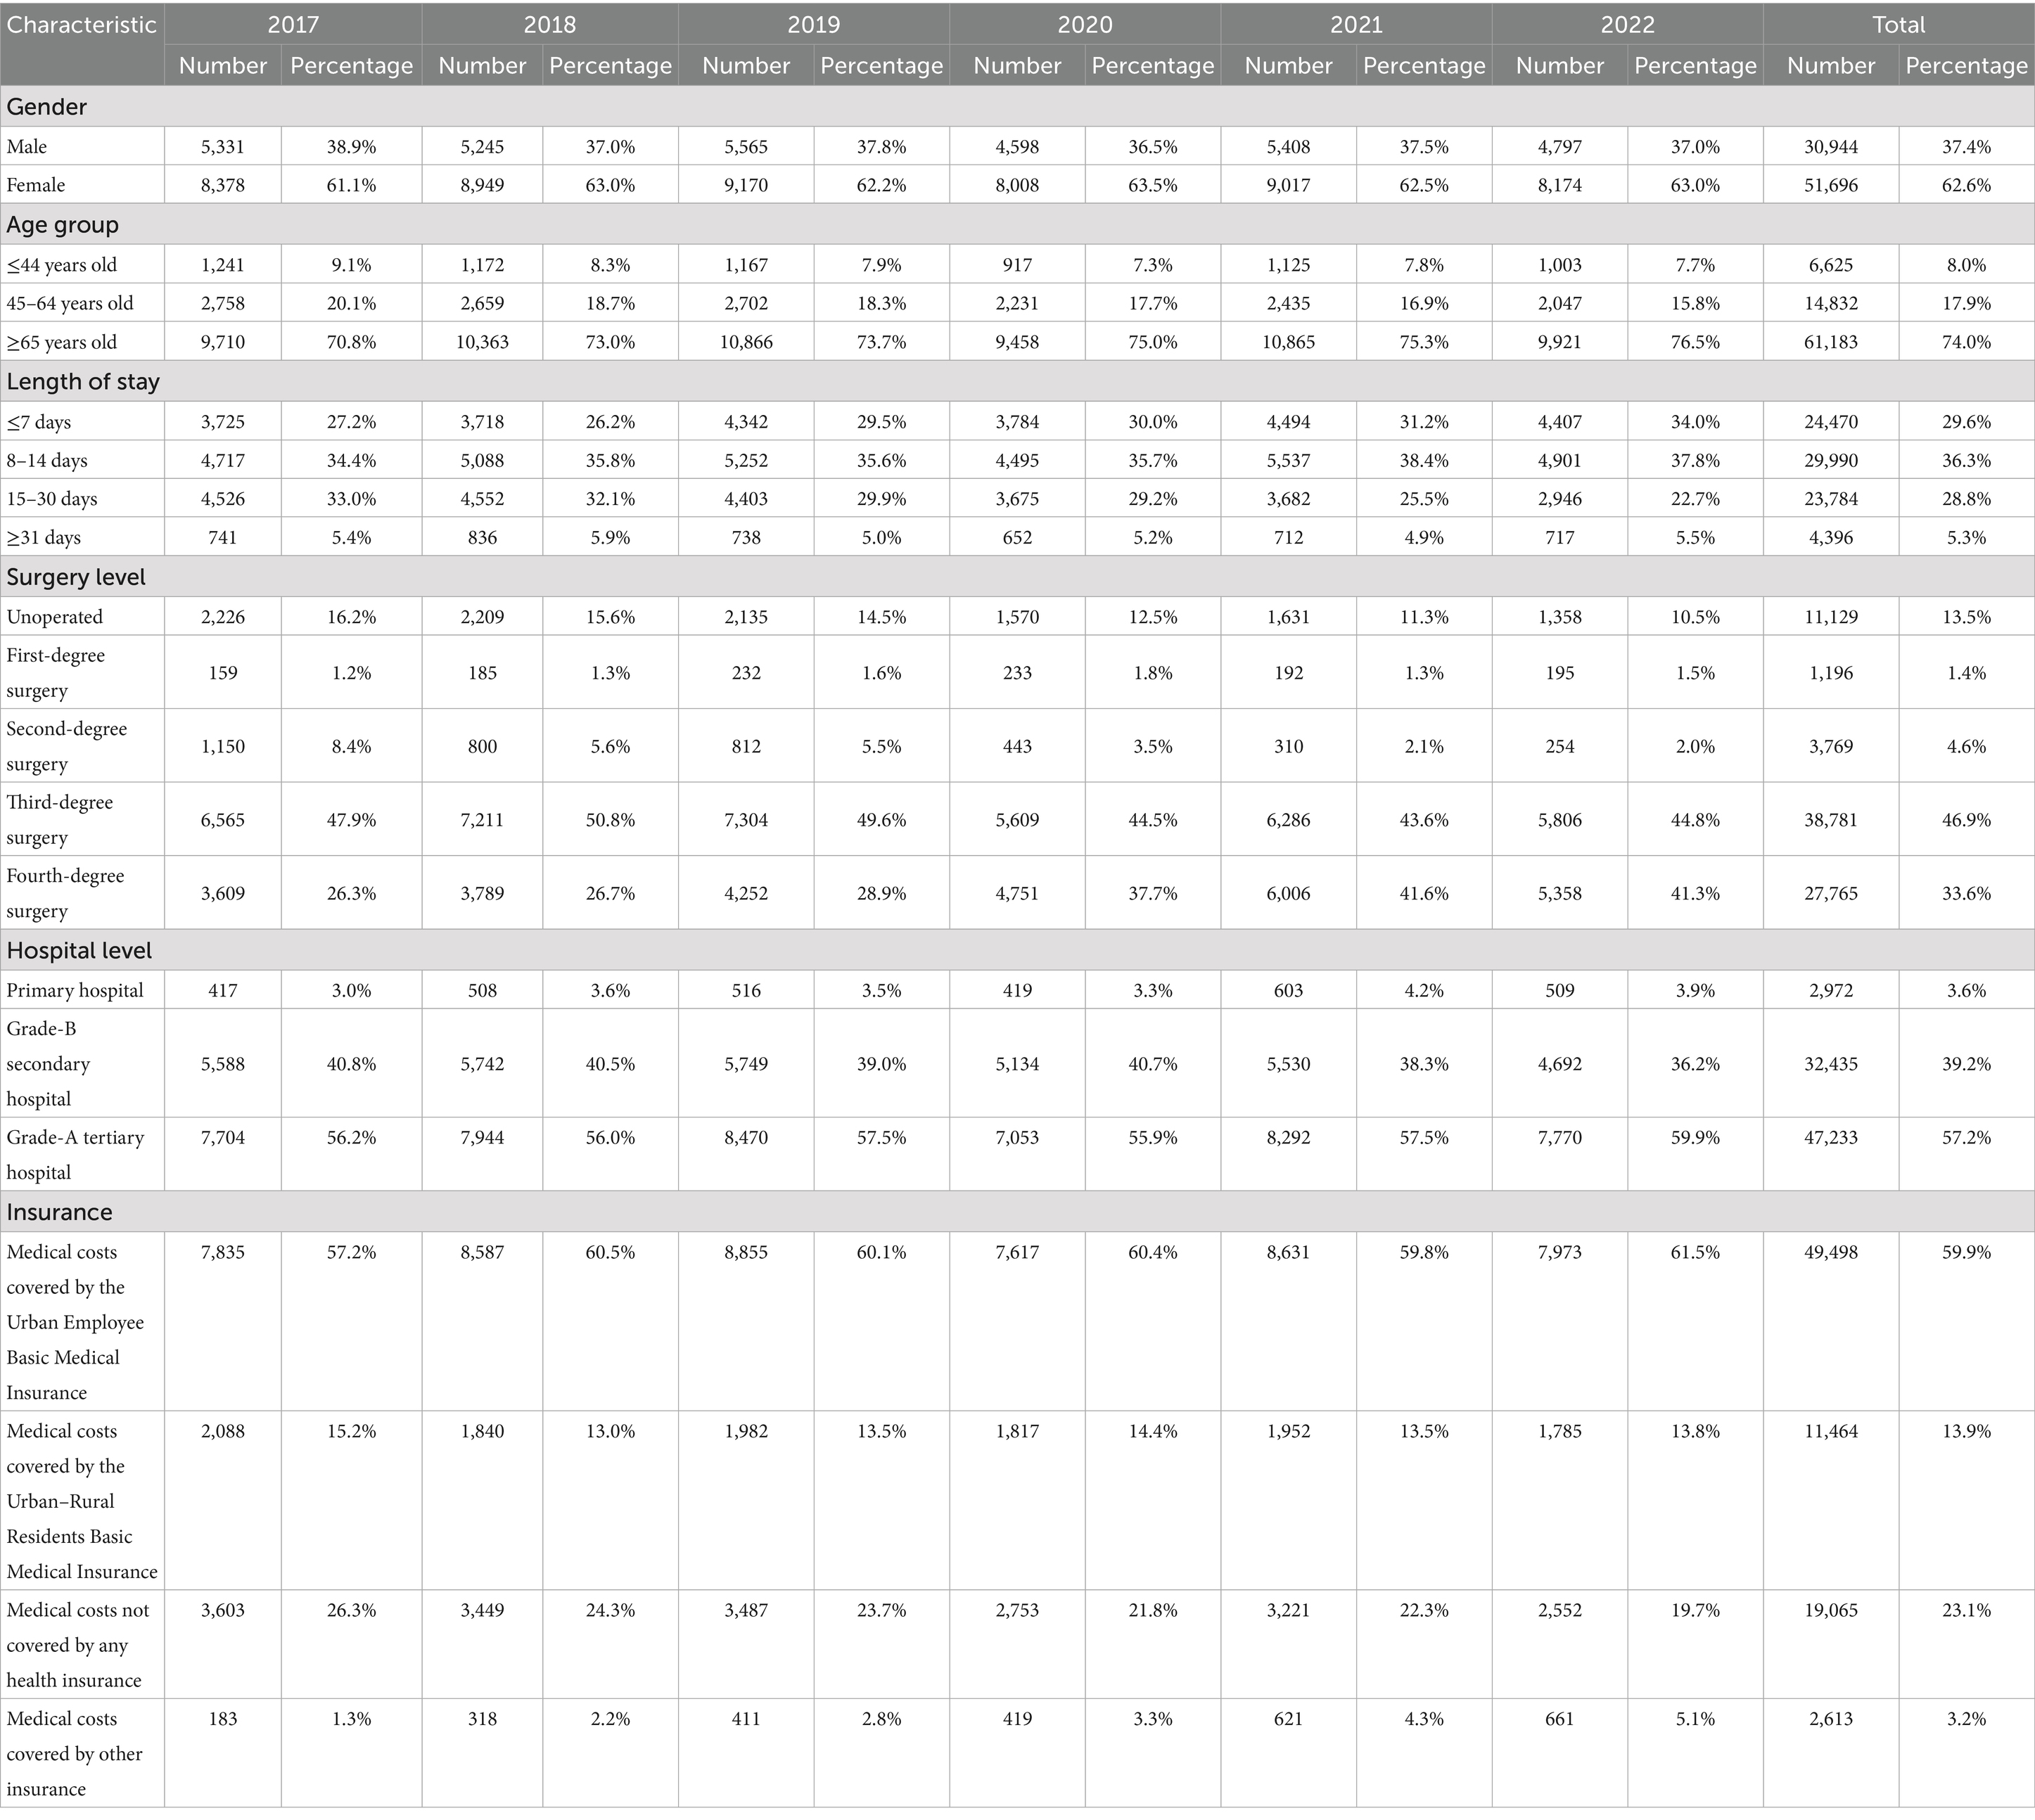
Table 1. Basic information of osteoporotic hip fracture patients in Shanghai within the years 2017–2022.
3.2 Composition of hospitalization costs among patients with osteoporotic hip fractures
Medical consumable costs account for the most significant proportion of osteoporotic hip fracture inpatient costs each year, with the highest being 60.30% and 59.74% in 2021 and 2020, respectively, according to Table 2. Despite a declining tendency in 2022, medical consumable costs remained over 59% of the total expenditures. Between 2017 and 2022, the cost of drugs has shown an overall downward trend, from 14.48% in 2017 to 11.34% in 2022, ranking second. Table 2 and Figure 1 illustrate the composition of hospitalization expenses and their trends over the years, including expenditures of comprehensive medical services, diagnosis, treatment, drug, medical consumable, and other costs.
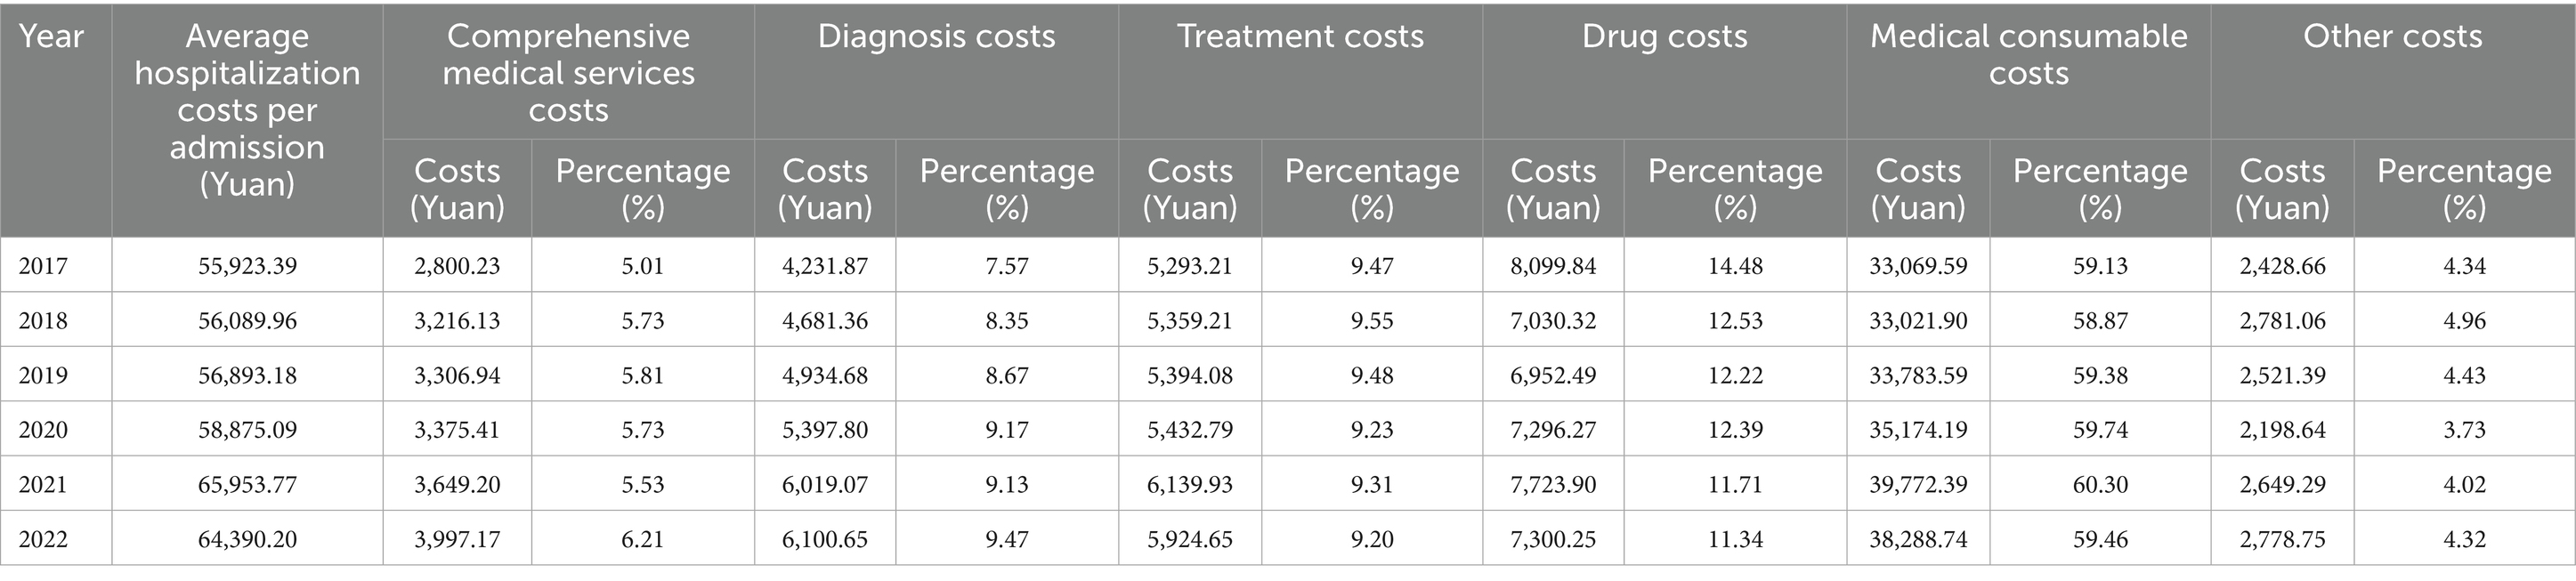
Table 2. Composition of hospitalization costs of patients with osteoporotic hip fractures in Shanghai within the years 2017–2022.
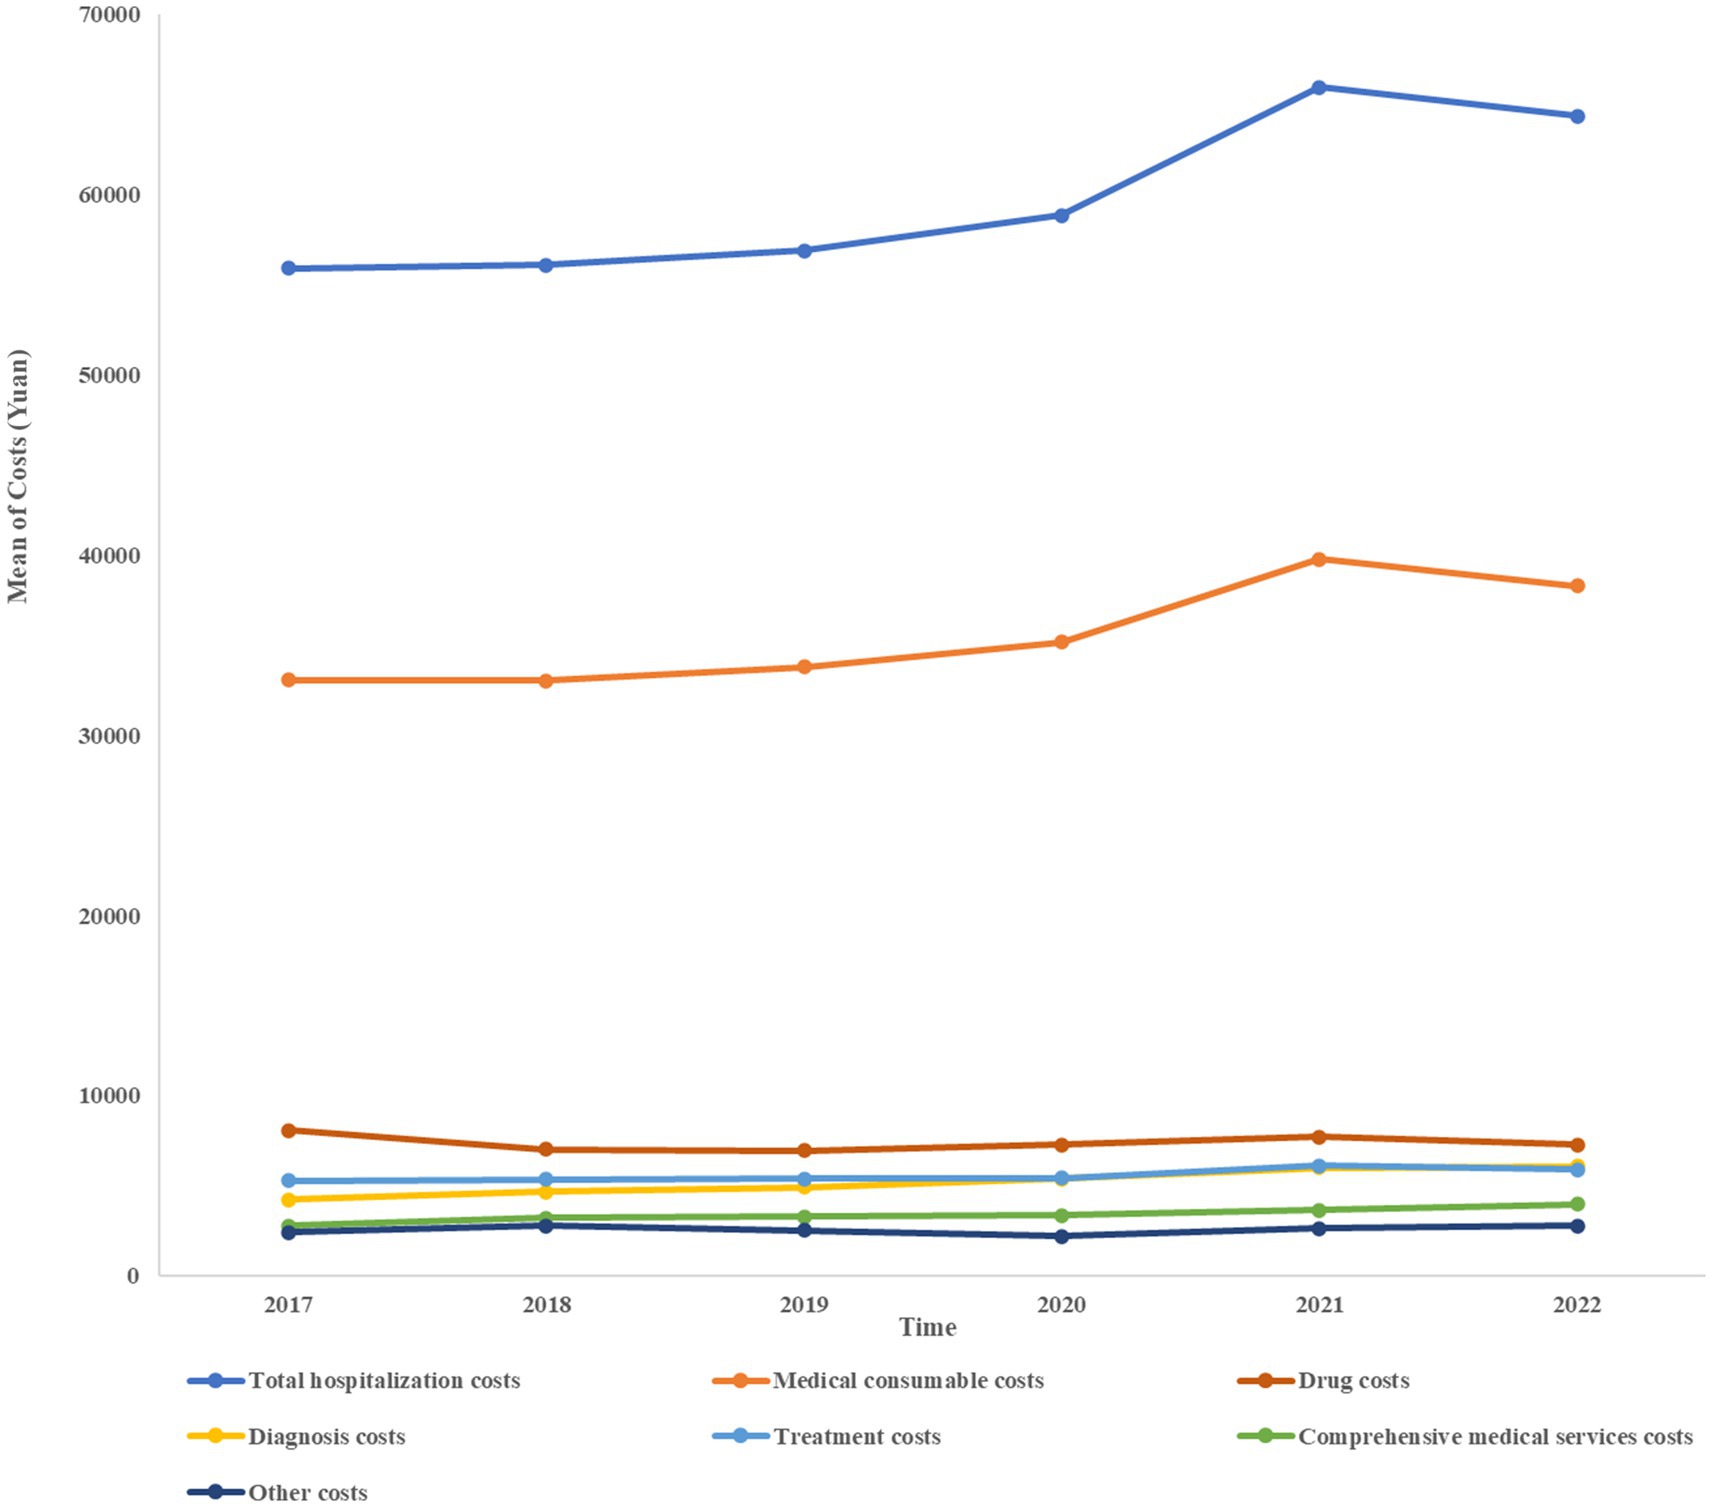
Figure 1. The time trend of the mean costs.
According to the hospital-level stratification results, the share of medical consumable costs was highest in grade-A tertiary hospitals, exceeding 60% in all 6 years. In contrast, primary hospitals had a share of medical consumable costs lower than 30%, while the share of drug costs was over 25%, except in 2022. The proportion of medical consumable costs in grade-B secondary hospitals ranged between grade-A tertiary and primary hospitals, at approximately 57%; meanwhile, drug costs were higher than in grade-A tertiary hospitals but lower than in primary hospitals (Tables 3–5).
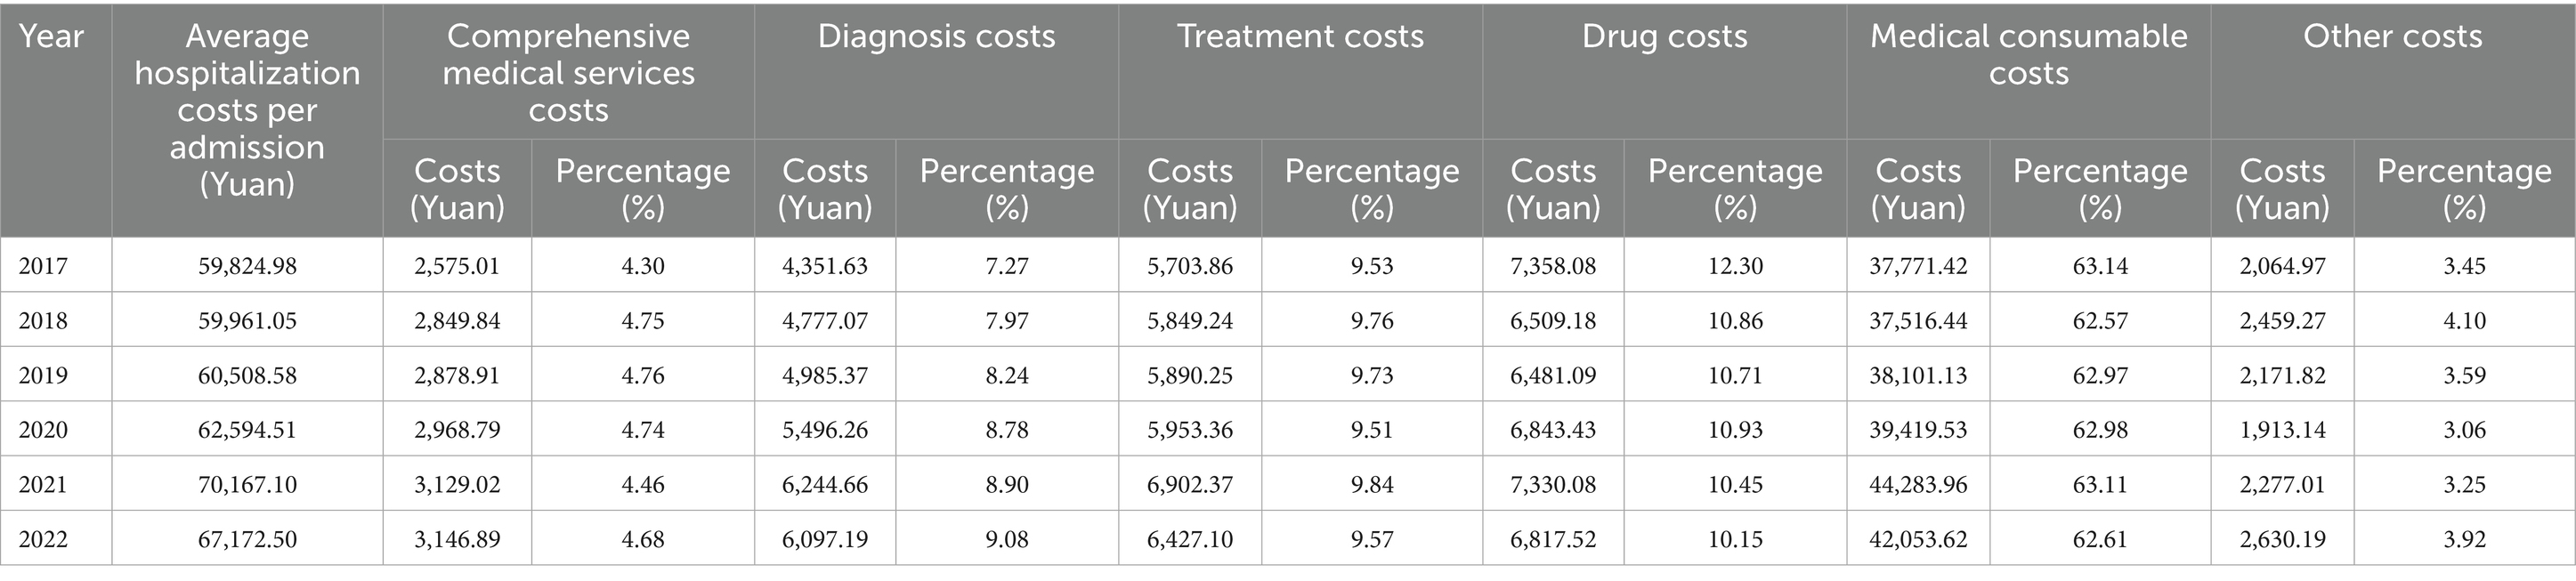
Table 3. Composition of hospitalization costs of patients with osteoporotic hip fractures in Shanghai grade-A tertiary hospitals within the years 2017–2022.
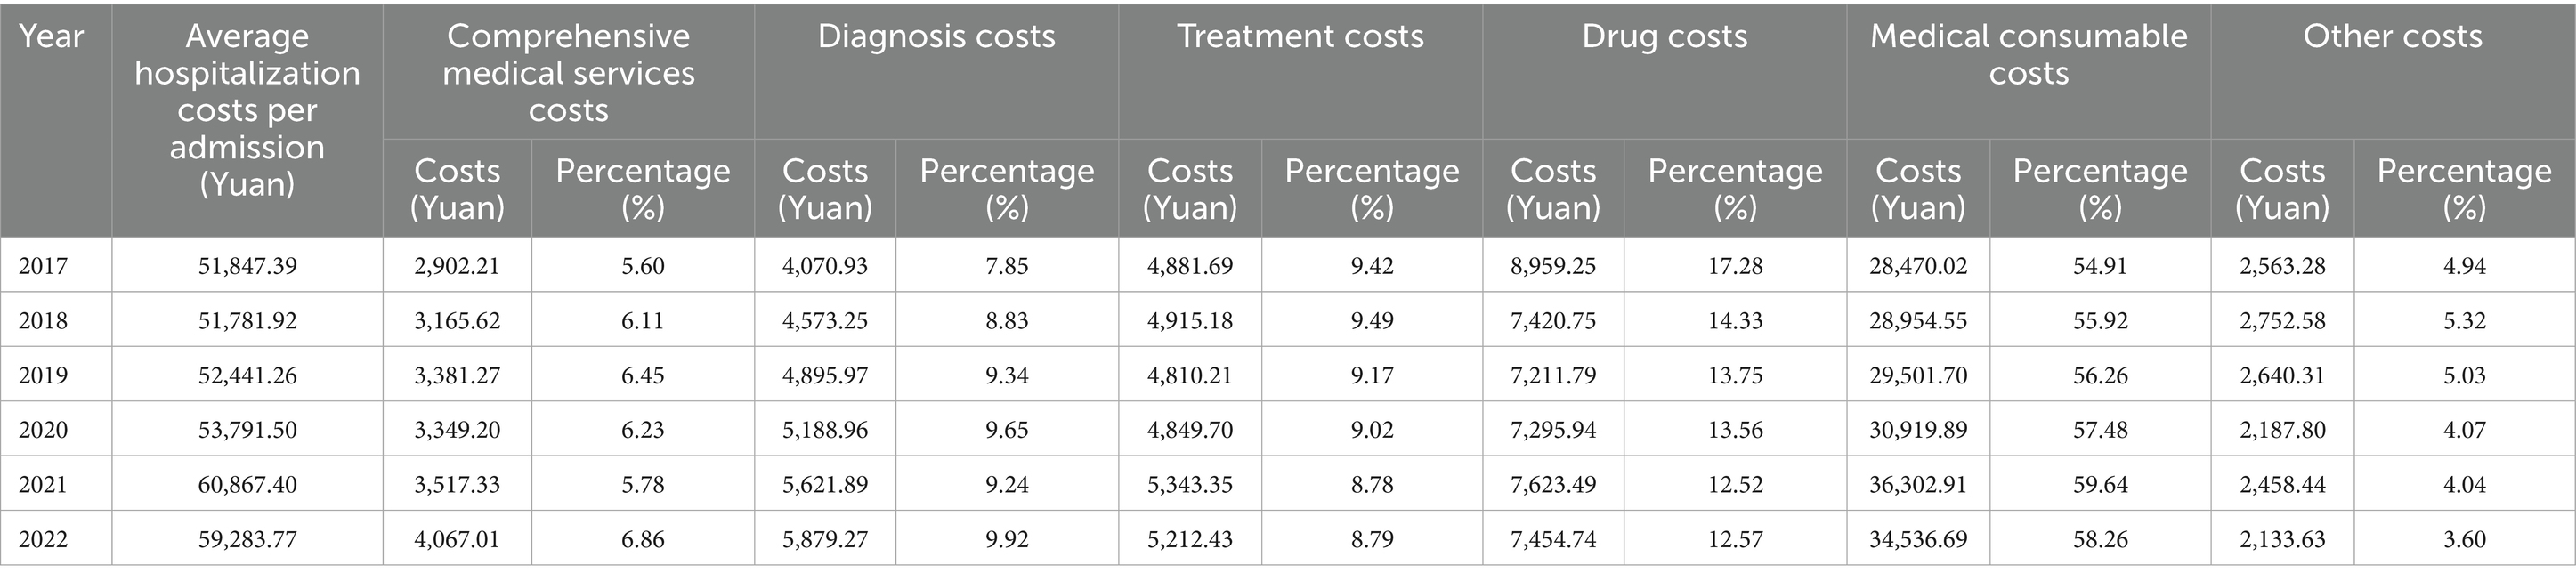
Table 4. Composition of hospitalization costs of patients with osteoporotic hip fractures in Shanghai grade-B secondary hospitals within the years 2017–2022.
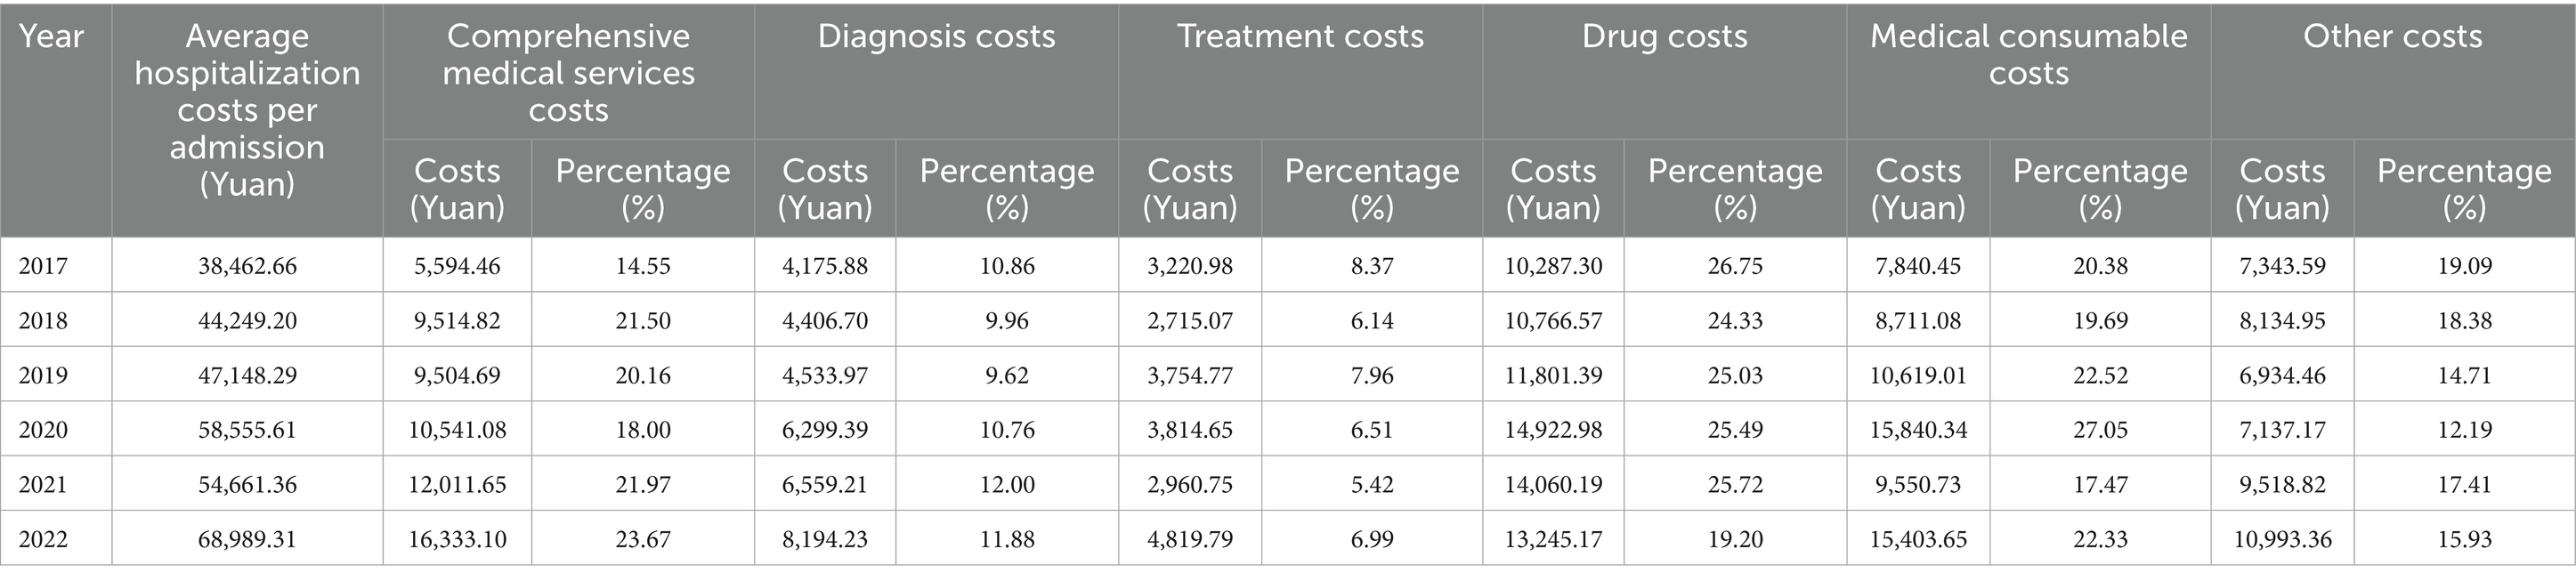
Table 5. Composition of hospitalization costs of patients with osteoporotic hip fractures in Shanghai primary hospitals within the years 2017–2022.
3.3 Structural variations of hospitalization costs among patients with osteoporotic hip fractures
The overall trend of drug costs as a proportion of total hospitalization costs has declined over the 6-year period for the VSV, except for 2019–2020. The drug costs had not only the highest contribution rate to overall inpatient expenses during the years 2017–2018 (44.22%) and 2020–2021 (36.76%), but it also ranked first in the CRSV from 2017 to 2022 (45.77%). Furthermore, although the share of medical consumable costs has been increasing for most years, it decreased in 2017–2018 and 2021–2022, with VSV of −0.26 and −0.84, respectively. While the reduction in medical consumable costs accounted for only 5.9% of the changes in the structure of inpatient costs during 2017–2018, their share showed the highest decline in the CRSV for 2021–2022 (31.82%) (Table 6).
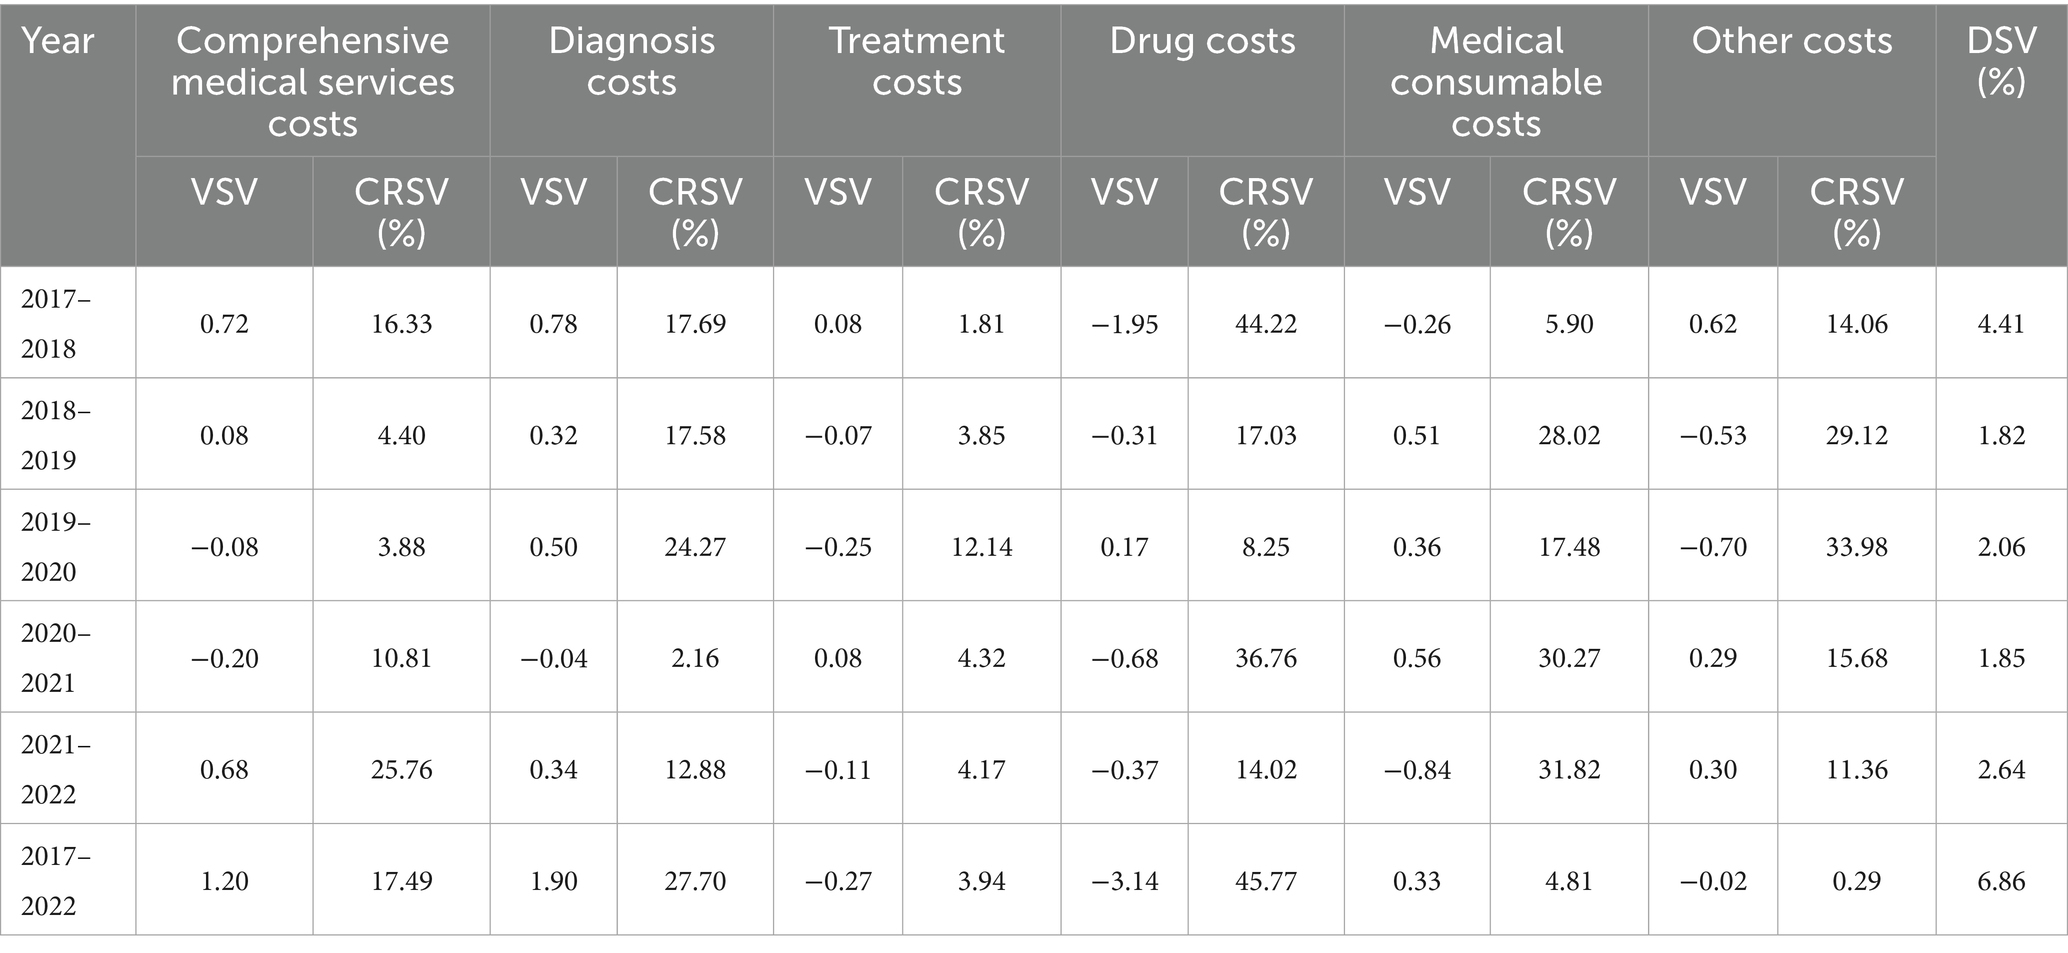
Table 6. The value, degree, and contribution rate of structure variation of hospitalization costs within the years 2017–2022.
The stratification results at the hospital level indicated that, while the share of drug expenses in tertiary and secondary hospitals exhibited an overall decreasing trend over the 6 years, primary hospitals reflected a decrease in only a few years. Additionally, medical consumable costs for both tertiary and secondary hospitals decreased in 2021–2022, with CRSVs of 23.36% and 37.91%, respectively; however, primary hospitals presented higher medical consumable costs during that period (Tables 7–9).
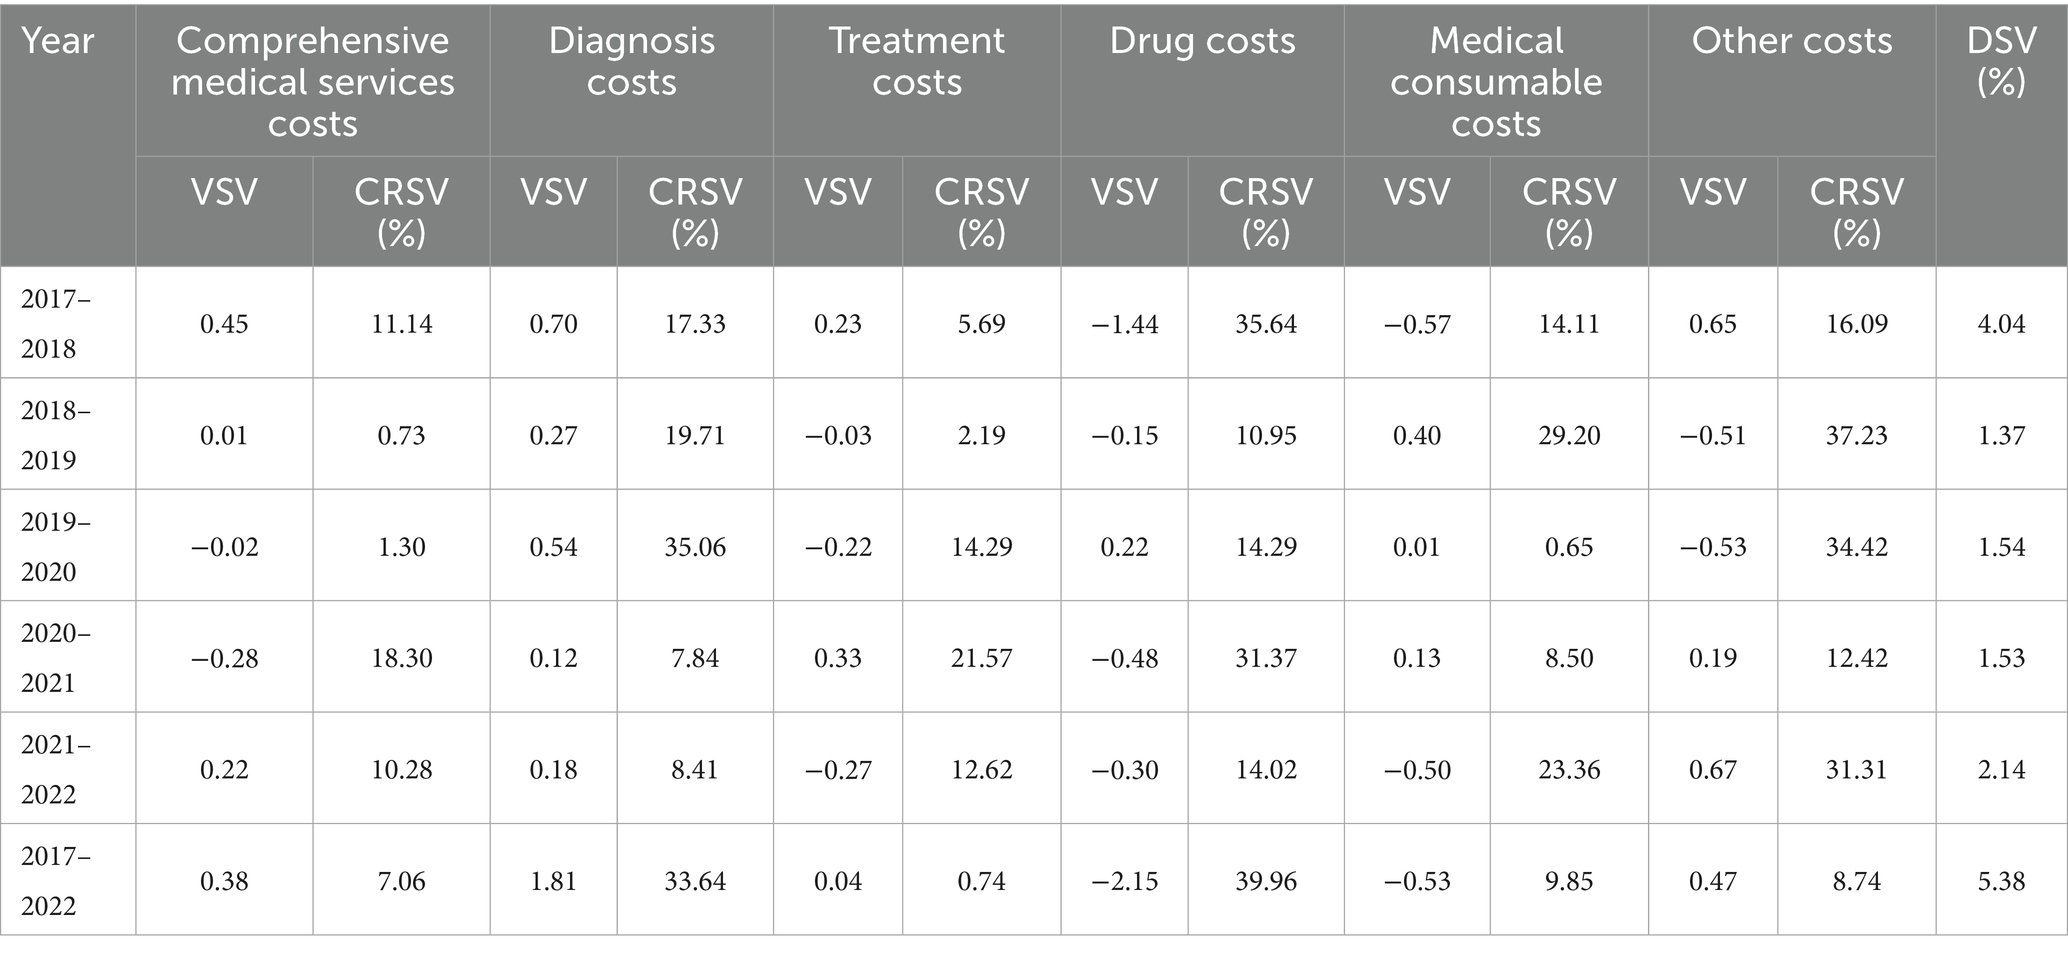
Table 7. The value, degree, and contribution rate of structure variation of hospitalization costs in Shanghai grade-A tertiary hospitals within the years 2017–2022.
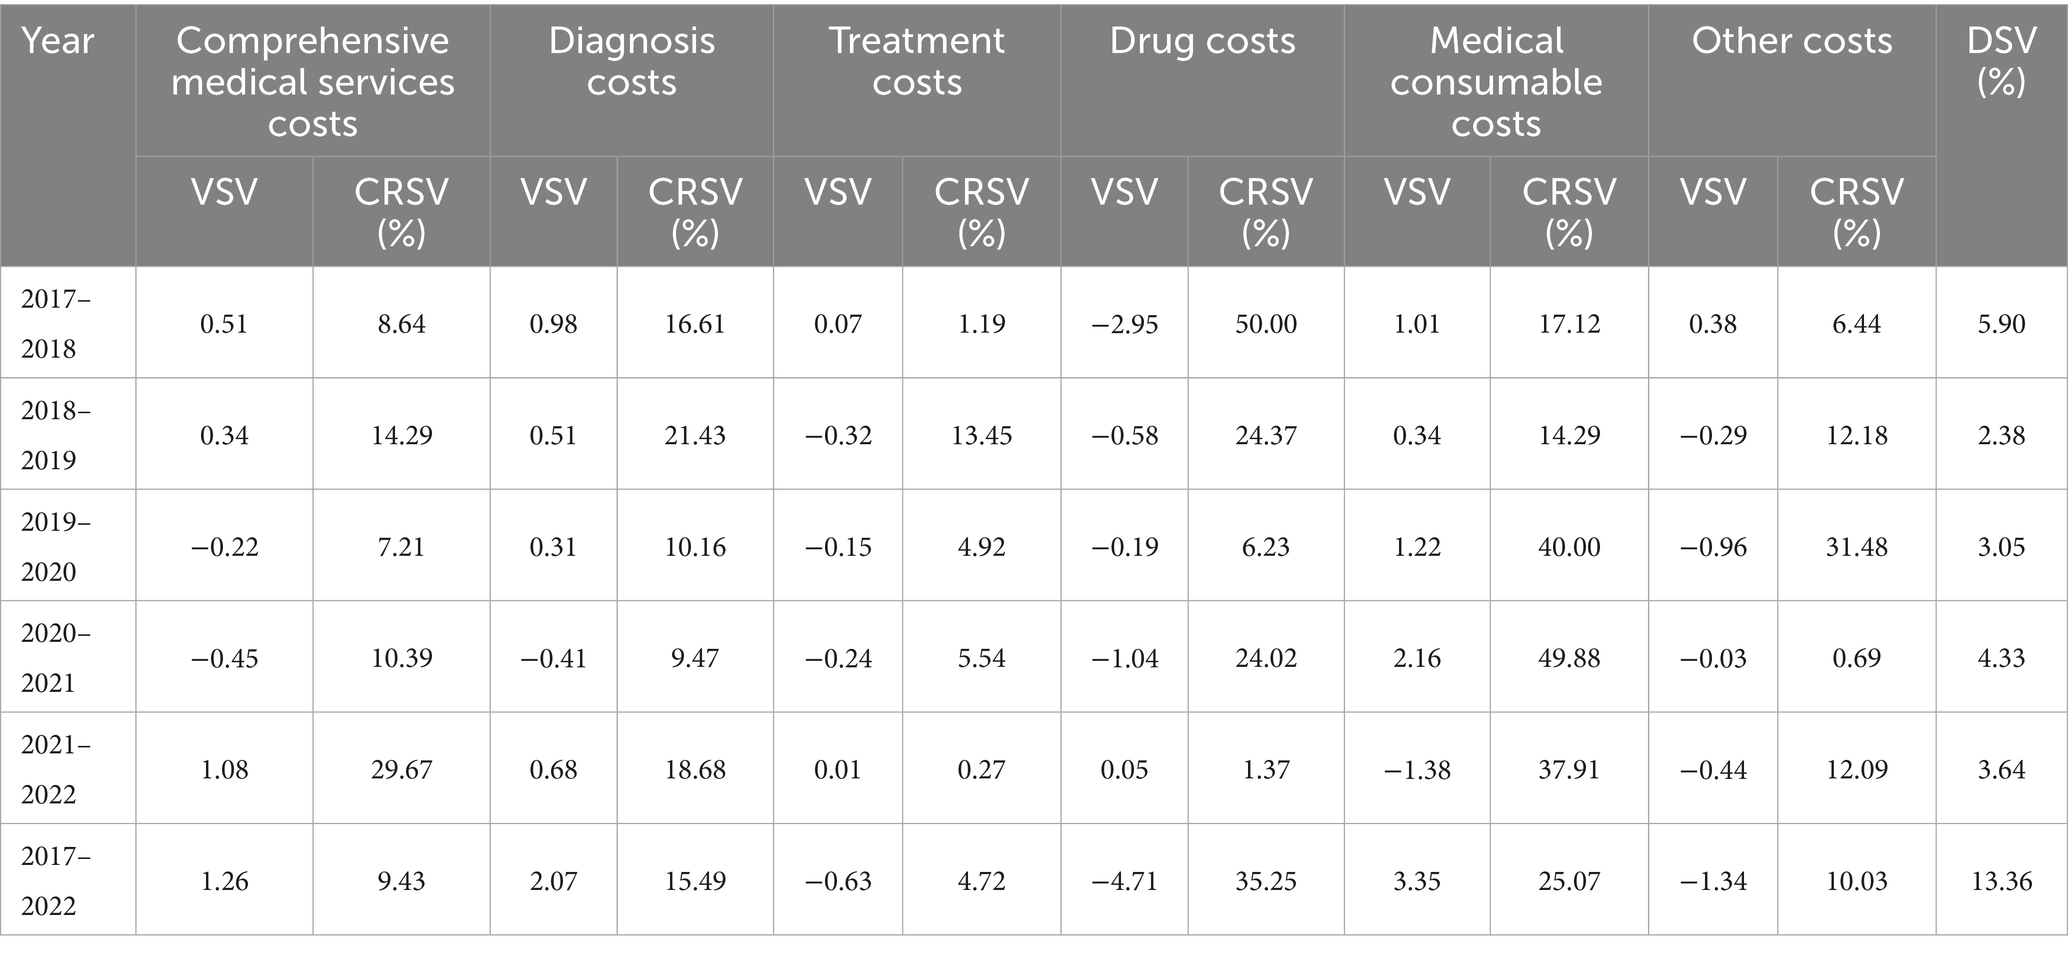
Table 8. The value, degree, and contribution rate of structure variation of hospitalization costs in Shanghai grade-B secondary hospitals within the years 2017–2022.
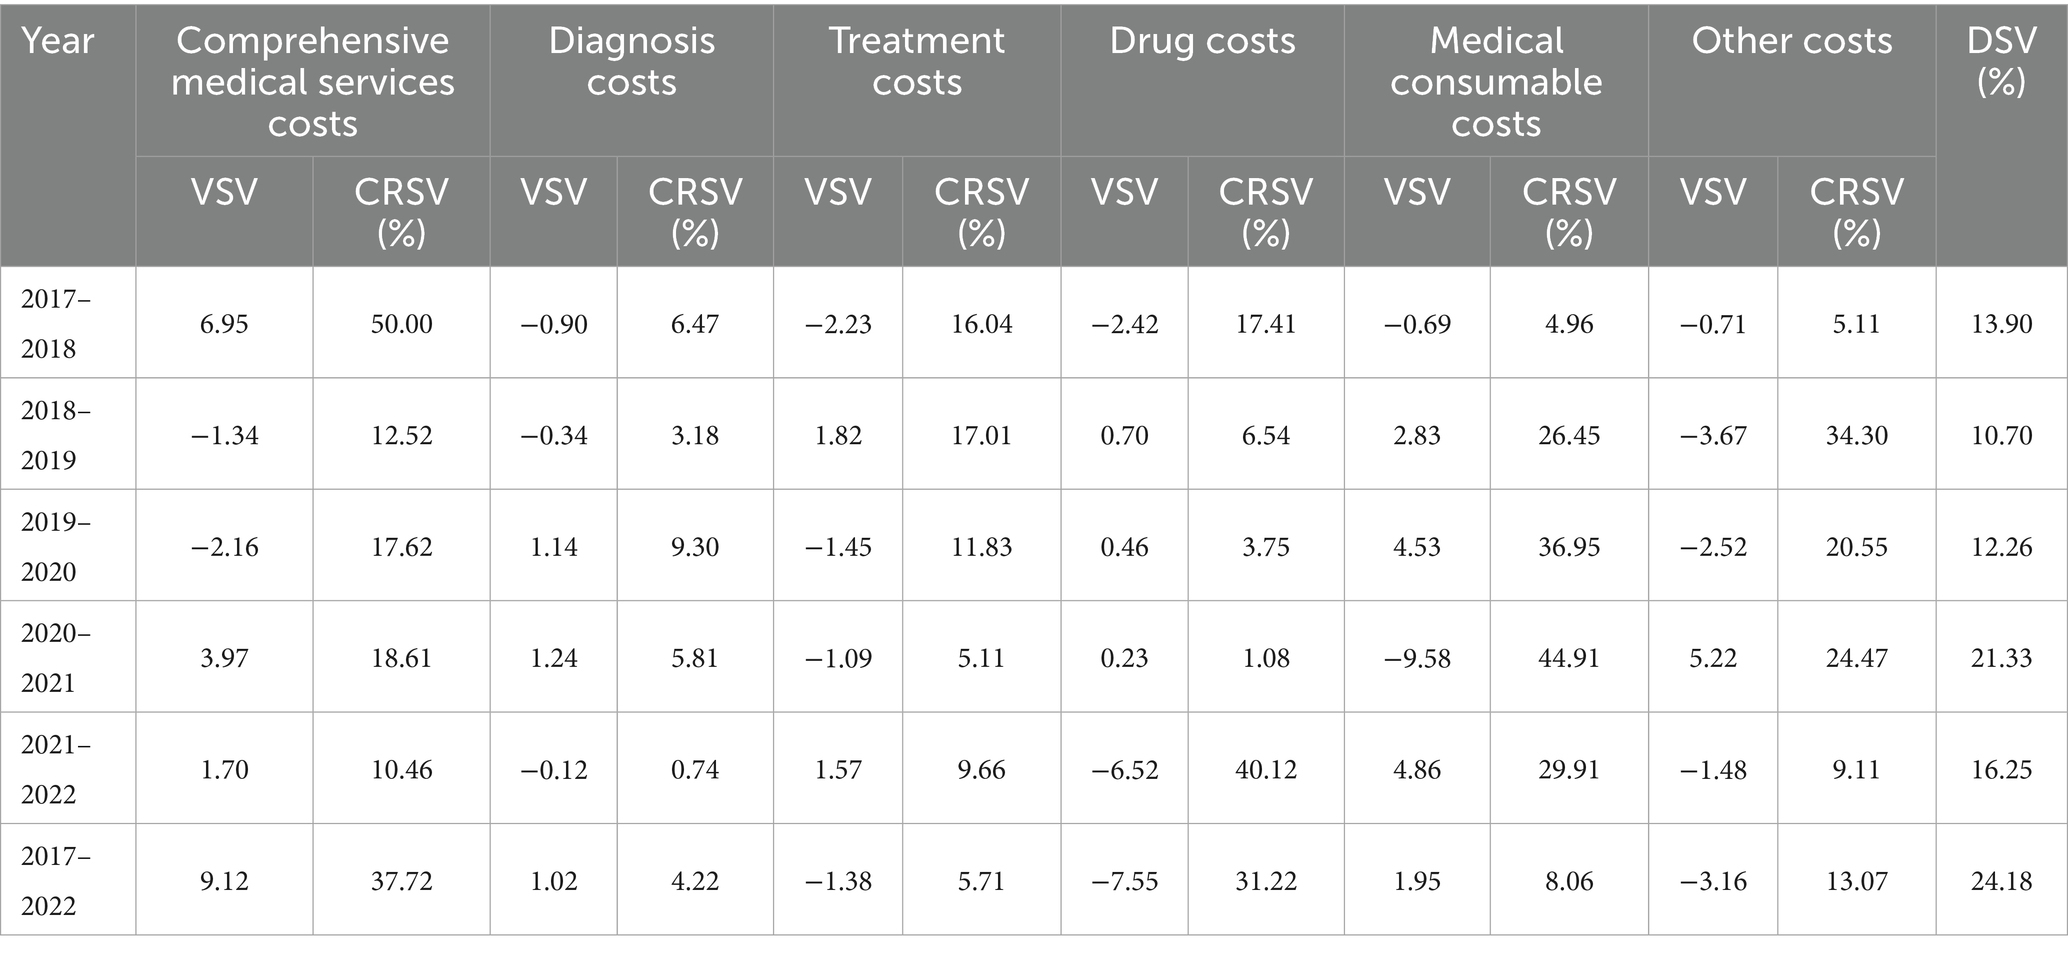
Table 9. The value, degree, and contribution rate of structure variation of hospitalization costs in Shanghai primary hospitals within the years 2017–2022.
According to DSV, 2017–2018 marked the year with the most significant structural change in individual hospitalization costs, which applied to overall costs and the stratification of tertiary and secondary hospital costs (Tables 6–8). During this period, drug and medical consumable costs decreased, while other expenses, such as diagnosis costs, remained elevated. However, for secondary hospitals, the percentage of medical consumable costs showed an elevated trend in 2017–2018, despite a decline in drug costs. The 2021–2022 and 2019–2020 presented the second and third highest DSV for overall costs, respectively (Table 6).
3.4 New gray relational analysis of correlation between total and individual hospitalization costs
From 2017 to 2022, medical consumable costs consistently showed the highest correlation with total hospitalization costs, averaging a correlation of 0.977, which is nearly 1. The degree of correlation between drug costs and total hospitalization costs has declined over time, but it remained second in the correlation rankings. Treatment costs, on the other hand, were the third most correlated, only slightly above diagnosis costs (Table 10).
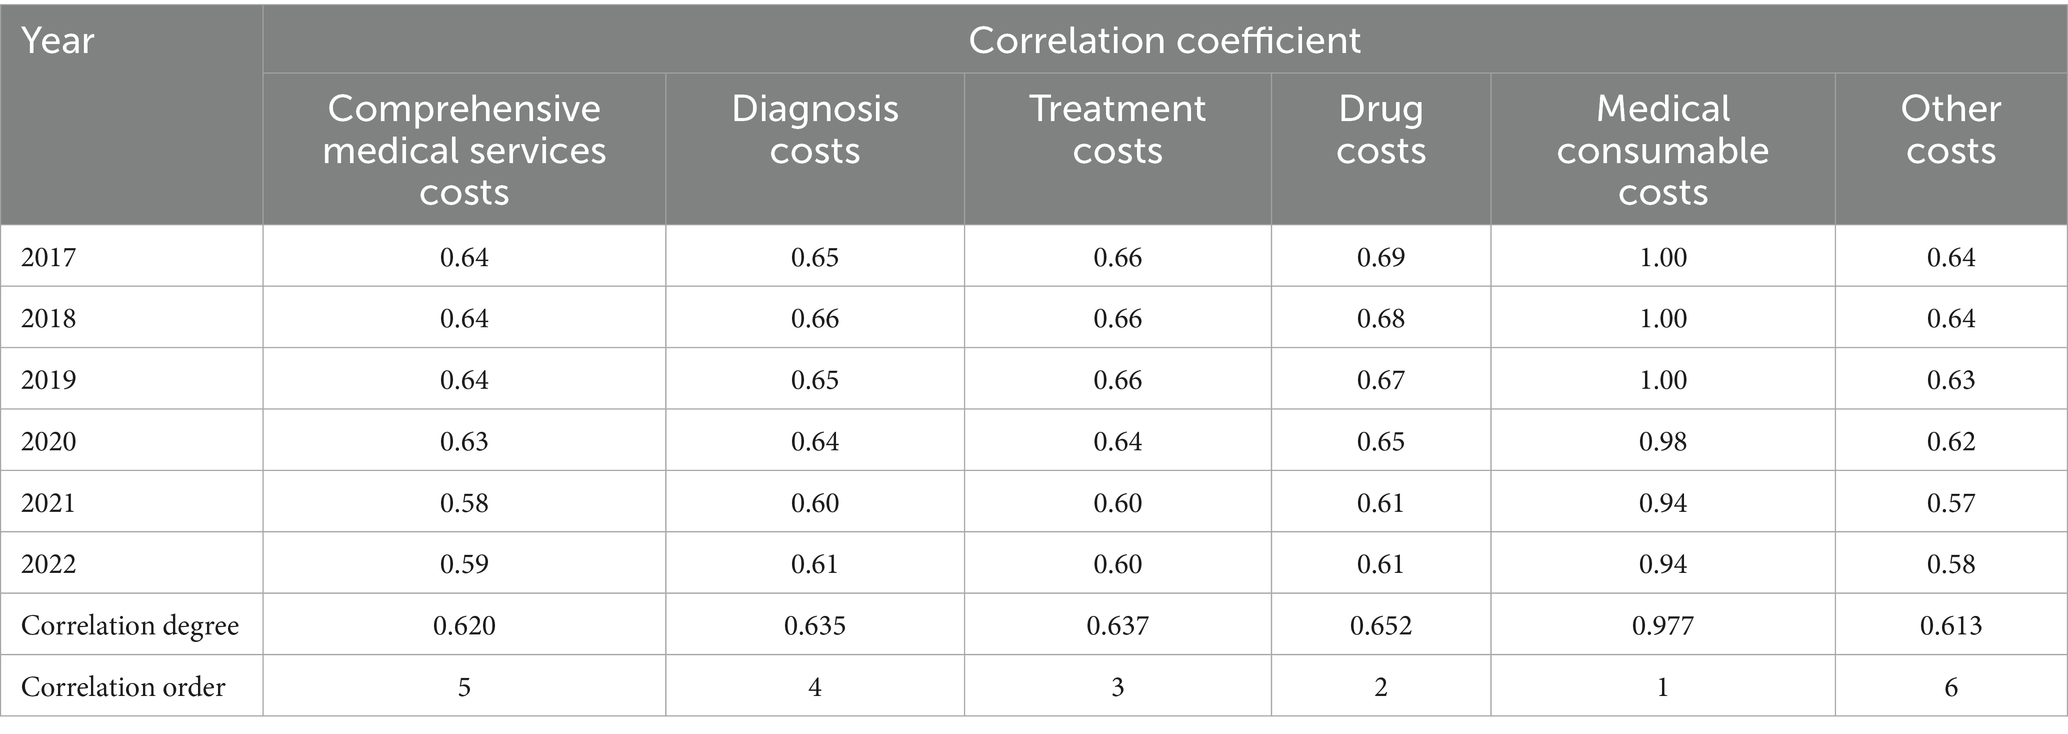
Table 10. The coefficient, degree and order of correlation between total and individual hospitalization costs within the years 2017–2022.
Based on the subgroup analysis at the hospital level, medical consumable costs topped the correlation order for tertiary and secondary hospitals, which was in line with the overall analysis; however, diagnosis costs replaced treatment costs as third among secondary hospitals. Notably, the drug costs, rather than medical consumable costs, had the highest correlation degree with total hospitalization costs in primary hospitals; meanwhile, the ranking of comprehensive medical services costs rose, while the ranking of diagnosis and treatment costs decreased (Tables 11–13).

Table 11. The coefficient, degree and order of correlation between total and individual hospitalization costs in Shanghai grade-A tertiary hospitals within the years 2017–2022.
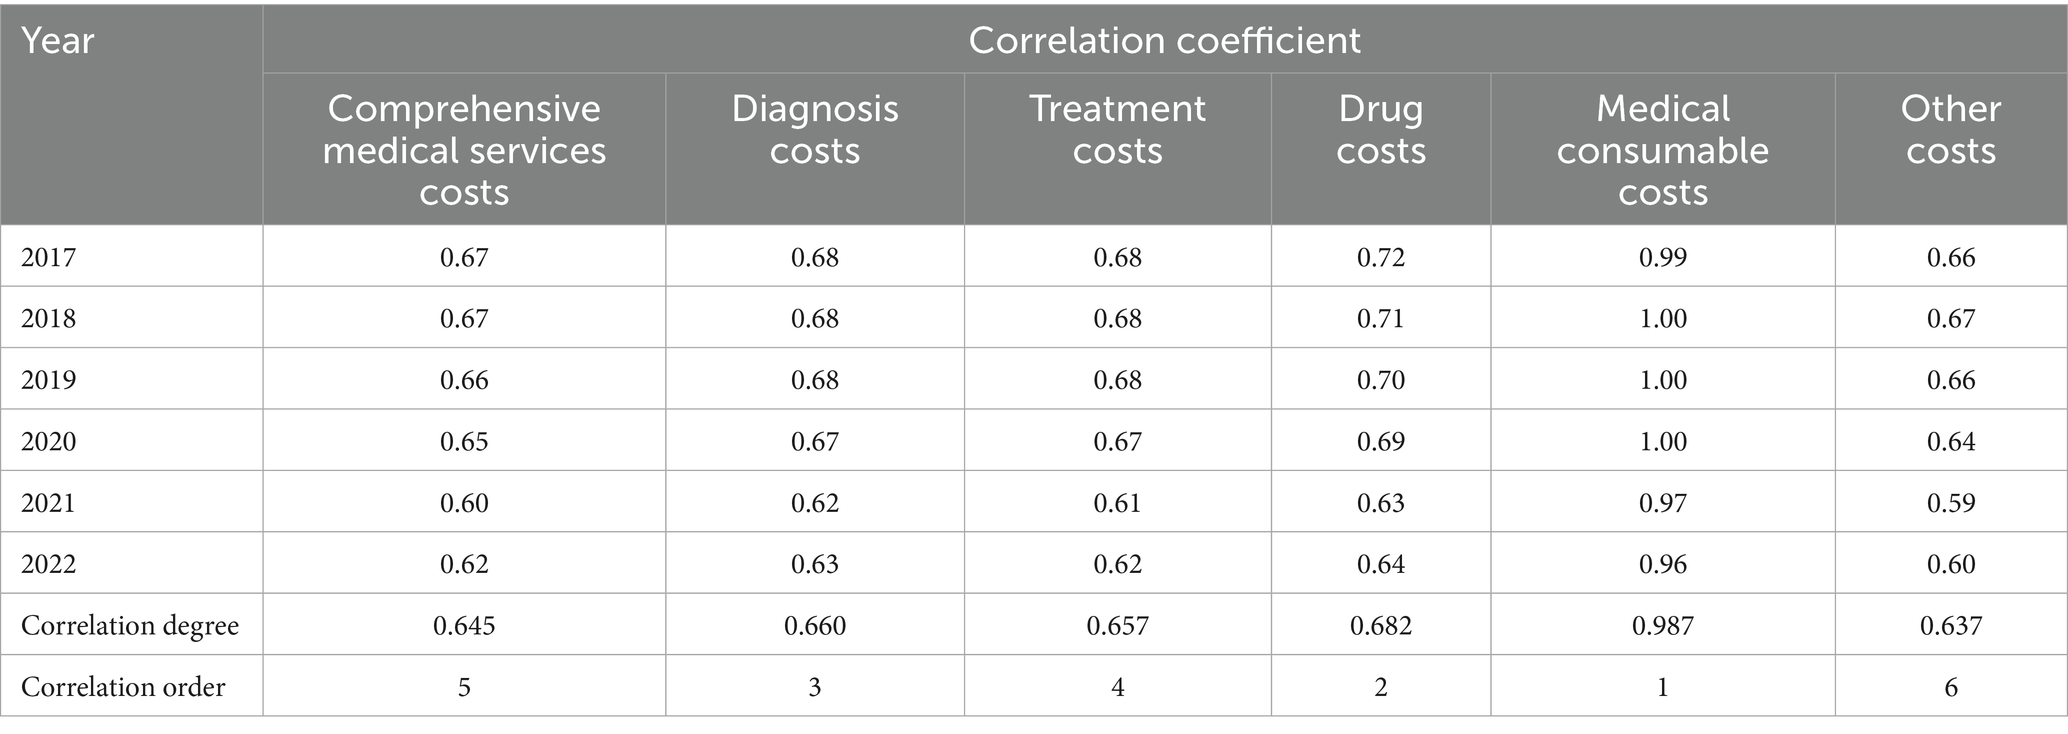
Table 12. The coefficient, degree and order of correlation between total and individual hospitalization costs in Shanghai grade-B secondary hospitals within the years 2017–2022.

Table 13. The coefficient, degree and order of correlation between total and individual hospitalization costs in Shanghai primary hospitals within the years 2017–2022.
3.5 The impact of the national centralized volume-based procurement policy on overall costs and their structure
The effects of the policy on total hospitalization costs and their various components were shown in Table 14 and Figure 2. Before the reform, the mean total hospitalization and medical consumable costs increased by 81.075 and 94.095 yuan (p < 0.05), respectively. After the NVBP policy was implemented, total hospitalization costs significantly decreased by 5,022.088 yuan (p < 0.001). Additionally, compared to the trend before the intervention, total hospitalization costs exhibited a significant downward trend over time, decreasing by 596.114 yuan after the intervention (p < 0.001). Similarly, medical consumable costs also exhibited a declining pattern regarding both immediate effects and long-term patterns after the reform, with an average decrease of 290.448 yuan (p < 0.001).
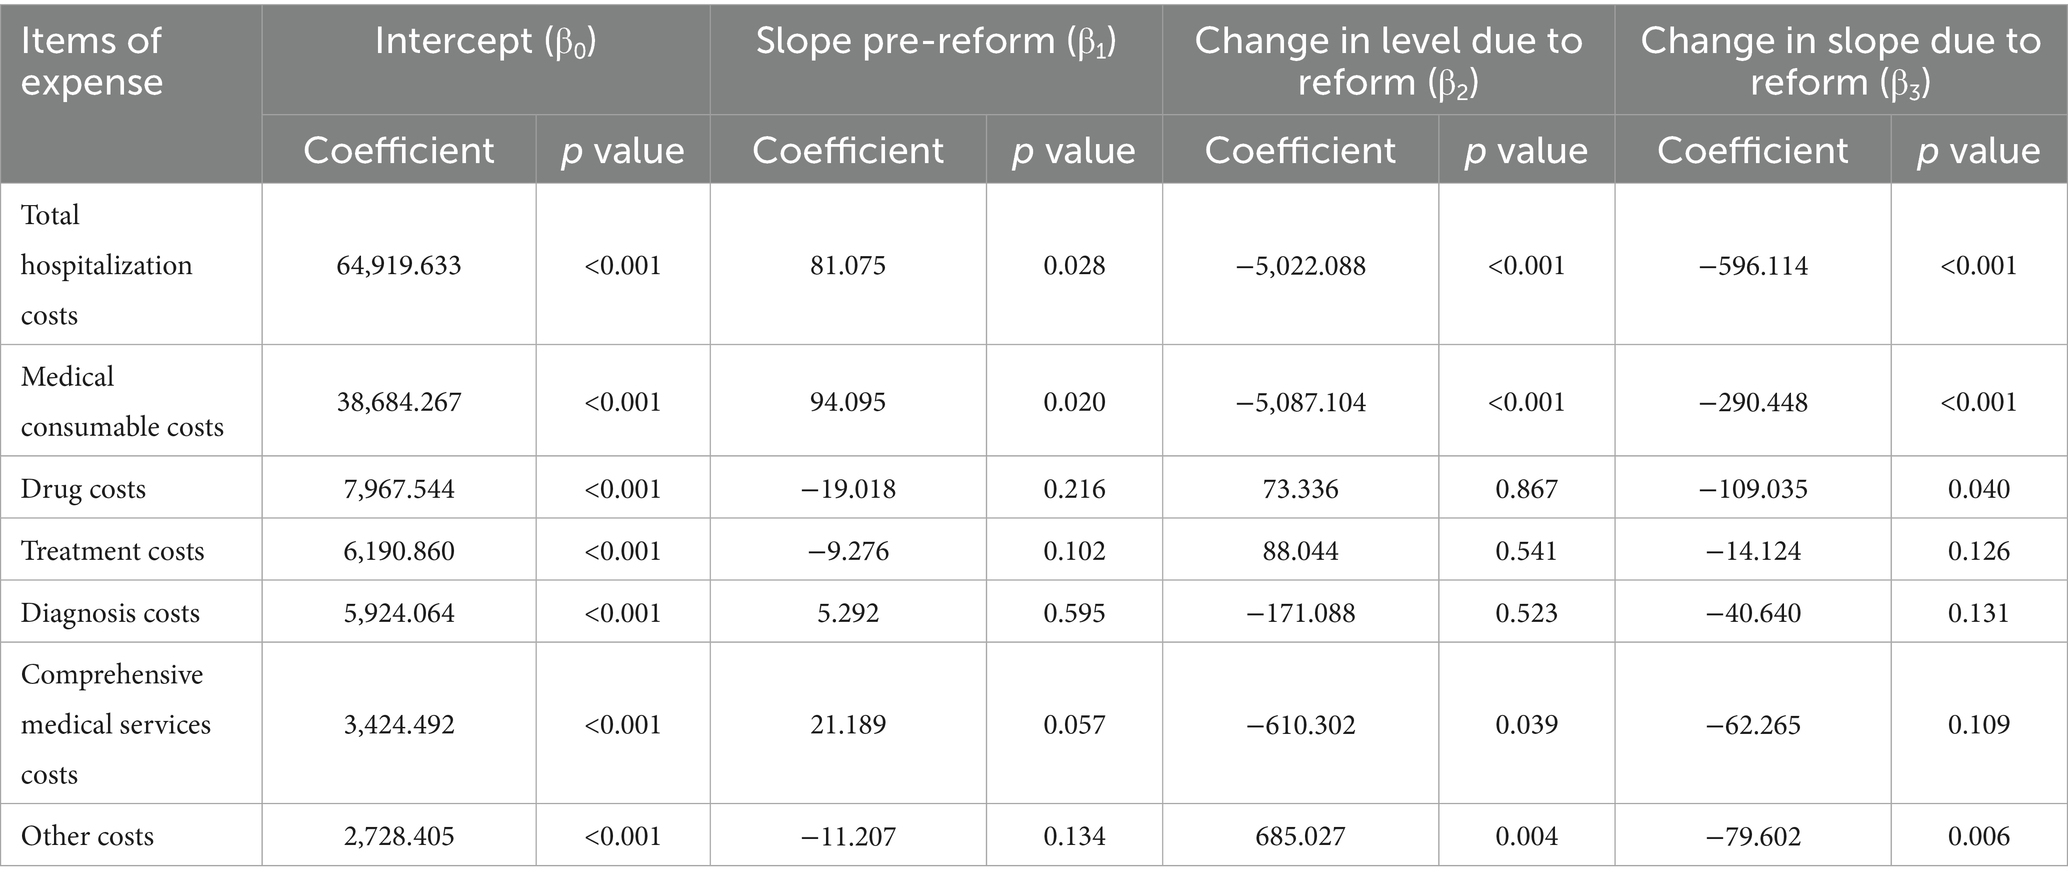
Table 14. The effect of the national centralized volume-based procurement policy on total costs and its structure.
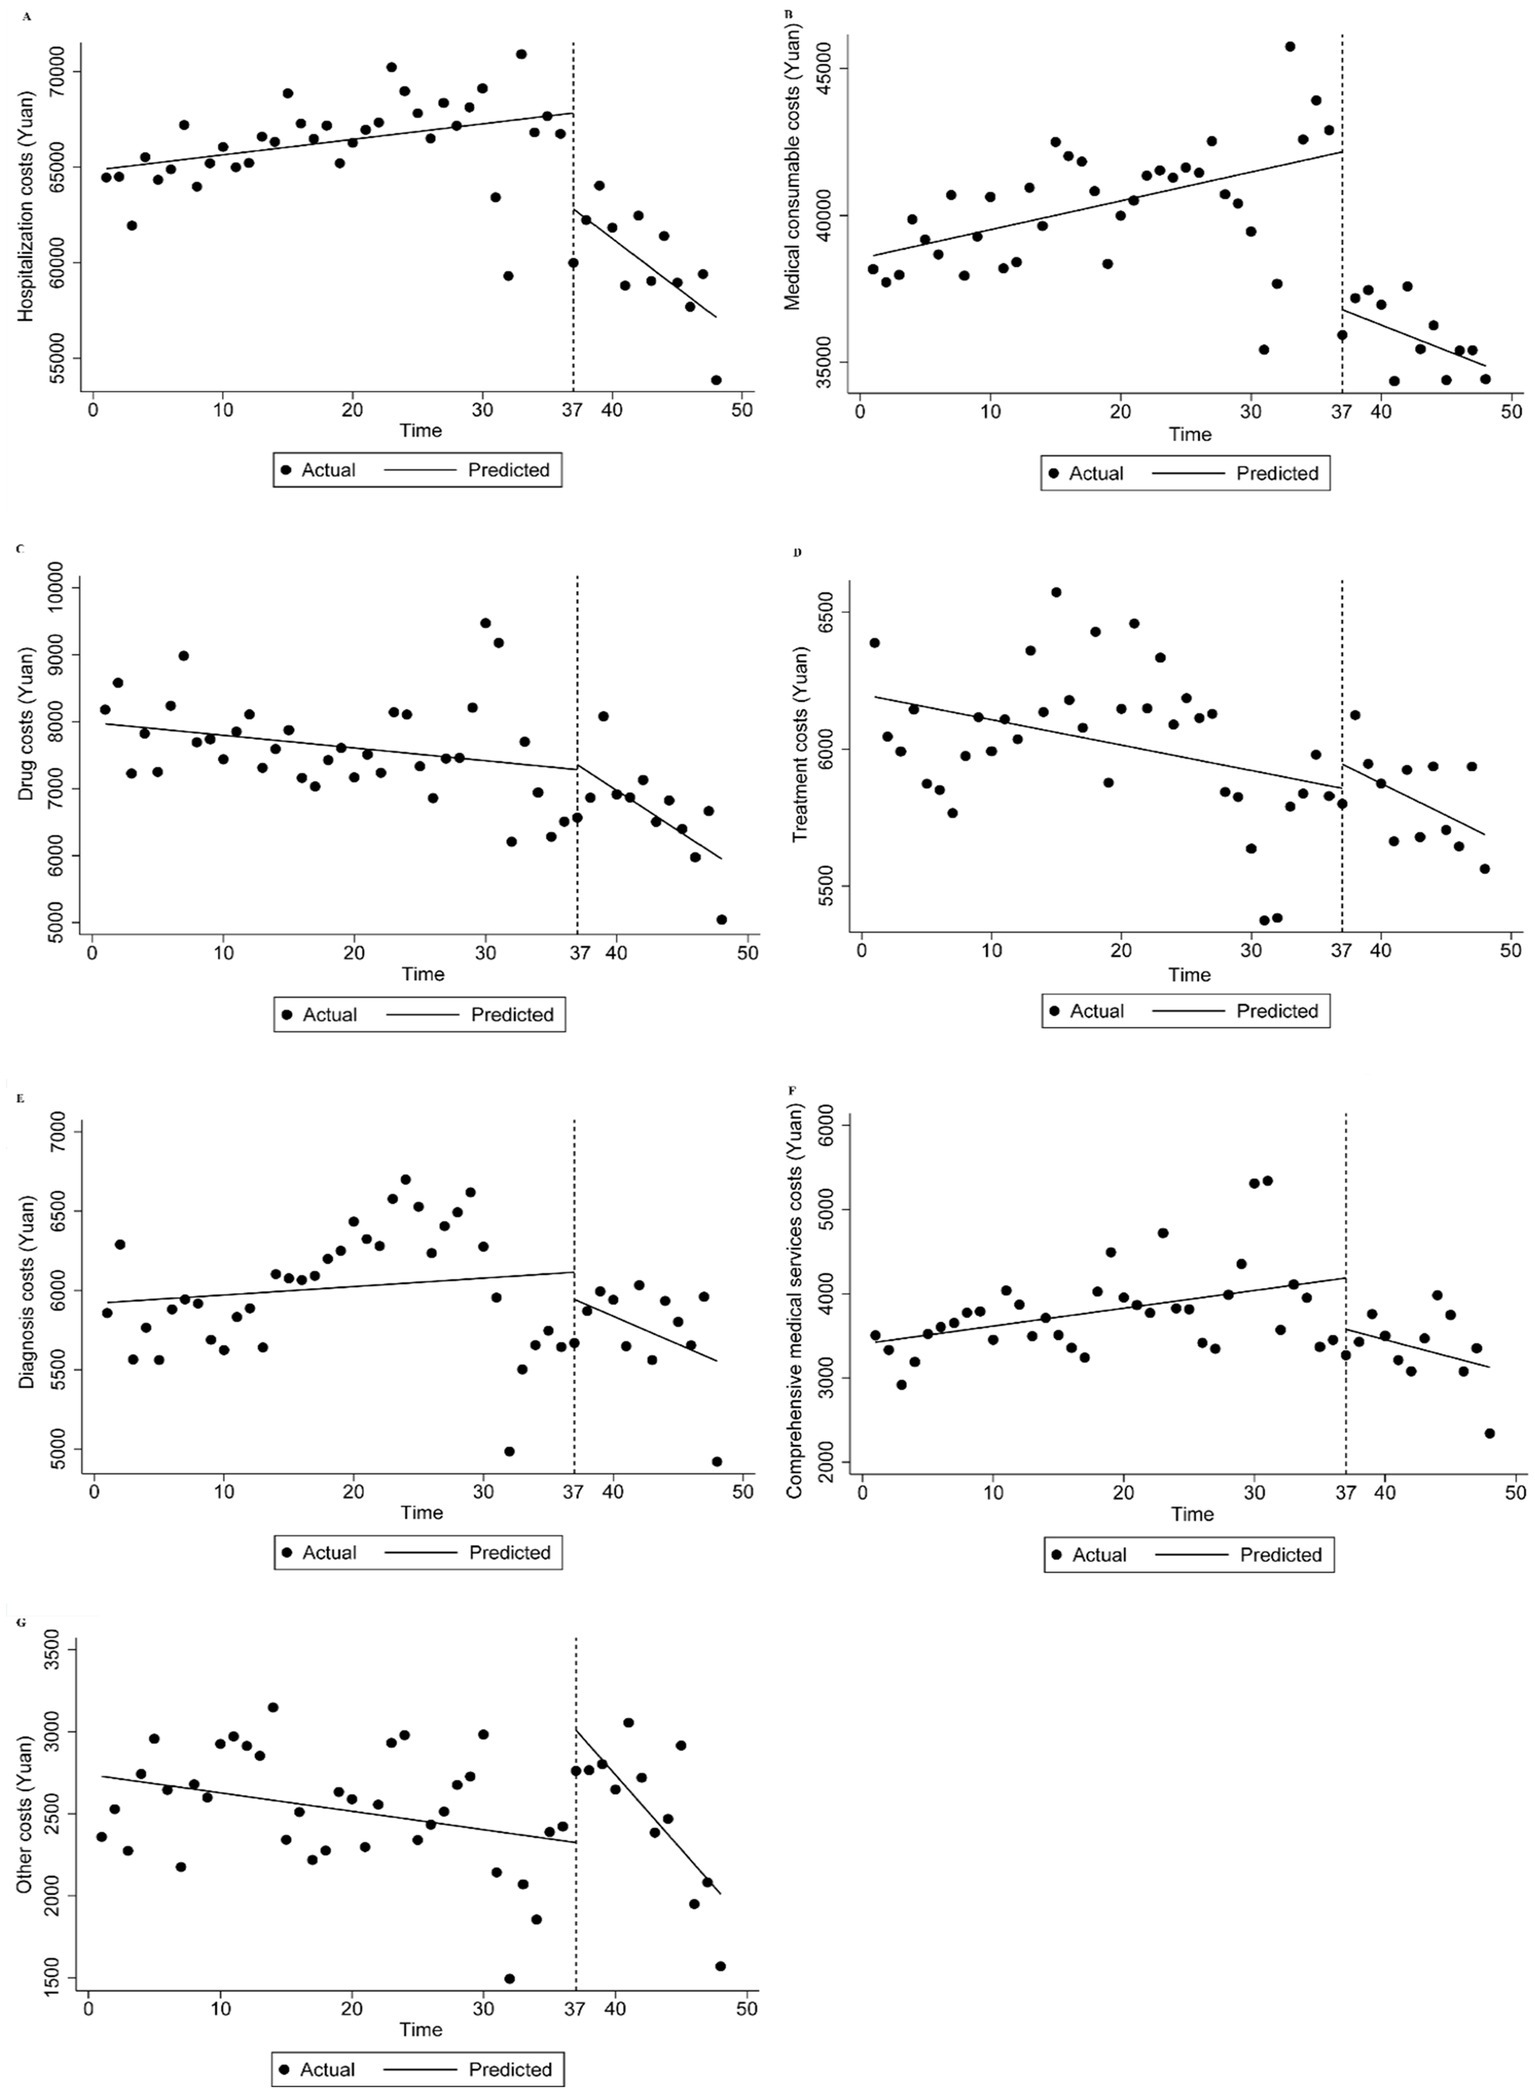
Figure 2. Trend in mean of total costs and its structure of inpatients of osteoporotic hip fractures from 2021 to 2022. Median of expense of inpatient (A) total hospitalization costs, (B) medical consumable costs, (C) drug costs, (D) treatment costs, (E) diagnosis costs, (F) comprehensive medical services costs, (G) other costs.
Moreover, drug costs declined in the long run (p < 0.05), even though the policy’s immediate impact led to a cost-increase that was not statistically significant. Other costs rose during the initial stage after the reform was implemented (p < 0.05). Nevertheless, compared to before the intervention, these costs decreased by 79.602 yuan every half month in the long-term trend following the intervention (p < 0.05). Comprehensive medical services costs decreased after the policy was implemented (p < 0.05), but this decrease was not statistically significant in the long-term trend (Table 14; Figure 2).
4 Discussion
Based on a large sample size from 2017 to 2022, this study investigated the variations in hospitalization costs for patients with osteoporotic hip fractures in Shanghai over time and the extent to which individual costs relate to total expenses. Additionally, we stratified costs for patients hospitalized at various levels of hospitals to explore the variations in expenses and the correlation between total and individual hospitalization costs. Furthermore, this study assessed the instant and long-term impact of NVBP on hospitalization costs using interrupted time series. Overall, our research found that total hospitalization costs for osteoporotic hip fracture patients displayed an increasing trend, while drug costs decreased during this period, along with a significant drop in medical consumable costs between 2021 and 2022. Despite the NVBP’s effectiveness, medical consumable costs remain a major source of costly expenditures for inpatients with hip fractures. The structural variation in hospitalization costs differed by the level of medical institutions, possibly due to the policy’s varying impact between primary and higher-grade hospitals.
Our study demonstrated that the medical consumable costs dominated hospitalization expenses for patients with osteoporotic hip fractures. This may be due to the fact that fracture treatment often requires expensive surgical consumables (e.g., artificial joints, dynamic hip screws, or proximal femoral nail anti-rotation instruments), which is a concern not only in the treatment of fractures but also in their management (15, 35). Nevertheless, the analysis of structural variations of costs showed a significant reduction in the medical consumable costs in 2021–2022, which had the highest contribution rate to the variation of the expenses in that year. This may result from a series of policies on controlling the price of medical consumables that are gradually taking effect (28, 30–32). Further analysis of the impact of the NVBP policy on the medical consumable costs revealed that the reform has led to a decrease in the medical consumable costs, both in terms of the immediate effects of the reform and the long-term trend. Meanwhile, the policy has significantly reduced total hospitalization costs, suggesting that it has achieved the desired effect. Li et al. explored the impact of the NVBP in Guangdong Province on inpatient costs for total knee arthroplasty patients and found that overall expenses and medical consumables costs decreased after the policy, which supports the policy’s effects from another perspective (39). However, the gray correlation analysis revealed that in 2022, medical consumable costs were still the highest among individual hospitalization costs, indicating that controlling these costs played a key role in alleviating the impact of disease on patients suffering from osteoporotic hip fractures. High medical consumable costs can restrict access to essential treatments for patients with osteoporotic hip fractures, especially for those in rural China, impacting patient health outcomes (35). A cross-sectional study conducted in rural China revealed evident socioeconomic disparities, with insured individuals and homeowners more likely to receive assistance after fractures (36). The study also indicated that medical interventions, including supplement use and osteoporosis treatment, were crucial to recovery and were significantly associated with higher chances of receiving help after osteoporotic fractures (36, 40).
Drug costs have shown a general trend of reduction over the six-year period, with their reduction being the primary contributor to the overall cost change, especially during 2017–2018. In Japan, total medical costs for hip fracture patients gradually rose after an initial decline from 2011 to 2021, while drug costs decreased—a trend similar to what this study found in China (41). Hospitalization costs for osteoporotic hip fractures in Thailand also increased by 2.5 times between 2013 and 2022, whereas drug costs declined (42). To control drug costs, the central government of China has implemented a range of measures, including a zero-markup drug policy, which has gradually reduced drug revenues for public hospitals since its implementation (19). After September 2017, the policy allowing markups on drug prices was completely abolished for all public hospitals, which may explain the significant decrease in drug costs from 2017 to 2018 in this study. This study’s results were consistent with other studies conducted in China, indicating a reduction in drug costs in the years following the policy’s implementation (26, 27, 29). Wang et al. found that, compared to a fixed percent mark-up drug policy, a transitional policy that allows drugs to be sold at a fixed mark-up percent, zero-markup drug policy was more intensive, especially regarding the decline of outpatient drug costs (27). However, research indicated that hospitals have pursued other income sources to compensate for the decline in drug revenue (43, 44). This study also observed a similar phenomenon: although drug costs have decreased, comprehensive service fees and diagnostic fees have increased, indicating a shift in costs. Meanwhile, total hospitalization costs have risen yearly, except for a decline in 2022, which aligns with a study conducted in Tangshan, China (36). This suggests that further policies are needed to improve earlier strategies.
Previous study has noted that the type of hospital is associated with total cost expenditures for osteoporotic hip fractures (20). The subgroup analysis results of this study showed that the structure of hospitalization costs for patients with osteoporotic hip fractures varied across different levels of hospital. In addition, compared to tertiary medical institutions, patients in primary medical institutions had a higher proportion of drug costs and a lower proportion of medical consumable costs. Meanwhile, the results of the gray correlation analysis suggest that, in contrast to other levels of medical institutions, the correlation between comprehensive medical services costs and total hospitalization costs is higher in first-level hospitals. Due to the varying functional roles of healthcare institutions in China, primary total hospitals mainly provide basic medical services and chronic disease management, tertiary hospitals primarily treat complex and severe cases, while secondary hospitals handle patients referred from tertiary hospitals (45). As a result, patients with osteoporotic hip fractures often undergo surgical treatment at higher level hospitals but choose to have rehabilitation at primary hospitals, leading to differences in the structure of inpatient costs.
The changes in the cost structure of medical institutions at various levels also differ. While the medical consumable costs at secondary and tertiary hospitals showed a notable decrease in 2021–2022, the proportion of medical consumable costs at primary hospitals increased. This may be because the NVBP policy implemented in 2022 mainly targets high-value consumables used in joint replacement surgery, and does not involve medical consumables required for orthopedic rehabilitation, thus having little impact on the medical consumable costs for osteoporotic hip fractures in primary hospitals (30). Beyond medical consumable costs, our results also revealed that although drug costs in tertiary and secondary hospitals have generally decreased over 6 years, primary hospitals have only shown a decline in a few years. This can be explained by higher-level hospitals receiving relatively more financial subsidies, along with a more comprehensive compensation mechanism from the government (19). As a result, after implementing the zero-markup drug policy, these institutions managed to counter the decline in drug revenue more swiftly. They achieved this by adjusting revenue composition and receiving government subsidies, which significantly lowered the share of drug costs. In addition, stricter government regulations for higher-level hospitals compared to lower-level hospitals, along with more sophisticated management practices and advanced information systems in higher-level hospitals, can also clarify the effectiveness of policy implementation (46). Furthermore, this study discovered that the proportion of drug costs in primary hospitals significantly decreased in 2021–2022, suggesting some degree of policy lag. In the context of China’s hierarchical diagnosis and treatment reforms, higher-level hospitals have become the de facto centers of excellence for complex conditions like osteoporotic hip fractures, concentrating resources such as high-volume surgical experience, state-of-the-art operating theaters, subspecialty teams, etc. This centralization can improve the quality of care for patients with severe conditions who choose to seek treatment in these hospitals. However, it may also lead to a situation where primary hospitals, which primarily focus on rehabilitation and less complex cases, face higher relative costs for medical consumables and drugs. This could limit the access of patients in primary hospitals to necessary treatments, particularly those requiring high-value consumables. Therefore, targeted policies should be developed to address the specific needs of primary hospitals, ensuring that they have the necessary resources to provide effective rehabilitation and follow-up care for patients with osteoporotic hip fractures.
The COVID-19 pandemic, which occurred during the study period, may have influenced healthcare cost patterns. However, a review of the literature shows that several studies with similar methodologies to ours have also not specifically addressed the impact of the COVID-19 pandemic (19, 37, 39). This indicates that although the pandemic may have had some impact, it is not regarded as a significant confounding factor in studies with similar methodologies. Future research should consider the pandemic’s influence and employ suitable statistical techniques to adjust for its effects when examining healthcare costs and policy changes.
Our study has several limitations. First, only direct medical costs were included in this study, excluding direct non-medical costs such as transportation and caregiving, which suggests that future research could take a more comprehensive look at the costs for people with osteoporotic hip fractures from a whole-society perspective (34, 47). Second, the analysis covered data only through 2022, making it challenging to analyze the long-term impact of multiple policies (48). However, the findings of this study still explore changes in hospitalization costs over an extended period, which could serve as a foundation for future research. Third, reliance on data obtained from the hospital reporting system may introduce information bias despite strict cleaning protocols. Therefore, it will be essential to utilize additional data sources in the future to validate this study’s findings further. Fourth, our study period includes the COVID-19 pandemic, which could have affected healthcare costs and hospitalization patterns. While we recognize this potential influence, we did not have detailed data on the specific effects of the pandemic. Future research should consider the pandemic’s impact and apply appropriate statistical methods to account for its effects. Fifth, comorbidities, fracture types, and surgical procedures could not be properly identified due to limitations in data gathering for this investigation. This may have had an impact on the cost analysis’s findings. To account for confounding variables and increase the precision of the results, future studies might conduct more subgroup analyses based on different comorbidities, fracture types, or surgical procedures.
5 Conclusion
Overall hospitalization costs for osteoporotic hip fracture patients increased from 2017 to 2022. Medical consumable costs continued to dominate the total expenses, although they showed a decrease due to the implementation of the NVBP. Despite the downward trend in drug costs, they remain the second-largest component of total hospitalization expenses. The stratification results based on the level of the healthcare institution indicate that the variation of the inpatient cost structure in primary hospitals differs from that of higher-grade hospitals. For the health system, addressing cost drivers, especially medical consumable costs and drug costs, is crucial for ensuring the sustainable use of healthcare resources and improving operational efficiency. For policymakers, corresponding measures should be taken in accordance with the cost structure characteristics of medical institutions at different levels to ensure equitable and effective cost management.
Data availability statement
The datasets presented in this article are not readily available because this dataset contain sensitive information that cannot be disclosed publicly. Requests to access the datasets should be directed to Jing Yan, eWFuamluZ0BzaGRyYy5vcmc=.
Ethics statement
This study did not require ethical approval because it did not involve any direct patient contact or intervention, and all personal identifiers were removed to ensure patient privacy and confidentiality. The studies were conducted in accordance with the local legislation and institutional requirements. Written informed consent for participation was not required from the participants or the participants’ legal guardians/next of kin in accordance with the national legislation and institutional requirements.
Author contributions
JY: Data curation, Writing – original draft, Writing – review & editing. QQ: Software, Writing – review & editing. XF: Supervision, Writing – review & editing. FL: Methodology, Writing – review & editing. BZ: Methodology, Writing – review & editing.
Funding
The author(s) declare that no financial support was received for the research and/or publication of this article.
Conflict of interest
The authors declare that the research was conducted in the absence of any commercial or financial relationships that could be construed as a potential conflict of interest.
Generative AI statement
The authors declare that no Gen AI was used in the creation of this manuscript.
Any alternative text (alt text) provided alongside figures in this article has been generated by Frontiers with the support of artificial intelligence and reasonable efforts have been made to ensure accuracy, including review by the authors wherever possible. If you identify any issues, please contact us.
Publisher’s note
All claims expressed in this article are solely those of the authors and do not necessarily represent those of their affiliated organizations, or those of the publisher, the editors and the reviewers. Any product that may be evaluated in this article, or claim that may be made by its manufacturer, is not guaranteed or endorsed by the publisher.
References
1. Black, DM, and Rosen, CJ. Clinical practice. Postmenopausal osteoporosis. N Engl J Med. (2016) 374:254–62. doi: 10.1056/NEJMcp1513724
2. Yan, L, Li, F, Zhou, J, Ding, Y, Qin, Q, Jin, C, et al. The global burden of fractures and its underlying etiologies: results from and further analysis of the Global Burden of Disease Study 2021. Arch Osteoporos. (2025) 20:111. doi: 10.1007/s11657-025-01596-3
3. Willers, C, Norton, N, Harvey, NC, Jacobson, T, Johansson, H, Lorentzon, M, et al. Osteoporosis in Europe: a compendium of country-specific reports. Arch Osteoporos. (2022) 17:23. doi: 10.1007/s11657-021-00969-8
4. Clynes, MA, Harvey, NC, Curtis, EM, Fuggle, NR, Dennison, EM, and Cooper, C. The epidemiology of osteoporosis. Br Med Bull. (2020) 133:105–17. doi: 10.1093/bmb/ldaa005
5. Liow, MHL, Ganesan, G, Chen, JDY, Koh, JSB, Howe, TS, Yong, EL, et al. Excess mortality after hip fracture: fracture or pre-fall comorbidity? Osteoporos Int. (2021) 32:2485–92. doi: 10.1007/s00198-021-06023-0
6. Body, JJ, Marin, F, Kendler, DL, Zerbini, CAF, López-Romero, P, Möricke, R, et al. Efficacy of teriparatide compared with risedronate on FRAX(®)-defined major osteoporotic fractures: results of the VERO clinical trial. Osteoporos Int. (2020) 31:1935–42. doi: 10.1007/s00198-020-05463-4
7. Khan, AA, Slart, R, Ali, DS, Bock, O, Carey, JJ, Camacho, P, et al. Osteoporotic fractures: diagnosis, evaluation, and significance from the international working group on DXA best practices. Mayo Clin Proc. (2024) 99:1127–41. doi: 10.1016/j.mayocp.2024.01.011
8. Feng, JN, Zhang, CG, Li, BH, Zhan, SY, Wang, SF, and Song, CL. Global burden of hip fracture: the global burden of disease study. Osteoporos Int. (2024) 35:41–52. doi: 10.1007/s00198-023-06907-3
9. Shen, Y, Huang, X, Wu, J, Lin, X, Zhou, X, Zhu, Z, et al. The global burden of osteoporosis, low bone mass, and its related fracture in 204 countries and territories, 1990-2019. Front Endocrinol (Lausanne). (2022) 13:882241. doi: 10.3389/fendo.2022.882241
10. Yang, W, Li, G, and Liu, J. The incidence, prevalence, and health burden of hip fractures in China: data from the global burden of disease study 2019. Prev Med Rep. (2024) 38:102622. doi: 10.1016/j.pmedr.2024.102622
11. Meng, Q, Wang, X, Gao, Y, Leslie, WD, Lix, LM, Shi, X, et al. A real-world analysis of 1,823 hospitalized osteoporotic fractures in Northeast China. Front Endocrinol (Lausanne). (2024) 15:1520229. doi: 10.3389/fendo.2024.1520229
12. Kanis, JA, Norton, N, Harvey, NC, Jacobson, T, Johansson, H, Lorentzon, M, et al. SCOPE 2021: a new scorecard for osteoporosis in Europe. Arch Osteoporos. (2021) 16:82. doi: 10.1007/s11657-020-00871-9
13. Qu, B, Ma, Y, Yan, M, Wu, HH, Fan, L, Liao, DF, et al. The economic burden of fracture patients with osteoporosis in western China. Osteoporos Int. (2014) 25:1853–60. doi: 10.1007/s00198-014-2699-0
14. Leslie, WD, Lix, LM, Finlayson, GS, Metge, CJ, Morin, SN, and Majumdar, SR. Direct healthcare costs for 5 years post-fracture in Canada: a long-term population-based assessment. Osteoporos Int. (2013) 24:1697–705. doi: 10.1007/s00198-012-2232-2
15. Ferris, H, Brent, L, and Sorensen, J. Cost of hospitalisation for hip fracture-findings from the Irish hip fracture database. Osteoporos Int. (2022) 33:1057–65. doi: 10.1007/s00198-021-06294-7
16. Yang, M, and Zhang, Y. Epidemiological features of 1,332 cases of hip fracture in Shanghai, China (2015-2020). Art. (2024) 6:18. doi: 10.1186/s42836-024-00236-4
17. Fu, TS, Huang, TS, Sun, CC, Shyu, YC, and Chen, FP. Impact of bisphosphonates and comorbidities on initial hip fracture prognosis. Bone. (2022) 154:116239. doi: 10.1016/j.bone.2021.116239
18. Wu, J, Qu, Y, Wang, K, and Chen, Y. Healthcare resource utilization and direct medical costs for patients with osteoporotic fractures in China. Value Health Reg Issues. (2019) 18:106–11. doi: 10.1016/j.vhri.2018.11.008
19. Zhang, X, Zimmerman, A, Lai, H, Zhang, Y, Tang, Z, Tang, S, et al. Differential effect of China's zero markup drug policy on provider-induced demand in secondary and tertiary hospitals. Front Public Health. (2024) 12:1229722. doi: 10.3389/fpubh.2024.1229722
20. Milto, AJ, El Bitar, Y, Scaife, SL, and Thuppal, S. Differences in hospital length of stay and total hospital charge by income level in patients hospitalized for hip fractures. Osteoporos Int. (2022) 33:1067–78. doi: 10.1007/s00198-021-06260-3
21. Kristensen, PK, Thillemann, TM, Pedersen, AB, Søballe, K, and Johnsen, SP. Socioeconomic inequality in clinical outcome among hip fracture patients: a nationwide cohort study. Osteoporos Int. (2017) 28:1233–43. doi: 10.1007/s00198-016-3853-7
22. Babaie, F, Motevalli, MH, Mehralian, G, Peiravian, F, and Yousefi, N. How does external reference pricing work in developing countries: evidence from Iran. Front Pharmacol. (2023) 14:1034229. doi: 10.3389/fphar.2023.1034229
23. Gill, J, Fontrier, AM, Kyriopoulos, D, and Kanavos, P. Variations in external reference pricing implementation: does it matter for public policy? Eur J Health Econ. (2019) 20:1375–97. doi: 10.1007/s10198-019-01100-y
24. Acosta, A, Ciapponi, A, Aaserud, M, Vietto, V, Austvoll-Dahlgren, A, Kösters, JP, et al. Pharmaceutical policies: effects of reference pricing, other pricing, and purchasing policies. Cochrane Database Syst Rev. (2014) 2014:Cd005979. doi: 10.1002/14651858.CD005979.pub2
25. Commission GOotNHaW. Circular from the General Office of the National Health and Wellness Commission regarding the issuance of measures for the management of surgical classification in medical institutions. (2022). Available online at: https://www.gov.cn/zhengce/zhengceku/2022-12/19/content_5732651.htm (accessed June 2, 2025).
26. Jiang, X, He, P, Zhu, D, Shi, X, and Meng, Q. Different impacts of the zero-markup drug policy on county general and traditional Chinese medicine hospitals: evidence from Shandong province, China. Int J Equity Health. (2020) 19:219. doi: 10.1186/s12939-020-01326-w
27. Wang, X, Li, F, Wang, X, Zhang, X, Liu, C, Wang, D, et al. Effects of different mark-up drug policies on drug-related expenditures in tertiary public hospitals: an interrupted time series study in Shanghai, China, 2015-2018. Biosci Trends. (2020) 14:16–22. doi: 10.5582/bst.2019.01350
28. Medical Insurance Bureau DaRC. Ministry of industry and information technology, et al. Guidance on the implementation of centralized volume procurement and use of high-value medical consumables for national organizations. (2021). Available online at: https://www.gov.cn/gongbao/content/2021/content_5629610.htm (accessed June 2, 2025).
29. Cheng, H, Zhang, Y, Sun, J, and Liu, Y. Impact of zero-mark-up medicines policy on hospital revenue structure: a panel data analysis of 136 public tertiary hospitals in China, 2012-2020. BMJ Glob Health. (2021) 6:e007089. doi: 10.1136/bmjgh-2021-007089
30. Bureau, SMS. Notice on carrying out the centralized volume procurement and use of national artificial joints in this city. (2022). Available online at: https://ybj.sh.gov.cn/qtwj/20220704/10854590c2d7485f8144572814ade33c.html (accessed June 2, 2025).
31. Bureau, SMS. Notice on matters related to zero markup sales of medical devices in public health institutions of this city. (2019). Available online at: https://ybj.sh.gov.cn/qtwj3/20200610/385a740e381e49b9b24c9ce7b7077e87.html (accessed June 2, 2025).
32. Council GOotS. Notice on the issuance of the reform plan for the governance of high-value medical consumables by the General Office of the State Council. (2019). Available online at: https://www.gov.cn/zhengce/content/2019-07/31/content_5417518.htm (accessed June 2, 2025).
33. Shanghai Medical Security Bureau SMHC. Notice regarding the adjustment of prices for certain medical services in this city. (2021). Available online at: https://ybj.sh.gov.cn/qtwj/20211104/8fbf9847c2f945b8a0b3274b8e74bf6f.html (accessed June 2, 2025).
34. Mori, T, Komiyama, J, Fujii, T, Sanuki, M, Kume, K, Kato, G, et al. Medical expenditures for fragility hip fracture in Japan: a study using the nationwide health insurance claims database. Arch Osteoporos. (2022) 17:61. doi: 10.1007/s11657-022-01096-8
35. Wang, Y, Cui, H, Zhang, D, and Zhang, P. Hospitalisation cost analysis on hip fracture in China: a multicentre study among 73 tertiary hospitals. BMJ Open. (2018) 8:e019147. doi: 10.1136/bmjopen-2017-019147
36. Hou, XL, Liu, JY, Fan, XH, Zhang, N, Cao, GL, Guo, ZB, et al. Secular trends of incidence and hospitalization cost of hip fracture in Tangshan, China. Osteoporos Int. (2022) 33:89–96. doi: 10.1007/s00198-021-06050-x
37. Li, HY, and Zhang, RX. Analysis of the structure and trend prediction of China's total health expenditure. Front Public Health. (2024) 12:1425716. doi: 10.3389/fpubh.2024.1425716
38. Cui, L, Yin, G, Dai, GLX, and Tao, H. Does global capitation prospective payment promote integrated delivery networks? Evidence from China’s compact county medical communities. Int J Equity Health. (2025) 24:164. doi: 10.1186/s12939-025-02490-7
39. Li, A, Li, G, Han, D, Fu, M, and Chang, J. A comparative study of hospitalization costs of TKA inpatients before and after National Volume-based Procurement in Guangdong, China: an interrupted time-series analysis. Front Public Health. (2024) 12:1468606. doi: 10.3389/fpubh.2024.1468606
40. Morin, SN, Leslie, WD, and Schousboe, JT. Osteoporosis: a review. JAMA. (2025) 334:894–907. doi: 10.1001/jama.2025.6003
41. Hatano, M, Yasunaga, H, Ishikura, H, Tanaka, T, Aso, S, and Tanaka, S. Temporal trends in acute care costs of hip fracture treatment from 2011 to 2021 in Japan. Arch Osteoporos. (2025) 20:124. doi: 10.1007/s11657-025-01607-3
42. Charatcharoenwitthaya, N, Nimitphong, H, Wattanachanya, L, Songpatanasilp, T, Ongphiphadhanakul, B, Deerochanawong, C, et al. Epidemiology of hip fractures in Thailand. Osteoporos Int. (2024) 35:1661–8. doi: 10.1007/s00198-024-07140-2
43. Joosse, IR, Tordrup, D, Glanville, J, Mantel-Teeuwisse, AK, and van den Ham, HA. A systematic review of policies regulating or removing mark-ups in the pharmaceutical supply and distribution chain. Health Policy. (2023) 138:104919. doi: 10.1016/j.healthpol.2023.104919
44. Fu, H, Li, L, and Yip, W. Intended and unintended impacts of price changes for drugs and medical services: evidence from China. Soc Sci Med. (2018) 211:114–22. doi: 10.1016/j.socscimed.2018.06.007
45. Zhu, T, Chen, C, Zhang, X, Yang, Q, Hu, Y, Liu, R, et al. Differences in inpatient performance of public general hospitals following implementation of a points-counting payment based on diagnosis-related group: a robust multiple interrupted time series study in Wenzhou, China. BMJ Open. (2024) 14:e073913. doi: 10.1136/bmjopen-2023-073913
46. Li, L, Du, T, and Hu, Y. The effect of different classification of hospitals on medical expenditure from perspective of classification of hospitals framework: evidence from China. Cost Eff Resour Alloc. (2020) 18:35. doi: 10.1186/s12962-020-00229-5
47. Williams, SA, Daigle, SG, Weiss, R, Wang, Y, Arora, T, and Curtis, JR. Economic burden of osteoporosis-related fractures in the US Medicare population. Ann Pharmacother. (2021) 55:821–9. doi: 10.1177/1060028020970518
48. Shanghai Medical security Bureau SMHC, Shanghai Municipal Drug Administration. Notice regarding the effective procurement and use of high-value medical consumables (orthopedic trauma type) in our city. (2025). Available online at: https://www.shanghai.gov.cn/gwk/search/content/d83d109d5bb74f47947c1ba3c2663672 (accessed June 2, 2025).
Keywords: osteoporotic hip fractures, medical cost, structural variation, osteoporosis, price policy
Citation: Yan J, Qin Q, Fang X, Li F and Zhu B (2025) Analysis of structural variations and effects of the national volume-based procurement policy on inpatient costs: a real world study of osteoporotic hip fractures in Shanghai, China. Front. Public Health. 13:1678817. doi: 10.3389/fpubh.2025.1678817
Edited by:
Yu-Hsiang Kao, Intuitive Surgical, Inc., United StatesReviewed by:
Grzegorz Tatoń, Jagiellonian University, PolandAli Obaidi, University of Warith Al-Anbiyaa, Iraq
Copyright © 2025 Yan, Qin, Fang, Li and Zhu. This is an open-access article distributed under the terms of the Creative Commons Attribution License (CC BY). The use, distribution or reproduction in other forums is permitted, provided the original author(s) and the copyright owner(s) are credited and that the original publication in this journal is cited, in accordance with accepted academic practice. No use, distribution or reproduction is permitted which does not comply with these terms.
*Correspondence: Fen Li, bGlmZW5Ac2hkcmMub3Jn; Bifan Zhu, emh1YmlmYW5Ac2hkcmMub3Jn
†These authors have contributed equally to this work and share corresponding authorship