 Juanzhao Cao1
 Wanqiang Huang
- 1Department of Anesthesiology, Wuhan Third Hospital (Tongren Hospital of Wuhan University), Wuhan, China
- 2School of Clinical Medicine, Xi’an Medical University, Xi’an, China
- 3Department of Orthopedics, Wuhan Sixth Hospital, Wuhan, China
Introduction: This study comprehensively investigated the magnitude and temporal trends of the global burden of opioid use disorder (OUD) from 1990 to 2021 and predicted the disease burden in the next 29 years.
Methods: The data originated from the Global Burden of Disease 2021 study. Incidence, prevalence, deaths, and disability-adjusted life years (DALYs) were analyzed by age-standardized rates. The estimated annual percentage change was calculated. The decomposition analysis was used to analyze the changes in burden globally and across the five social demographic index (SDI) regions from 1990 to 2021, with the affected population broken down into three key determinants at the group level: population aging, population growth, and epidemiological changes. Age-period-cohort analysis was used to estimate age, period, and cohort effects. Bayesian age-period-cohort modeling was used to predict the burden of OUD from 2021 to 2050.
Results: In 2021, the global age-standardized prevalence rate (ASPR), age-standardized incidence rate (ASIR), age-standardized deaths rate (ASDR), and age-standardized DALYs rate of OUD were 198.489 [95% Uncertainty Interval (95%UI): 173.423-227.218], 24.544 (95%UI: 20.739-29.476), 1.194 (95%UI: 1.115-1.294), and 137.146 (95%UI: 112.293 -161.385) per 100,000 people, respectively. Among the 21 GBD regions, in 2021, High-income North America had the highest ASPR, ASIR, ASDR, and age-standardized DALYs rate of OUD. Overall, the global burden of OUD among males was significantly higher than that among females, especially in terms of deaths and DALYs. In terms of prevalent cases, globally, aging contributed 1.29%, population growth contributed 61.74%, and epidemiological changes contributed 36.97% to the increase in the burden of OUD. The global prevalence rate increased with age among people aged 20-30, decreased with age among those aged 30-80, and increased with age among people over 80. For males, the predicted ASPR, ASIR, ASDR, and age-standardized DALYs rate for OUD in 2050 are 239.62, 31.98, 2.42, and 206.44 per 100,000 people, respectively.
Discussion: This study highlighted the substantial burden of OUD, particularly in High-income North America, young populations, and male populations. Population growth and epidemiological changes contributed significantly to the increase in the burden of OUD.
1 Background
Opioid use disorder (OUD) refers to a maladaptive pattern of opioid drug use that leads to serious harm or distress (1), including improper use of prescription opioids, using opioids as drugs, or using illegally obtained heroin (2, 3). OUD is a widespread global health problem that imposes a huge disease burden on the world. In 2019, globally, there were 21,390.4 thousand new cases of OUD, with an age-standardized incidence rate (ASIR) of 39.2 per 100,000 population; 3084.5 thousand prevalent cases, with an age-standardized prevalence rate (ASPR) of 265.9 per 100,000 population; 88.4 thousand deaths, with an age-standardized deaths rate (ASDR) of 1.1 per 100,000 populations (4). For the American population, there were 435,110 new cases of OUD, 6,607,640 prevalent cases, and 55,450 deaths (5). At the same time, the World Drug Report 2023 pointed out that in 2021, there were 39.5 million patients with drug use disorder globally, representing a 45% increase over the past 10 years.1 Given its high growth rate and heavy burden, it is of great necessity to pay attention to the global burden of OUD.
The Global Burden of Disease (GBD) database has the advantage of systematically analyzing and integrating global disease and health data. The use of GBD data can provide policymakers, researchers, and the public with a comprehensive understanding of the global situation of OUD (5). Therefore, this study retrieved detailed data on the latest burden of OUD from the GBD 2021 to comprehensively investigate the magnitude and temporal trends of the global burden of OUD from 1990 to 2021; and to predict the disease burden in the next 29 years. Our results contribute to the understanding of the burden of OUD and the formulation of more effective population-oriented policies and approaches.
2 Materials and methods
2.1 Data collection
The data for this study were sourced from the GBD 2021 database,2 which encompasses the burden of 371 diseases and 88 risk factors, covering 204 countries and regions worldwide.
2.2 Indicators of disease burden
We obtained the data on the burden related to OUD from 1990 to 2021, classified by age, sex, and GBD regions. The data include the incidence, prevalence, deaths, and disability-adjusted life years (DALYs), as well as the ASIR, ASPR, ASDR, and the age-standardized DALYs rate. At the same time, information on the socio-demographic index (SDI) of each state was also collected. This index is derived from three key indicators: the fertility rate of young women (under 25 years old), the education level (where the average number of years of education per individual being ≥ 15 years), and economic prosperity (the lagged income per capita). The SDI is calculated as the geometric mean of these three components, with each component being standardized to a range of 0 to 1.3
2.3 Statistical analysis
The Estimated annual percentage change (EAPC) was used to evaluate the temporal trends. If both the value of the EAPC and the lower limit of its 95% Confidence Interval (95% CI) > 0, it indicates an upward trend; while, if both the EAPC and the upper limit of its 95% CI < 0, it indicates a downward trend. Otherwise, it implies a stable trend (6).
The decomposition method proposed by Das Gupta was used to analyze the changes in burden globally and across the five SDI regions from 1990 to 2021, attributing these changes to aging, population growth, and epidemiological changes. This method can more precisely reveal how demographic and epidemiological factors influence the trends of disease burden over time (7). The Das Gupta method is an extension of the standardized processing and traditional factor decomposition methods commonly used in demography. It is used to compare differences across multiple dimensions between two groups and decompose the relative contributions of differences in different dimensions. Compared with the traditional Kitagawa factor decomposition method, the Das Gupta method focuses on solving two problems: first, it solves the problem that the interaction between different factors interferes with the decomposition results; second, it keeps other factors constant, thereby avoiding the problem that the decomposition results differ due different order of adding to the variables (8). A negative contribution value indicates that the direction of change of a factor is opposite to that of the total change, thus exerting an inhibitory or offsetting effect (9). A contribution value exceeding 100% occurs when the independent driving intensity of a certain factor is far greater than the total change rate. The core reason for this lies in the presence of interactions and counteracting effects among multiple driving factors.
The age-period-cohort (APC) model was used to analyze the changing characteristics of the global OUD burden across different age groups, time periods, and birth cohorts from 1990 to 2021. The APC model is based on the Poisson distribution and improves traditional descriptive analysis methods. It decomposes the target analysis variables from three dimensions: age, period, and cohort, thereby better analyzing the incidence, prevalence, death and DALY risks of diseases in terms of age, period, and cohort (10).
The Bayesian Age-Period-Cohort (BAPC) model was used to predict the global burden of OUD in 2050, which is a Bayesian regression method based on the age-period-cohort model. It aims to quantify the posterior distribution of parameters by introducing Bayesian inference, thereby more accurately predicting incidence rates and estimating the uncertainty of predictions (11). The BAPC model, which adopts the Integrated Nested Laplace Approximation (INLA) approach, can avoid the mixing and convergence issues that may arise from Markov Chain Monte Carlo (MCMC)-related sampling techniques. It uses a second-order random walk to smooth the priors of age, period, and cohort effects for predicting posterior deaths rates and DALYs rates (12). The calculation formula of the BAPC model is , where Zᵢⱼ represents the unstructured variation parameter, and . The BAPC analysis was conducted using the R package “BAPC.” R software (version 4.4.1) was used for statistical analysis. A p-value less than 0.05 indicates a statistically significant difference.
3 Results
3.1 Global and 21 GBD regions’ burden of OUD
From 1990 to 2021, the burden of OUD showed an upward trend except for ASIR (Table 1). The EAPC values for the global ASPR, ASDR, and age-standardized DALYs rate of OUD were 0.5 (95%CI: 0.33 to 0.68), 0.52 (95%CI: 0.26 to 0.77), and 0.5 (95%CI: 0.31 to 0.7), respectively, while the EAPC for the global ASIR of OUD was −0.17 (95%CI: −0.34 to −0.01) from 1990 to 2021. The global ASPR, ASDR, and age-standardized DALYs rate of OUD increased from 154.589 (95%UI: 131.062–181.259), 0.858 (95%UI: 0.764–0.927), and 103.689 (95%UI: 81.833–122.751) per 100,000 people in 1990 to 198.489 (95%UI: 173.423–227.218), 1.194 (95%UI: 1.115–1.294), and 137.146 (95%UI: 112.293–161.385) per 100,000 people in 2021, respectively. The ASIR of OUD in 2021 was 24.544 (95%UI: 20.739–29.476) per 100,000 people. In addition, in 2021, the global prevalent cases of OUD were 16,164,876 (95%UI: 14,133,120–18,431,510), incident cases were 1,942,525 (95%UI: 1,643,342–2,328,363), death cases were 99,555 (95%UI: 92,948–108,050), and DALYs were 11,218,519 (95%UI: 9,188,658–13,159,551).
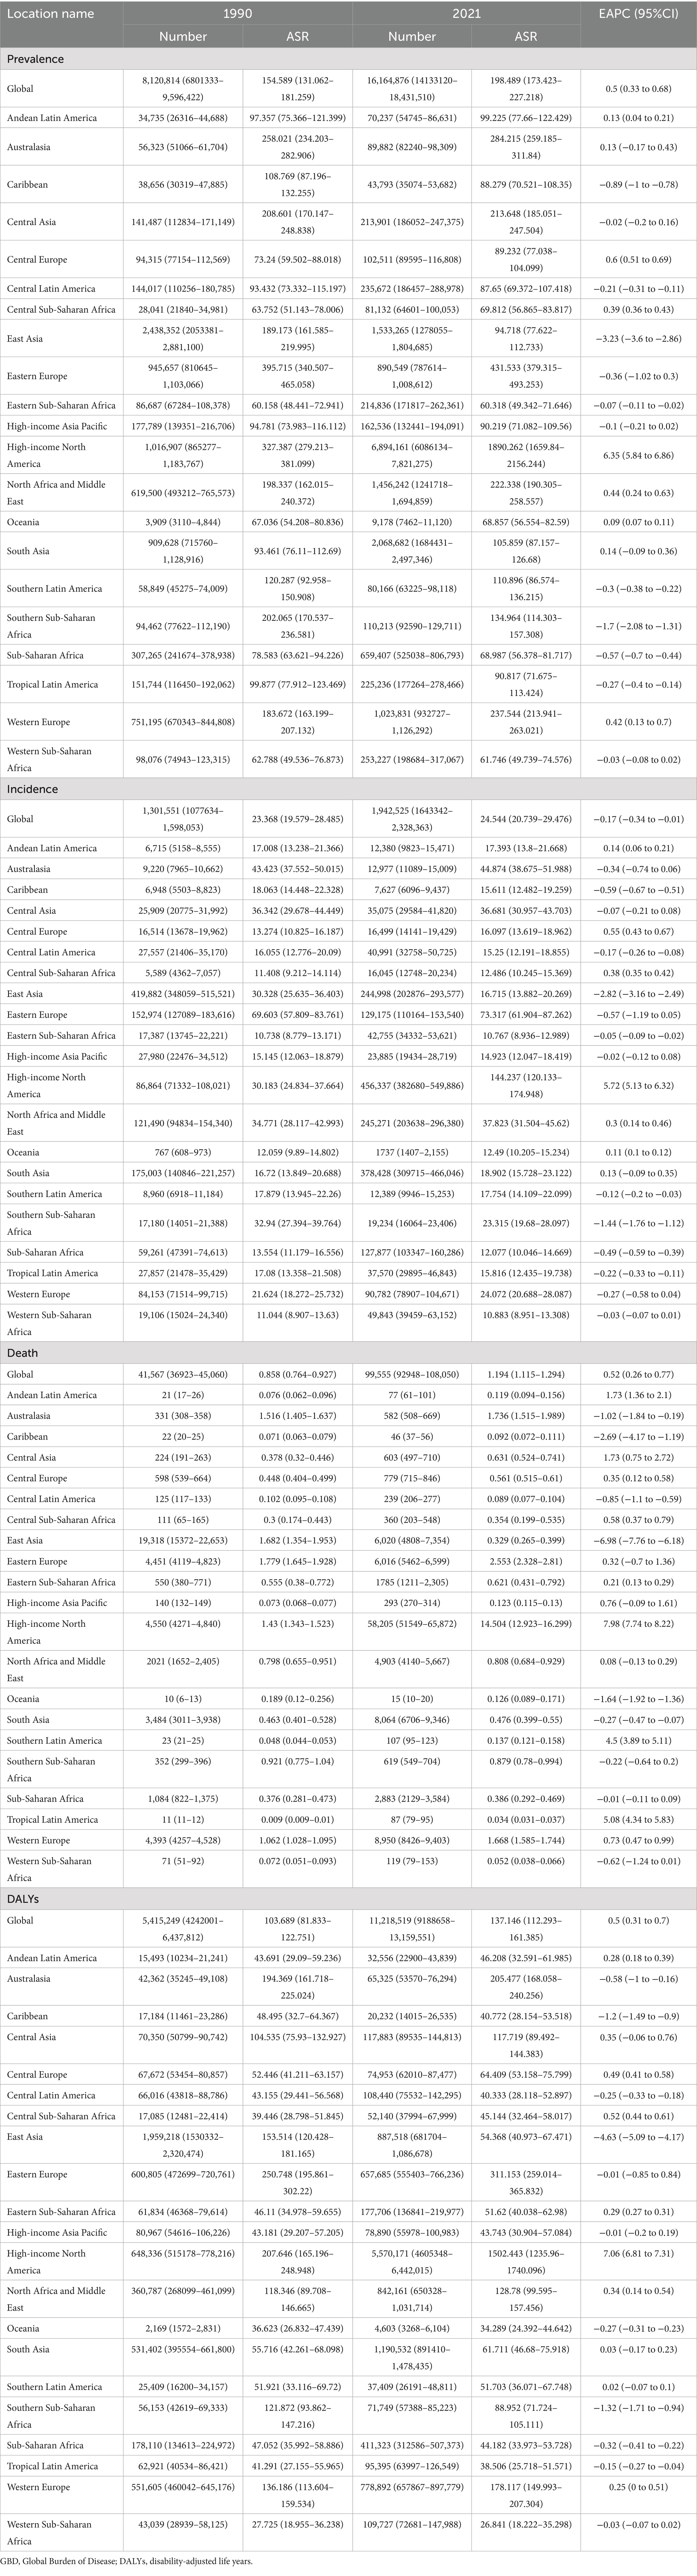
Table 1. Opioid use disorder burden in Global, 21 GBD Regions: 1990–2021.
Among the 21 GBD regions, in 2021, High-income North America had the highest ASPR, ASIR, ASDR, and age-standardized DALYs rate of OUD, with the age-standardized rates (ASRs) of 1,890.262 (95%UI: 1,659.84–2,156.244), 144.237 (95%UI: 120.133–174.948), 14.504 (95%UI: 12.923–16.299), and 1,502.443 (95%UI: 1,235.96–1,740.096) per 100,000 people, respectively. Eastern Sub-Saharan Africa had the lowest ASPR and ASIR of OUD, with the ASRs of 60.318 (95%UI: 49.342–71.646) and 10.767 (95%UI: 8.936–12.989) per 100,000 people in 2021, respectively. Meanwhile, Tropical Latin America and Western Sub-Saharan Africa had the lowest ASDR and age-standardized DALYs rate of OUD, respectively. From 1990 to 2021, among the 21 GBD regions, High-income North America experienced the highest increase in the ASPR, ASIR, ASDR, and age-standardized DALYs rate, with the EAPCs of 6.35 (95%CI: 5.84 to 6.86), 5.72 (95%CI: 5.13 to 6.32), 7.98 (95%CI: 7.74 to 8.22), and 7.06 (95%CI: 6.81 to 7.31), respectively, while East Asia experienced the highest decrease in the ASPR, ASIR, ASDR, and age-standardized DALYs rate, with the EAPCs of −3.23 (95%CI: −3.6 to −2.86), −2.82 (95%CI: −3.16 to −2.49), −6.98 (95%CI: −7.76 to −6.18), and −4.63 (95%CI: −5.09 to −4.17), respectively.
3.2 Age and gender pattern of OUD burden
Overall, the global burden of OUD among males was significantly higher than that among females, especially in terms of deaths and DALYs (Figures 1A–D).
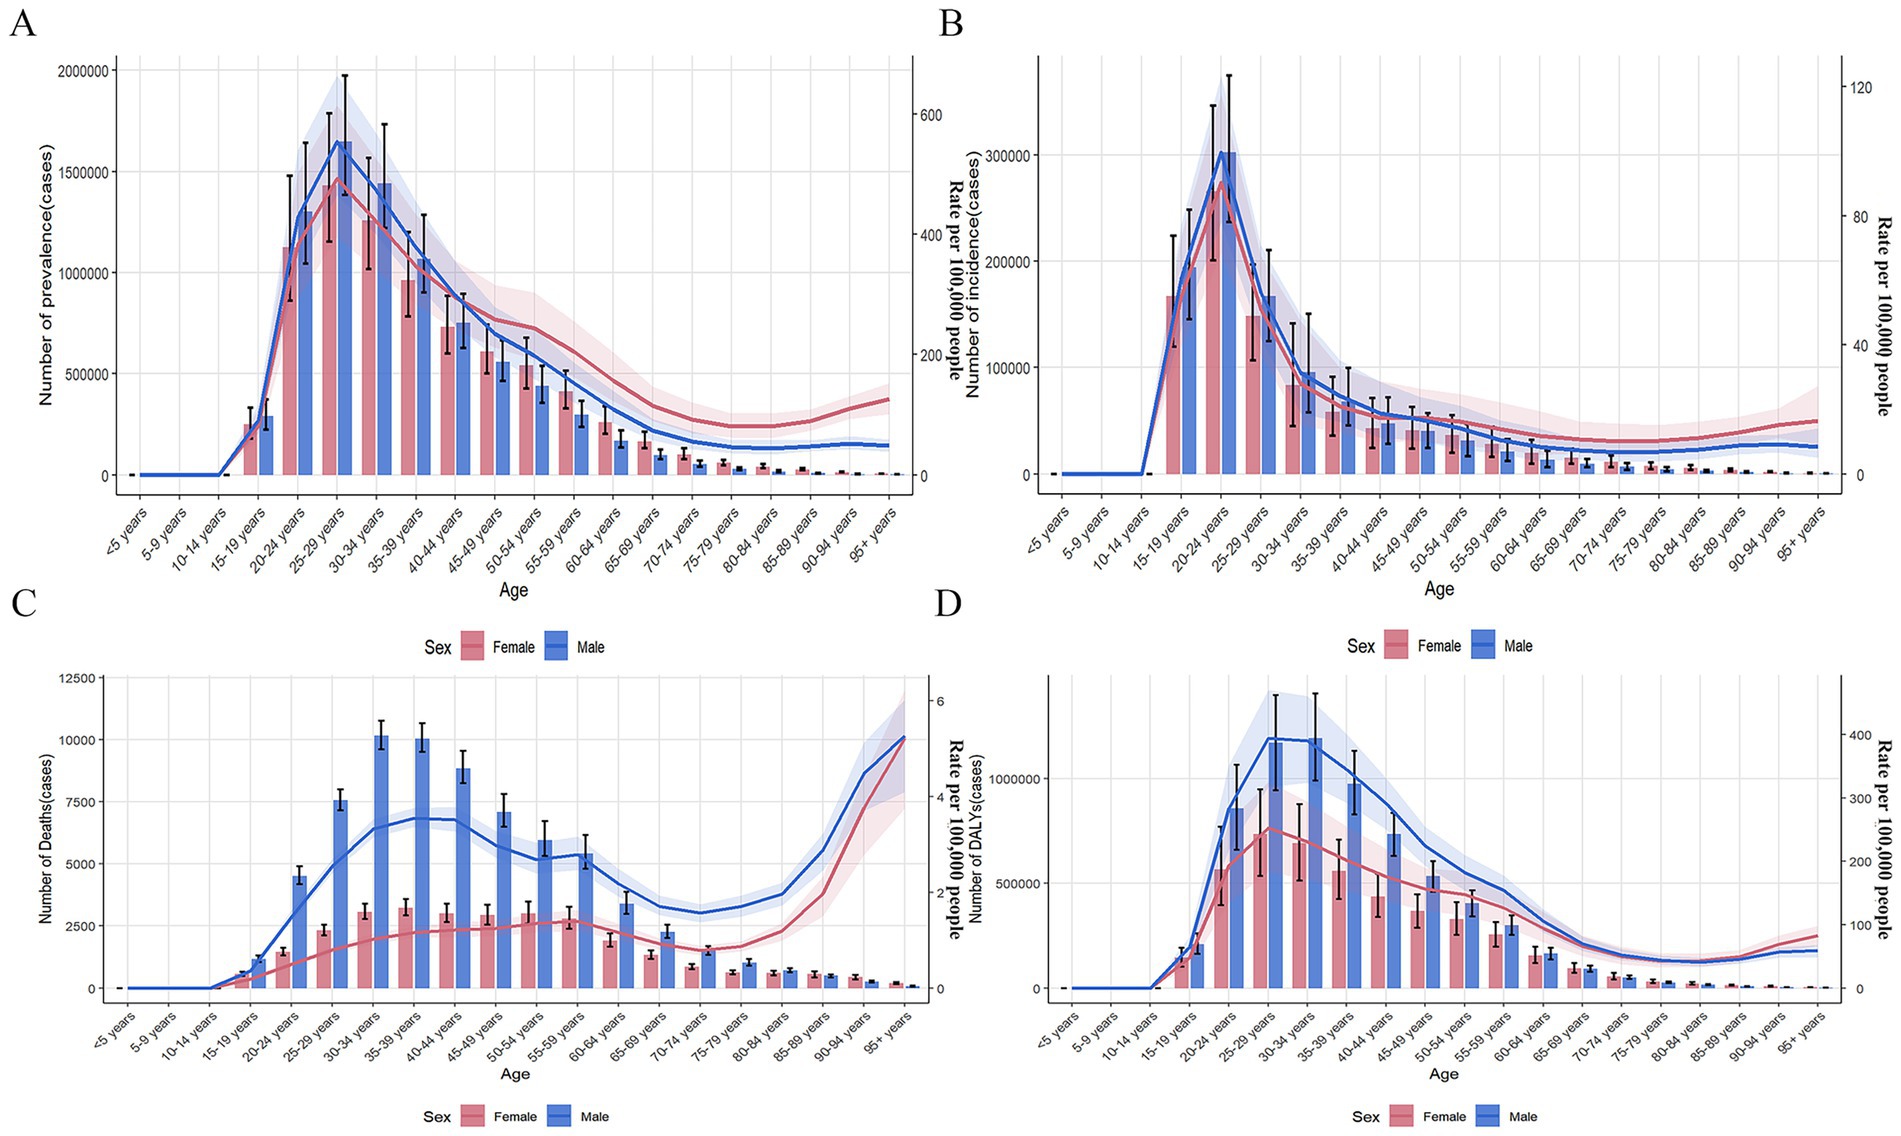
Figure 1. Burden of opioid use disorder by age group in global. (A) Prevalence, (B) Incidence, (C) Death, (D) DALYs. DALYs: disability-adjusted life years.
Regardless of gender, the number of prevalence, DALYs, ASPR, and age-standardized DALYs rate of OUD increased with age before 29 years old and decreased with age after 29 years old (Figures 1A,D). The number of incidence and ASIR of OUD increased with age before 24 years old and decreased with age after 24 years old (Figure 1B). The number of female OUD deaths increased with age before 39 years old and decreased with age after 39 years old, while the ASDR of female OUD showed an upward trend (Figure 1C). The number of male OUD deaths increased with age before 34 years old and decreased with age after 34 years old; the ASDR of male OUD showed an upward trend before 44 years old, a downward trend between 45 and 74 years old, and increased with age after 74 years old.
3.3 Decomposition analysis of OUD burden
In terms of incident cases, globally, population growth contributed 91.37% and epidemiological changes contributed 9.73% to the increase in the burden of OUD. Aging showed a positive contribution only in the high SDI regions (4.79%). Population growth had the largest positive contribution in the middle SDI regions (444.36%) and the largest negative contribution in the high-middle SDI regions (−686.41%). Epidemiological changes had the largest contribution in the high-middle SDI regions (787.75%) (Figure 2A; Supplementary Table 1).
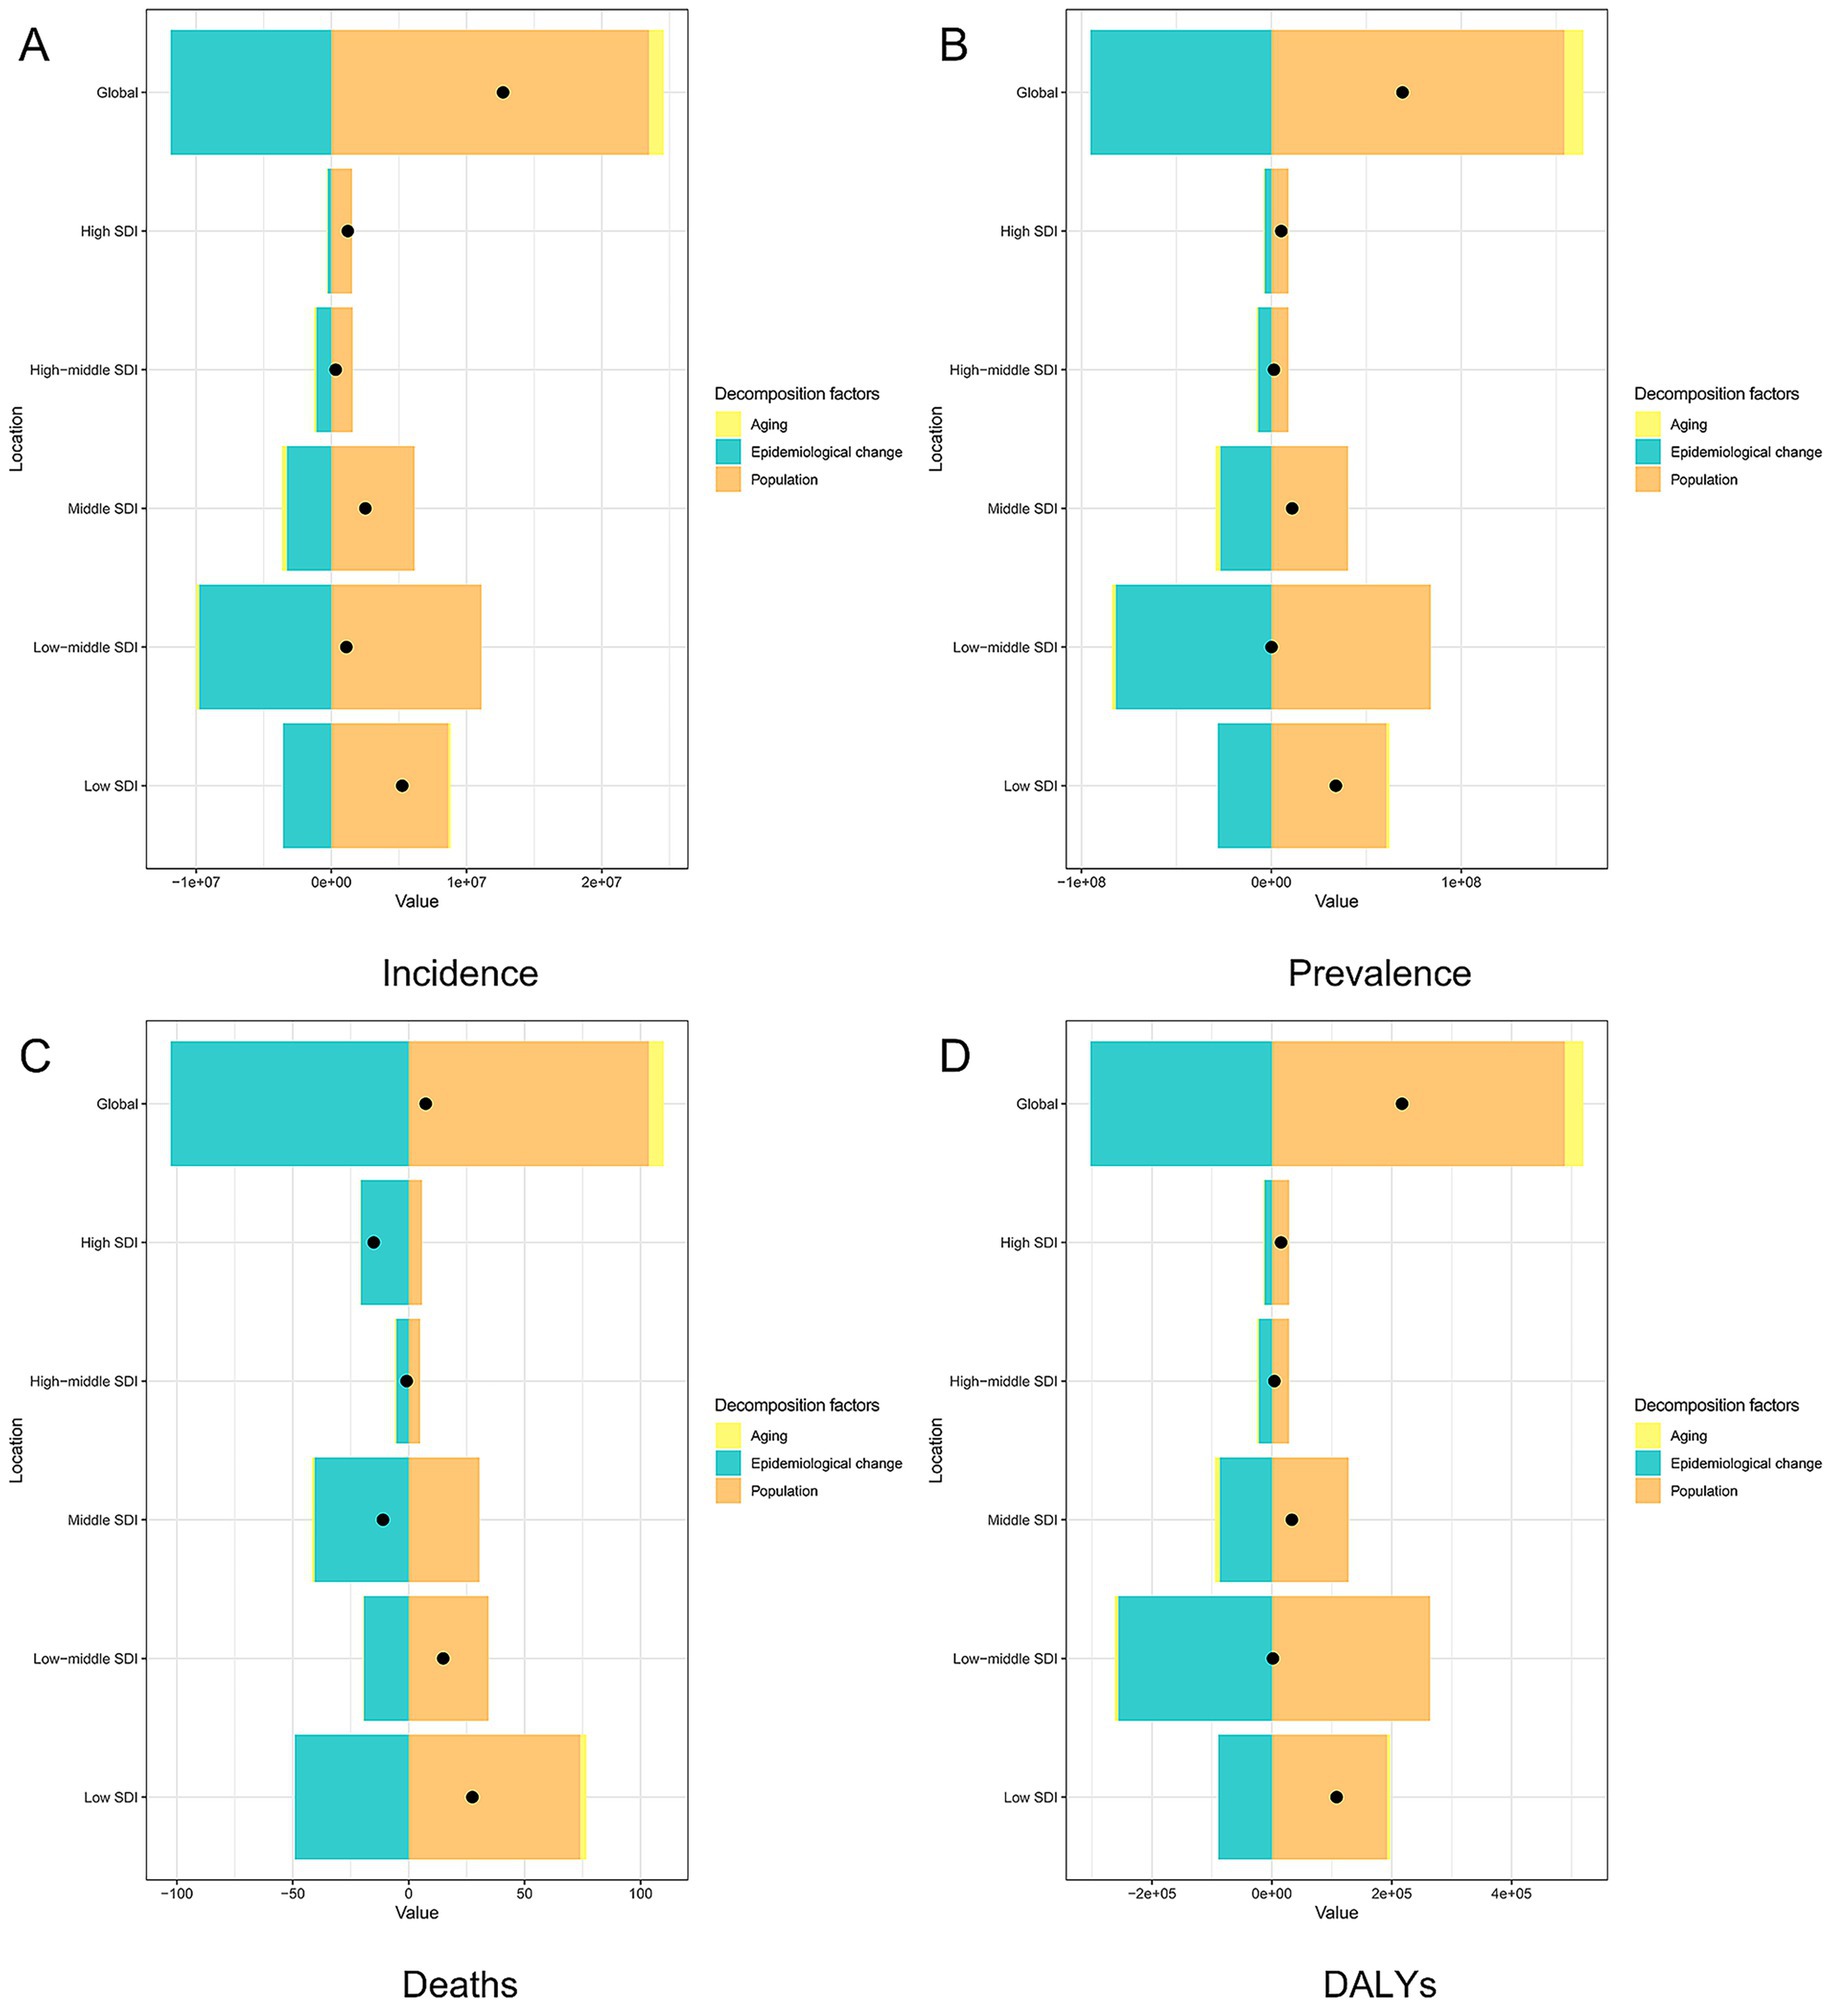
Figure 2. Decomposition analysis of opioid use disorder burden in global and five SDI regions. (A) Incidence, (B) Prevalence, (C) Death, (D) DALYs. SDI: social demographic index, DALYs: disability-adjusted life years.
In terms of prevalent cases, globally, aging contributed 1.29%, population growth contributed 61.74%, and epidemiological changes contributed 36.97% to the increase in the burden of OUD. The contribution of aging varied across different SDI regions: low-middle SDI regions showed a negative contribution of −11.41%, while high-middle SDI regions showed a positive contribution of 23.05%. Population growth had the largest negative contribution in the middle SDI regions (−715.37%) and the largest positive contribution in the low-middle SDI regions (99.29%). Epidemiological changes consistently showed positive contributions in all five SDI regions, with the largest contribution in the high-middle SDI regions (288.7%) (Figure 2B; Supplementary Table 1).
In terms of deaths cases, globally, aging contributed 4.23%, population growth contributed 51.86%, and epidemiological changes contributed 43.91% to the increase in the burden of OUD. The contribution of aging varied across different SDI regions: middle SDI regions showed a negative contribution of −0.96%, while high-middle SDI regions showed a positive contribution of 7.98%. Population growth had the largest negative contribution in the middle SDI regions (−111.15%) and the largest positive contribution in the low SDI regions (80.54%). Epidemiological changes consistently showed positive contributions in all five SDI regions, with the largest contribution in the high-middle SDI regions (203.17%) (Figure 2C; Supplementary Table 1).
In terms of DALYs, globally, aging contributed 1.53%, population growth contributed 58.02, and epidemiological changes contributed 40.45% to the increase in the burden of OUD. Aging showed a negative contribution only in the low-middle SDI regions (−9.19%). Population growth had the largest negative contribution in the middle SDI regions (−137.17%) and the largest positive contribution in the low-middle SDI regions (94.81%). Epidemiological changes consistently showed positive contributions in all five SDI regions, with the largest contribution in the high-middle SDI regions (222.62%) (Figure 2D; Supplementary Table 1).
3.4 APC model of OUD
After controlling for period and cohort effects, the results of age effects showed that the global prevalence, incidence and DALYs rates of OUD exhibited a trend of first increasing, then decreasing, and then increasing again (Figures 3A, 4A, 5A). It increased with age among people aged 20–30, decreased with age among those aged 30–80, and increased with age among people over 80. The deaths rate of OUD increased with age among people aged 20–30, remained stable among those aged 30–80, and increased with age among people over 80 (Figure 6A). Globally, the period rate ratio (RR) for OUD prevalence rate and DALYs rate showed an upward trend in cohorts born before 2000–2005, a downward trend with increasing birth years in cohorts born after 2000–2005, and an upward trend with increasing birth years in cohorts born after 2010–2015 (Figures 3B, 5B). The period RR of incidence rate showed an upward trend in cohorts born before 2000–2005, then a downward trend, and another upward trend in cohorts born after 2015–2020 (Figure 4B). The period RR of deaths rate showed an upward trend in cohorts born before 1995–2000, then a downward trend, and another upward trend in cohorts born after 2010–2015 (Figure 6B). After controlling for age and period effects, the cohort RR for OUD prevalence rate and incidence rate both showed an upward trend (Figures 3C, 4C), while those for mortality and DALYs showed a downward trend (Figures 6C, 5C).
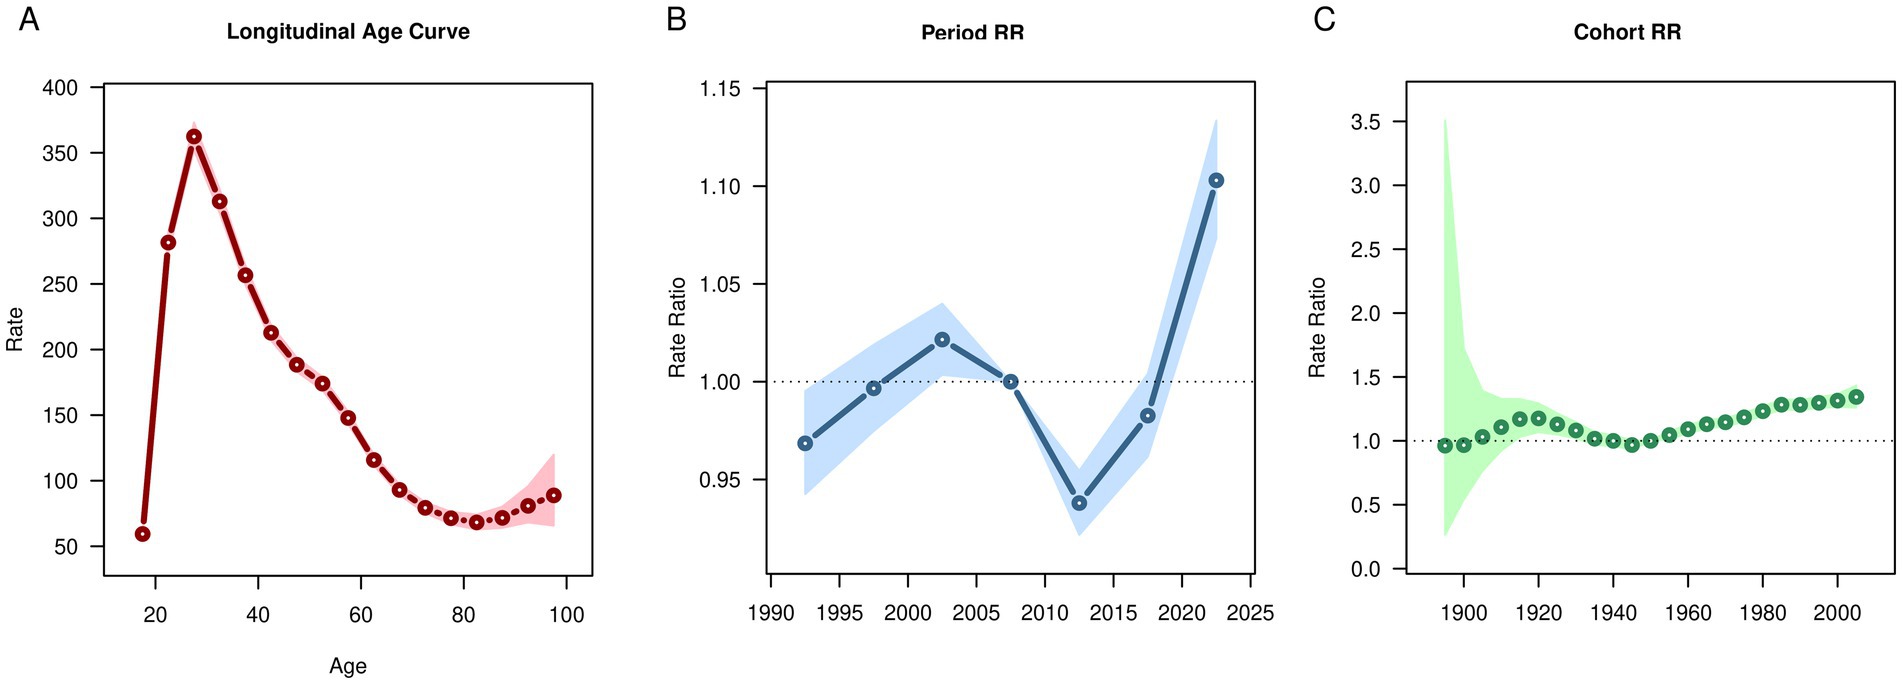
Figure 3. Age, period, cohort effects on opioid use disorder prevalence in global during 1990–2021. (A) Age effect, (B) Period effect; (C) Cohort effect.
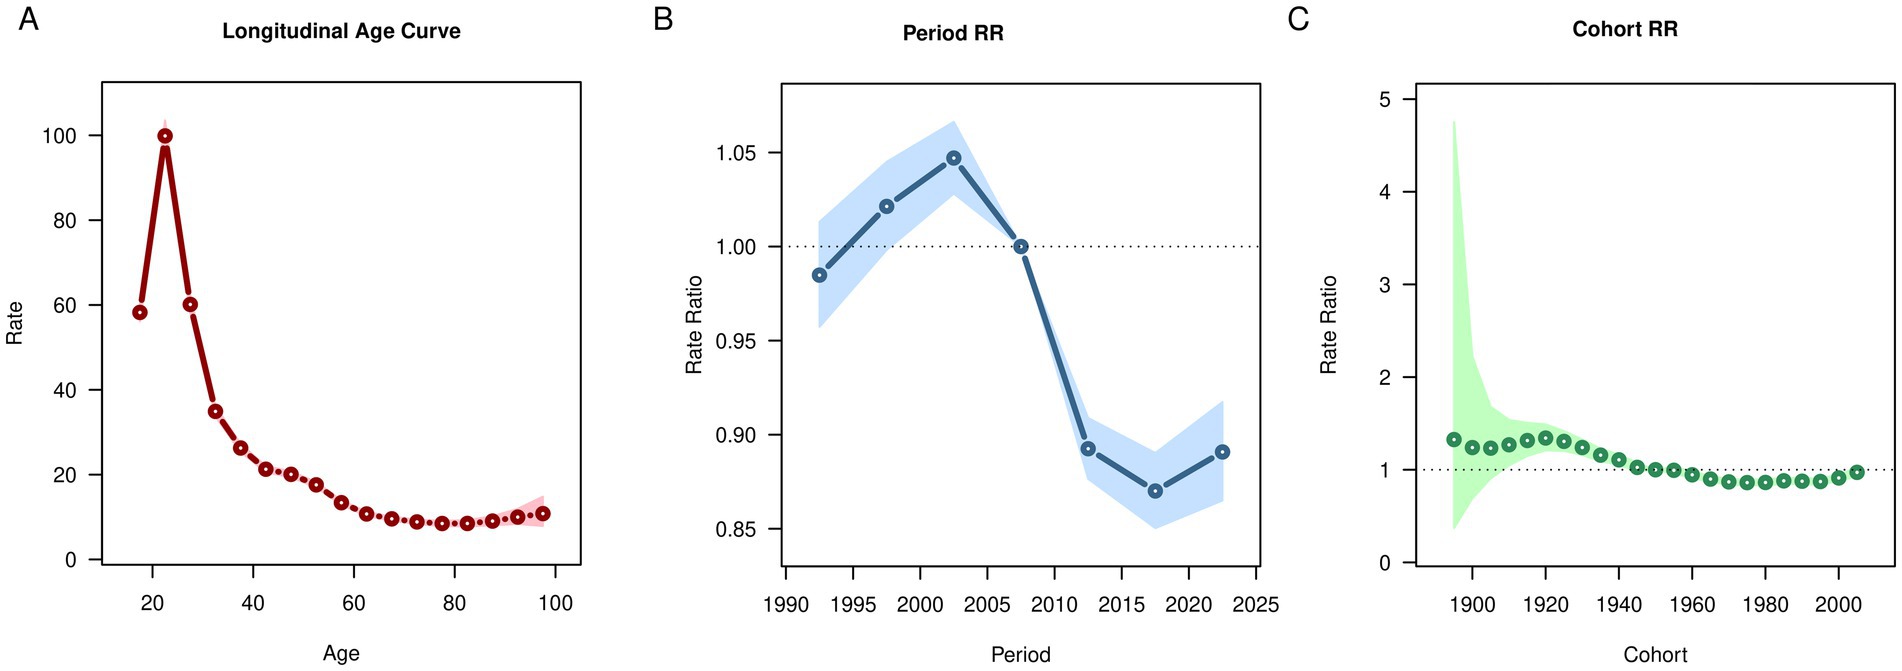
Figure 4. Age, period, cohort effects on opioid use disorder incidence in global during 1990–2021. (A) Age effect, (B) Period effect; (C) Cohort effect.
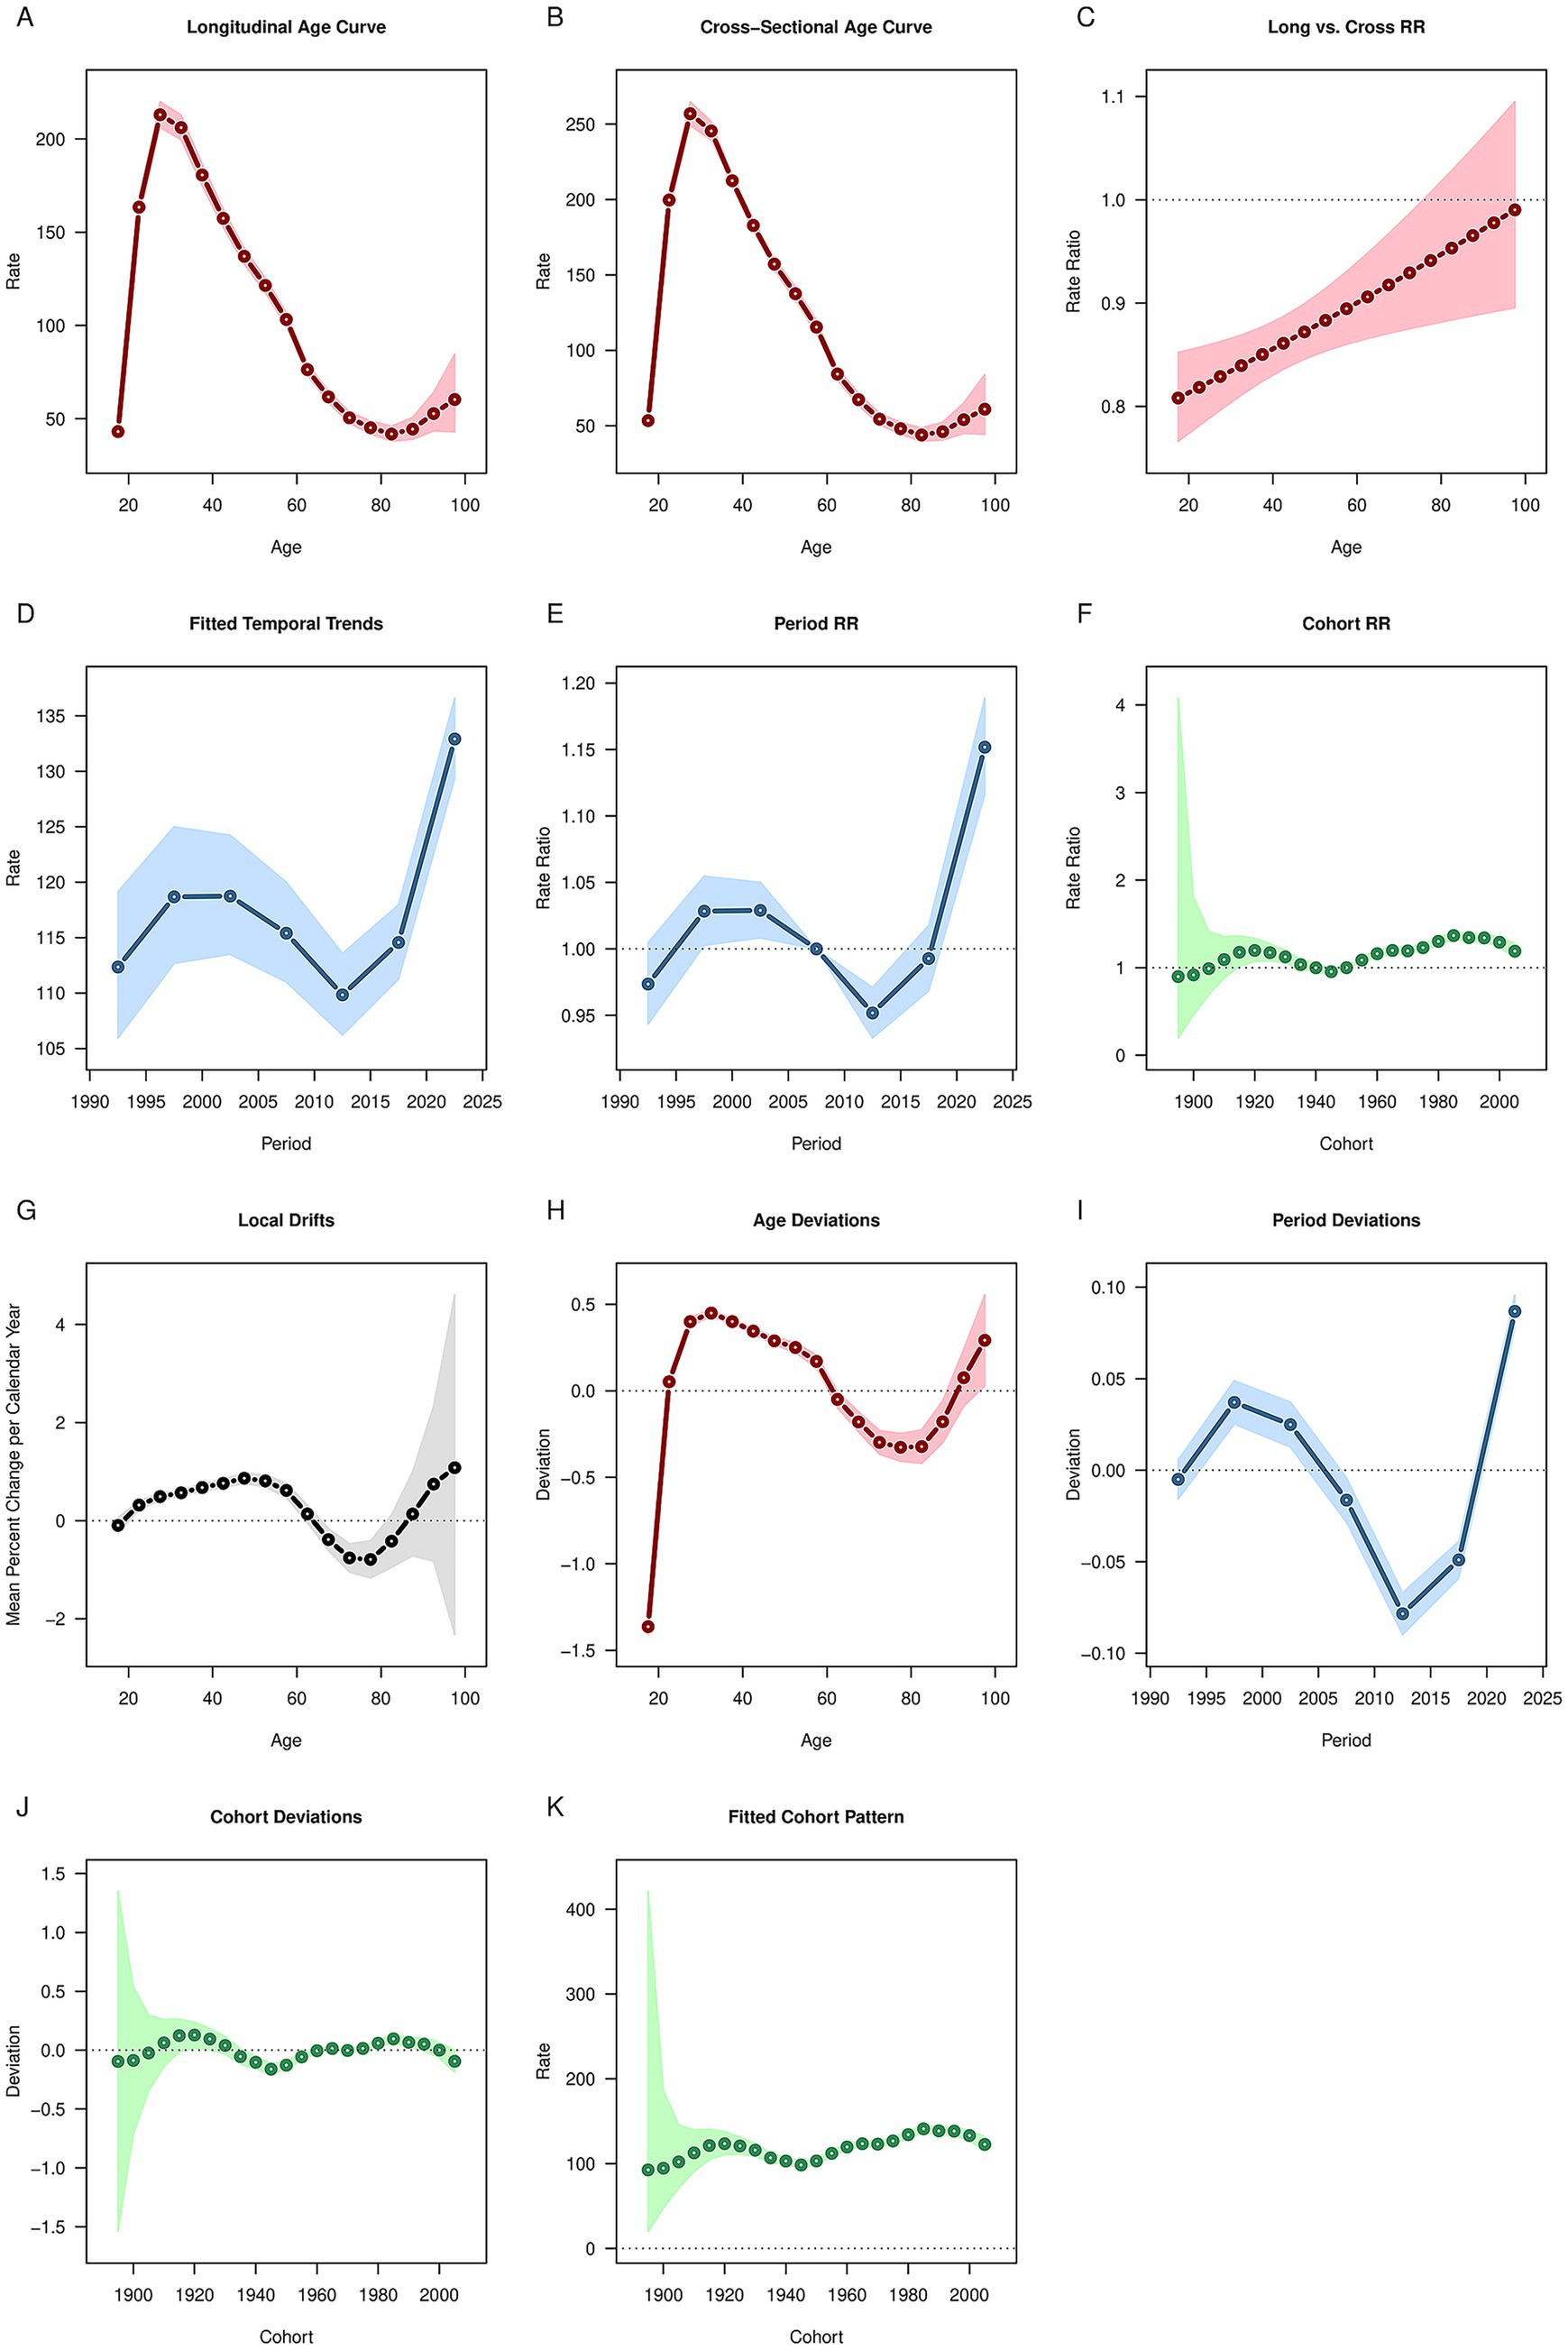
Figure 5. Age, period, cohort effects on opioid use disorder DALYs in global during 1990–2021. (A) Age effect, (B) Period effect; (C) Cohort effect. DALYs: disability-adjusted life years.
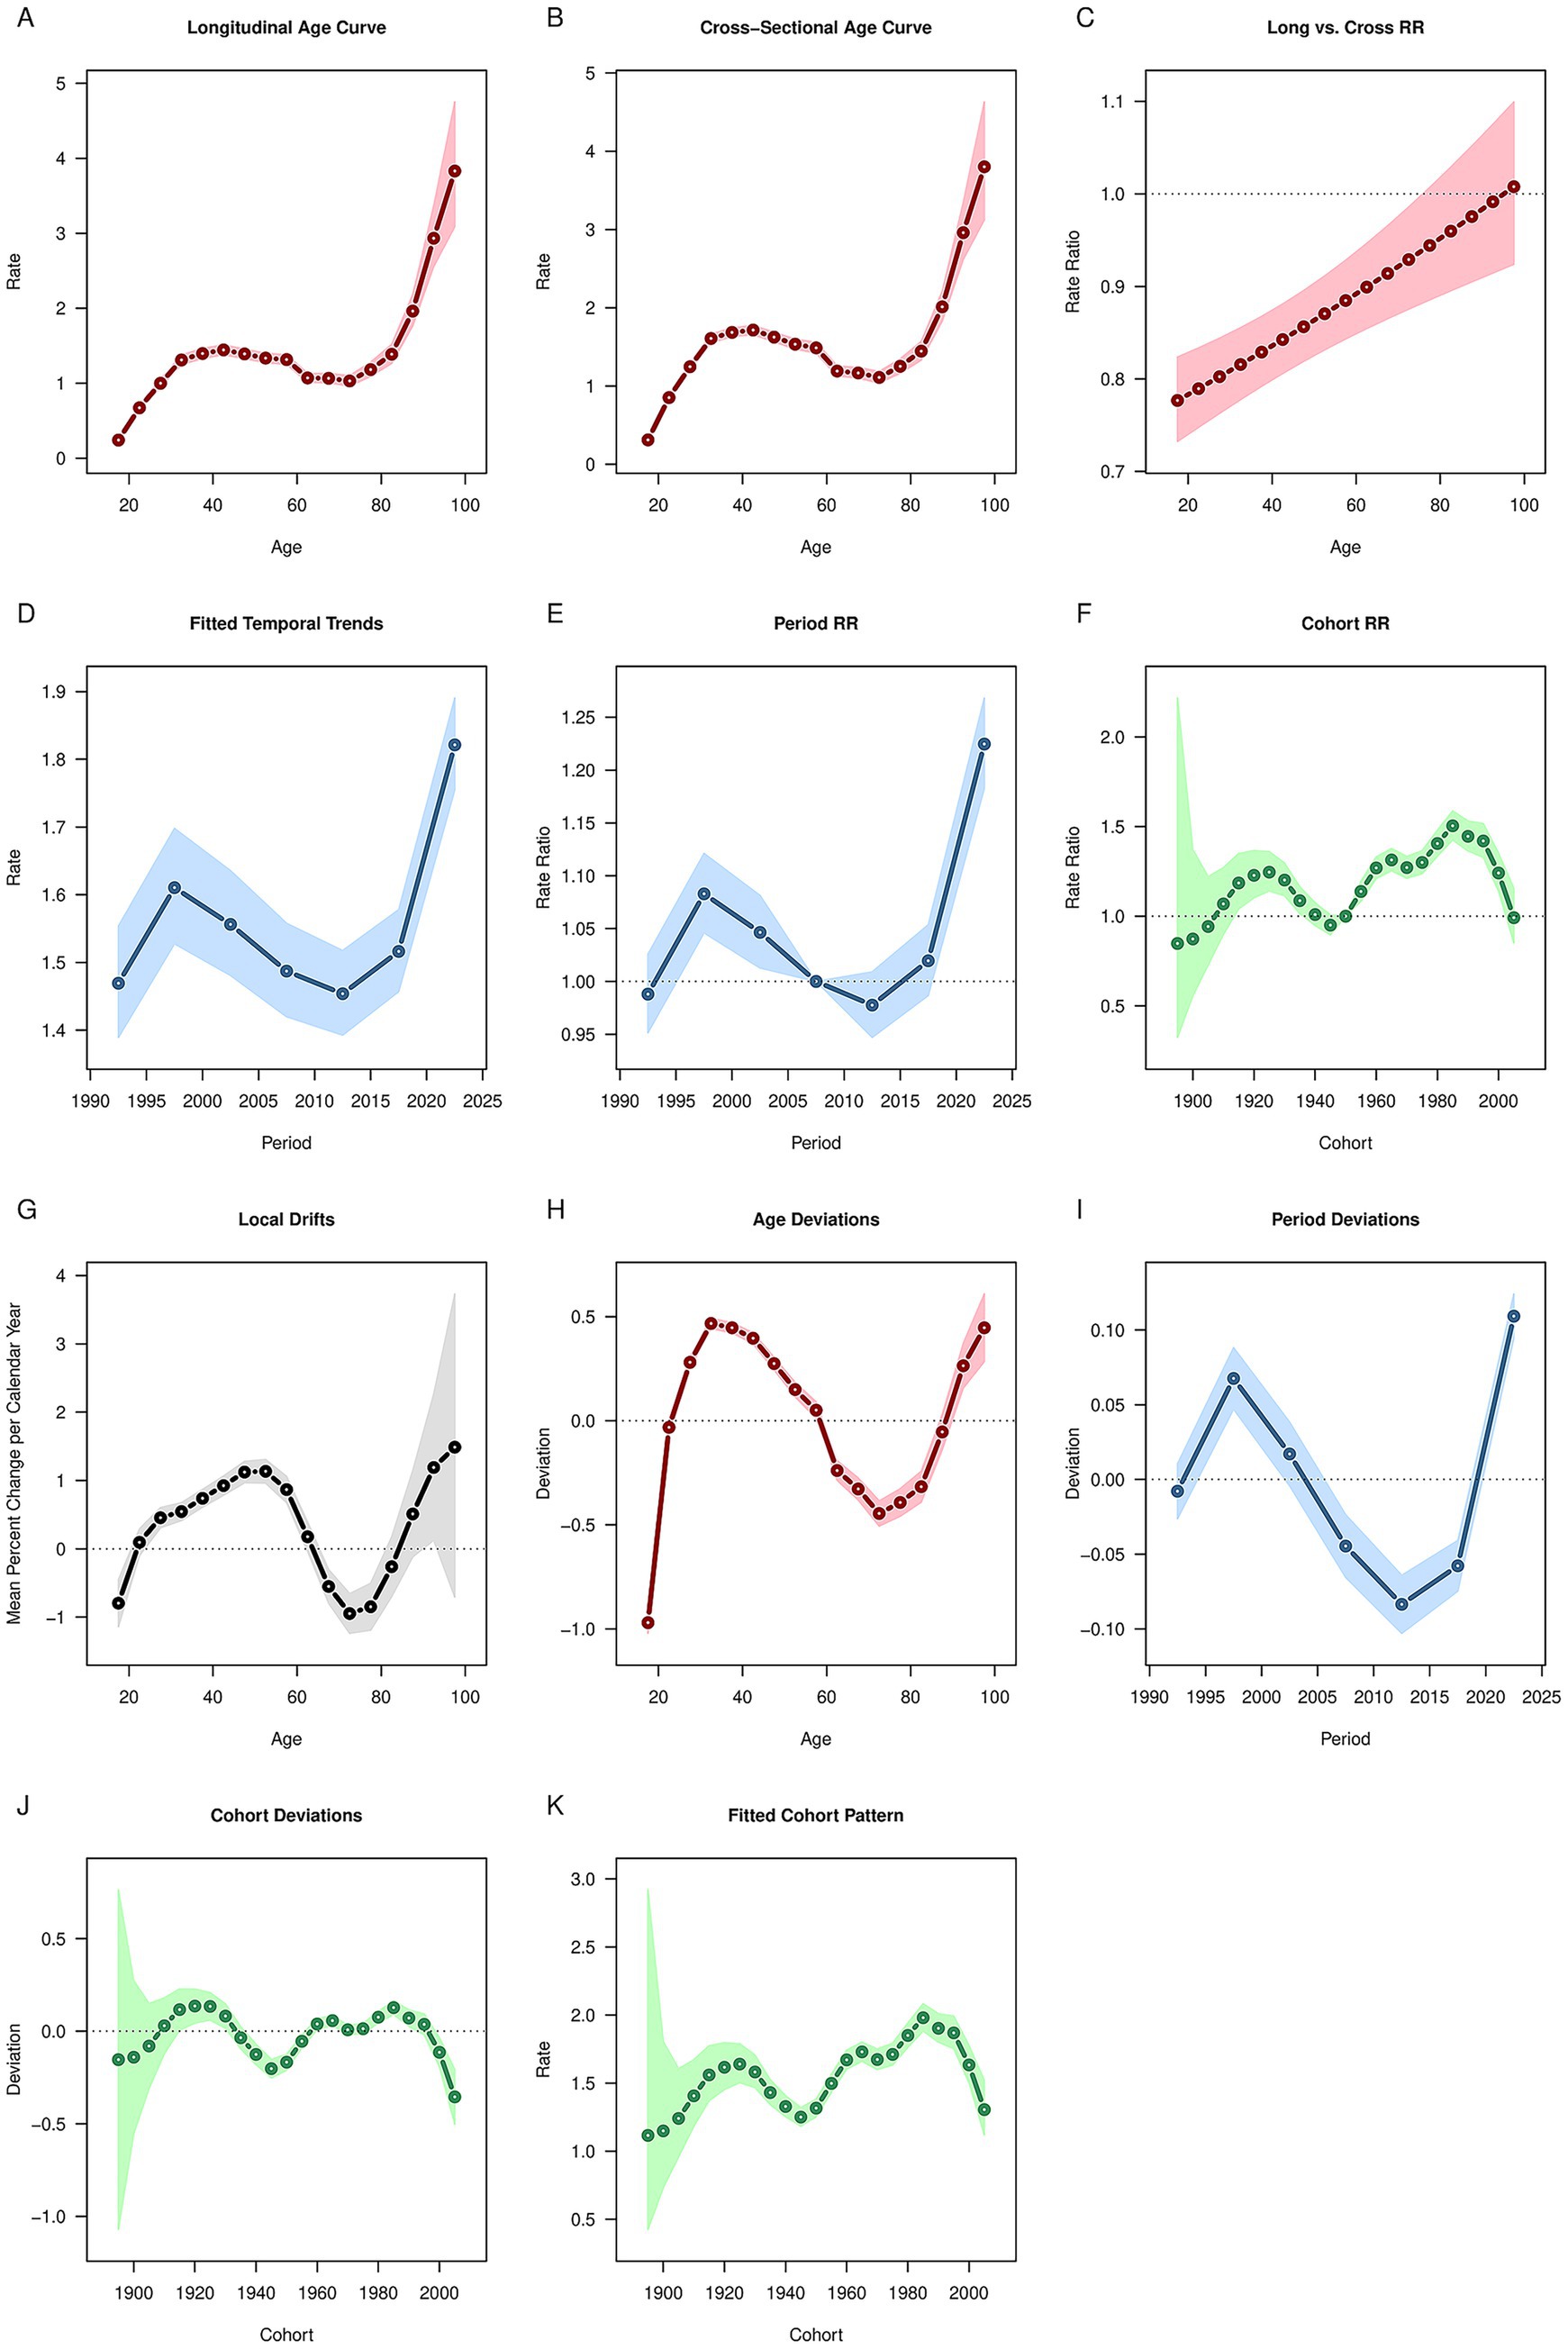
Figure 6. Age, period, cohort effects on opioid use disorder deaths in global during 1990–2021. (A) Age effect, (B) Period effect; (C) Cohort effect.
3.5 Future prediction of OUD burden
Regardless of gender, the future global burden of OUD shows a steady upward trend (Figure 7). Among females, the ASPR, ASIR, ASDR, and age-standardized DALYs rate for OUD are projected to rise from 196.63, 23.92, 0.68, and 109.68 per 100,000 people in 2021 to 339.46, 45.44, 0.94, and 150.08 per 100,000 people in 2050, respectively (Figures 7A–D). For males, the predicted ASPR, ASIR, ASDR, and age-standardized DALYs rate for OUD in 2050 are 239.62, 31.98, 2.42, and 206.44 per 100,000 people, respectively (Figures 7E–H).
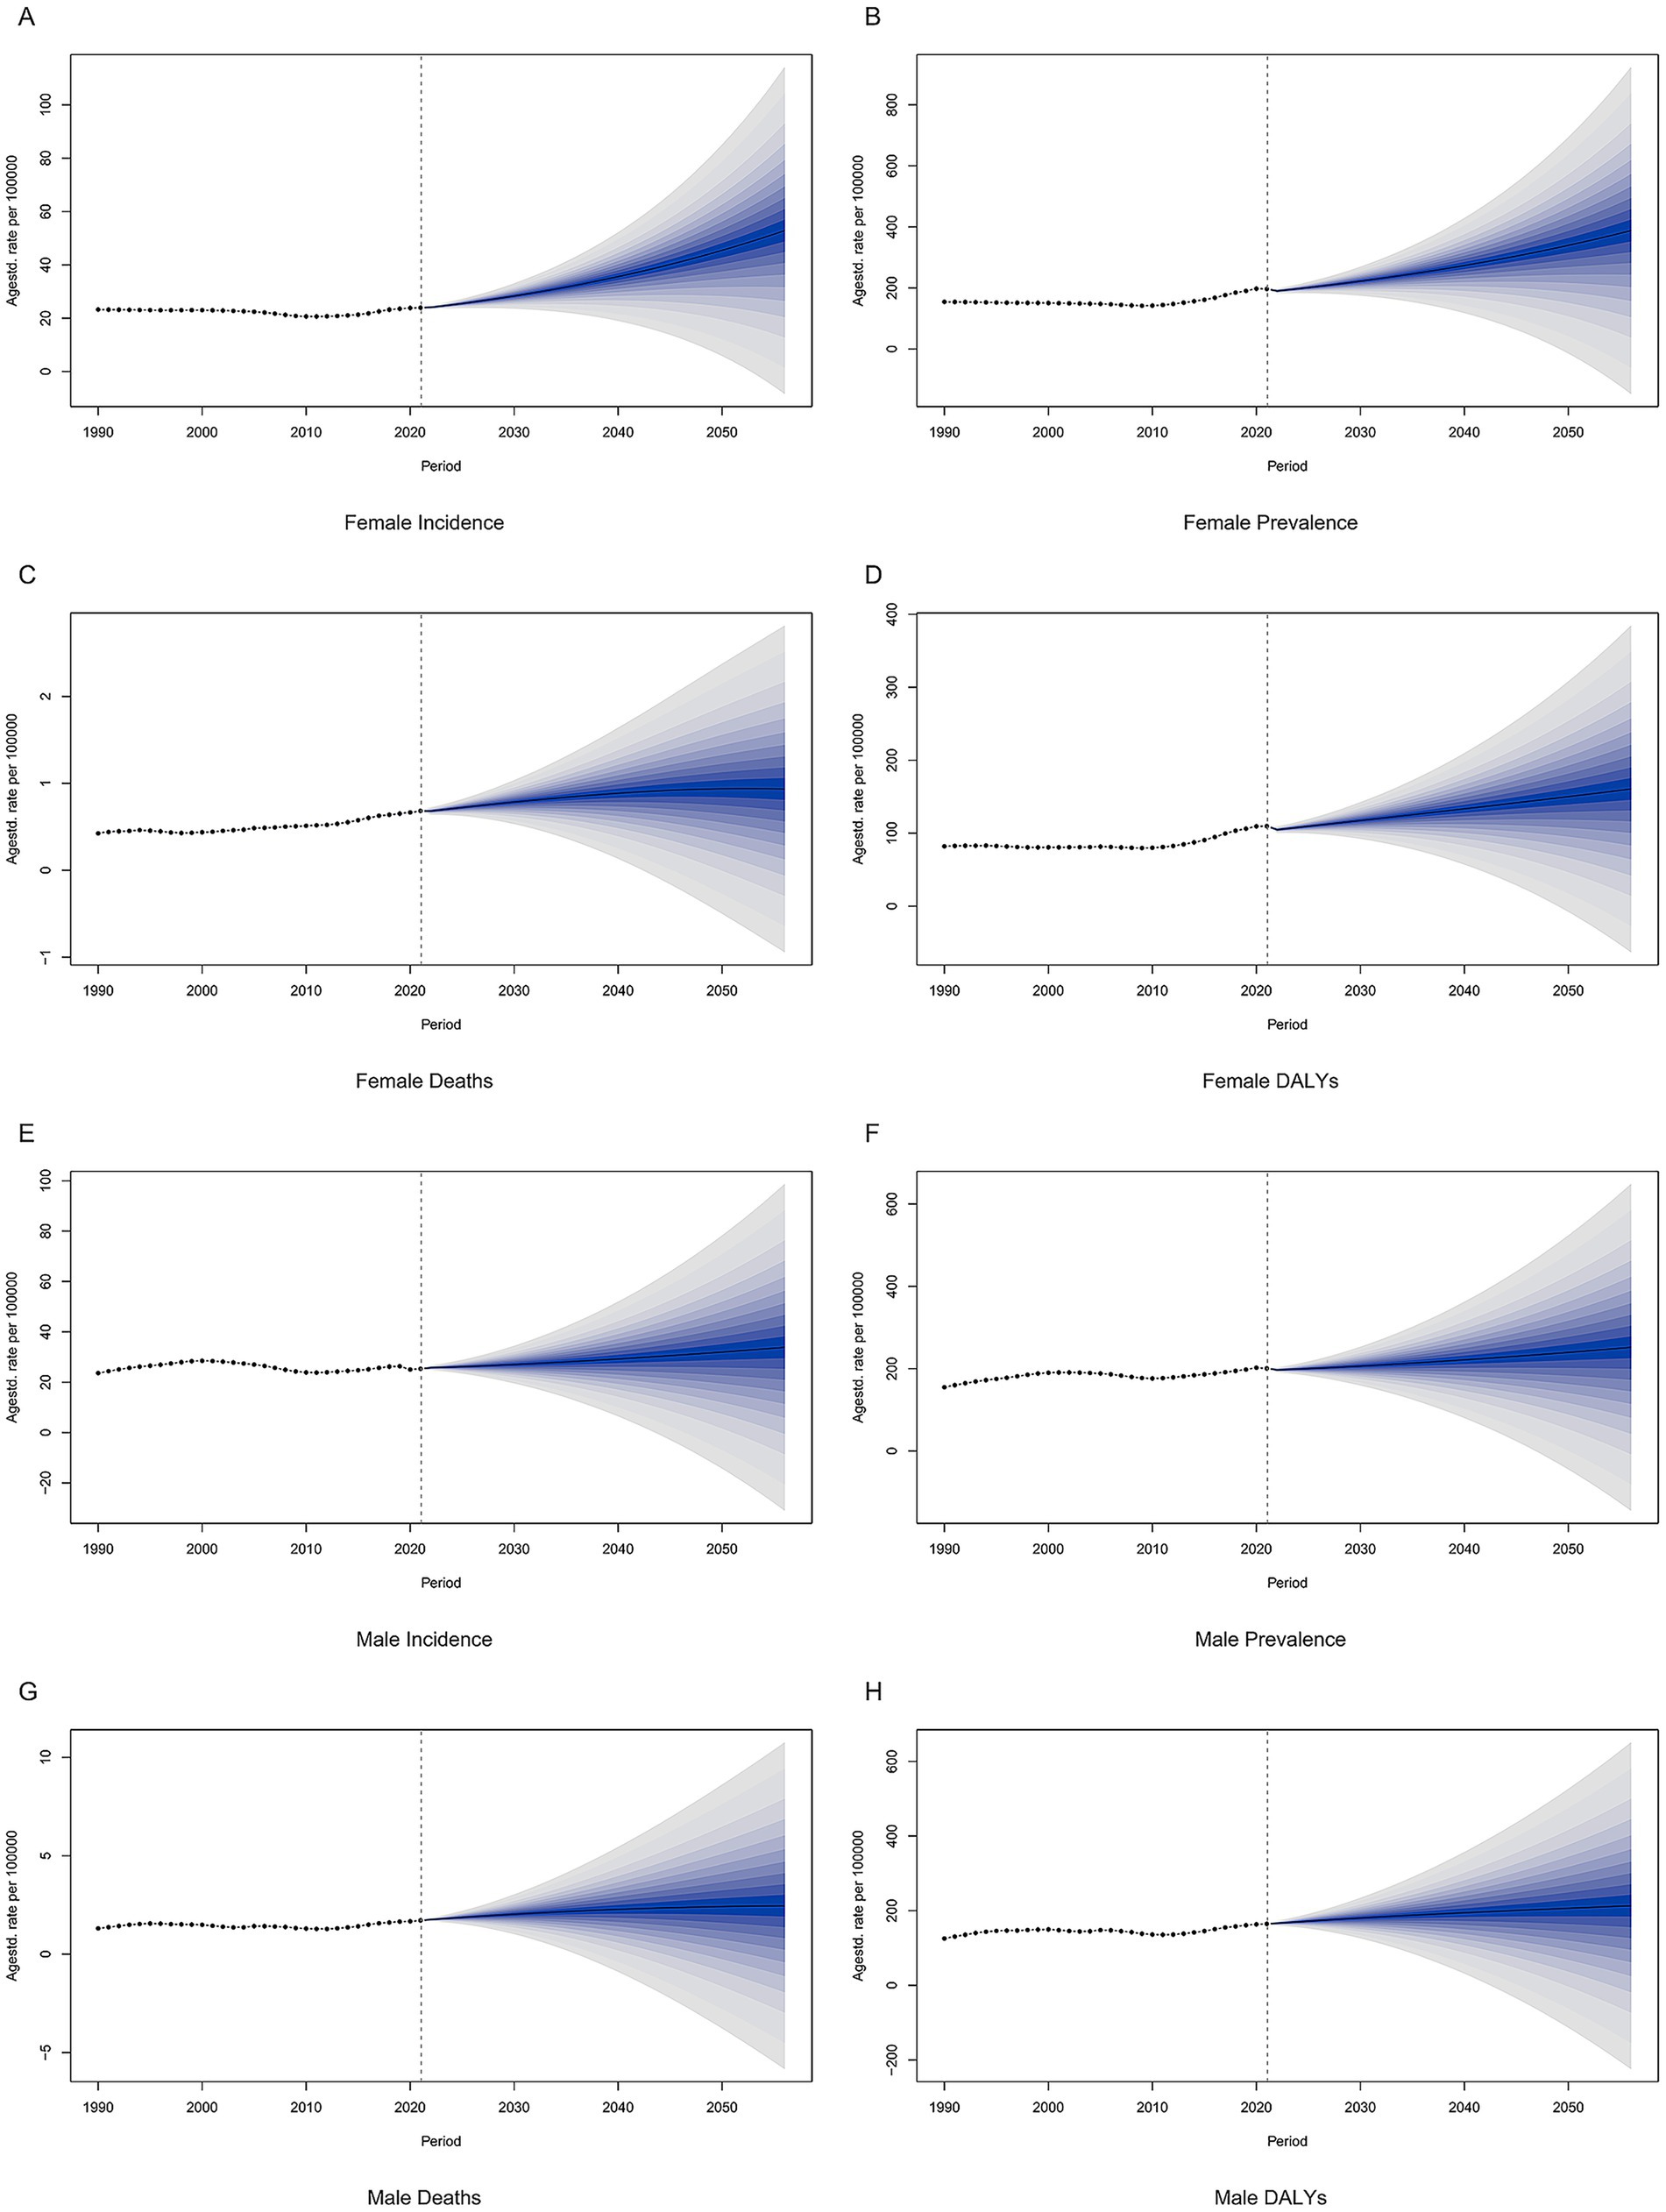
Figure 7. Projections of global opioid use disorder burden in the future. (A) Female incidence, (B) Female prevalence, (C) Female deaths, (D) Female DALYs, (E) Male incidence, (F) Male prevalence, (G) Male deaths, (H) Male DALYs. DALYs: disability-adjusted life years.
4 Discussion
This study used the GBD 2021 database to assess the global, regional patterns and trends in the burden of OUD over a 31-year period and found that the global burden of OUD in terms of ASPR, ASDR, and age-standardized DALYs rate showed an upward trend, while the burden of OUD in terms of ASIR showed a downward trend, and the future prediction results showed that the global burden of OUD would show an upward trend in both males and females. Our results indicated the huge global burden of OUD, and active prevention and intervention measures need to be taken to reduce the burden of OUD.
Among the 21 GBD regions, the burden of OUD in High-income North America increased the fastest from 1990 to 2021, while that in East Asia decreased the fastest. This discrepancy is closely related to the implementation effectiveness of different prevention levels in the two types of regions. For primordial prevention, East Asian regions have reduced drug availability at the source through strict regulation of the production, distribution, and use of opioids (such as classified control and approval supervision systems) (13–15). In contrast, the over-marketing of prescription opioids and the proliferation of illicit opioids (e.g., fentanyl) in High-income North America have significantly increased exposure risks (16–19). For primary prevention (reducing demand): East Asia’s public health education system emphasizes the harms of substance abuse (20), whereas High-income North America lacked large-scale public awareness campaigns in the early stages. It was not until the 2000s, when the Centers for Disease Control and Prevention (CDC) updated its pain management guidelines (emphasizing the priority of non-opioid medications), that such efforts were gradually strengthened (21). For secondary prevention (early screening and intervention): High-income North America has insufficient early screening for high-risk occupational groups (e.g., construction and machinery workers) (22), while East Asia identifies at-risk individuals earlier through occupational health monitoring and community-based screening. For tertiary prevention (treatment and rehabilitation): East Asia has established a comprehensive continuum of drug detoxification treatment (e.g., detoxification centers integrating medication, psychological support, and rehabilitation training) (23, 24). Although High-income North America has emergency measures such as naloxone (e.g., the Take-home Naloxone program), it faces low accessibility and continuity of treatment (25).
This study also found that the burden of OUD in males was higher than that in females. Studies have shown that males are more likely to escalate to high-dose treatment when starting opioid therapy for chronic non-cancer pain and are more likely to die from opioid poisoning (26). In terms of occupation, males were more engaged in high-risk industries such as construction, material handling, processing, and machinery, and the proportion of people in these occupational groups who use opioids due to work-related injuries is also higher (27). This study found that the burden of OUD was heavier in young people, especially in the 20–24 age group. The risk of OUD usually begins in adolescence and young adulthood, with two-thirds of people receiving treatment for OUD reporting that their first use was before the age of 25, and one-third reporting that it was before the age of 18 (28). Notably, older adult males also faced a relatively high risk. This is mainly associated with age-related physiological changes, including the decline in liver and kidney function, which slows down drug metabolism and reduces clearance rate—making them more prone to drug accumulation and poisoning (29, 30). Meanwhile, older adult males often suffer from multiple chronic diseases (such as chronic obstructive pulmonary disease and cardiovascular diseases), and the side effects of opioids (e.g., respiratory depression and sedation) can have a synergistic effect with these underlying conditions, significantly increasing the risks of falls, fractures, and mortality (29). In addition, polypharmacy is extremely common among older adult males; the interaction between opioids and benzodiazepines or other central nervous system depressants further amplifies the risks of overdose and accidental injury (30). This phenomenon urgently highlights the need for targeted intervention measures and early intervention strategies.
The results of the decomposition analysis showed that population increase and epidemiological changes contributed more to the increase in the burden of OUD in global. Population growth not only affects the absolute number of OUD but may also indirectly affect the epidemic trend of OUD by changing the population structure and age distribution (31). The growth of the global population has directly expanded the size of the “potential at-risk population.” The increase in total population will lead to a rise in the absolute number of OUD cases, thereby pushing up the overall disease burden. The epidemiological changes involved multi-dimensional factors: regarding the evolution of opioid prescribing practices, since the 1990s, some high-income countries (particularly in North America) have had relatively loose regulations on the prescription of opioid analgesics, which led to the widespread circulation of opioids for medical use and laid hidden risks for addiction and abuse (32); although multiple guidelines (e.g., the U.S. CDC’s Guidelines for Prescribing Opioids for Chronic Pain) tightened prescribing policies after the 2000s, the dependency issues accumulated in the past continue to exert an impact (33). In terms of the expansion of the illicit opioid market, the proportion of illicitly synthesized opioids (e.g., fentanyl) in the global drug market has increased significantly in recent years (34); such drugs are highly potent and low-cost, and are often mixed into other drugs, resulting in a sharp rise in the risks of accidental overdose and addiction (35). As for regional disparities and healthcare accessibility, regions with the high SDI regions bear the heaviest burden of OUD due to historical prescribing practices and relatively high drug accessibility, while regions with a low-to-middle SDI show a rapid growth trend in OUD, driven by the infiltration of the illicit market and insufficient treatment resources (35).
Based on the APC analysis, the age effect presents a bimodal pattern, with a rise in the 20–30 age group, a decline between 30 and 80 years old, and a subsequent increase again in those aged over 80. The high risk among the 20–30 years-old young population is associated with risk-taking behaviors, social exposure, and neurodevelopmental sensitivity; the declining risk in the middle-aged to older adult group (30–80 years old) may reflect the role of clinical interventions (such as methadone maintenance treatment) and natural withdrawal. In contrast, the resurgence of risk in people over 80 is linked to age-related needs for chronic pain management, polypharmacy, and cognitive decline—factors that may lead to misuse and dose accumulation (35). The period RR of global OUD prevalence, incidence, and DALY rate all showed a downward trend. This is inseparable from the strengthened global regulation on the use of opioids. In 2000, the U.S. CDC updated its guidelines for the treatment of chronic pain, emphasizing non-opioid drugs as the first-line treatment and putting forward stricter restrictions on the use of opioids (21). Naloxone counteracts the pharmacological and toxic effects of opioids by blocking the binding of opioids to receptors and is a key drug in addressing opioid-related risks. Take-home naloxone (THN) originated in 1991 and began to be implemented at the state or national level after 2000 (36). In terms of public education, countries have also begun to strengthen the publicity and education on the problem of opioid abuse, which has a positive impact on the public’s perception of the opioid crisis and promotes a deeper understanding of the problem (37).
There are several limitations that need to be discussed. First, this study was based on GBD 2021, which is not derived from raw data, but uses a variety of mathematical models and combines a large amount of data to make predictions about the burden of disease, so the results may be biased, and second, although GBD 2021 covers 204 countries and regions, variations in data availability and quality across regions may affect the accuracy of the analysis. Particularly in areas with low SDI, insufficient medical resources and limitations in data collection may lead to underestimation of OUD cases, final, when predicting future burdens, the study failed to consider the impact of other factors.
5 Conclusion
Our study emphasized that the burden of OUD is on an upward trend, both from 1990 to 2021 and projected to 2050. At the regional level, the burden was most severe in high-income North America. In addition, the burden of OUD was relatively heavy among young populations and male populations. Population growth and epidemiological changes contributed significantly to the increase in the burden of OUD. These findings underscore the urgency of formulating targeted public health strategies to mitigate the escalating OUD burden.
Data availability statement
Publicly available datasets were analyzed in this study. This data can be found at: https://ghdx.healthdata.org/gbd-2021.
Author contributions
JC: Methodology, Conceptualization, Writing – original draft. RL: Formal analysis, Writing – review & editing, Data curation. GH: Visualization, Investigation, Writing – review & editing. WH: Writing – review & editing, Supervision, Project administration.
Funding
The author(s) declare that no financial support was received for the research and/or publication of this article.
Conflict of interest
The authors declare that the research was conducted in the absence of any commercial or financial relationships that could be construed as a potential conflict of interest.
Generative AI statement
The authors declare that no Gen AI was used in the creation of this manuscript.
Any alternative text (alt text) provided alongside figures in this article has been generated by Frontiers with the support of artificial intelligence and reasonable efforts have been made to ensure accuracy, including review by the authors wherever possible. If you identify any issues, please contact us.
Publisher’s note
All claims expressed in this article are solely those of the authors and do not necessarily represent those of their affiliated organizations, or those of the publisher, the editors and the reviewers. Any product that may be evaluated in this article, or claim that may be made by its manufacturer, is not guaranteed or endorsed by the publisher.
Supplementary material
The Supplementary material for this article can be found online at: https://www.frontiersin.org/articles/10.3389/fpubh.2025.1682094/full#supplementary-material
Footnotes
1. ^https://www.unodc.org/unodc/en/data-and-analysis/world-drug-report-2023.html
2. ^https://ghdx.healthdata.org/gbd-2021
3. ^https://ghdx.healthdata.org/record/global-burden-disease-study-2021-gbd-2021-socio-demographic-index-sdi-1950%E2%80%932021
References
1. Volkow, ND, and Blanco, C. Medications for opioid use disorders: clinical and pharmacological considerations. J Clin Invest. (2020) 130:10–3. doi: 10.1172/JCI134708
2. Sanger, N, Bhatt, M, Singhal, N, Panesar, B, D'Elia, A, Trottier, M, et al. Treatment outcomes in patients with opioid use disorder who were first introduced to opioids by prescription: a systematic review and meta-analysis. Front Psych. (2020) 11:812. doi: 10.3389/fpsyt.2020.00812
3. Hoffman, KA, Ponce Terashima, J, and McCarty, D. Opioid use disorder and treatment: challenges and opportunities. BMC Health Serv Res. (2019) 19:884. doi: 10.1186/s12913-019-4751-4
4. Shen, J, Hua, G, Li, C, Liu, S, Liu, L, and Jiao, J. Prevalence, incidence, deaths, and disability-adjusted life-years of drug use disorders for 204 countries and territories during the past 30 years. Asian J Psychiatr. (2023) 86:103677. doi: 10.1016/j.ajp.2023.103677
5. Zhang, T, Sun, L, Yin, X, Chen, H, Yang, L, and Yang, X. Burden of drug use disorders in the United States from 1990 to 2021 and its projection until 2035: results from the GBD study. BMC Public Health. (2024) 24:1639. doi: 10.1186/s12889-024-19142-0
6. Deng, Y, Zhao, P, Zhou, L, Xiang, D, Hu, J, Liu, Y, et al. Epidemiological trends of tracheal, bronchus, and lung cancer at the global, regional, and national levels: a population-based study. J Hematol Oncol. (2020) 13:98. doi: 10.1186/s13045-020-00915-0
7. Xu, H, Qin, X, Zhao, G, Feng, Z, and You, S. Analysis and 15-year projections of the global burden of tension-type headache by sex from 1990 to 2021: a systematic review of GBD 2021 data. J Pain Res. (2025) 18:3505–17. doi: 10.2147/JPR.S512335
8. Das Gupta, P. Standardization and decomposition of rates from cross-classified data. Genus. (1994) 50:171–96.
9. Li, J. Rate decomposition for aggregate data using Das Gupta's method. Stata J. (2017) 17:490–502. doi: 10.1177/1536867X1701700213
10. Zhang, L-y, Wang, P, Wang, Y-b, and He, Z-q. Global, regional, and national burden of bladder cancer, 1990–2019: an age-period-cohort analysis based on the global burden of disease 2019 study. Public Health. (2024) 236:193–203. doi: 10.1016/j.puhe.2024.07.027
11. Lin, L, Liang, Y, Jiang, G, Gan, Q, Yang, T, Liao, P, et al. Global, regional, and national burden of cataract: a comprehensive analysis and projections from 1990 to 2021. PLoS One. (2025) 20:e0326263. doi: 10.1371/journal.pone.0326263
12. Yan, M, and Wu, B. Hepatitis B and C mortality from 1990 to 2019 in China: a Bayesian age-period-cohort analysis. Ann Transl Med. (2022) 10:1384. doi: 10.21037/atm-22-5676
13. Narang, P, Garg, V, and Sharma, A. Regulatory, safety and economic considerations of over-the-counter medicines in the Indian population. Discov Health Sys. (2023) 2:17. doi: 10.1007/s44250-023-00032-y
14. Wang, C, Lassi, N, Zhang, X, and Sharma, V. The evolving regulatory landscape for fentanyl: China, India, and global drug governance. Int J Environ Res Public Health. (2022) 19:2074. doi: 10.3390/ijerph19042074
15. Clark, J, Gnanapragasam, S, Greenley, S, Pearce, J, and Johnson, M. Perceptions and experiences of laws and regulations governing access to opioids in south, southeast, east and Central Asia: a systematic review, critical interpretative synthesis and development of a conceptual framework. Palliat Med. (2021) 35:59–75. doi: 10.1177/0269216320966505
16. Snowdon, J, and Choi, N. Unanticipated changes in drug overdose death rates in Canada during the opioid crisis. Int J Ment Heal Addict. (2024) 22:1394–412. doi: 10.1007/s11469-022-00932-9
17. Fang, M, Zhang, Q, Peng, J, Yao, W, Feng, W, and Wan, X. Global, regional, and national burden of opioid use disorder from 1990 to 2021: a statistical analysis of incidence, mortality, and disability-adjusted life years. BMC Public Health. (2025) 25:1988. doi: 10.1186/s12889-025-23283-1
18. Gomes, T, Callaway Kim, K, Suda, KJ, Garg, R, and Tadrous, M. International trends in prescription opioid sales among developed and developing economies, and the impact of the COVID-19 pandemic: a cross-sectional analysis of 66 countries. Pharmacoepidemiol Drug Saf. (2022) 31:779–87. doi: 10.1002/pds.5443
19. DeWeerdt, S. Tracing the US opioid crisis to its roots. Nature. (2019) 573:S10–2. doi: 10.1038/d41586-019-02686-2
20. Wu, Y, Chen, R, and Zj, G. Exploration on the reform of public health talent training curriculum system in China. Chin J Med Educ. (2021) 41:878–80. doi: 10.3760/cma.j.cn115259-20201228-01771
21. Dowell, D, Ragan, KR, Jones, CM, Baldwin, GT, and Chou, R. CDC clinical practice guideline for prescribing opioids for pain - United States, 2022. MMWR Recomm Rep. (2022) 71:1–95. doi: 10.15585/mmwr.rr7103a1
22. Centers for Disease Control and Prevention (CDC). Vital signs: overdoses of prescription opioid pain relievers---United States, 1999--2008. MMWR Morb Mortal Wkly Rep. (2011) 60:1487–92. doi: 10.15585/mmwr.mm6709e1
23. Ali, R, and Stevens, M. Moving toward voluntary community-based treatment for drug use and dependence. Health Hum Rights. (2022) 24:183–7. doi: 10.1007/s10597-021-00830-9
24. Huang, K, Yu, C, Chen, X, Hao, Y, Ding, Y, Wu, Z, et al. A quasi-experimental study on the effectiveness of compulsory and voluntary treatment settings for 1,299 drug abusers in Hunan, China. Front Psychiatry. (2021) 12:613665. doi: 10.3389/fpsyt.2021.613665
25. White, AG, Birnbaum, HG, Mareva, MN, Daher, M, Vallow, S, Schein, J, et al. Direct costs of opioid abuse in an insured population in the United States. J Manag Care Spec Pharm. (2020) 26:1188–98. doi: 10.18553/jmcp.2020.26.10.1188
26. Kaplovitch, E, Gomes, T, Camacho, X, Dhalla, IA, Mamdani, MM, and Juurlink, DN. Sex differences in dose escalation and overdose death during chronic opioid therapy: a population-based cohort study. PLoS One. (2015) 10:e0134550. doi: 10.1371/journal.pone.0134550
27. Carnide, N, Feng, G, Song, C, Demers, PA, MacLeod, JS, and Sritharan, J. Occupational patterns of opioid-related harms comparing a cohort of formerly injured workers to the general population in Ontario, Canada. Can J Public Health. (2024) 115:851–61. doi: 10.17269/s41997-024-00882-w
28. Hadland, SE, Wharam, JF, Schuster, MA, Zhang, F, Samet, JH, and Larochelle, MR. Trends in receipt of buprenorphine and naltrexone for opioid use disorder among adolescents and young adults, 2001-2014. JAMA Pediatr. (2017) 171:747–55. doi: 10.1001/jamapediatrics.2017.0745
29. Vozoris, NT, Wang, X, Fischer, HD, Bell, CM, O'Donnell, DE, Austin, PC, et al. Incident opioid drug use and adverse respiratory outcomes among older adults with COPD. Eur Respir J. (2016) 48:683–93. doi: 10.1183/13993003.01967-2015
30. Zullo, AR, Danko, KJ, Moyo, P, Adam, GP, Riester, M, and Kimmel, HJ. Prevention, diagnosis, and management of opioids, opioid misuse, and opioid use disorder in older adults. Rockville (MD): Agency for Healthcare Research and Quality (US) AHRQ comparative Effectiveness technical briefs (2020).
31. Tuo, T, Chen, Y, Wang, D, Liu, J, Wu, Y, and Wang, J. A global perspective on incidence and regional trends of opioid use disorders from 1990 to 2021. Psychiatry Investig. (2025) 22:668–77. doi: 10.30773/pi.2025.0039
32. Nitenson, AZ, Paiva, TJ, Onyejekwe, C, and Hallowell, BD. Trends in initiate pediatric opioid prescriptions in Rhode Island: 2017-2021. R I Med J. (2023) 106:44–9. doi: 10.5962/bhl.title.97583
33. Enthoven, L. Trends and relationships in opioid prescribing rates and overdose rates in the United States 2013-2019. medRxiv. (2022) doi: 10.1101/2022.12.04.22283072
34. Rudd, RA, Seth, P, David, F, and Scholl, L. Increases in drug and opioid-involved overdose deaths - United States, 2010-2015. MMWR Morb Mortal Wkly Rep. (2016) 65:1445–52. doi: 10.15585/mmwr.mm655051e1
35. Wang, S, He, Y, and Huang, Y. Global, regional, and national trends and burden of opioid use disorder in individuals aged 15 years and above: 1990 to 2021 and projections to 2040. Epidemiol Psychiatr Sci. (2025) 34:e32. doi: 10.1017/S2045796025100085
36. McDonald, R, Campbell, ND, and Strang, J. Twenty years of take-home naloxone for the prevention of overdose deaths from heroin and other opioids—conception and maturation. Drug Alcohol Depend. (2017) 178:176–87. doi: 10.1016/j.drugalcdep.2017.05.001
Keywords: opioid use disorder, decomposition analysis, age-period-cohort, Bayesian age-period-cohort, future forecast
Citation: Cao J, Li R, Hu G and Huang W (2025) Global and regional burdens of opioid use disorder from 1990 to 2021, with future forecasts to 2050: a systematic analysis for the global burden of disease study 2021. Front. Public Health. 13:1682094. doi: 10.3389/fpubh.2025.1682094
Edited by:
Hope Onohuean, Kampala International University Western Campus, UgandaReviewed by:
Jaymes Fairfax-Columbo, Non-Profit Agency, United StatesPelumi Oladipo, Wayne State University, United States
Copyright © 2025 Cao, Li, Hu and Huang. This is an open-access article distributed under the terms of the Creative Commons Attribution License (CC BY). The use, distribution or reproduction in other forums is permitted, provided the original author(s) and the copyright owner(s) are credited and that the original publication in this journal is cited, in accordance with accepted academic practice. No use, distribution or reproduction is permitted which does not comply with these terms.
*Correspondence: Wanqiang Huang, MTEyNDMyMzgxMkBxcS5jb20=