 Hong Zhang1,2
 Ijaz Uddin
 Xiaolan Zhang
- 1School of Business, Jinggangshan University, Ji’an, China
- 2School of Finance and Economics, Qingdao Binhai University, Qingdao, China
- 3Department of Economics, Abdul Wali Khan University Mardan, Mardan, Pakistan
- 4The First Affiliated Hospital of Zhejiang Chinese Medical University (Zhejiang Provincial Hospital of Chinese Medicine), Hangzhou, China
- 5Technology, Education, and Management at the Graduate School of Business & Advanced Technology Management, Assumption University of Thailand, Bangkok, Thailand
- 6Intelligent Transportation School, Yunnan Vocational College of Transportation, Kunming, China
Health is directly aligned with Sustainable Development Goal (SDG) 3: Good Health and Well-Being, which emphasizes ensuring healthy lives and promoting well-being for all at all ages. The present study investigates the determinants of life expectancy (LEX) by incorporating a comprehensive set of factors: CO₂ emissions as an environmental factor; GDP, health expenditure, and research and development (R&D) as economic factors; education and individual internet use as social factors; and rule of law and government effectiveness as institutional factors. Using panel data for the top 20 high-life-expectancy countries covering the period 2001–2023, this study applies both traditional econometric techniques namely, PMG, fixed effects, and FMOLS estimators and advanced machine learning approaches, specifically Gradient Boosting and Random Forest. The regression results reveal that CO₂ emissions negatively affect LEX, whereas GDP, health expenditure, education, internet use, rule of law, government effectiveness, and R&D exert positive influences. The machine learning results further indicate that GDP, health expenditure, and education are the three most critical predictors of LEX in both Gradient Boosting and Random Forest models, with GDP emerging as the most dominant factor. Institutional variables such as rule of law, government effectiveness, and R&D display moderate importance, while CO₂ emissions and individual internet use consistently rank as the least influential. In terms of predictive performance, Gradient Boosting outperforms Random Forest across evaluation metrics, demonstrating lower errors and higher explanatory power. In light of these findings, this study also provides important policy implications to enhance LEX.
1 Introduction
Life expectancy (LEX) refers to the average number of years a newborn is expected to live, assuming current mortality patterns remain constant throughout their life. It is a widely used indicator of population health and development. LEX reflects both healthcare access and broader socio-economic conditions influencing survival. Economic growth influences LEX and health, especially in developing and impoverished countries. A stable and strong economy frequently results in better public health programs, higher living standards, and better healthcare infrastructure all of which raise life expectancy (1). Increased per capita income reflects a country’s investment in social indicators such as health, education, pensions, food facilities, sanitation, and environmental status (2, 3). The countries with higher GDP per capita tend to have higher living standards, better healthcare facilities, and more public investment in medical services, all of which raise life expectancy. Those who earn more money typically have easier access to wholesome food, potable water, and high-quality healthcare, which lowers mortality rates (4, 5). A growing economy allows for investments in healthcare infrastructure, education, and social services, which improve life expectancy. However, the distributional elements of economic growth, wealth inequality, and discrepancies in access to healthcare services can bring complexity that affects different parts of the population differently (6, 7). Increasing wealth only enhances happiness until fundamental necessities are covered. After that, income can lead to hunger relief and sickness prevention for children (8). As a result, much of the improvement in people’s happiness stemmed from the reduction of child and infant mortality; millions of children were destroyed because of abject poverty and the failure to implement basic improvements in sanitation and public health (9, 10).
Environmentalists and policymakers are concerned about air pollution, particularly carbon emissions (CO2E) from industrialization and energy consumption. These emissions have been identified as a contributing factor to global health issues (11, 12). Carbon emissions from using fossil fuels have caused negative externalities globally. Energy usage, particularly from fossil fuels, as well as manufacturing and construction activities, has a severe impact on the environment, leading to deterioration, poor health outcomes, and shortened life expectancy, specifically for aquatic life (13–15). A World Health Organization (16) report states that air pollution kills around seven million individuals every year (17). According to Hill et al. (18), air pollution is an environmental issue that contributes to mortality in all societal sectors. Air pollution presents serious health hazards to the earth, significantly increasing the rate of premature death and the development of pollution-related illnesses around the world (19, 20). Changes in climatic patterns brought on by CO2 emissions can impact the distribution and prevalence of disease vectors, which in turn can impact the occurrence of vector-borne illnesses like dengue fever and malaria. This emphasizes how complex and multidimensional the relationship is between life expectancy and CO2 emissions (21). According to Das and Debanth (22), CO2 emissions significantly affect life expectancy via a wide range of interrelated routes. Fossil fuel combustion generates pollutants that significantly increase air pollution and are acknowledged as a major contributor to CO2 emissions (23). Environmental factors cause 33% of diseases and 13 million deaths each year. Over 3 billion people use dirty fuel, and air pollution is responsible for 7 million of these deaths—90 percent of the world’s population breathes filthy air. Poor environmental management causes 2 million fatalities each year owing to water-related problems, infectious diseases, and other negative consequences (24). Transportation is the primary source of CO2 emissions, which also contribute to climate change and present several health hazards, such as cardiovascular and pulmonary conditions, as well as some forms of cancer (25, 26).
Spending on health care is beneficial when it is adequate. On the other hand, poor healthcare spending may make it more difficult for the underprivileged to get necessary medical treatment (27). The World Health Organization defines health expenditure as both capital investments in healthcare infrastructure and consumption of products and services to improve health outcomes (28, 29). According to the OECD, a 10% increase in per capita health expenditure results in a 3.5-month increase in life expectancy, implying that health spending has been the dominant driver of longevity gains in recent decades, particularly among older persons (30–32). Health outcomes have significantly improved globally during the last few decades. This has happened at the same time that health expenditure has increased. Between 1990 and 2013, life expectancy at birth rose from 64 to 71 years, the maternal mortality ratio dropped by 45%, and the under-five mortality rate dropped by 49% globally (33, 111). Short-term healthcare facilities, such as doctor and hospital bed availability, have an impact on life expectancy. On the other hand, long-term improvements may necessitate ongoing expenditures in health technology and infrastructure (34–36). Health infrastructure can either directly protect health (e.g., public sanitation systems) or support other health-promoting activities (37). Investing in the health system strengthens its infrastructure and improves individual health situations (38, 39). Increasing the health care budget improves accessibility and lowers costs, reducing the likelihood of mortality (40). Health indicators like infant mortality and total mortality have been significantly impacted by the pandemic’s worsening of the issues that healthcare workers experience, including workload, mental health, and work-life balance (41, 42). For the healthcare system to remain sustainable, it is essential to improve working conditions, increase training, decrease workload, and strengthen the health staff (43, 44).
ICT increases life expectancy by making health information easier to obtain and sharing knowledge about epidemics, good nutrition, and health (45, 46). ICT enhances patient-physician communication and health awareness, which can boost early disease identification and treatment and help people make better decisions about their quality of life (47, 48). Advances in ICT have a significant socioeconomic link to health outcomes. However, the greatest advantage of aging and lifespan is the creation of chances for individuals to interact, with ICT spending functioning as a policy tool for governments (49). The World Health Organization (WHO) defines “eHealth as the use of (ICT) services in the health sector, such as e-health, m-health, and telemedicine, as part of the extensive use of digital technology for health activities in many contexts (50, 51). By making it easier to gather, organize, and disseminate health information promptly, ICT elements such as accessibility, affordability, and applications may make it possible to provide effective public health (52, 53). ICTs give the infrastructure and resources to construct large-scale, population-level applications such as health information networks, surveillance systems, and telemedicine (54–56).
People with high levels of education, use their information, knowledge, and life experiences to avoid risk factors for health problems and to adopt healthy habits, including quitting smoking, abstaining from alcohol, and exercising frequently (57, 58). According to Mirowsky and Ross (59), more education leads to steady and well-paid jobs and increased income, which can cover expenses such as nutritious food, better housing, and high-quality medical care. Education delivers socio-psychological resources that, through instrumental and emotional support, can promote lifespan and good health (60). Another factor that influences the association between education and health is the fact that those with higher levels of education are more likely to get married and stay married (61, 62). Education has an indirect effect on life expectancy and health by raising the risk of non-fatal work-related accidents and affecting employment in occupational classes that pay more and have access to health insurance. This relationship is complex to break, but it will probably continue (63, 64). Health needs are hampered by un insurance, yet greater wages decrease unmet medical demands. Through societal impacts, more wealth not only meets biological demands but also lengthens life expectancy by empowering people to take charge of their own lives and meet their biological needs. This emphasizes how crucial cash is for meeting medical demands (65–68). Education also affects life expectancy by influencing economic growth and development, while it is a significant factor in determining human capital, which in turn influences economic growth and development (69–71).
In Figure 1 shows the data of the average LEX at birth for the selected countries (Belgium, Canada, France, Iceland, Ireland, Israel, Italy, Japan, Korea, Luxembourg, Malta, Netherlands, New Zealand, Norway, Portugal, Qatar, Singapore, Spain, Sweden, and Switzerland) over the period 2001–2023. In 2001, the average LEX of the top 20 countries stood at 78.7 years. It showed a steady upward trend, crossing 81 years by 2010. This growth reflects improvements in healthcare, nutrition, and living standards. From 2014 to 2019, LEX stabilized above 82 years, peaking at 82.91 in 2019. In 2020, it dropped to 82.33 years, mainly due to the COVID-19 pandemic. Subsequently, recovery followed, with LEX reaching 83.02 years in 2023. Overall, LEX improved by 4.3 years over 2001–2023, despite temporary shocks. Countries such as Belgium, Canada, France, Iceland, Ireland, Israel, Italy, Japan, Luxembourg, Netherlands, New Zealand, Norway, Singapore, Spain, Sweden, and Switzerland are among the world’s richest economies. In these nations, people tend to live longer, which encourages both public and private sectors to invest more in health and education. Longer LEX increases the demand for quality healthcare and lifelong learning. Governments also allocate larger budgets to sustain a healthy, skilled, and productive population. As a result, wealth and longevity reinforce each other, creating a cycle of continuous investment in human capital.

Figure 1. Trends of life expectancy in selected countries.
To the best of the authors’ knowledge, this study makes several important contributions. First, it is the first study to analyze the determinants of life expectancy in the top countries with the highest life expectancy. Second, the study integrates environmental, economic, social, and institutional factors, whereas previous studies, such as Li et al. (72), focused primarily on economic and social determinants. The factors considered in this study include CO₂ emissions (environmental), GDP, health expenditure, and research & development (economic), education and individual internet use (social), and rule of law and government effectiveness (institutional). Third, the inclusion of R&D as a determinant is a novel contribution, as it has largely been ignored in prior literature. Fourth, this study uniquely combines traditional econometric techniques, including PMG, Fixed Effects, and FMOLS, with advanced machine learning methods such as Gradient Boosting and Random Forest. In contrast, previous research has generally relied only on conventional methods. Finally, the study provides policy recommendations aimed at enhancing Sustainable Development Goals (SDGs), particularly to improve life expectancy through environmental management, economic growth, social development, and institutional strengthening.
2 Literature review
2.1 Empirical review
Shaw et al. (73) analyzed the determinants of LEX using OECD health data for developed countries. The authors employed an aggregate LEX production function, controlling for the influence of age distribution to address omitted-variable bias. Findings indicated that pharmaceutical consumption positively impacted LEX at middle and advanced ages, with the effect size depending on the age composition of the population. Specifically, doubling annual pharmaceutical expenditure increased male LEX at age 40 by approximately one year and female LEX at age 65 by slightly less than one year. Lifestyle factors also played a role, as reducing tobacco consumption by two cigarettes per day or increasing daily fruit and vegetable consumption by one-third of a pound could increase LEX by about one year for females aged 40. Kabir (74) examined the socioeconomic determinants of LEX in 91 developing countries using data from an unspecified period. The study applied multiple regression and disaggregated probit regression frameworks, separating countries into low, medium, and high LEX groups. The analysis revealed that most explanatory variables, including per capita income, education, health expenditure, access to safe water, and urbanization, were statistically insignificant in explaining LEX variations across the Sample. The author concluded that these socioeconomic indicators cannot always be considered decisive in determining LEX in developing countries. Policy recommendations included enhancing the availability of physicians, reducing adult illiteracy, and addressing undernourishment to improve overall LEX.
Lin et al. (75) analyzed the political and socioeconomic determinants of LEX in 119 less developed countries (LDCs) from 1970 to 2004. Using linear mixed models with lag effects of up to 10 years, the study examined GDP per capita, literacy rates, undernourishment, and political regime. Results indicated that all four factors contributed to increases in LEX, with political regime initially having the least impact but becoming significant from the third year onwards. The influence of economic, educational, and nutritional factors declined over time, while the long-term positive role of democracy strengthened, contributing to up to 98% of LEX gains in some lag periods.
Bayati et al. (76) estimated a health production function for 21 Eastern Mediterranean region from 1995 to 2007 using panel data and fixed effects based on the Hausman test. The study identified per capita income, education index, food availability, urbanization, and employment ratio as significant positive determinants of LEX. A gender-specific analysis revealed that the elasticity of LEX concerning employment was higher for males than for females. The authors recommended that policymakers focus on economic growth and employment generation to improve public health outcomes. Monsef and Mehrjardi (77) investigated economic, social, and environmental determinants of LEX in 136 countries from 2002 to 2010. Using panel data regression techniques, the authors found that unemployment and inflation were the main economic factors negatively affecting LEX, while gross capital formation and gross national income had positive effects. Urbanization emerged as the primary socio-environmental factor influencing mortality. Based on these findings, the study recommended economic stabilization policies, job creation programs, and improved urban living conditions as means to extend LEX. Sede and Ohemeng (78) examined the socioeconomic determinants of LEX in Nigeria from 1980 to 2011, focusing on the country’s progress toward the Millennium Development Goal of achieving 70 years of LEX by 2020. Using Vector Autoregression (VAR) and Vector Error Correction Model (VECM) frameworks to address endogeneity, the study included variables such as secondary school enrollment, government health expenditure, per capita income, unemployment rate, and the Naira foreign exchange rate. Results showed that traditional determinants like income, education, and health expenditure were insignificant in Nigeria’s case. In contrast, exchange rate stability, reduced unemployment, and improved quality of government health spending were critical for enhancing LEX.
Gilligan and Skrepnek (79) examined socioeconomic and health expenditure determinants of LEX in 21 Eastern Mediterranean Region (EMR) countries from 1995 to 2010. The authors used WHO and World Bank data, applying cluster analysis to group countries by development level and employing multilevel mixed-effects linear models with distributed lags. Results showed that GDP, vaccination rates, and urbanization were significant positive predictors of LEX overall. The predictors varied by cluster: in less developed nations, physician density and vaccination rates mattered most; in more developed clusters, GDP, literacy, and health expenditures were key determinants. Hassan et al. (80) analyzed social environment determinants of LEX in 108 developing countries from 2006 to 2010 using panel data methods. The results showed that GDP, education index, health expenditure, improved water coverage, and sanitation facilities all had positive effects on LEX, with education and GDP being the most significant predictors. Causality analysis revealed no short-run causality but demonstrated long-run unidirectional causality from these determinants to LEX, and bidirectional causality between income and LEX.
Rahman et al. (81) examined the determinants of LEX in the 31 most polluted countries from 2000 to 2017, focusing on environmental degradation by using the Panel Corrected Standard Errors. The study confirmed a positive relationship between economic growth and LEX, while CO2E has a negative effect on LEX. Moreover, health expenditure, access to clean water, and improved sanitation increased it. Azam et al. (82) investigated environmental degradation and socioeconomic factors affecting LEX in Pakistan from 1975 to 2020 using ARDL bounds testing and Johansen cointegration techniques. The study found that death rate, food production index, inflation, and CO2E have negatively affected LEX, while income, health expenditure, urbanization, birth rate, and education have had positive impacts. Ahmad et al. (83) analyzed the impact of urbanization and income inequality on male and female LEX in six South Asian countries from 1997 to 2021 using random effects models. Results showed that urbanization and income inequality significantly reduced LEX for both genders, while health expenditure increased it. Interaction analysis indicated that health expenditure mitigated the adverse effects of urbanization, though with a small effect size, highlighting the importance of public health investments in urban areas. Uddin et al. (84) explored how institutional quality, financial development, and environmental pressures shape LEX across SAARC from 2002 to 2020. They reported that stronger institutions, financial sector progress, and greater health spending support improvements in LEX. Conversely, environmental stressors such as higher CO₂ emissions, larger ecological footprints, demographic pressures, and adverse birth–mortality dynamics were linked to reductions in LEX.
2.2 Theoretical review
Uddin et al. (84) extended Grossman’s health production function by incorporating additional variables, including environmental degradation, financial development, and institutional factors. Their findings indicate that environmental degradation negatively affects LEX, whereas financial development and institutional quality exert positive influences on LEX. Environmental degradation can disrupt food supply and reduce water quality, which in turn increases mortality risks, especially for infants, the older population, and disadvantaged groups from lower-income communities (81). Moreover, poor air quality has been shown to strongly affect the life expectancy of older population individuals, who are less capable of adapting to environmental stress because of pre-existing health conditions (85, 86). Information and communication technologies, along with developments in biomedical engineering, drug design, disease management, and medical science, present substantial chances to enhance health outcomes through programs like more efficient business procedures and better and more affordable patient diagnosis and treatment. These intermediate results are likely to lead to a healthcare system that is more efficient, less expensive, and of excellent quality (87–89). Education affects life expectancy through various direct and indirect channels. Higher education levels are associated with increased health awareness, prevention, protection, and promotion of public health, as well as better knowledge of healthy lifestyle habits such as nutrition and physical activity (71). Education helps people develop effective human agency, which in turn encourages healthy lifestyles.
3 Methodology
3.1 Model construction and data
This study examines the determinants of life expectancy in the world’s top 20 countries with the highest longevity. The empirical model applied in the analysis is derived from:
Where in Equation 1, LEX, CO2E, GDP, HE, EDU, IUI, ROL, GE and R&D represent the life expectancy (at birth, total, years), Carbon dioxide emissions (CO2E) (per capita, CO2e/capita), Gross domestic product (per capita, constant 2015 US$), health expenditure [(% of GDP), education (School enrollment, secondary, % gross), Individuals using the Internet (% of population), Rule of Law (Estimate), Government Effectiveness (Estimate), and Research and development expenditure (% of GDP) respectively]. The data has been obtained from the world bank and UNDP. This study utilized the full dataset covering the period from 2001 to 2023 for the chosen regression analysis and transformed variables into their natural logarithmic form. The benefits of this transformation in that, it addresses heteroskedasticity issues and facilitate interpretation, the variables LEX, CO₂E, and GDP were transformed, while the remaining variables were already expressed as percentages, except for ROL and GE, which retained their original values due to the presence of negative observations. For the machine learning analysis, this study first normalized the data using the StandardScaler method. This process adjusts each feature to have a mean of zero and a standard deviation of one. Normalizing the data helps reduce the influence of outliers, which can distort the analysis and decrease model accuracy. In this study, the dataset was randomly split into two parts: 70% for training and 30% for testing. The training data were used to help the Random Forest and Gradient Boosting models learn the patterns and relationships within the variables, while the testing data were used to evaluate the models’ performance on unseen data. Random splitting offers several advantages. It ensures that both subsets represent the overall data distribution, reducing the risk of bias that could occur if the split followed a specific order or pattern. This approach helps improve the generalizability of the model, making its predictions more reliable when applied to new datasets. It also prevents overfitting, as the model is tested on data it has not previously encountered. This study used the ranger package for Random Forest and the xgboost package for Gradient Boosting. Both are efficient and widely used R libraries for accurate and scalable machine learning analysis.
3.2 Methodology
3.2.1 Cross sectional dependency
Cross-sectional dependency (CSD) refers to the correlation of error terms across panel units, often arising from common shocks, spillover effects, or unobserved global factors (90). Ignoring CSD can lead to biased and inconsistent estimators in panel regressions. One common method to detect cross-sectional dependence (CSD) is by applying the Lagrange Multiplier (LM) test, as shown in Equation 2, and the Cross-sectional Dependence (CD) test, as shown in Equation 3:
where is the pairwise correlation coefficient of residuals between units and . The null hypothesis is for all , implying no CSD. Under . Rejecting indicates significant cross-sectional correlation.
3.2.2 Panel unit root test
The Levin, Lin, and Chu (LLC) test, proposed by Levin et al. (91), examines the null hypothesis that all panels contain a unit root against the alternative that all are stationary. The method assumes a common autoregressive coefficient across cross-sections, allowing for individual intercepts and time trends. LLC corrects for serial correlation and heteroskedasticity using a bias-adjusted t-statistic, but it requires the variables to have the same order of integration In contrast, the Cross-sectionally Augmented IPS (CIPS) test, developed by Pesaran (92), extends the Im et al. (93) approach by accounting for cross-sectional dependence, which is common in macroeconomic and financial panel datasets. CIPS augments the standard ADF regressions with cross-section averages of lagged levels and first differences of the series. The test allows for heterogeneity in autoregressive coefficients and is robust to cross-sectional correlation.
3.2.3 PMG estimator and FMOLS
This study applies the Pooled Mean Group (PMG) estimator developed by Pesaran et al. (94). Earlier studies, including Phillips and Hansen (95) and Johansen (96), noted that long-run relationships typically require variables to share the same integration order. Pesaran et al. (112), building on Pesaran and Shin (97), showed that the ARDL model remains valid when the regressors include a mix of I(0) and I(1) variables. This makes the PMG estimator appropriate for this analysis because it addresses potential endogeneity through the use of lagged dependent and explanatory variables. In this study, the panel ARDL model of order proposed by Pesaran et al. (94) is specified in Equation 4:
Here, denotes the cross-sectional unit represents the time period , and in this application covering 2001–2023. The dependent variable corresponds to the outcome of interest (LEX), while denotes the explanatory variables. captures unobserved country-specific effects, are the coefficients on the lagged dependent variable, are the coefficients on the lagged explanatory variables, and is the idiosyncratic error term. For consistent estimation, must be sufficiently large to allow each country’s equation to be estimated independently (98). The error correction representation of the model can be expressed as:
Where in Equation 5, the , , and represent the speed of adjustment toward the long-run equilibrium, vector of long-run coefficients, short-run coefficients of the lagged dependent variable and short-run coefficients of the lagged explanatory variables, respectively.
The Fully Modified Ordinary Least Squares (FMOLS) procedure, first proposed by Phillips and Hansen (95), is designed to yield efficient estimates in cointegrating regressions. For panel settings, the heterogeneous FMOLS method developed by Pedroni (99) is applied, as it effectively handles both endogeneity bias and serial correlation in the regressors. According to Hamit-Haggar (100), this framework, which accommodates heterogeneity in cointegration relationships, is well-suited for panel data analysis. Kao and Chiang (101) further emphasize that FMOLS mitigates the bias found in conventional least squares estimators when explanatory variables suffer from endogeneity and autocorrelation. As noted by Pedroni (99), the method is a non-parametric approach that adjusts for serial correlation, and when coefficients are stationary with variables being cointegrated, it reduces distortions in estimation outcomes (98).
If the coefficient in model (1) is estimated using FMOLS, the expression can be represented in Equation 6:
where:
Here, denotes the regressor, is its mean-adjusted value, is the bias-corrected residual, represents the first difference of , and , and are kernel-based long-run variance and covariance estimates.
3.2.4 Random forest
Random Forest (RF) is an advanced ensemble learning framework designed to integrate the predictive strengths of numerous decision trees, each cultivated from unique bootstrap samples of the original dataset. By fostering diversity among the trees and subsequently averaging their outputs, the method substantially curtails model variance, delivering superior predictive accuracy and a pronounced safeguard against overfitting. Its prediction process is mathematically is specified in Equation 7:
Where denotes the ensemble’s prediction, H is the number of constituent trees, is the prediction function of the hth tree, and X encapsulates the vector of explanatory variables. This architecture proves especially potent in domains marked by high-dimensional feature spaces and intricate inter-variable dependencies, where it consistently delivers resilient, generalizable, and analytically sound models capable of capturing the subtle complexities inherent in real-world data (102).
3.2.5 Gradient boosting
Gradient Boosting (GB), developed by Friedman (103), is an ensemble machine learning technique designed to improve prediction accuracy by combining several weak learners. It builds regression trees in an iterative process, splitting the data into smaller subsets to minimize residual errors. The model starts with all observations in a single group, then repeatedly partitions them based on the predictor that most effectively reduces the error, measured using Friedman’s Mean Squared Error (MSE). Through this approach, GB enhances the model’s accuracy and reliability in estimating continuous outcomes (104). GB is a powerful ensemble learning methodology that constructs predictive models in a sequential, stage-wise manner, typically employing decision trees as its base learners. Unlike methods that build models independently, Gradient Boosting strategically focuses each new model on the residual errors of its predecessors, thereby iteratively refining predictive performance through the minimization of a specified loss function. The process can be mathematically is expressed in Equation 8:
Here, denotes the initial model, serving as the foundation of the boosting process; represents the total number of boosting iterations or stages; is the prediction of the base learner-often a shallow decision tree-trained on the residuals from the preceding stage; and is the weight assigned to that learner’s contribution (102).
This approach is particularly adept at capturing intricate, nonlinear relationships between predictors and the target variable, offering adaptive flexibility and high predictive precision. By integrating both regression techniques and machine learning capabilities, GB not only elucidates the relative importance of each predictor but also produces models that are both resilient and analytically rigorous-enabling more accurate forecasts and deeper strategic insights, such as in the analysis of life expectancy dynamics.
4 Results and discussions
4.1 Results
Table 1 shows the descriptive statistics where the mean value of LEX, CO2E, GD, HE, EDU, IUI, ROL, GE and RD are 81.25, 10.90, 47171.05, 8.37, 110.75, 75.05, 1.42, 1.45 and 2.10, respectively. The standard deviation of LEX, CO2E, GD, HE, EDU, IUI, ROL, GE and R&D are 1.67, 9.36, 21855.66, 2.35, 15.72, 21.12, 0.44 0.46 and 1.06, respectively. The correlation matrix shows in Table 2, LEX is strongly correlated to IUI (0.64) and moderately to R&D (0.26), but negatively to CO2E (−0.15). GDP has strong positive links with ROL (0.56) and GE (0.52), while HE is negatively related to CO2E (−0.45). Table 3 shows the estimates of Variance Inflation Factor (VIF) It measures how much the variance of a regression coefficient is inflated due to multicollinearity among independent variables. A VIF of 1 means no correlation with other predictors, while higher values indicate stronger collinearity. The mean VIF value is 2.57, which is well below the common threshold of 05, indicating no serious multicollinearity issue in the model with LEX as the dependent variable. This suggests that the independent variables are not highly linearly related overall, and the regression estimates should remain stable.

Table 1. Descriptive statistics.

Table 2. Correlation matrix.

Table 3. VIF.
Table 4 shows the results of CSD test, The Breusch–Pagan LM (616.270, p = 0.000), Pesaran scaled LM (21.867, p = 0.000), and Bias-corrected scaled LM (21.367, p = 0.000) all reject the null hypothesis of cross-sectional independence. The Pesaran CD test (13.304, p = 0.000) confirms significant correlations across cross-sections. These four statisitcs confirms that thre is CSD.
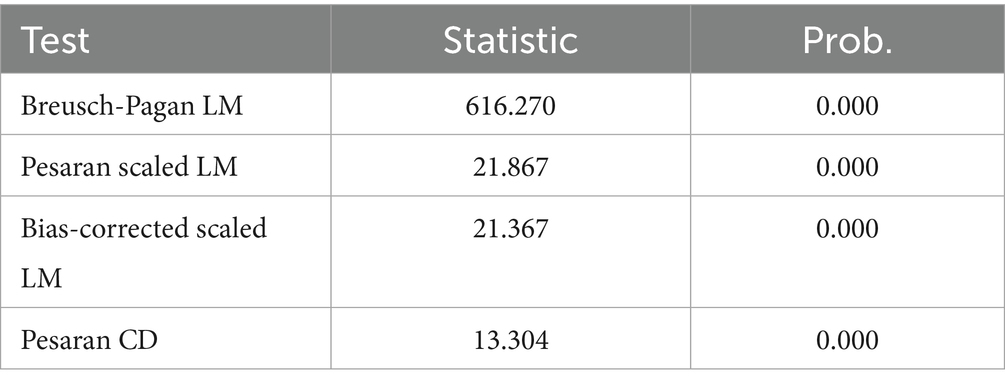
Table 4. CSD test.
Thus, panel estimations should account for cross-sectional dependence to avoid biased standard errors.
Table 5 presents the results of the LLC and CIPS unit root tests. In the LLC test, at level, LEX, GDP, IUI, and GE are stationary, while in the CIPS test, at level, LEX, EDU, IUI, and GE are stationary. After the first difference, both tests confirm that all variables are stationary at first differences.
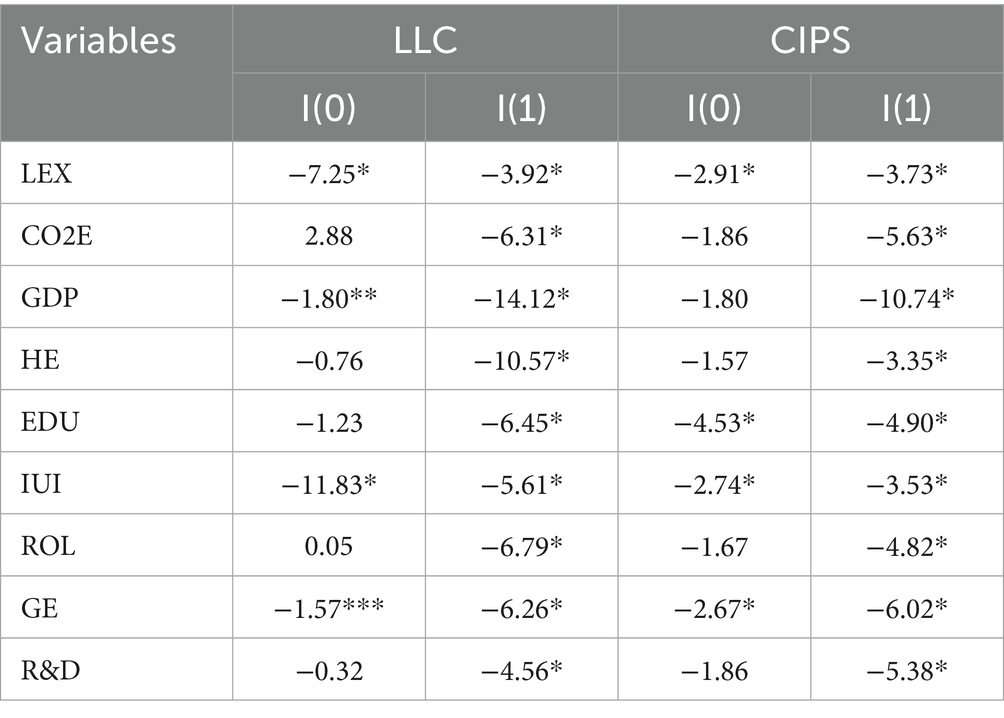
Table 5. Unit root test.
Table 6 shows the Kao residual cointegration test, The Kao test statistic (−2.3659, p = 0.009) is significant, rejecting the null hypothesis of no cointegration. This implies a long-run equilibrium relationship exists among the variables in the panel. The residual variance (0.1274) indicates the average variation of the residuals. The HAC variance (0.0828) provides a robust estimate, confirming the stability of the long-run relationship.

Table 6. Kao residual cointegration test.
Table 7 shows the PMG estimates, The PMG long-run results show that CO₂ emissions (−0.050, p < 0.01) significantly reduce life expectancy, while GDP (0.804, p < 0.01), health expenditure (0.634, p < 0.05), education (0.372, p < 0.01), rule of law (0.240, p < 0.05), government effectiveness (0.606, p < 0.01), and R&D expenditure (0.155, p < 0.01) significantly enhance life expectancy, highlighting the crucial roles of economic growth, social investment, and institutions. In contrast, individual internet use (0.890, p > 0.1) is statistically insignificant in the long run, suggesting that its positive impact emerges only gradually. In the short run, CO₂ emissions (−0.104, p < 0.01) remain detrimental to LEX, whereas GDP (0.534, p < 0.01), health expenditure (0.164, p < 0.01), education (0.021, p < 0.01), internet use (0.049, p < 0.01), and R&D (0.467, p < 0.01) significantly improve life expectancy. The rule of law (0.563, p = 0.061) shows a 10% significant effect, while government effectiveness (0.150, p > 0.1) is insignificant in the short run. The negative and significant ECM(−1) coefficient (−0.246, p < 0.01) confirms the presence of a long-run equilibrium, with about 24.6% of disequilibrium corrected each period, ensuring convergence toward stability.
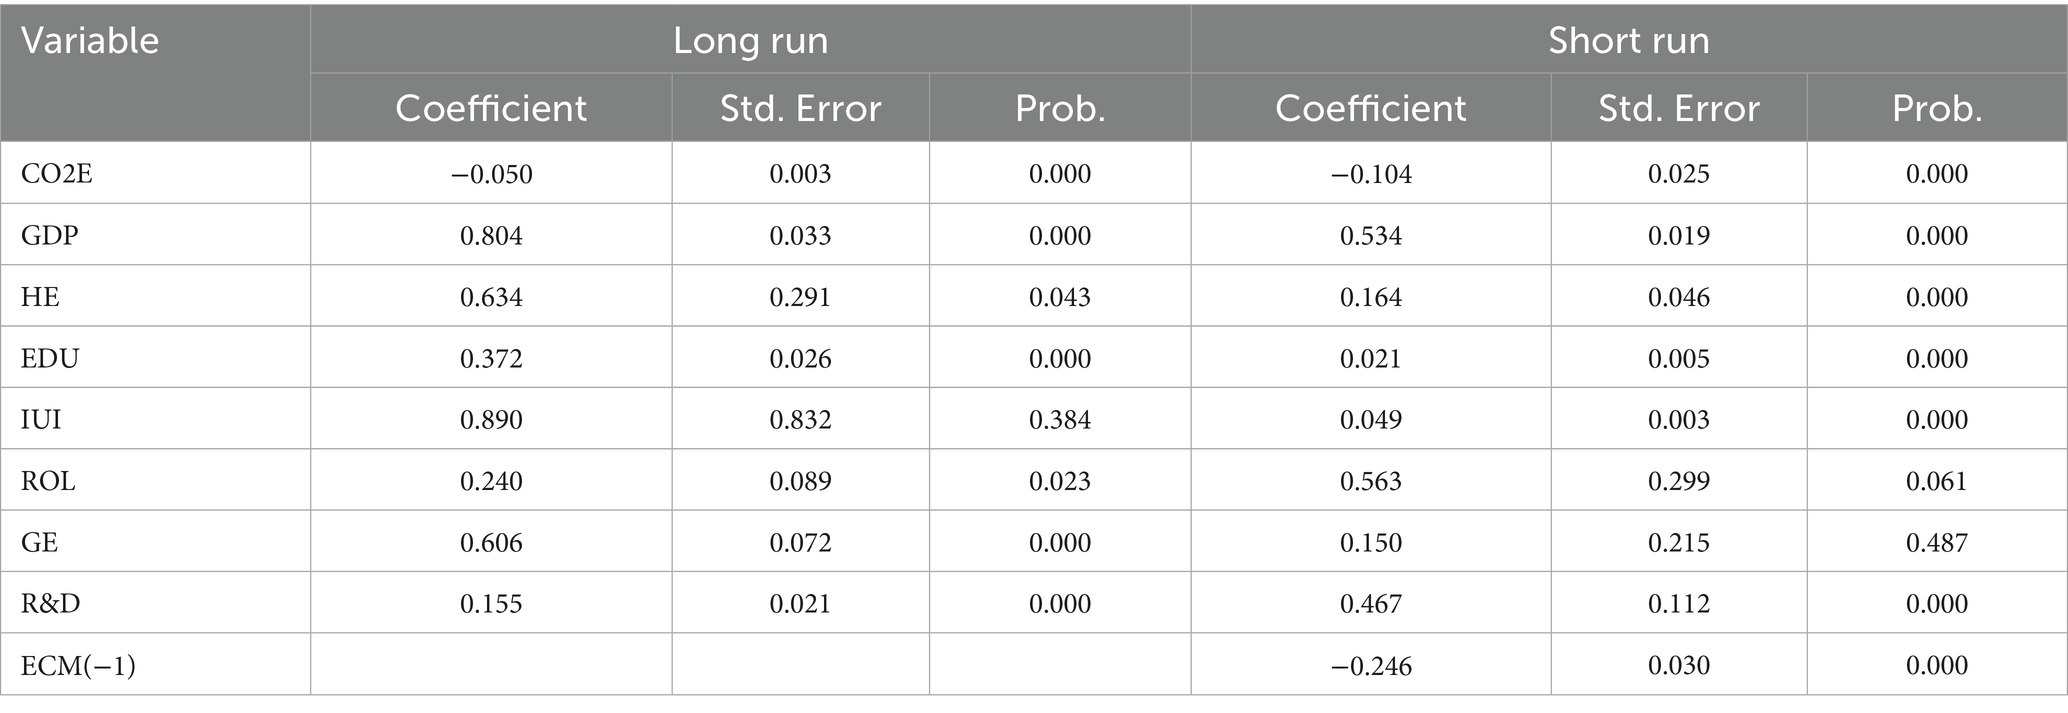
Table 7. PMG estimates.
Table 8 shows the robustness analysis, the results of the Fixed Effects and FMOLS estimations are consistent with the ARDL long-run findings. CO2E exert a negative effect on LEX, while GDP, health expenditure, education, individual internet use, rule of law, government effectiveness, and R&D all show positive effects.

Table 8. Robustness analysis.
4.2 Machine learning results
Figure 2 illustrates the comparative importance of predictors as estimated by two ensemble-based machine learning techniques: Random Forest and Gradient Boosting. Both approaches assess the extent to which each variable contributes to explaining variations in the dependent variable, life expectancy, yet they rely on distinct algorithmic frameworks and importance metrics to quantify these contributions. GDP emerges as the most influential predictor in both Gradient Boosting and Random Forest models, with importance scores of 30.54 and 15.74, respectively, underscoring its dominant role in shaping LEX. Health expenditure follows as the second most significant factor, recording scores of 21.46 and 10.47, respectively. Education holds the third position in predictive influence, with scores of 16.47 and 8.43, reflecting its substantial, though slightly lesser, impact compared to GDP and HE. Rule of Law exhibits moderate importance, with scores of 14.10 in Gradient Boosting and 7.01 in Random Forest. Research and Development contributes less prominently, scoring 10.66 and 4.73, respectively. Government Effectiveness (GE) shows relatively lower influence, with importance values of 10.00 and 2.93, respectively. CO₂ emissions rank near the bottom, with scores of 4.64 and 1.40, while the Internet Usage is consistently the least important predictor, with scores of 1.74 and 0.49, respectively. Both models present a consistent ranking of predictor importance: GDP > HE > EDU > ROL > R & D > GE > CO2E > IUI. Notably, Gradient Boosting assigns higher and more differentiated numerical importance values, suggesting a sharper distinction between variable contributions, whereas Random Forest outputs are more compressed and normalized. In both methodologies, GDP and HE are the most critical drivers of LEX, while CO2E and IUI exert minimal influence, indicating their limited relevance across model frameworks.

Figure 2. Feature importance coefficient for machine learning models.
For the prediction of LEX, Gradient Boosting outperformed Random Forest across most evaluation metrics. Gradient Boosting achieved a lower MAE (0.7346 vs. 1.5784) and RMSE (1.734 vs. 2.743), alongside a higher 𝑅2 value (0.9854 vs. 0.9633), indicating superior accuracy and model fit. Although Random Forest recorded a slightly lower MAPE (55.84 vs. 60.73), the overall results confirm Gradient Boosting’s stronger predictive capability in modeling life expectancy.
4.3 Discussions
The finding shows that the CO2E has an adverse effect on LEX, which is why the negative sign occurs; CO2E reduces LEX because it worsens air quality and intensifies environmental stress. Polluted air raises the incidence of respiratory and cardiovascular diseases, leading to higher mortality. Moreover, CO₂-driven climate change increases heatwaves, natural disasters, and disease spread, all of which shorten human lifespan. The finding is consistent with the findings of Azam et al. (82) and Uddin et al. (84). Azam et al. (82) analyzed the CO2E and LEX in Pakistan, and they found that CO2E reduces the LEX. Uddin et al. (84) reported that CO2E reduces the LEX in SAARC economies.
The education coefficient has a positive effect on LEX; thus, education enhances LEX by encouraging healthier lifestyles, improving access to healthcare, and strengthening health literacy. Individuals with higher education are better equipped to recognize health risks, practice preventive care, and make informed choices about diet, exercise, and medical treatment. Furthermore, education creates economic opportunities that reduce poverty-related health challenges and increase access to clean water, sanitation, and nutritious food (35, 36).
The GDP and health expenditure have a positive effect on LEX. GDP is positively associated with LEX, higher GDP boosts LEX by increasing national income, which allows greater investment in healthcare, education, and infrastructure. It improves access to quality medical services and advanced technologies that reduce mortality. Rising GDP also elevates living standards, providing better housing, sanitation, and nutrition. Moreover, stronger economic growth creates the conditions for healthier and longer lives. The finding is consistent with the findings of Amin et al. (6) and Țarcă et al. (105), and they found that economic growth and health expenditure have a positive effect on LEX in ASEAN-5 countries and Eastern Europe.
The individual using the internet has a positive effect on LEX; thus, Individual use of the internet enhances LEX by improving access to health information and raising awareness about preventive care. It facilitates better communication with healthcare providers and access to online medical services. Moreover, internet use promotes health literacy and informed decision-making, leading to healthier lifestyles and longer lives. Lee and Kim (106) reported that the internet environment has a positive effect on LEX in Asia. Kim and Kim (107) reported that the internet enhances the LEX in 178 countries. Pu et al. (108) analyzed the internet use, which significantly and positively impacts LEX in 182 countries.
The rule of law has a positive effect on LEX; thus, a stronger rule of law enhances LEX by ensuring equal access to justice and protection of fundamental rights. It promotes fair distribution of resources and reduces corruption, allowing better delivery of healthcare and social services. Effective legal systems also enforce health, safety, and environmental regulations, safeguarding public wellbeing. Moreover, the rule of law creates a stable and secure environment that supports healthier and longer lives. This finding is consistent with the findings of Pinzon-Rondon et al. (109), who found that the rule of law significantly enhances health outcomes. The R&D has a positive effect on LEX; thus, R&D enhances LEX by driving medical innovations such as new treatments, vaccines, and diagnostic technologies. It improves healthcare efficiency and accessibility, reducing mortality from preventable diseases. Moreover, R&D also supports technological and pharmaceutical advancements that contribute to longer and healthier lives. Muradov et al. (110) reported that medical innovation enhances the LEX in the USA.
5 Conclusion
The primary objective of this empirical study is to examine the determinants of LEX in the top 20 countries with the highest life expectancies during the period 2001–2023. The analysis integrates both traditional econometric techniques namely PMG, Fixed Effects, and FMOLS estimators and advanced machine learning approaches such as Gradient Boosting and Random Forest. The regression results reveal that CO₂ emissions exert a negative impact on LEX, whereas GDP, health expenditure, education, and individual internet use, rule of law, government effectiveness, and R&D positively influence LEX. Meanwhile, the machine learning models highlight GDP and health expenditure as the most critical drivers of LEX, while CO₂ emissions and internet use display relatively minor effects, suggesting limited significance across model frameworks. For predictive performance, Gradient Boosting consistently outperforms Random Forest, achieving lower MAE and RMSE alongside a higher R2.
This study has several policy implications to enhance the LEX. First, Governments should reduce reliance on fossil fuels by expanding investment in renewable energy sources such as solar, wind, and hydropower, thereby lowering CO2E and improving public health. Second, enforcing stricter emission standards for industries, vehicles, and urban development can curb air pollution, reduce disease burden, and enhance LEX. Third, developing eco-friendly public transport, green spaces, and sustainable waste management systems will improve air quality, mitigate CO2E, and create healthier living environments that support longer lifespans. Fourth, ensure strict implementation of health, environmental, and labor laws so citizens have safer working conditions, cleaner environments, and better access to justice, which directly improves health outcomes. Fifth, Curb corruption and improve efficiency in public service delivery, especially in healthcare and education, so that resources reach vulnerable populations and contribute to longer, healthier lives. Six, build effective institutions that can design and implement evidence-based health policies, ensure equitable healthcare access, and improve emergency response systems, thereby extending LEX. Seventh, Governments should allocate more funding to medical and healthcare research to develop new treatments, vaccines, and diagnostic tools that directly improve population health and longevity. Eight, Encourage private sector and university collaborations to promote technological advancements in medical devices, telemedicine, and health monitoring systems, enhancing the quality and accessibility of healthcare. Ninth, implement programs that train healthcare professionals and disseminate research findings nationwide, ensuring that R&D innovations translate into practical improvements in health services and LEX.
In conclusion, this study acknowledges several limitations that can guide future research. First, the analysis focused exclusively on the top 20 countries with the highest LEX, which may limit the generalizability of the findings. Future studies should consider a broader set of countries, including developed, emerging, and developing nations, to capture more diverse socio-economic and institutional contexts. Second, this study examined only a limited set of variables as determinants of LEX, and additional factors such as environmental quality, healthcare infrastructure, and social policies could be incorporated in subsequent research. Third, while the study employed the traditional PMG estimator, it did not consider alternative approaches such as the CS-ARDL model, which may provide additional insights into heterogeneous dynamics across countries. Finally, in terms of machine learning methods, the study relied solely on Random Forest and Gradient Boosting techniques; future research should explore other advanced ML approaches, such as XGBoost, LightGBM, or deep learning models, to improve predictive accuracy and robustness.
Data availability statement
The raw data supporting the conclusions of this article will be made available by the authors, without undue reservation.
Author contributions
HZ: Writing – original draft, Writing – review & editing, Conceptualization. HQ: Methodology, Writing – review & editing, Writing – original draft. XL: Writing – original draft, Writing – review & editing, Methodology. IU: Formal analysis, Data curation, Writing – review & editing. XZ: Supervision, Project administration, Writing – review & editing, Funding acquisition. RL: Validation, Resources, Funding acquisition, Writing – review & editing, Visualization.
Funding
The author(s) declare that financial support was received for the research and/or publication of this article. Zhejiang Province Chinese Medicine Science and Technology Program Project of 2025‘Construction and Preliminary Application of a Chinese Medicine Characteristic Nutrition Management Plan for Patients with Intestinal Graft-versusHost Disease Complicated by Hematopoietic Stem Cell Transplantation’(Project Number: 2025ZL041). Research results of the 2025 Shandong Provincial Humanities and Social Sciences Youth Key Project.
Conflict of interest
The authors declare that the research was conducted in the absence of any commercial or financial relationships that could be construed as a potential conflict of interest.
Generative AI statement
The author(s) declare that Gen AI was used in the creation of this manuscript. Artificial intelligence (AI) tools, including ChatGPT, and language enhancement software such as Grammarly were used in the preparation of this manuscript for tasks such as, editing, and language improvement. All AI-assisted content was carefully reviewed and revised to ensure accuracy, originality, and compliance with ethical standards. The final responsibility for the manuscript remains with the authors.
Any alternative text (alt text) provided alongside figures in this article has been generated by Frontiers with the support of artificial intelligence and reasonable efforts have been made to ensure accuracy, including review by the authors wherever possible. If you identify any issues, please contact us.
Publisher’s note
All claims expressed in this article are solely those of the authors and do not necessarily represent those of their affiliated organizations, or those of the publisher, the editors and the reviewers. Any product that may be evaluated in this article, or claim that may be made by its manufacturer, is not guaranteed or endorsed by the publisher.
References
1. Kurniawan, R, and Managi, S. Economic growth and sustainable development in Indonesia: an assessment. Bull Indones Econ Stud. (2018) 54:339–61. doi: 10.1080/00074918.2018.1450962
2. Hendrawaty, E, Shaari, MS, Kesumah, FSD, and Ridzuan, AR. Economic growth, financial development, energy consumption and life expectancy: fresh evidence from ASEAN countries. Int J Energy Econ Policy. (2022) 12:444–8. doi: 10.32479/ijeep.12670
3. Shahbaz, M, Shahzad, SJH, Ahmad, N, and Alam, S. Financial development and environmental quality: the way forward. Energy Policy. (2016) 98:353–64. doi: 10.1016/j.enpol.2016.09.002
4. Maichal, M, Witera, YJ, Chananta, JP, and Chendry, EJW. Effects of GDP per capita, FDI, and exports on life expectancy: a panel regression analysis. E-Jurnal Ekonomi Pembangunan. (2025) 14. doi: 10.24843/EEP.2025.v14.i03.p05
5. Miladinov, G. Socioeconomic development and life expectancy relationship: evidence from the EU accession candidate countries. Genus. (2020) 76. doi: 10.1186/s41118-019-0071-0
6. Amin, NAM, Shaari, MSS, Sulong, A, and Masnan, F. The impacts of urbanization and economic growth on LIFE expectancy in the ASEAN-5 countries. Asian People J. (2024) 7:126–37. doi: 10.37231/apj.2024.7.1.605
7. Chen, Z, Ma, Y, Hua, J, Wang, Y, and Guo, H. Impacts from economic development and environmental factors on life expectancy: a comparative study based on data from both developed and developing countries from 2004 to 2016. Int J Environ Res Public Health. (2021) 18:8559. doi: 10.3390/ijerph18168559
9. Ebenstein, A, Fan, M, Greenstone, M, He, G, Yin, P, and Zhou, M. Growth, pollution, and life expectancy: China from 1991–2012. Am Econ Rev. (2015) 105:226–31. doi: 10.1257/aer.p20151094
10. Shahbaz, M, Shafiullah, M, and Mahalik, MK. The dynamics of financial development, globalisation, economic growth and life expectancy in sub-Saharan Africa. Aust Econ Pap. (2019) 58:444–79. doi: 10.1111/1467-8454.12163
11. Balan, F. Environmental quality and its human health effects: a causal analysis for the EU-25. Int J Appl Econ. (2016) 13:57–71.
12. Rjoub, H, Odugbesan, JA, Adebayo, TS, and Wong, WK. Investigating the causal relationships among carbon emissions, economic growth, and life expectancy in Turkey: evidence from time and frequency domain causality techniques. Sustainability. (2021) 13:2924. doi: 10.3390/su13052924
13. Matthew, OA, Owolabi, OA, Osabohien, R, Urhie, E, Ogunbiyi, T, Olawande, TI, et al. Carbon emissions, agricultural output and life expectancy in West Africa. Int J Energy Econ Policy. (2020) 10:489–96. doi: 10.32479/ijeep.9177
15. Osabohien, R, Aderemi, TA, Akindele, DB, and Jolayemi, LB. Carbon emissions and life expectancy in Nigeria. Int J Energy Econ Policy. (2021) 11:497–501.
16. World Health Organization (2023). Air quality and health. Available online at: https://www.who.int/teams/environment-climate-change-and-health/air-quality-and-health/health-impacts
17. Segbefia, E, Dai, B, Adotey, P, Sampene, AK, Amoako, T, and Lamptey, C. Renewable energy, technological innovation, carbon emission, and life expectancy nexus: experience from the NAFTA economies. Environ Sci Pollut Res. (2023) 30:108959–78. doi: 10.1007/s11356-023-29983-8
18. Hill, TD, Jorgenson, AK, Ore, P, Balistreri, KS, and Clark, B. Air quality and life expectancy in the United States: an analysis of the moderating effect of income inequality. SSM Popul Health. (2019) 7:100346. doi: 10.1016/j.ssmph.2018.100346
19. Balakrishnan, K, Dey, S, Gupta, T, Dhaliwal, RS, Brauer, M, Cohen, AJ, et al. The impact of air pollution on deaths, disease burden, and life expectancy across the states of India: the global burden of disease study 2017. Lancet Planet Health. (2019) 3:e26–39. doi: 10.1016/S2542-5196(18)30261-4
20. Mahalik, MK, Le, TH, Le, HC, and Mallick, H. How do sources of carbon dioxide emissions affect life expectancy? Insights from 68 developing and emerging economies. World Dev Sustain. (2022) 1:100003. doi: 10.1016/j.wds.2022.100003
21. Shaari, MS, Majekodunmi, TB, Sulong, A, Esquivias, MA, and Yusoff, WS. Examining the interplay between green technology, CO2 emissions, and life expectancy in the ASEAN-5 countries: insights from the panel FMOLS and DOLS approaches. Discover Sustain. (2024) 5:456. doi: 10.1007/s43621-024-00706-4
22. Das, S, and Debanth, A. Impact of CO2 emission on life expectancy in India: an autoregressive distributive lag (ARDL) bound test approach. Future Bus J. (2023) 9:5. doi: 10.1186/s43093-022-00179-9
23. Majekodunmi, TB, Shaari, MS, Abidin, NZ, Harun, NH, and Muhsain, SNF. Remittance inflows, economic output, electricity use and CO 2 emissions in the D-8 countries: a panel ARDL analysis. Int Energy J. (2023) 23
24. Chatterjee, N, Chatterjee, T, Nath, A, and Koley, B. Life expectancy amid higher carbon emissions: a panel data analysis In: Climate change and regional socio-economic Systems in the Global South: Resilience strategies for sustainable development. Singapore: Springer Nature (2024). 39–54.
25. Ivanova, AE, and Petrova, NG. Premature mortality and healthy life expectancy in the context of the national development objectives of Russia. Population. (2020) 23:1–15. doi: 10.19181/population.2020.23.4.8
26. Teh, WS, Ling, GLHT, Rusli, N, Teh, HH, Tan, KP, Faisal, S, et al. Factors influencing life expectancy: global evidence from 125 countries. Int J Built Environ Sustain. (2025) 12:17–28. doi: 10.11113/ijbes.v12.n2.1294
27. Liu, H, and Zhong, K. Relationship between health spending, life expectancy and renewable energy in China: a new evidence from the VECM approach. Front Public Health. (2022) 10:993546. doi: 10.3389/fpubh.2022.993546
28. Alimi, OY, Odugbemi, AA, and Osisanwo, BG. Public policy and health outcomes: impact of health expenditure on life expectancy and child mortality. J Bus Adm Soc Stud. (2023) 7:19–31. doi: 10.5152/JBASS.2023.23006
29. WHO (2019). Health, environment and climate change, seventy-second world health assembly. World Health Organization. Available online at: www.searo.who.int/docs/default-source/climate-change/who-glo-bal-strategy-on-health-environment-and-climate-change-a7215.pdf?sfvrsn=20e72548_2
30. Mackenbach, JP, Slobbe, L, Looman, CWN, van der Heide, A, Polder, J, and Garssen, J. Sharp upturn of life expectancy in the Netherlands: effect of more health care for the elderly? Eur J Epidemiol. (2011) 26:903–14. doi: 10.1007/s10654-011-9633-y
31. Papanicolas, I, Mossialos, E, Gundersen, A, Woskie, L, and Jha, AK. Performance of UK National Health Service compared with other high income countries: observational study. BMJ. (2019) 367. doi: 10.1136/bmj.l6326
32. Roffia, P, Bucciol, A, and Hashlamoun, S. Determinants of life expectancy at birth: a longitudinal study on OECD countries. Int J Health Econ Manag. (2023) 23:189–212. doi: 10.1007/s10754-022-09338-5
33. Rana, RH, Alam, K, and Gow, J. Health expenditure, child and maternal mortality nexus: a comparative global analysis. BMC Int Health Hum Rights. (2018) 18:29. doi: 10.1186/s12914-018-0167-1
34. Rhee, HJ. Effects of health care expenditure on the infant mortality rate and life expectancy at birth in Korea. Int J Cont. (2012) 8:52–6. doi: 10.5392/IJoC.2012.8.3.052
35. Zhang, H, Zhan, Y, and Chen, K. Do education, urbanization, and green growth promote life expectancy? Front Public Health. (2025) 12:1517716. doi: 10.3389/fpubh.2024.1517716
36. Zhang, Y, Huang, M, Zhang, Y, Kong, X, Shi, K, and Zhu, B. Air pollution and life expectancy: the role of education and health expenditure in China. Front Public Health. (2025) 13:1553039. doi: 10.3389/fpubh.2025.1553039
37. Goel, MM, and Garg, I. Public expenditure on health and its impact on health infrastructure and health status in Haryana. Voice Res. (2016) 5:9–18.
38. Boundioa, J, and Thiombiano, N. Threshold effect of governance quality in the relationship between public health expenditure and life expectancy at birth in the west African economic and monetary union. BMC Health Serv Res. (2025) 25:432. doi: 10.1186/s12913-025-12603-1
39. Ozyilmaz, A, Bayraktar, Y, Isik, E, Toprak, M, Er, MB, Besel, F, et al. The relationship between health expenditures and economic growth in EU countries: empirical evidence using panel fourier Toda–yamamoto causality test and regression models. Int J Environ Res Public Health. (2022) 19:15091. doi: 10.3390/ijerph192215091
40. Gani, A. Health care financing and health outcomes in Pacific Island countries. Health Policy Plan. (2009) 24:72–81. doi: 10.1093/heapol/czn044
41. Chen, Q, Liang, M, Li, Y, Guo, J, Fei, D, Wang, L, et al. Mental health care for medical staff in China during the COVID-19 outbreak. Lancet Psychiatry. (2020) 7:e15–6. doi: 10.1016/S2215-0366(20)30078-X
42. Shreffler, J, Petrey, J, and Huecker, M. The impact of COVID-19 on healthcare worker wellness: a scoping review. West J Emerg Med. (2020) 21:1059–66. doi: 10.5811/westjem.2020.7.48684
43. Cullen, W, Gulati, G, and Kelly, BD. Mental health in the COVID-19 pandemic. QJM Int J Med. (2020) 113:311–2. doi: 10.1093/qjmed/hcaa110
44. Sarıyıldız, AY. Healthcare workforce and expenditure: influences on life expectancy and infant mortality in Turkey. Anatolian Curr Med J. (2025) 7:77–83.
45. Coelho, TR, Segatto, AP, and Frega, JR. Analysing ICT and development from the perspective of the capabilities approach: a study in South Brazil. Elect J Inf Syst Dev Ctries. (2015) 67:1–14. doi: 10.1002/j.1681-4835.2015.tb00480.x
46. Majeed, MT, and Khan, FN. Do information and communication technologies (ICTs) contribute to health outcomes? An empirical analysis. Qual Quant. (2019) 53:183–206. doi: 10.1007/s11135-018-0741-6
47. Ferguson, T. Online patient-helpers and physicians working together: a new partnership for high quality health care. BMJ. (2000) 321:1129–32. doi: 10.1136/bmj.321.7269.1129
48. Laing, A, Hogg, G, and Winkelman, D. Healthcare and the information revolution: re-configuring the healthcare service encounter. Health Serv Manag Res. (2004) 17:188–99. doi: 10.1258/0951484041485584
49. Holt-Lunstad, J, Smith, TB, Baker, M, Harris, T, and Stephenson, D. Loneliness and social isolation as risk factors for mortality: a meta-analytic review. Perspect Psychol Sci. (2015) 10:227–37. doi: 10.1177/1745691614568352
50. Ahmed, DE, and Almoree, MA. The impact of information and communications technology on life expectancy: the case of Saudi Arabia. Issues Econ Bus. (2024) 10:1. doi: 10.5296/ieb.v10i1.21993
51. International Telecommunication Union, (2023). Available online at: https://www.itu.int/wrc-23/ar/
52. Institute of Medicine (IOM) (2002) —The future of the public‘s health in the 21st century—, committee on assuring the health of the public in the 21st century. Available online at: http://www.nap.edu/catalog.php?record_id=10548.
53. Stephens, G., and Woods, G. (2005). An initial investigation into the role of health informatics in the context of Global Health. In 18th IEEE symposium on computer-based medical systems (CBMS'05) (pp. 214–219). IEEE.
54. Eysenbach, G. Poverty, human development, and the role of eHealth. J Med Internet Res. (2007) 9:e34. doi: 10.2196/jmir.9.4.e34
56. Raghupathi, W, and Wu, SJ. The relationship between information and communication technologies and the delivery of public health: a country-level study. Commun Assoc Inf Syst. (2011) 28:8. doi: 10.17705/1CAIS.02808
57. Denney, JT, Rogers, RG, Hummer, RA, and Pampel, FC. Education inequality in mortality: the age and gender specific mediating effects of cigarette smoking. Soc Sci Res. (2010) 39:662–73. doi: 10.1016/j.ssresearch.2010.02.007
58. Laaksonen, M, Talala, K, Martelin, T, Rahkonen, O, Roos, E, Helakorpi, S, et al. Health behaviours as explanations for educational level differences in cardiovascular and all-cause mortality: a follow-up of 60 000 men and women over 23 years. Eur J Pub Health. (2008) 18:38–43. doi: 10.1093/eurpub/ckm051
59. Mirowsky, J, and Ross, CE. Education, social status, and health. New York: Aldine de Gruyter (2003).
60. House, JS, Landis, KR, and Umberson, D. Social relationships and health. Science. (1988) 241:540–5. doi: 10.1126/science.3399889
61. Luy, M, Zannella, M, Wegner-Siegmundt, C, Minagawa, Y, Lutz, W, and Caselli, G. The impact of increasing education levels on rising life expectancy: a decomposition analysis for Italy, Denmark, and the USA. Genus. (2019) 75:11. doi: 10.1186/s41118-019-0055-0
62. Qian, Z, and Preston, SH. Changes in American marriage, 1972 to 1987: availability and forces of attraction by age and education. Am Sociol Rev. (1993) 58:482–95. doi: 10.2307/2096072
63. Kawachi, I, Adler, NE, and Dow, WH. Money, schooling, and health: mechanisms and causal evidence. Ann N Y Acad Sci. (2010) 1186:56–68. doi: 10.1111/j.1749-6632.2009.05340.x
64. Piha, K, Laaksonen, M, Martikainen, P, Rahkonen, O, and Lahelma, E. Socio-economic and occupational determinants of work injury absence. Europ J Public Health. (2013) 23:693–8. doi: 10.1093/eurpub/cks162
65. Chetty, R, Stepner, M, Abraham, S, Lin, S, Scuderi, B, Turner, N, et al. The association between income and life expectancy in the United States, 2001-2014. JAMA. (2016) 315:1750–66. doi: 10.1001/jama.2016.4226
66. Danler, C, and Pfaff, K. The impact of an unequal distribution of education on inequalities in life expectancy. SSM Popul Health. (2021) 16:100954. doi: 10.1016/j.ssmph.2021.100954
67. McCarrier, KP, Zimmerman, FJ, Ralston, JD, and Martin, DP. Associations between minimum wage policy and access to health care: evidence from the behavioral risk factor surveillance system, 1996–2007. Am J Public Health. (2011) 101:359–67. doi: 10.2105/AJPH.2006.108928
68. Van Raalte, AA, Kunst, AE, Deboosere, P, Leinsalu, M, Lundberg, O, Martikainen, P, et al. More variation in lifespan in lower educated groups: evidence from 10 European countries. Int J Epidemiol. (2011) 40:1703–14. doi: 10.1093/ije/dyr146
69. Lucas, RE Jr. On the mechanics of economic development. J Monetr Econ. (1988) 22:3–42. doi: 10.1016/0304-3932(88)90168-7
70. Romer, PM. Increasing returns and long-run growth. J Polit Econ. (1986) 94:1002–37. doi: 10.1086/261420
71. Sart, G, Bayar, Y, and Danilina, M. Impact of education and income inequalities on life expectancy: insights from the new EU members. Front Public Health. (2024) 12:1397585. doi: 10.3389/fpubh.2024.1397585
72. Li, R, Zhan, Y, Tao, Y, Wang, R, Gu, X, He, Z, et al. Economic and social determinants of life expectancy in China. Front Public Health. (2025) 13:1554336. doi: 10.3389/fpubh.2025.1554336
73. Shaw, JW, Horrace, WC, and Vogel, RJ. The determinants of life expectancy: an analysis of the OECD health data. South Econ J. (2005) 71:768–83. doi: 10.1002/j.2325-8012.2005.tb00675.x
74. Kabir, M. Determinants of life expectancy in developing countries. J Develop Areas. (2008) 41:185–204. doi: 10.1353/jda.2008.0013
75. Lin, RT, Chen, YM, Chien, LC, and Chan, CC. Political and social determinants of life expectancy in less developed countries: a longitudinal study. BMC Public Health. (2012) 12:85. doi: 10.1186/1471-2458-12-85
76. Bayati, M, Akbarian, R, and Kavosi, Z. Determinants of life expectancy in eastern mediterranean region: a health production function. Int J Health Policy Manag. (2013) 1:57–61. doi: 10.15171/ijhpm.2013.09
77. Monsef, A, and Mehrjardi, AS. Determinants of life expectancy: a panel data approach. Asian Econ Financ Rev. (2015) 5:1251–7. doi: 10.18488/journal.aefr/2015.5.11/102.11.1251.1257
78. Sede, PI, and Ohemeng, W. Socio-economic determinants of life expectancy in Nigeria (1980–2011). Heal Econ Rev. (2015) 5:2. doi: 10.1186/s13561-014-0037-z
79. Gilligan, AM, and Skrepnek, GH. Determinants of life expectancy in the eastern Mediterranean region. Health Policy Plan. (2015) 30:624–37. doi: 10.1093/heapol/czu041
80. Hassan, FA, Minato, N, Ishida, S, and Mohamed Nor, N. Social environment determinants of life expectancy in developing countries: a panel data analysis. Glob J Health Sci. (2016) 9:105. doi: 10.5539/gjhs.v9n5p105
81. Rahman, MM, Rana, R, and Khanam, R. Determinants of life expectancy in most polluted countries: exploring the effect of environmental degradation. PLoS One. (2022) 17:e0262802. doi: 10.1371/journal.pone.0262802
82. Azam, M, Uddin, I, and Saqib, N. The determinants of life expectancy and environmental degradation in Pakistan: evidence from ARDL bounds test approach. Environ Sci Pollut Res. (2023) 30:2233–46. doi: 10.1007/s11356-022-22338-9
83. Ahmad, N, Raid, M, Alzyadat, J, and Alhawal, H. Impact of urbanization and income inequality on life expectancy of male and female in south Asian countries: a moderating role of health expenditures. Hum Soc Sci Commun. (2023) 10:1–9. doi: 10.1057/s41599-023-02005-1
84. Uddin, I, Khan, MA, Tariq, M, Khan, F, and Malik, ZK. Revisiting the determinants of life expectancy in Asia—exploring the role of institutional quality, financial development, and environmental degradation. Environ Dev Sustain. (2024) 26:11289–309. doi: 10.1007/s10668-023-03283-0
85. Wang, L, Li, Y, Li, H, Zhang, F, Rosenberg, M, Yang, L, et al. A study of air pollutants influencing life expectancy and longevity from spatial perspective in China. Sci Total Environ. (2014) 487:57–64.
86. Wen, M, and Gu, D. Air pollution shortens life expectancy and health expectancy for older adults: the case of China. J Gerontol A Biol Sci Med Sci. (2012) 67:1219–29. doi: 10.1093/gerona/gls094
87. Bates, DW, Cohen, M, Leape, LL, Overhage, JM, Shabot, MM, and Sheridan, T. Reducing the frequency of errors in medicine using information technology. J Am Med Inform Assoc. (2001) 8:299–308. doi: 10.1136/jamia.2001.0080299
88. Mithas, S., Khuntia, J., and Agarwal, R. (2009). Information technology and life expectancy: a country-level analysis.
89. Nenonen, M, and Nylander, O. A theoretical framework for health information systems. Int J Healthc Technol Manag. (2002) 4:467–77. doi: 10.1504/IJHTM.2002.002425
90. Pesaran, M. H. (2004) General diagnostic tests for cross section dependence in panels Cambridge Working Papers Economics 1240:1
91. Levin, A, Lin, CF, and Chu, CSJ. Unit root tests in panel data: asymptotic and finite-sample properties. J Econ. (2002) 108:1–24. doi: 10.1016/S0304-4076(01)00098-7
92. Pesaran, MH. A simple panel unit root test in the presence of cross-section dependence. J Appl Econ. (2007) 22:265–312. doi: 10.1002/jae.951
93. Im, KS, Pesaran, MH, and Shin, Y. Testing for unit roots in heterogeneous panels. J Econom. (2003) 115:53–74. doi: 10.1016/S0304-4076(03)00092-7
94. Pesaran, MH, Shin, Y, and Smith, RP. Pooled mean group estimation of dynamic heterogeneous panels. J Am Stat Assoc. (1999) 94:621–34. doi: 10.1080/01621459.1999.10474156
95. Phillips, PC, and Hansen, BE. Statistical inference in instrumental variables regression with I (1) processes. Rev Econ Stud. (1990) 57:99–125. doi: 10.2307/2297545
96. Johansen, S. Statistical analysis of cointegration vectors. J Econ Dynam Control. (1988) 12:231–54. doi: 10.1016/0165-1889(88)90041-3
97. Pesaran, MH, and Shin, Y. An autoregressive distributed lag modeling approach to Cointegration analysis In: S Strom, editor. Econometrics and economic theory in the 20th century: The Ragnar Frisch centennial symposium. Cambridge: Cambridge University Press (1999)
98. Khan, Z, and Khan, MA. The effect of monetary policy on income inequality: empirical evidence from Asian and African developing economies. J Cent Bank Theory Pract. (2023) 12:133–58. doi: 10.2478/jcbtp-2023-0028
99. Pedroni, P. Purchasing power parity tests in cointegrated panels. Rev Econ Stat. (2001) 83:727–31. doi: 10.1162/003465301753237803
100. Hamit-Haggar, M. Greenhouse gas emissions, energy consumption and economic growth: a panel cointegration analysis from Canadian industrial sector perspective. Energy Econ. (2012) 34:358–64. doi: 10.1016/j.eneco.2011.06.005
101. Kao, C, and Chiang, MH. On the estimation and inference of a cointegrated regression in panel data In: Nonstationary panels, panel cointegration, and dynamic panels : Emerald Group Publishing Limited (2001). 179–222. doi: 10.1016/S0731-9053(00)15007-8
102. Mihoub, A, Kahia, M, and Alswailim, M. Measuring the impact of technological innovation, green energy, and sustainable development on the health system performance and human well-being: evidence from a machine learning-based approach. AIMS Environ Sci. (2024) 11:703–22. doi: 10.3934/environsci.2024035
103. Friedman, JH. Greedy function approximation: a gradient boosting machine. Ann Stat. (2001) 29:1189–232. doi: 10.1214/aos/1013203451
104. Uddin, I, Khan, MA, and Tariq, M. Machine learning insights on inclusive growth determinants in Pakistan: examining the role of remittances and renewable energy in achieving SDG-8. Asia-Pacific Finan Markets. (2025) 1-32. doi: 10.1007/s10690-025-09548-0
105. Țarcă, V, Țarcă, E, and Moscalu, M. Social and economic determinants of life expectancy at birth in Eastern Europe. Healthcare. (2024) 12:1148.
106. Lee, CW, and Kim, MS. The relationship between internet environment and life expectancy in Asia. Rev Integr Bus Econ Res. (2019) 8:70–80.
107. Kim, JI, and Kim, G. Country-level socioeconomic indicators associated with healthy life expectancy: income, urbanization, schooling, and internet users: 2000–2012. Soc Indic Res. (2016) 129:391–402. doi: 10.1007/s11205-015-1107-2
108. Pu, H, Kang, W, Gao, W, Wang, S, Wu, R, and Ren, Z. Spatiotemporal effect of internet use on life expectancy: cross-country insight from a geographically and temporally weighted analysis. BMC Public Health. (2025) 25:569. doi: 10.1186/s12889-025-21760-1
109. Pinzon-Rondon, AM, Attaran, A, Botero, JC, and Ruiz-Sternberg, AM. Association of rule of law and health outcomes: an ecological study. BMJ Open. (2015) 5:e007004. doi: 10.1136/bmjopen-2014-007004
110. Muradov, AJ, Aydin, M, Bozatli, O, and Tuzcuoglu, F. Air pollution and life expectancy in the USA: do medical innovation, health expenditure, and economic complexity matter? Sci Total Environ. (2024) 946:174441. doi: 10.1016/j.scitotenv.2024.174441
111. WHO. (2016). World health statistics 2016 World Health Organization (WHO). Available online at: http://apps.who.int/iris/bitstream/handle/10665/170250/9789240694439_eng.pdf?sequence=1
Keywords: economic, social, institutional, life expectancy, machine leaning
Citation: Zhang H, Qiao H, Li X, Uddin I, Zhang X and Li R (2025) Determinants of life expectancy in high longevity countries: evidence from machine learning. Front. Public Health. 13:1687871. doi: 10.3389/fpubh.2025.1687871
Edited by:
Moosa Tatar, University of Houston, United StatesReviewed by:
Sandra Milena Castellar-Leones, National University of Colombia, ColombiaAmir Habibdoust Lafmajani, University of Missouri, United States
Copyright © 2025 Zhang, Qiao, Li, Uddin, Zhang and Li. This is an open-access article distributed under the terms of the Creative Commons Attribution License (CC BY). The use, distribution or reproduction in other forums is permitted, provided the original author(s) and the copyright owner(s) are credited and that the original publication in this journal is cited, in accordance with accepted academic practice. No use, distribution or reproduction is permitted which does not comply with these terms.
*Correspondence: Ruitao Li, cnVpdGFvaG9ob0BvdXRsb29rLmNvbQ==; Xiaolan Zhang, MTc3OTk4MzAyOUBxcS5jb20=