 Muhammet Ali Köroğlu
 Gamze Sart
 Yilmaz Bayar
 Marina Danilina
- 1Department of Social Work, Faculty of Economics and Administrative Sciences, Usak University, Usak, Türkiye
- 2Department of Educational Sciences, Hasan Ali Yucel Faculty of Education, Istanbul University-Cerrahpaşa, Istanbul, Türkiye
- 3Department of Public Finance, Bandirma Onyedi Eylül University, Balikesir, Türkiye
- 4Department of Economics, Plekhanov Russian University of Economics (PRUE), Moscow, Russia
- 5Department of Economics, Financial University under the Government of the Russian Federation, Moscow, Russia
Background: Improvements in life expectancy, along with decreases in fertility rates, have caused population aging in many countries. However, the environmental, economic, and social determinants of older adults’ health have not been sufficiently researched.
Methods: The objective of this research is to explore the effects of CO2 emissions, per capita GDP, and public and private health expenditures on the health of older adults in E7 countries during the period 2000–2021, using causality and cointegration methods.
Results: The findings of the JKS causality test indicate a reciprocal interaction among life expectancy at age 60 (LE60), healthy life expectancy at age 60 (HALE60), CO2 emissions, per capita GDP, and public and private health expenditures. Furthermore, the findings of the long-term analysis reveal that CO2 emissions negatively impact LE60 and HALE60, whereas per capita GDP and public and private health expenditures positively influence LE60 and HALE60.
Conclusion: The findings of this study highlight that the stringency of environmental policies, development of renewable energy technologies, income equality, and efficiency of health and social security systems are crucial for improving LE60 and HALE60.
1 Introduction and background
In recent years, human longevity has increased globally as a result of advances in medicine, science, and economic and social development. In this regard, life expectancy at birth (LEB) globally reached 73.3 years in 2024 from 64.9 years in 1995 (1). However, fertility rates have declined in many countries, mainly because of economic insecurity, higher education, urbanization, family postponement, and an increase in women’s employment (2). Consequently, the phenomenon of population aging has begun to be witnessed in many countries, and the number of people aged 60 years and older is forecasted to increase from 1.1 billion in 2023 to 1.4 billion by 2030 (1). In addition, many countries have increased their retirement age in parallel with an increase in life expectancy.
Increases in life expectancy are significant for economic growth through human and physical capital investment channels. On the one hand, longer life expectancy positively affects savings and, in turn, stimulates economic growth by increasing physical capital investment, as suggested by neoclassical and endogenous growth models (3). Moreover, improvements in life expectancy imply higher returns on human capital, which can foster economic growth by encouraging further investments in education and skill development (3). However, empirical studies on the growth effects of life expectancy remain inconclusive (4–8).
In light of the above considerations, promoting the health of older adults is crucial for maintaining active participation in the family and community. In this regard, air pollution is one of the major environmental risks to health, and nine out of ten people live in a low air quality environment. Approximately seven million people worldwide die annually from air pollution (9). Furthermore, studies on the impact of air pollution on cardiovascular diseases (CVDs) have revealed a strong relationship between short- and long-term air pollution exposure and CVD morbidity and mortality, blood pressure, ischemic heart disease, and stroke (10). Therefore, CO₂ emissions, primarily produced by fossil fuel combustion, industrial production, transportation, and electricity generation, are among the dominant drivers of air pollution, global warming, and climate change. Climate change is another fundamental threat to human health. More frequent and intensifying weather events, such as floods, storms, extreme heat, wildfires, and droughts, resulting from global warming and climate change, may increase the risk of noncommunicable diseases and deaths, the emergence and spread of infectious diseases, and health emergencies (11). As a result, climate change is predicted to lead 250,000 additional deaths per year through heat stress from undernutrition, malaria, and diarrhea between 2030 and 2050 (11). In summary, CO₂ emissions may negatively affect human health through multiple channels, including air pollution, increased temperatures, and climate change (12). Conversely, an increase in life expectancy can contribute to higher CO₂ emissions by prolonging individuals’ economic and social activities. Thus, a feedback relationship between life expectancy and CO₂ emissions is theoretically plausible.
Relatively higher income levels enable individuals to access goods and services, such as nutritious food, improved sanitation, safe water, and higher-quality medical care, all of which support longer and healthier lives (12). Preston (13) examined the relationship between life expectancy at birth (LEB) and per capita GDP during the 1900s, 1930s, and 1960s and suggested that individuals in countries with relatively higher per capita GDP generally had higher life expectancies. However, the strength of this relationship diminishes over time. In other words, countries with low per capita GDP experienced greater increases in LEB as their income levels increased, whereas countries with high per capita GDP recorded relatively smaller gains. The outward shift of the Preston curve was attributed to exogenous factors such as improvements in nutrition and literacy (13). Consequently, a positive influence of per capita GDP on LEB is theoretically expected. Conversely, increases in the LEB are also expected to affect per capita GDP through physical and human capital channels.
Finally, health expenditure can positively affect life expectancy by providing higher-quality healthcare services through improved medical facilities and better physicians (14). Moreover, spending on preventive measures, curative care, nutrition, and vaccination can enhance life expectancy (15). Conversely, increases in life expectancy may lead to higher health expenditures as older individuals typically require more intensive healthcare (16).
The main objective of this study is to analyze the effects of CO₂ emissions, per capita GDP, and public and private health expenditures on the health of older adults, measured by life expectancy at age 60 (LE60) and healthy life expectancy at age 60 (HALE60) in the E7 countries—Brazil, China, India, Indonesia, Mexico, Russia, and Türkiye—which represent the strongest economic performers among emerging economies. As shown in Table 1, China, India, Indonesia, and Türkiye experienced substantial increases in both per capita CO₂ emissions and per capita GDP between 2000 and 2021. However, the per capita health expenditures of E7 countries generally lagged behind those of developed countries during this period. In particular, per capita health expenditures in India, Indonesia, and Türkiye will remain very low, amounting to US$76, US$159, and US$431, respectively, in 2021. Over the study period, only China achieved significant progress in LE60 and HALE60, largely because of notable increases in per capita GDP and health expenditure.
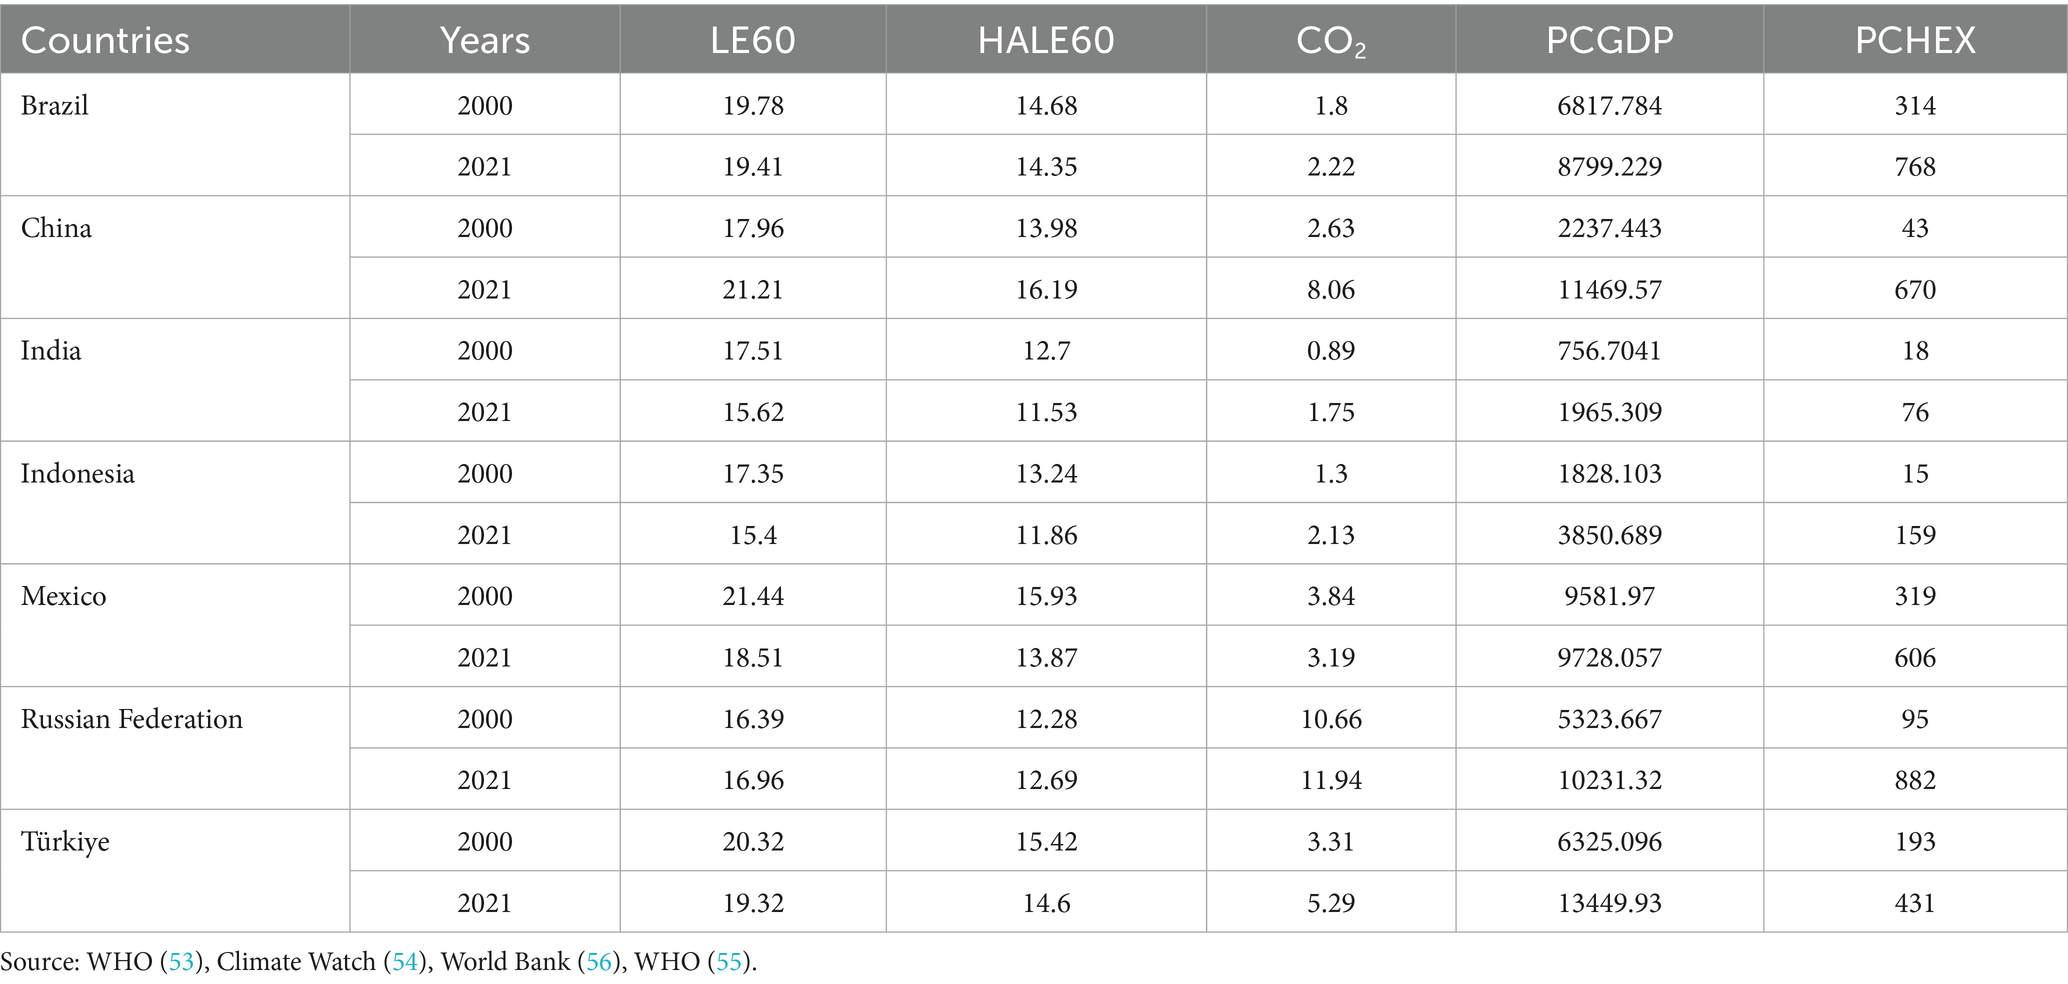
Table 1. LE60, HALE60, CO2, PCGDP as per capita GDP, and PCHEX as per capita current health expenditures in E7 countries (2000, 2021).
In the empirical literature, most studies have examined the relationship between CO₂ emissions, per capita GDP, health expenditures, and life expectancy at birth (LEB), with the exception of Aytemiz et al. (17) and Magazzino et al. (18). Therefore, this study is among the first to investigate the effects of CO₂ emissions, per capita GDP, and health expenditures on the health of older adults. Moreover, while scholars have typically focused on the impact of CO₂ emissions, per capita GDP, and health expenditures on LEB, the reverse effects of life expectancy on these variables have not been adequately explored. Hence, the second contribution of this study is to conduct a two-way analysis of CO₂ emissions, per capita GDP, public and private health expenditures, and LE60/HALE60.
The next section presents a summary of the empirical literature on LE60, HALE60, CO₂ emissions, per capita GDP, and health expenditures. Section 3 outlines the study’s dataset and methodology. Section 4 reports the econometric tests and discusses the results of the study. Finally, Section 5 concludes the study.
2 Literature overview
The proportion of older people in the world’s population has been increasing; however, the determinants of older adults’ health have not been adequately researched. The relatively few empirical studies available suggest that income level, financial security, physical and social environments, access to health services, physical activity, lifelong learning, and personal factors are significant determinants of older adults’ health (19–21). Building on this limited literature, this study examines the relationship between older adults’ health, CO₂ emissions, per capita GDP, and health expenditures.
In the associated literature, academicians have usually explored the connection between CO2 emissions and LEB, as shown in Table 2. In this regard, the vast majority of studies, including those in references (14, 22–34) identified a negative connection between CO2 emissions and LEB, whereas the studies in references (35–37) uncovered a positive connection between CO2 emissions and LEB. On the other hand, Das and Debanth (38) and Azam and Adeleye (39) disclosed mixed results, and Redzwan and Ramli (40) and Hasnawati et al. (41) found an insignificant connection between the two variables. Furthermore, Rahman et al. (23), Javanshirova (26), and Rjoub et al. (35) determined a causal connection from CO2 emissions to LEB, and Khan et al. (34) disclosed a bilateral causal connection between LEB and carbon dioxide emissions, while Hasnawati et al. (41) unveiled an insignificant interplay between the two variables.
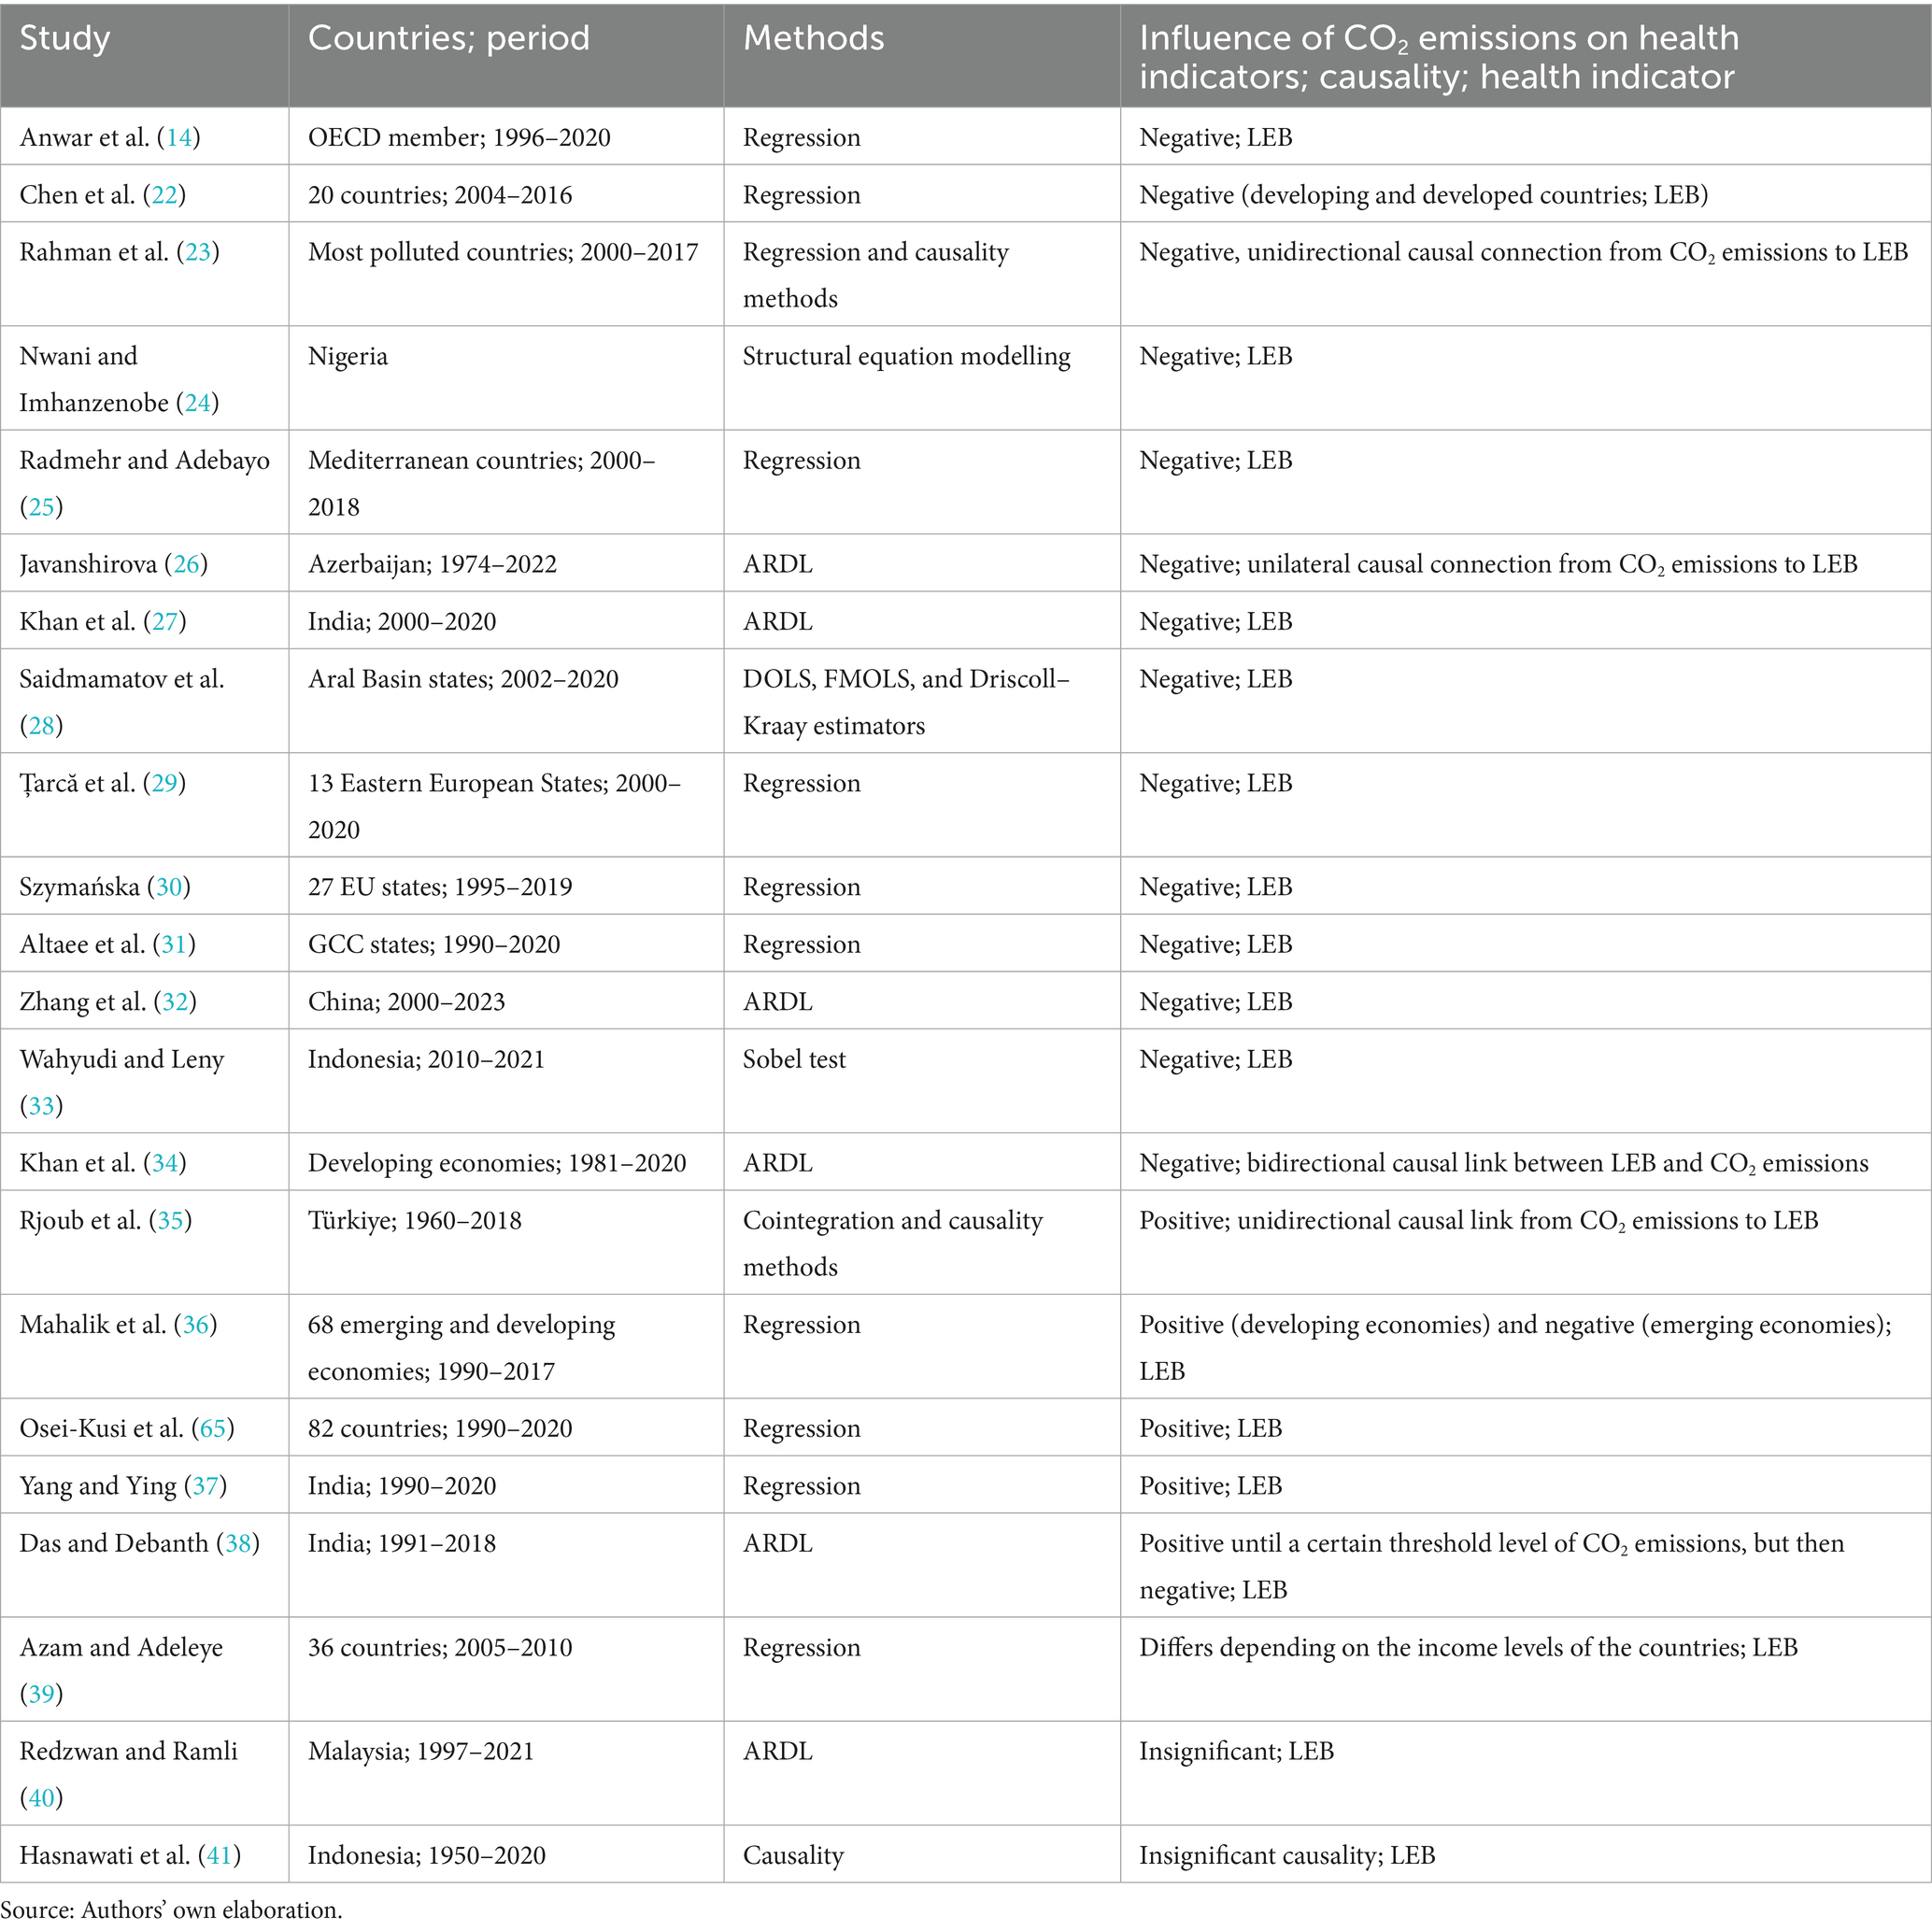
Table 2. Literature on the connection between CO2 emissions and life expectancy.
The following hypotheses were identified based on theoretical views and empirical literature evidence:
Hypothesis 1. CO2 emissions negatively impact LE60 and HALE60 in the long term.
Hypothesis 2. There exists a feedback interplay between CO2 emissions, LE60, and HALE60.
Income level is one of the dominant determinants of public health, and in turn, nearly all studies introduced in Table 3, such as Anwar et al. (14), Aytemiz et al. (17), Magazzino et al. (18), Chen et al. (22), Radmehr and Adebayo (25), Țarcă et al. (29), Miladinov (42), Şenol et al. (43), Shi et al. (44), Morina et al. (45), and Karunarathne et al. (46), revealed a positive link between per capita GDP and LEB. Meanwhile, Magazzino et al. (18) found unidirectional causality from LEB, LE40, and LE60 to per capita GDP, and Alwago (47) found an insignificant causal link between LEB and per capita GDP.
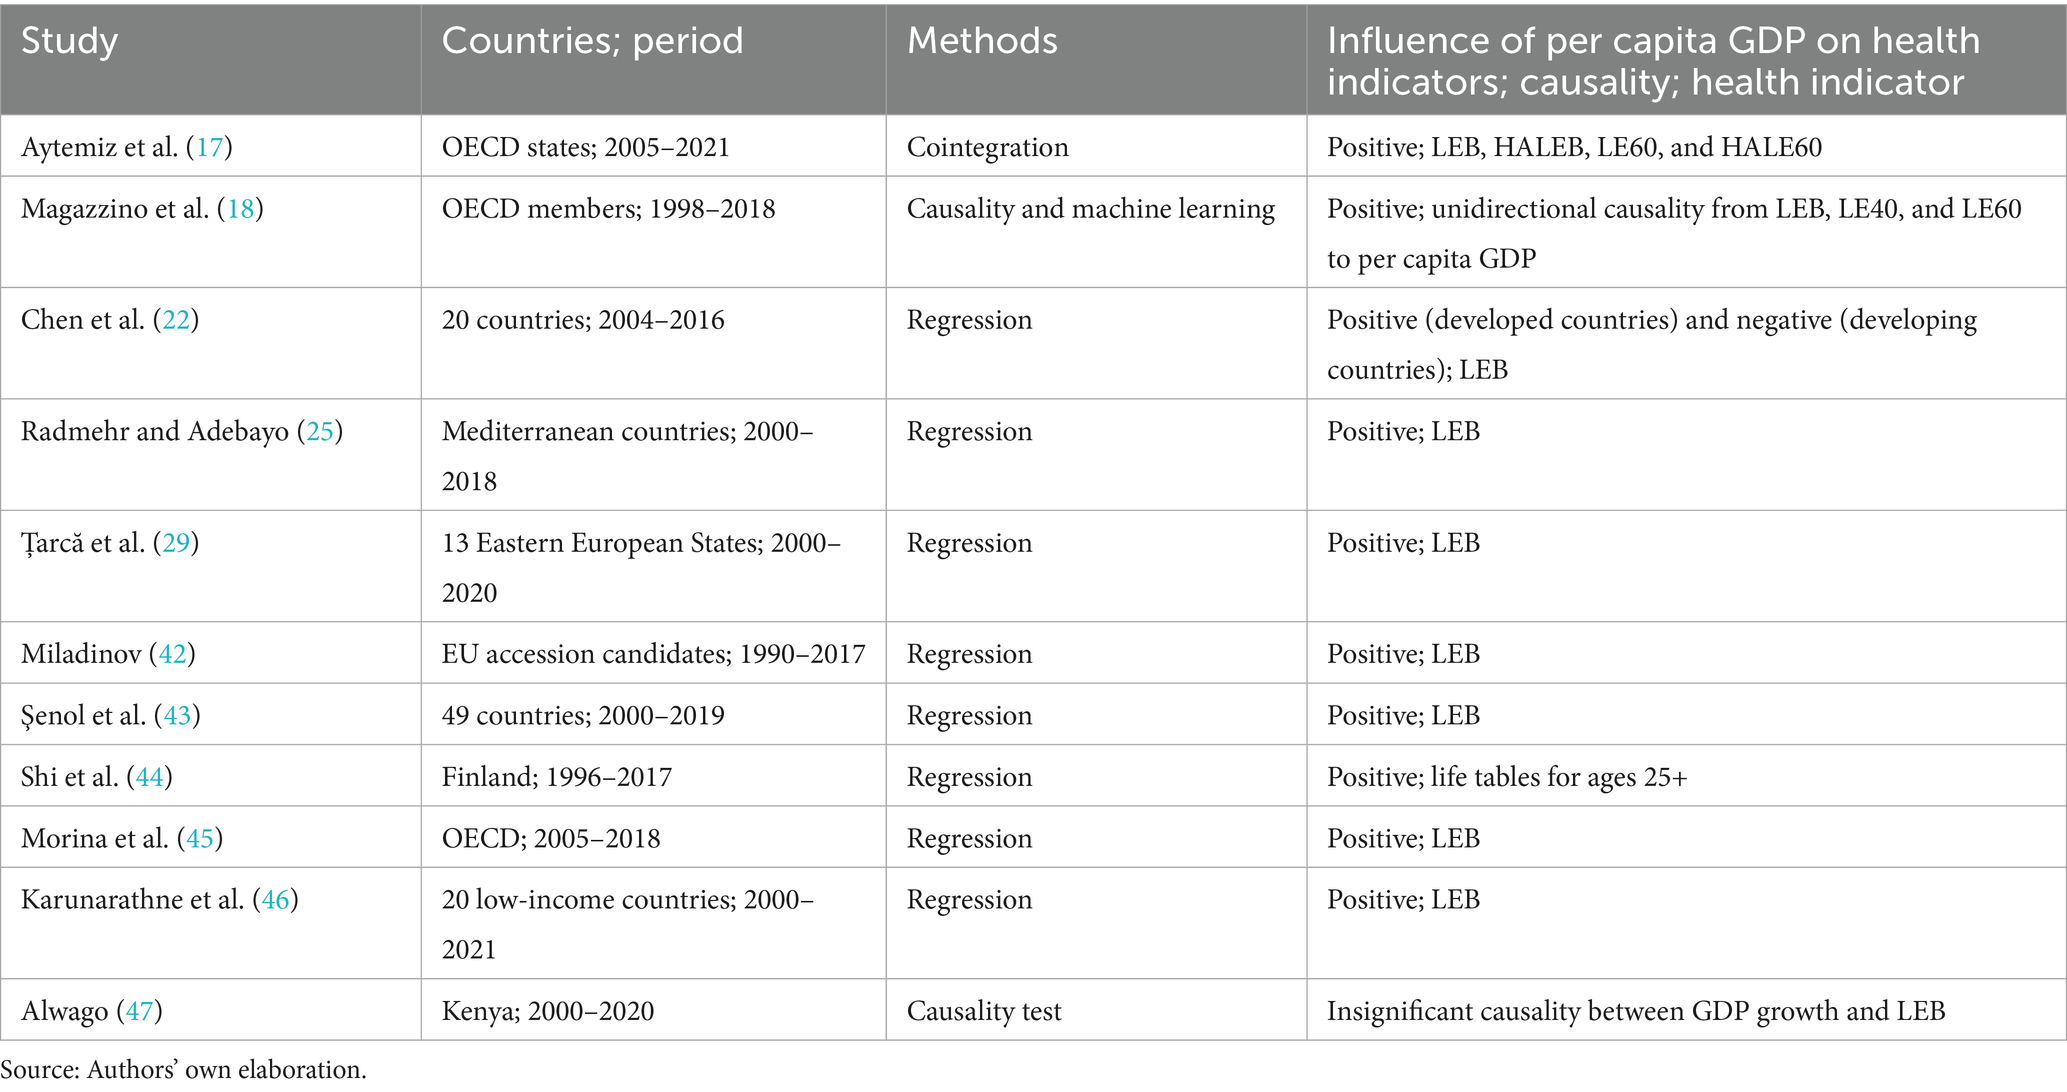
Table 3. Literature on the connection between income level and life expectancy.
The following hypotheses are identified based on theoretical views and empirical literature evidence:
Hypothesis 3. Per capita GDP positively impacts LE60 and HALE60 in the long term.
Hypothesis 4. There exists a feedback interplay between per capita GDP, LE60, and HALE60.
Health expenditure is also one of the crucial factors behind public health, together with per capita GDP. The literature summary in Table 4 indicated that nearly all studies, including Anwar et al. (14), Bayar et al. (16), Aytemiz et al. (17), Radmehr and Adebayo (25), Morina et al. (45), Rezapour et al. (48), Bunyaminu et al. (49), Sarıyıldız (50), and Alimi et al. (51), found a positive connection between diverse indicators of health expenditures and LEB, while Saraç and Torun (52) disclosed an insignificant link between LEB and public and private health expenditures. Bayar et al. (16) also discovered a unidirectional LEB for health expenditure.
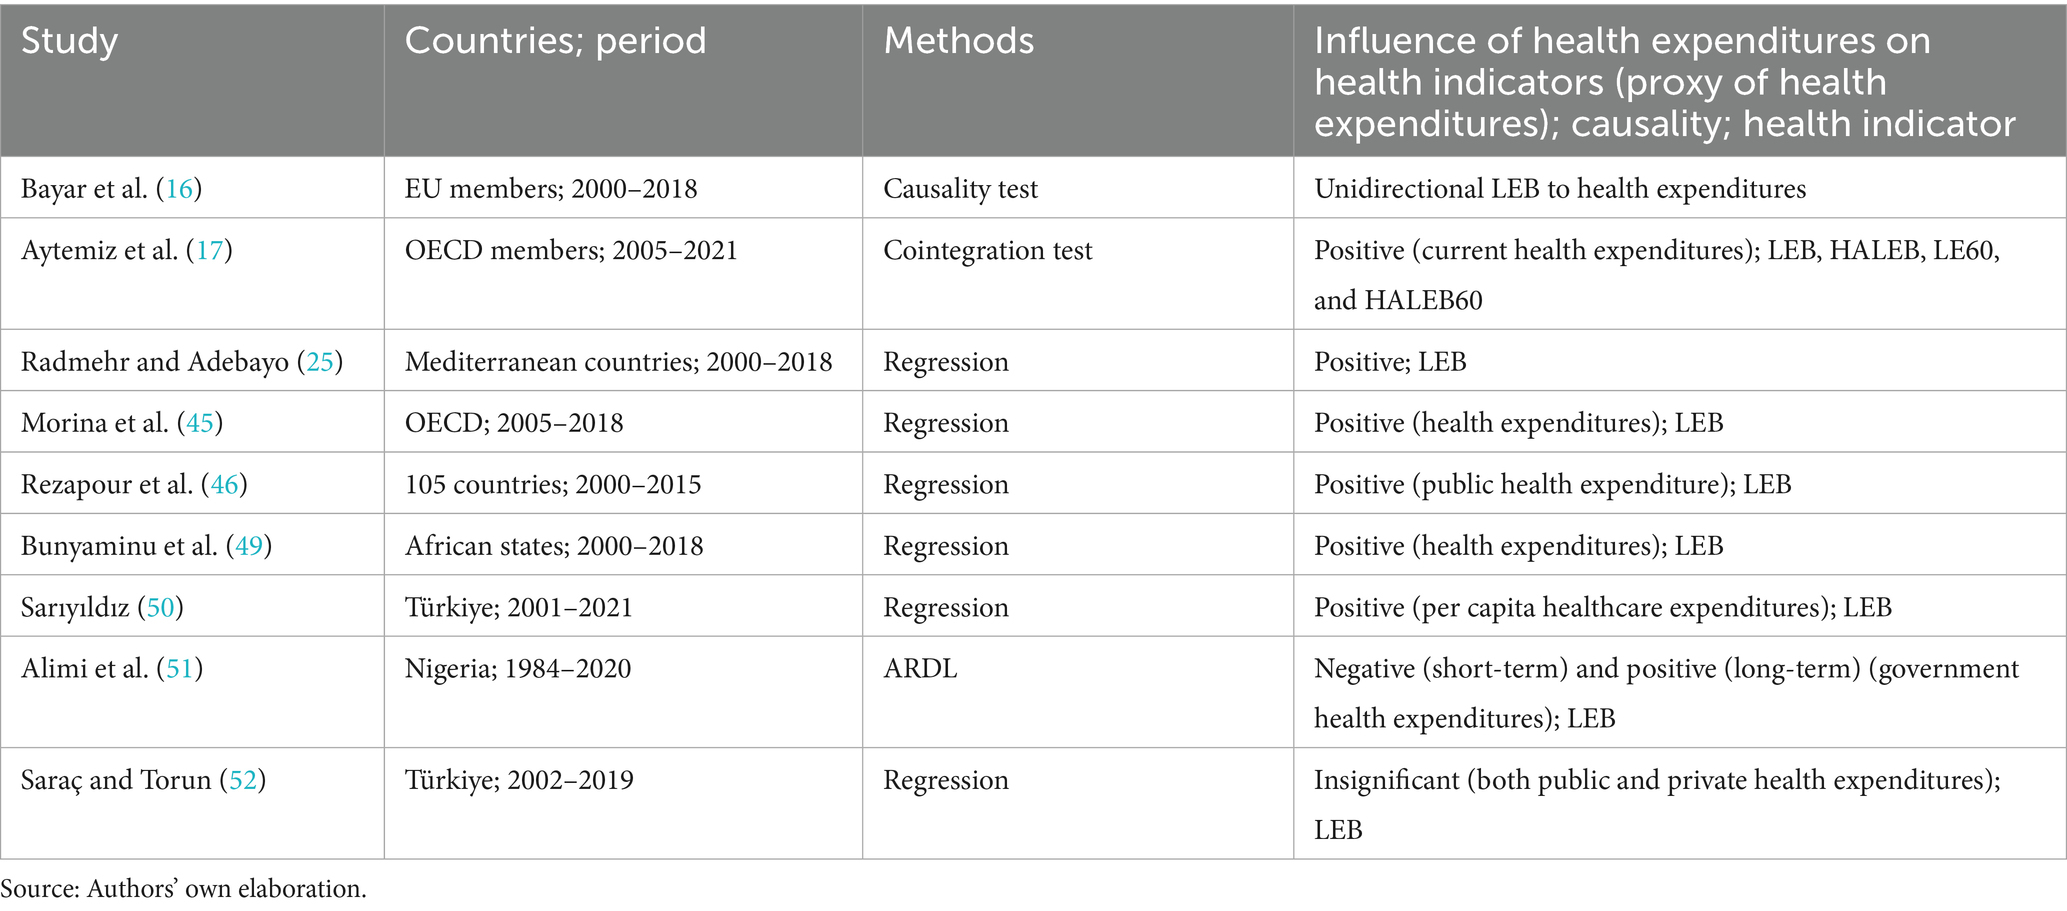
Table 4. Literature on the connection between health expenditure and life expectancy.
The following hypotheses are identified based on theoretical views and empirical literature evidence:
Hypothesis 5. Public health expenditure positively impacts LE60 and HALE60 in the long term.
Hypothesis 6. Private health expenditure positively impacts LE60 and HALE60 in the long term.
Hypothesis 7. There exists a feedback interplay between public health expenditure, LE60, and HALE60.
Hypothesis 8. There exists a feedback interplay between private health expenditure, LE60, and HALE60.
3 Data and methods
This study delves into the influence of CO2 emissions, per capita GDP, and public and private health expenditures on older adults’ health in E7 countries by utilizing causality and cointegration tests. In the analysis, the health state of older adults is represented by LE60 and HALE60, which are sourced from the WHO (53). On the other hand, environmental impairment is proxied by CO emissions per capita (tCO2 equivalent per capita) (CARBON), and these data are sourced from Climate Watch (54). Health expenditures are substituted by domestic general government (% of current health expenditures) (GGHEX) and domestic private health expenditures (% of current health expenditures) (PHEX), which indicate the share of current health expenditures funded by public and domestic private sources, respectively, as a percentage of current health expenditures. Domestic private health expenditures consist of prepaid (such as voluntary and compulsory prepayments to private insurance or paid directly out-of-pocket by households) and demonstrate the share of domestic private sources, such as domestic revenues of households, corporations, and non-profit organizations, in funding healthcare relative to government or external sources. Both indicators are sourced from the WHO (55). Finally, income level is substituted via per capita GDP (2015 US$) (PCGDP), and these data are sourced from the World Bank (56).
The dataset consists of seven emerging markets, and the time dimension of the dataset covers the years between 2000 and 2021 because indicators of LE60 and HALE60 are present between 2000 and 2021. In econometric applications, tests of cross-section dependency (CD), unit root, heterogeneity, causality, and AMG estimation are carried out in favor of Stata 17.0, and the cointegration test is performed using Gauss 12.0.
The main aim of this study is to investigate the interplay between the indicators of LE60 and HALE60, CO2 emissions, per capita GDP, and public and private health expenditures. Consequently, the two models in Equations 1, 2 are used for the empirical analyses:
The mean values of LE60 and HALE60, presented in Table 5, are 19.378 and 14.559 years, respectively. Additionally, the average values of CARBON, PCGDP, GGHEX, and PHEX are 4.313 metric tons per capita, US$6562.619, 47.903, and 51.682%, respectively. However, per capita GDP and public and private health expenditures show very high variability among the E7 states, whereas LE60, HALE60, and CARBON display moderate variation.
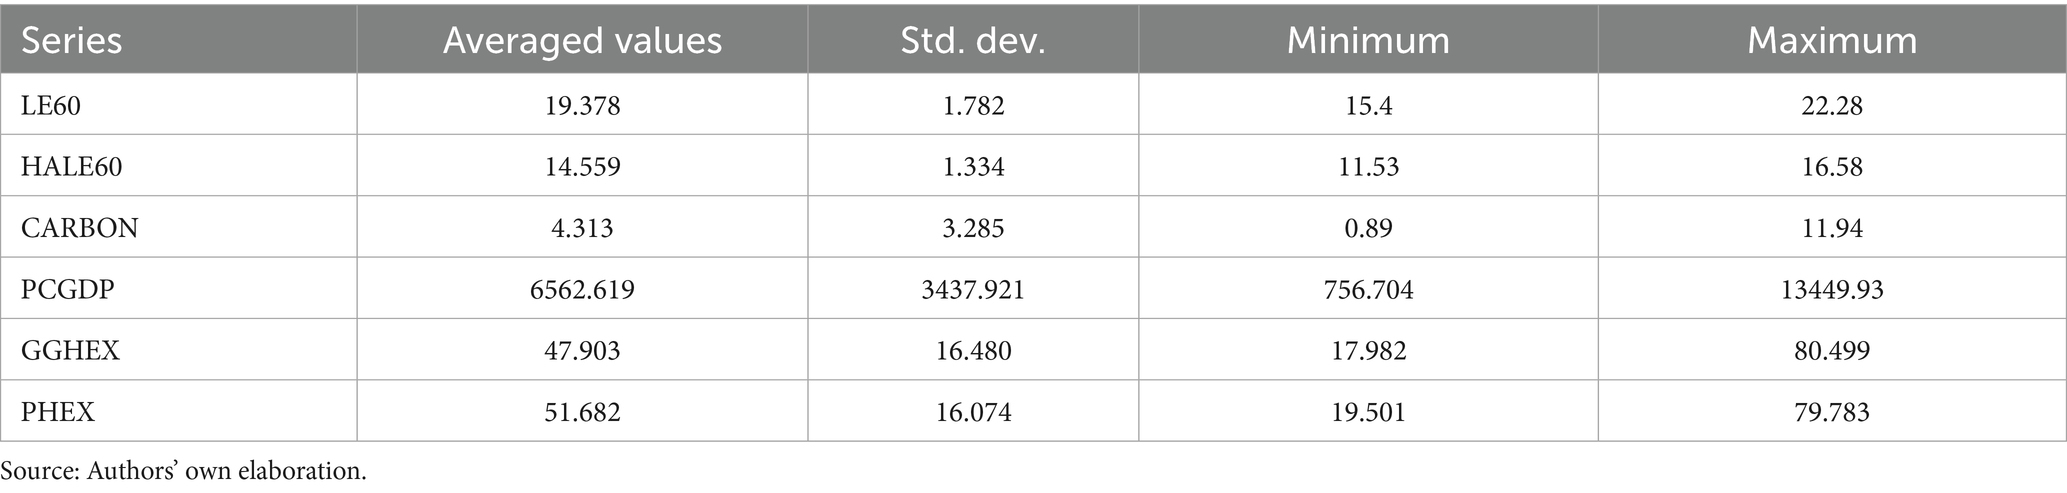
Table 5. Descriptive statistics of LE60, HALE60, CARBON, PCGDP, GGHEX, and PHEX (2000–2021).
Westerlund and Edgerton’s (57) cointegration test considers CD, heterogeneity, autocorrelation, and structural breaks during the dataset period. The cointegration coefficients of the panel and each E7 country are forecasted using the AMG estimator proposed by Eberhart and Bond (58). Traditional estimators do not consider heterogeneity and CD; therefore, their results can be spurious and biased (59). However, the AMG estimator considers CD, heterogeneity, and endogeneity differently from first-generation estimators (58). Additionally, the AMG estimator can make an estimation at both the panel and country levels. The AMG estimator utilizes Equation 3 and considers CD by attaching a common dynamic effect elaborated from the dummy coefficients of the regression in the first differences to group-specific regressions (58).
where the observable covariates () and unobservable covariates () are specified as a combination of group effects (), common factors (), and group factor loadings ().
The causal relationships among LE60, HALE60, CARBON, PCGDP, GGHEX, and PHEX are examined using the JKS (60) causality method. The JKS causality test has several advantages over the Granger causality test. The test considers heterogeneity and CD, unlike the Granger causality test, and also takes advantage of the half-panel jackknife (HPJ) approach proposed by Dhaene and Jochmans (61) to decrease Nickell bias (60). Furthermore, the JKS causality test displays robustness with unbalanced panels and smaller sample sizes compared to some alternatives (62).
4 Results
In the first stage of the econometric analyses, the subsistence of heterogeneity and CD are analyzed in favor of the tests of delta and LM (Lagrange multiplier), respectively. In this sense, CD tests of LMadj., LM CD, and LM tests are conducted, and their test statistics are presented in Table 6. The H0 hypothesis of CD independence is rejected by considering their probability values lower than 0.01. Similarly, homogeneity tests of delta are applied, and their test statistics are presented in Table 6. The H0 hypothesis of homogeneity is rejected by considering their probability values lower than 0.01. The consequences of the delta and CD tests testify to the subsistence of heterogeneity and CD among LE60/HALE60, CARBON, PCGDP, and PCHEX in Model-1 and Model-2 and suggest that we utilize econometric tests sensitive to heterogeneity and CD.
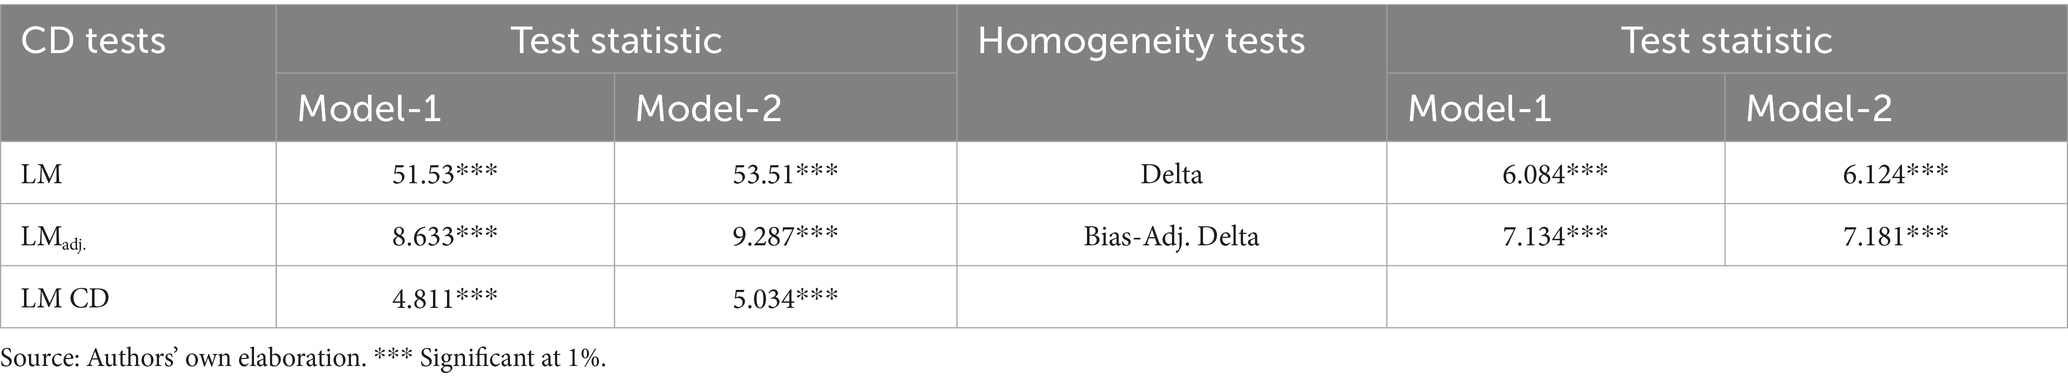
Table 6. Outcomes of the CD and slope homogeneity tests.
In addition, the integration of levels of the series in Models 1 and 2 should be identified before the selection of cointegration and causality methods. Therefore, the CIPS unit root test of Pesaran (63) is performed to identify the integration levels of LE60, HALE60, CARBON, PCGDP, GGHEX, and PHEX, and its findings are reported in Table 7. The test statistics of the CIPS test disclose that LE60, HALE60, CARBON, PCGDP, GGHEX, and PHEX include a unit root at level values, but these series become stationary when the test is run with the first differences of LE60, HALE60, CARBON, PCGDP, GGHEX, and PHEX.
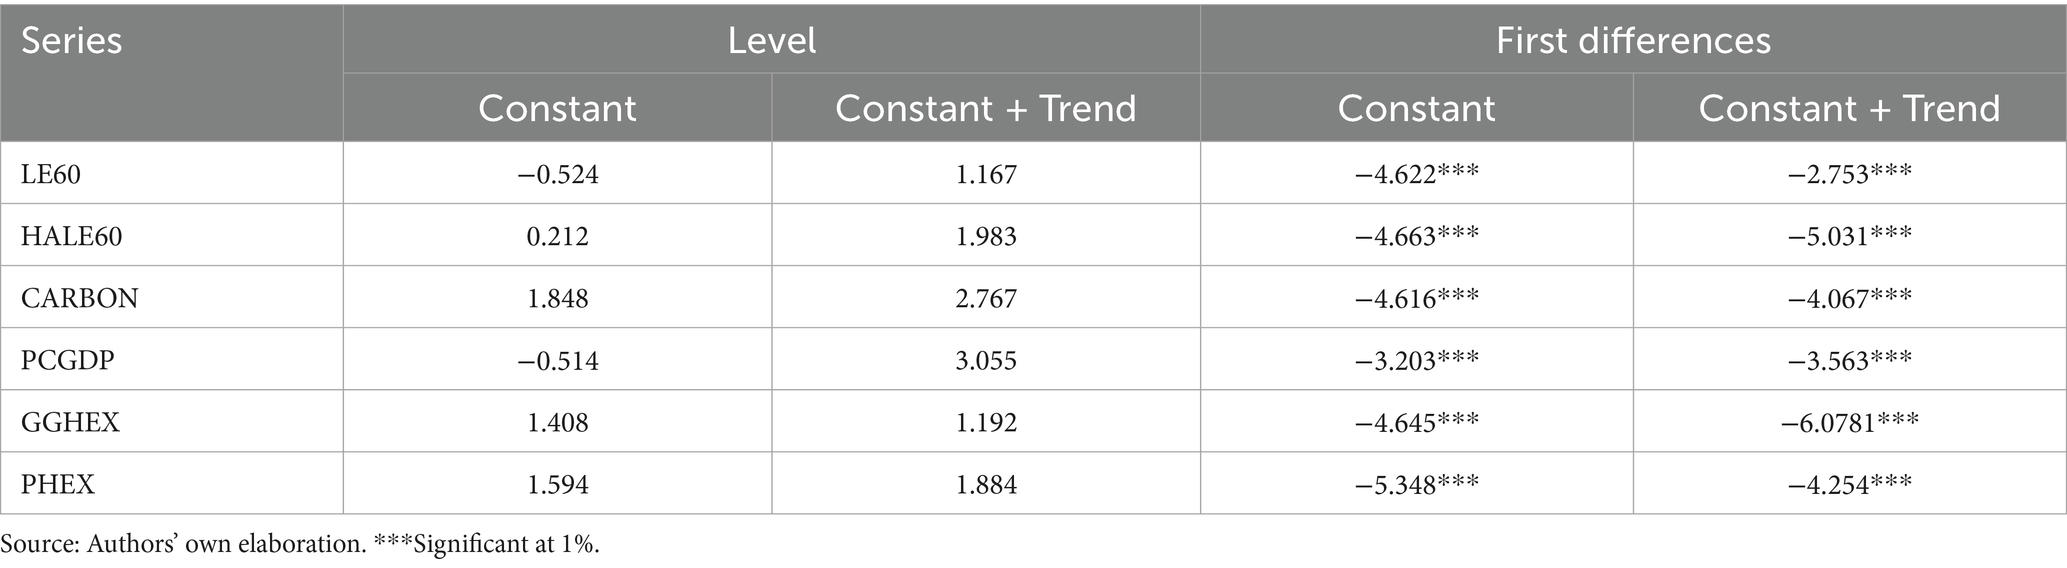
Table 7. CIPS test’s findings.
The long-run interplay between LE60/HALE60, CARBON, PCGDP, GGHEX, and PHEX is questioned through the cointegration test of (57), and the test statistics along with the structural breaks are reported in Table 8. The models with level and regime shifts indicate the rejection of the H0 hypothesis of insignificant cointegration among the series in Model-1 and Model-2, while the model with no shift shows the acceptance of the null hypothesis of insignificant cointegration. Therefore, the utilization of the cointegration test with structural breaks is evaluated to increase the robustness of our outcomes. Additionally, structural breaks in 2004, 2005, 2008, 2010, 2017, and 2018 are endogenously specified in the model. These structural breaks indicate that the Brazilian currency crisis of 2002, the 2008 global financial crisis, the Eurozone sovereign debt crisis of 2010, the 2014 Brazilian economic crisis, the Russian financial crisis (2014–2016), the 2015–2016 Chinese stock market turbulence, and Türkiye’s ongoing major economic problems as of 2016 significantly impacted life expectancy and economic indicators in the country.
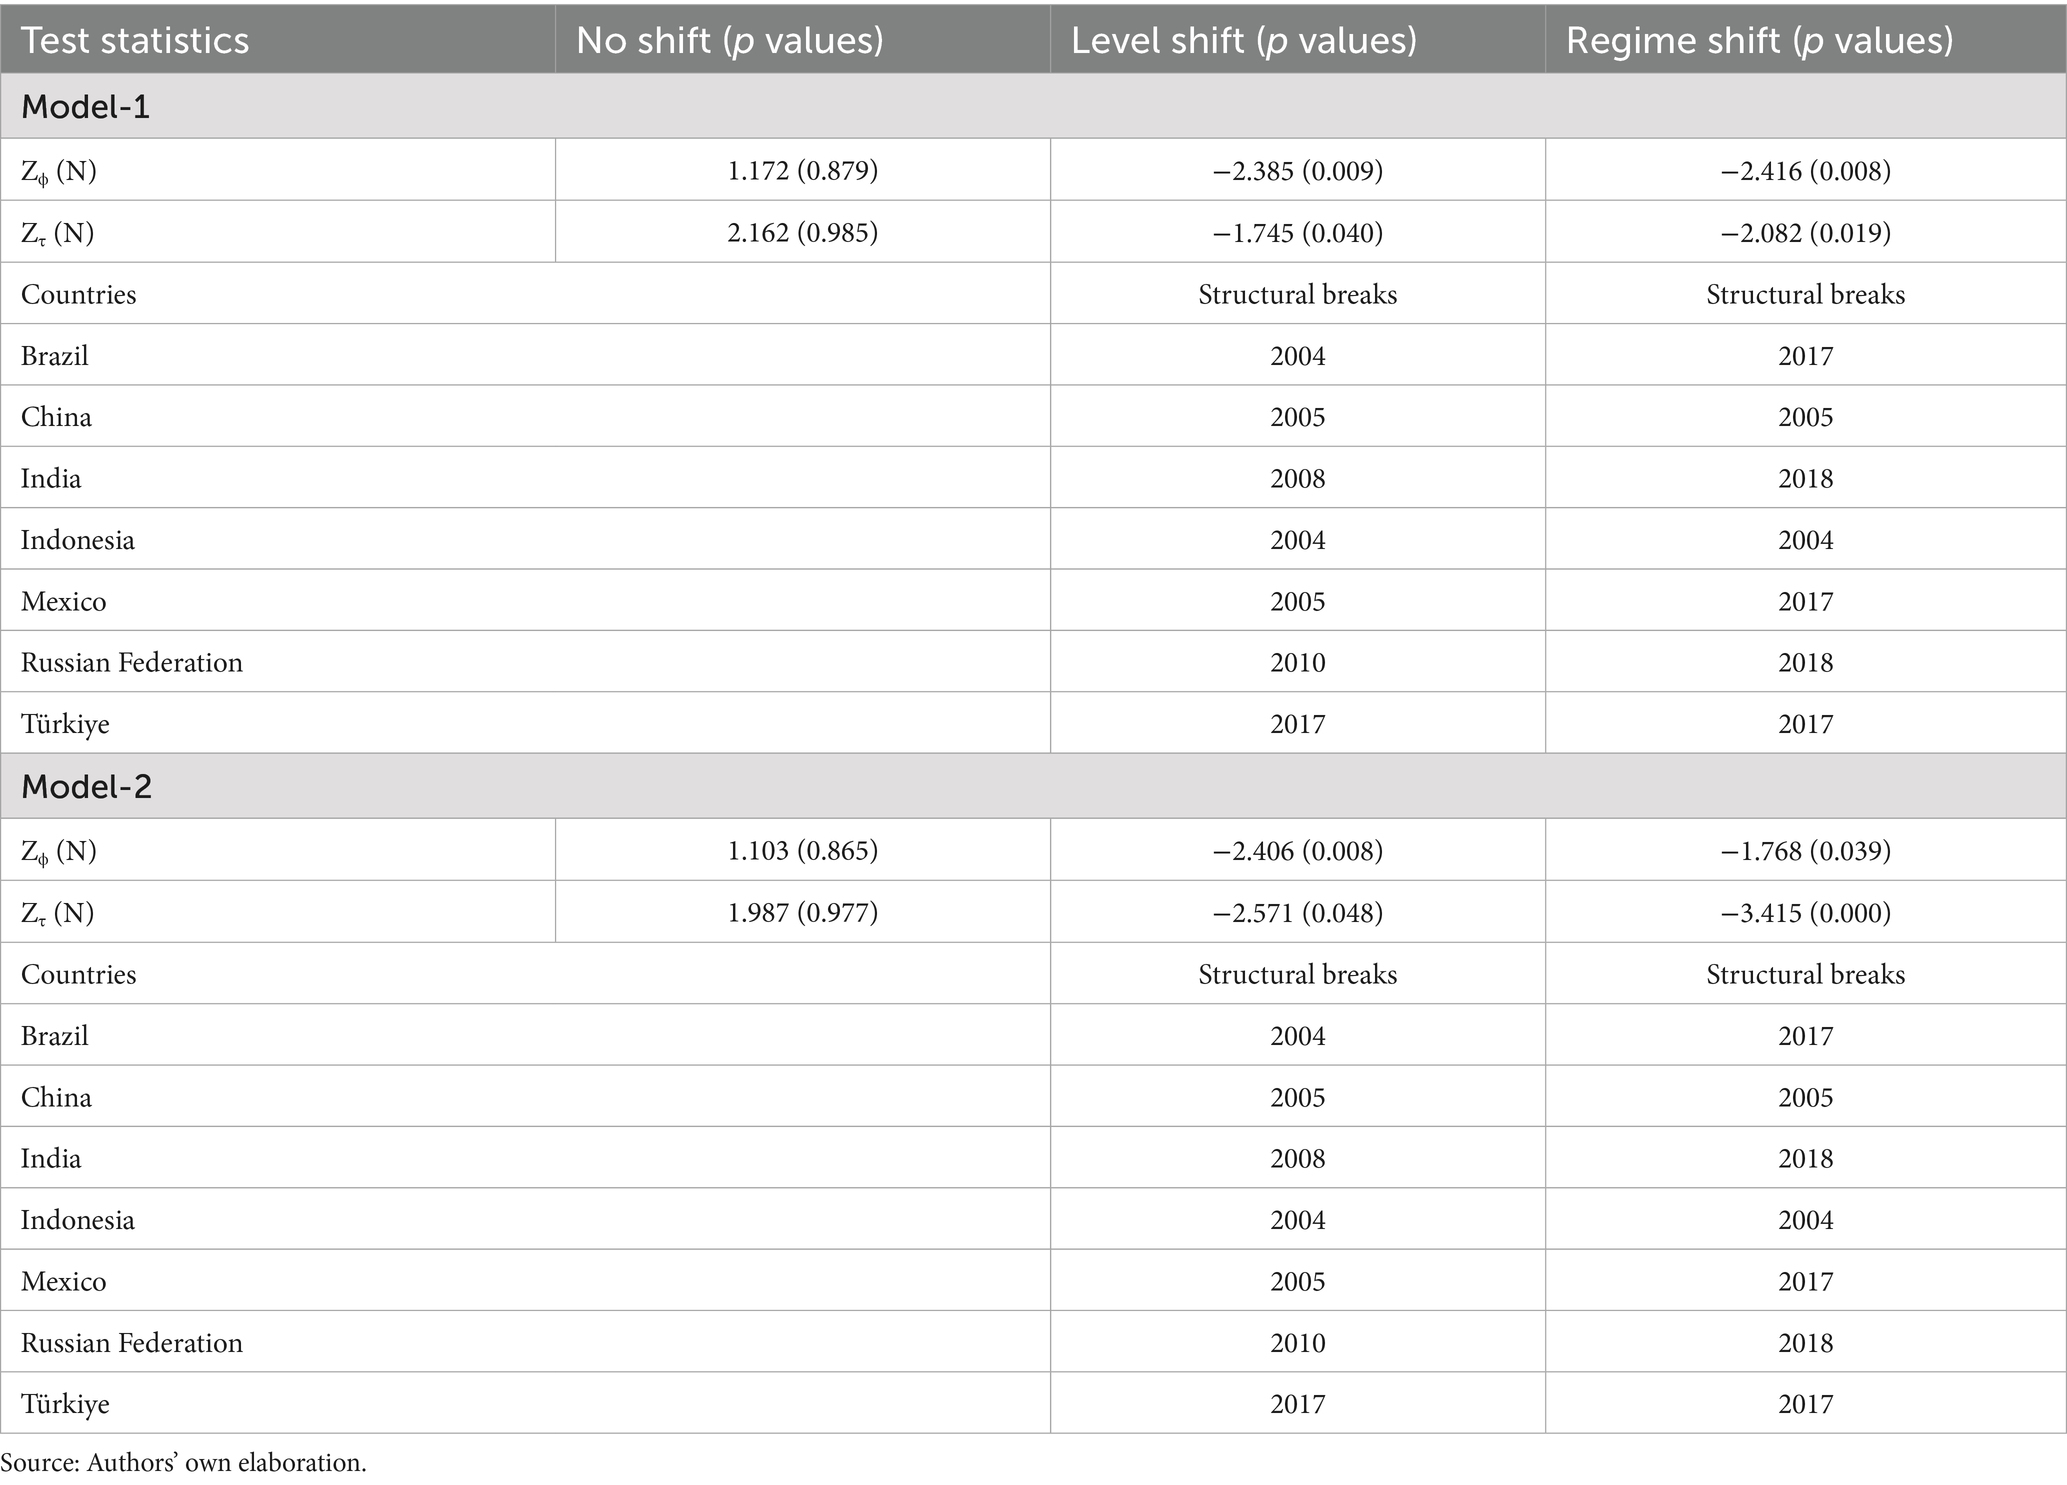
Table 8. Outcomes of the cointegration tests.
The cointegration coefficients of the explanatory variables in Model-1 and Model-2 are forecast in favor of the AMG estimator and are reported in Table 9. In addition, two models are forecasted by the Common Correlated Effects Mean Group (CCE-MG) estimator of Pesaran (64) to check the consistency and reliability of the estimations by the AMG estimator, and their results are introduced in Table 10.
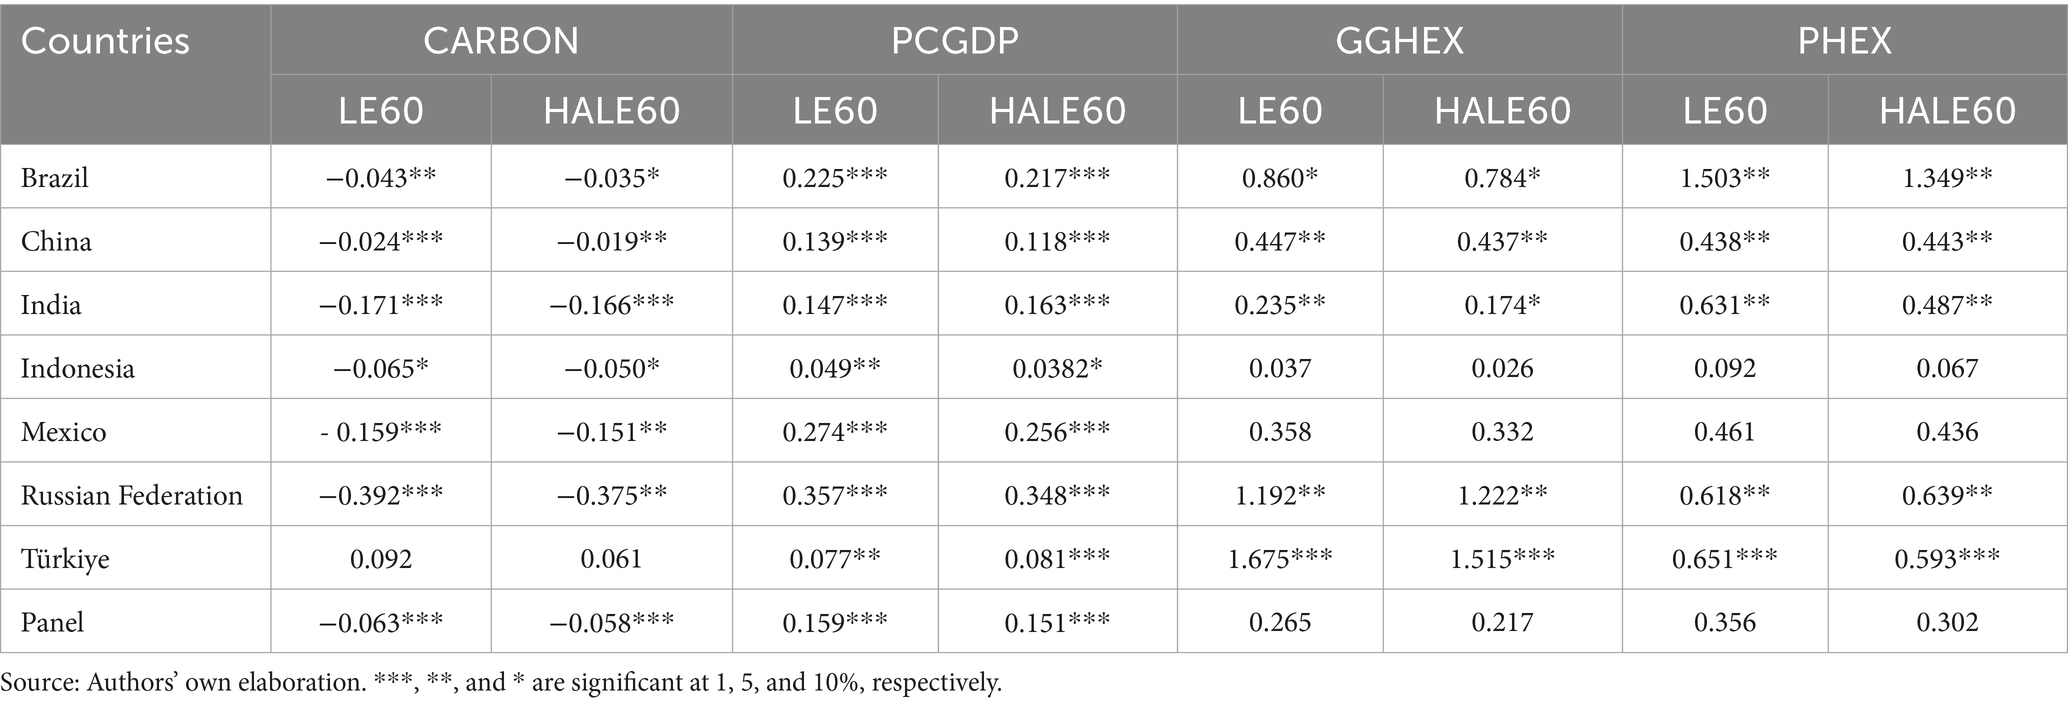
Table 9. Cointegration coefficients using the AMG estimator.
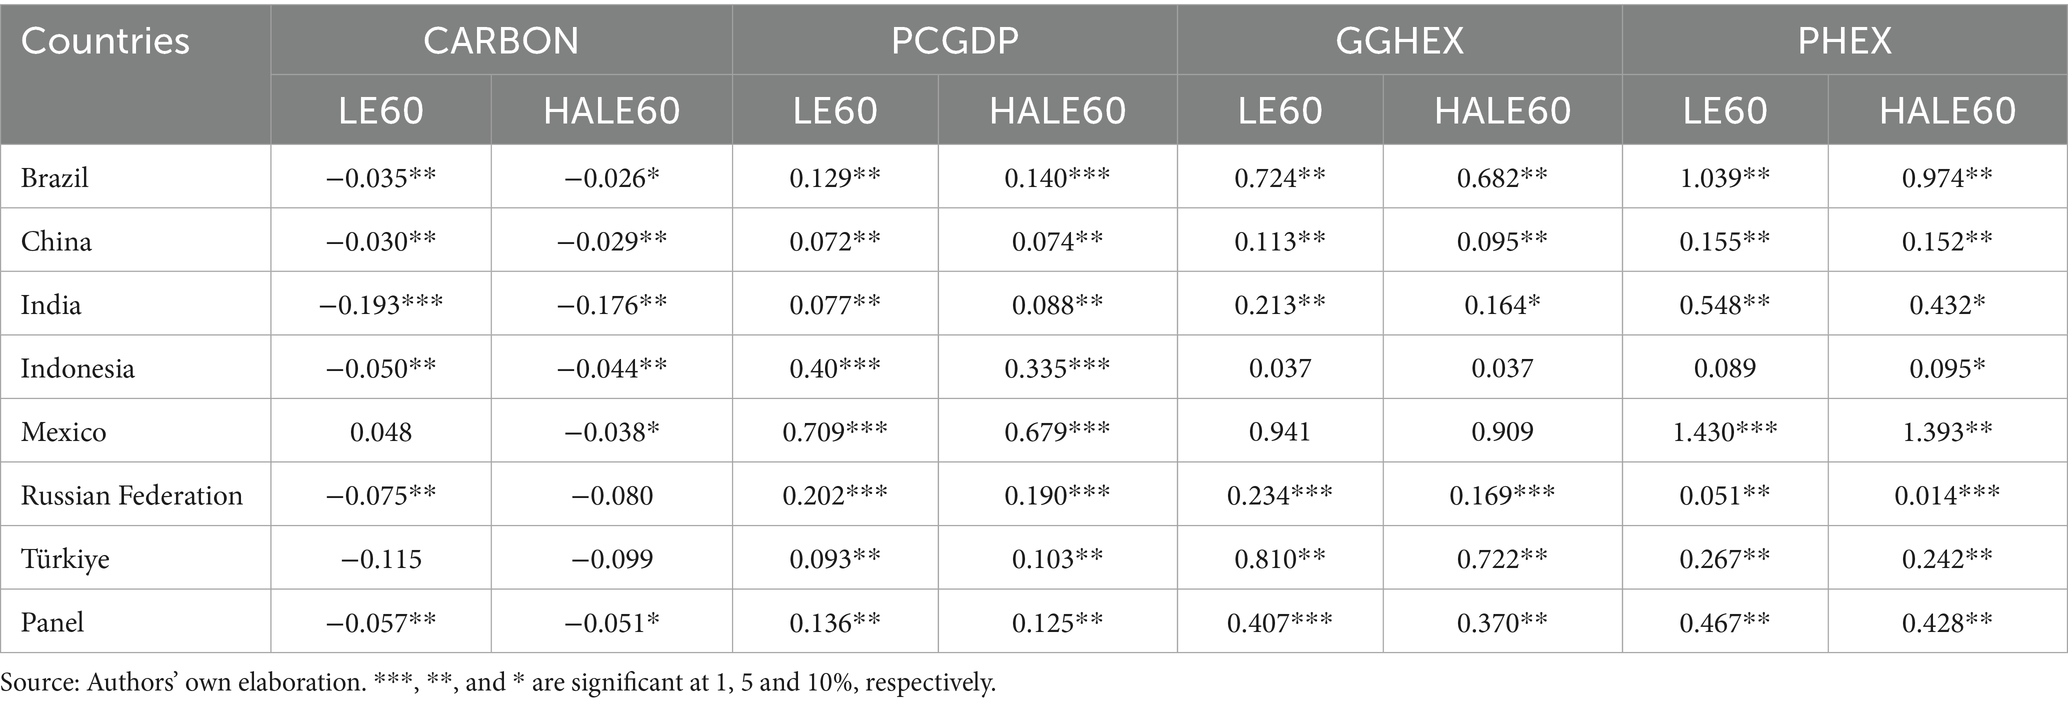
Table 10. Cointegration coefficients obtained using the CCEMG estimator.
The results of the AMG estimation reveal that CO2 emissions negatively impact LE60 and HALE60 at the panel level and in all E7 countries except Türkiye, while the findings of the CCE-MG estimation also largely support these findings, except in Mexico. CO2 emissions have the largest negative effect on LE60 and HALE60 in Russia and India, whereas the negative effect of CO2 emissions on LE60 and HALE60 is relatively much lower in China, Brazil, and Indonesia.
In contrast, per capita GDP positively influences both LE60 and HALE60 at the panel level and in all E7 countries. The findings of the CCE-MG estimation also substantially confirm these results. The per capita GDP has the largest health impact in the Russian Federation, Mexico, Brazil, India, and China, whereas the health impact of per capita GDP is relatively lower in Türkiye and Indonesia.
Finally, both general government and private health expenditures positively impact LE60 and HALE60 in Brazil, China, India, the Russian Federation, and Türkiye, but the relation between indicators of health expenditures and LE60 and HALE60 is insignificant at the panel level in Indonesia and Mexico. Nevertheless, the findings of the CCE-MG estimation indicate that the panel-level positive connection between indicators of health expenditures and LE60 and HALE60 is significantly positive. Furthermore, the positive effect of public health expenditures on LE60 and HALE60 is the largest in Türkiye and the Russian Federation and the lowest in India and China.
The causal connection among CO2 emissions, per capita GDP, and indicators of health expenditures, LE60, and HALE60 is analyzed in favor of the JKS causality test, and the consequences of the test are shown in Table 11, Figure 1. The findings reveal a bidirectional causal link between CO2 emissions, per capita GDP, public and private expenditures, and LE60/HALE60.
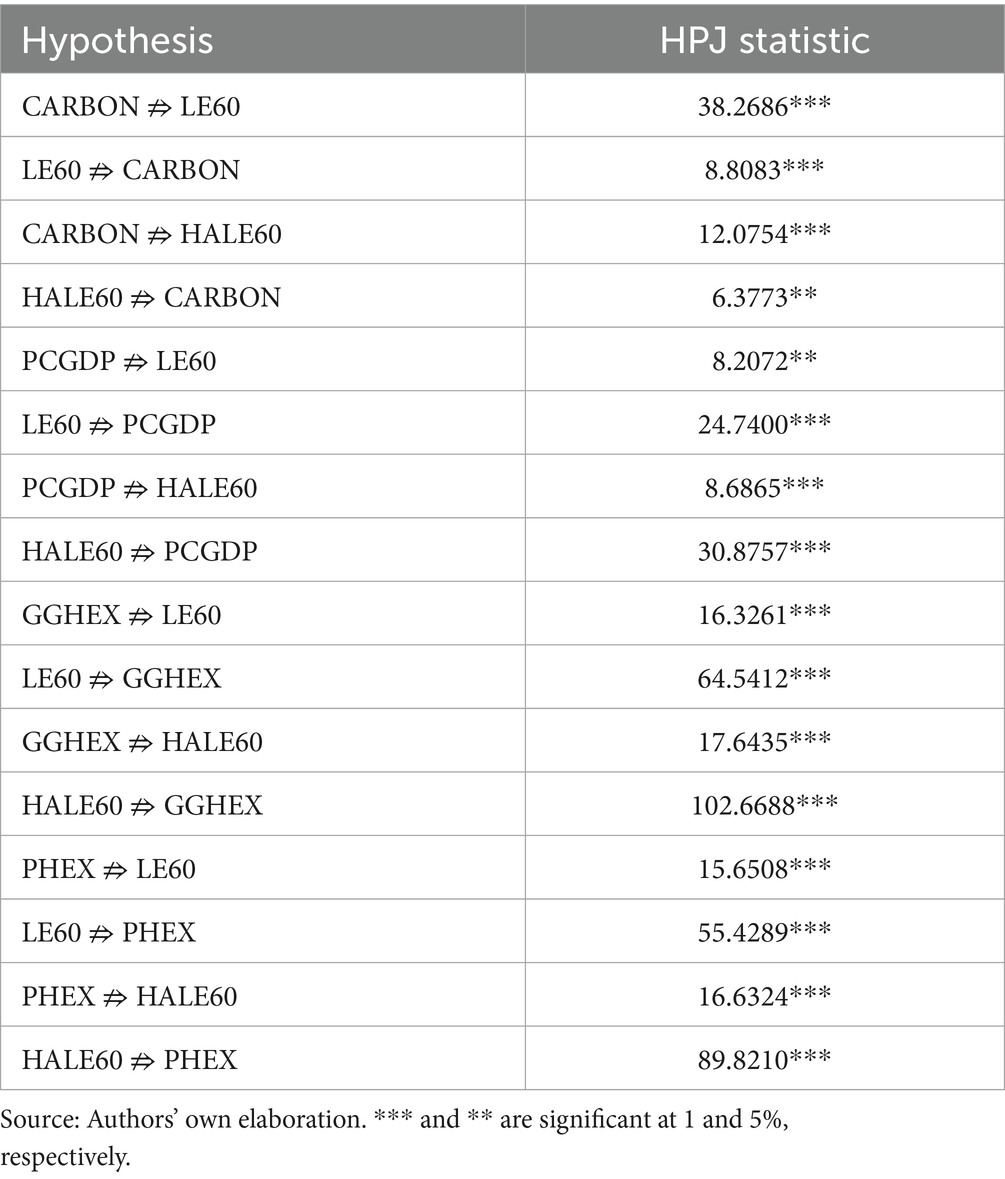
Table 11. Findings of the JKS test.
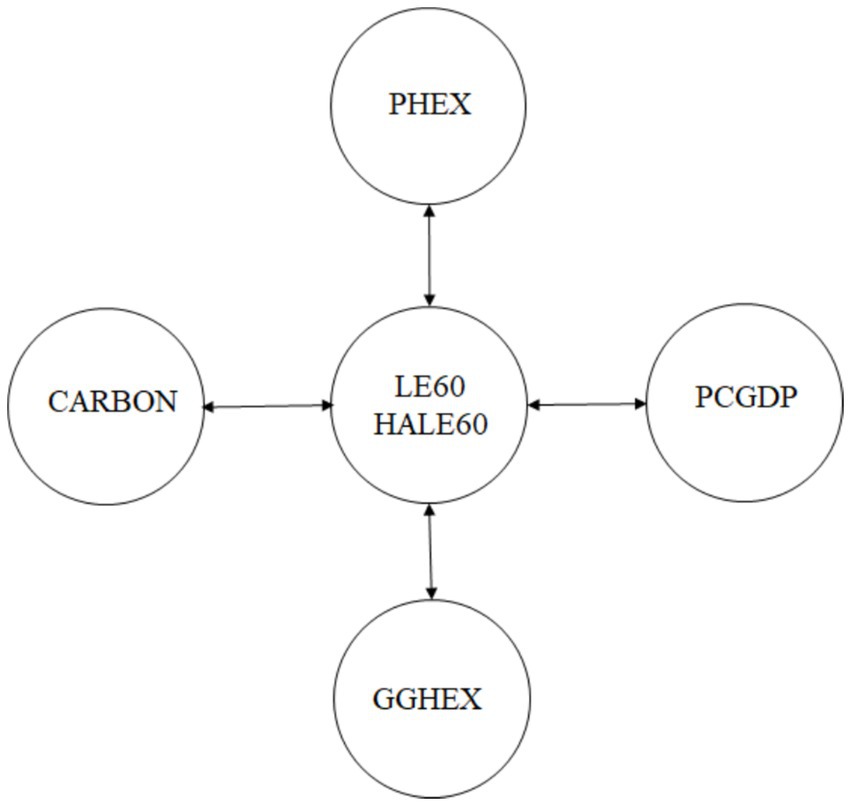
Figure 1. Causality test results. Source: Authors’ own elaboration.
5 Discussion
On the one hand, CO2 emissions are anticipated to negatively influence the health of older adults through noncommunicable diseases, the emergence and spread of infectious diseases, and health emergencies mainly coming from air pollution, global warming, and climate change. However, improvements in life expectancy mean that people engage in CO2 emission-increasing activities for a longer period; hence, improvements in life expectancy may enhance CO2 emissions. However, the academicians have usually focused on the effect of CO2 emissions on LEB, and a negative connection between CO2 emissions and LEB has been verified by results of Anwar et al. (14), Chen et al. (22), Rahman et al. (23), Nwani and Imhanzenobe (24), Radmehr and Adebayo (25), Javanshirova (26), Khan et al. (27), Saidmamatov et al. (29), Țarcă et al. (29), Szymańska (30), Altaee et al. (31), Zhang et al. (32), Wahyudi and Leny (33), and Khan et al. (34). But Rjoub et al. (35), Mahalik et al. (36), Osei-Kusi et al. (65), and Yang and Ying (37) uncovered a positive connection between CO2 emissions and LEB. Our study investigates the connection between CO2 emissions and LE60 and HALE60 differently from the literature and discovered a negative effect of CO2 emissions on LE60 and HALE60 in all E7 countries except Türkiye, which is consistent with related theoretical views. The E7 countries experienced significant economic expansion along with lax environmental policies during the study period. Hence, the average values of the environmental policy stringency indices of these countries between 2016 and 2020 [The index ranges between 0 (not stringent) to 6 (highest degree of stringency)] are Mexico (0.167), Brazil (0.889), Russian Federation (1.168), Indonesia (1.633), India (2.656), Türkiye (2.794), and China (2.911) (66). Furthermore, the share of renewable energy use in the total energy consumption between 2000 and 2021 is 3.413% (Russian Federation), 10.186% (Mexico), 14.014% (Türkiye), 16.345% (China), 33.727% (Indonesia), 38.505% (India), and 45.359% (Brazil) (67). In conclusion, the findings demonstrate that the stringency of environmental policy and the use of renewable energy play a key role in the effect of CO2 emissions on LE60 and HALE60 in the E7 countries.
Income is one of the fundamental factors in achieving a longer lifespan by maintaining a healthy life and accessing higher-quality medical care. This theoretical expectation has been largely confirmed by nearly all studies, including Anwar et al. (14), Aytemiz et al. (17), Magazzino et al. (18), Chen et al. (22), Radmehr and Adebayo (25), Țarcă et al. (29), Miladinov (42), Şenol et al. (43), Shi et al. (44), Morina et al. (45), and Karunarathne et al. (46) to a great extent. Similarly, our results also demonstrate that per capita GDP is a significant positive determinant of both LE60 and HALE60. China, India, Türkiye, Indonesia, and Russia have achieved significant increases in per capita GDP between 2000 and 2021, but the effect of per capita GDP on LE60 and HALE60 is largest in the Russian Federation, Mexico, Brazil, India, and China. Therefore, Türkiye and Indonesia experienced a relatively lower positive effect of increases in GDP on LE60 and HALE60 when compared with other E7 countries.
Last, health expenditures are anticipated to positively influence life expectancy by means of better health facilities and physicians, and the results of Anwar et al. (14), Bayar et al. (16), Aytemiz et al. (17), Radmehr and Adebayo (25), Morina et al. (45), Rezapour et al. (48), Bunyaminu et al. (49), Sarıyıldız (50), and Alimi et al. (51) also support these theoretical views. Our results demonstrate that both general government and private health expenditures positively impact LE60 and HALE60 in Brazil, China, India, the Russian Federation, and Türkiye. The positive effect of public and private health expenditures on LE60 and HALE60 is relatively larger in Türkiye and the Russian Federation than in India, China, and Brazil, and is insignificant in Indonesia and Mexico. The average share of public health expenditures in total health expenditures in Türkiye and the Russian Federation is 74.5 and 61.4%, respectively, between 2000 and 2021. However, this ratio is 48.0% in Mexico, 45.6% in China, 43.0% in Brazil, 37.2% in Indonesia, and 25.7% in India. Therefore, Türkiye and the Russian Federation, with their public sector-dominated healthcare systems, perform better than countries with equal shares of public and private healthcare systems. Furthermore, the level of current health expenditures in the E7 countries is much lower than that in developed countries. In conclusion, these differences between countries can result from the inefficiency of health and social security systems, inequalities in income distribution, and relatively low health expenditure.
Theoretically, a mutual interaction between LE60, HALE60, CO2 emissions, per capita GDP, and health expenditure is anticipated. However, few studies have performed two-way analyses of these variables. In this regard, Rahman et al. (23), Javanshirova (26), Khan et al. (34), Rjoub et al. (35), and Hasnawati et al. (41) conducted a two-way analysis between LEB and CO2 emissions. Rahman et al. (23), Javanshirova (26), and Rjoub et al. (35) determined a unilateral causal connection from CO2 emissions to LEB, and Khan et al. (34) disclosed a bidirectional causal connection between LEB and carbon dioxide emissions, while Hasnawati et al. (41) unveiled an insignificant interplay between the two variables. In contrast, Magazzino et al. (18) and Alwago (47) performed a two-way analysis between LEB and per capita GDP. Magazzino et al. (18) unveiled a unidirectional causality from LEB, LE40, and LE60 to per capita GDP, and Alwago (47) disclosed an insignificant causal link between LEB and per capita GDP. Finally, Bayar et al. (16) conducted a two-way analysis between health expenditures and LEB and discovered unidirectional causality from LEB to health expenditures. The outcomes of our causality analysis indicate that LE60 and HALE60 also have a significant effect on CO2 emissions, per capita GDP, and health expenditure, unlike the results of these limited studies.
6 Conclusions, limitations, policy implications, and future research directions
The share of older adults in the global population has been increasing steadily, and this changing population structure has important economic, social, environmental, and health implications for societies. Nevertheless, most studies have focused on the effects of various economic, social, and environmental factors on life expectancy at birth (LEB). To address this gap, the present study investigates the effects of CO₂ emissions, per capita GDP, and public and private health expenditures on LE60 and HALE60 by employing cointegration methods with structural breaks and causality tests.
The study period covers the period 2001–2021 due to the data availability of LE60 and HALE60. Furthermore, the E7 countries constitute our sample, and the results of the study are widely specific to these countries.
The results of the causality analysis indicate a bidirectional relationship between LE60, HALE60, CO₂ emissions, public and private health expenditures, and GDP, which is consistent with theoretical expectations. Furthermore, the long-term analysis demonstrates that CO₂ emissions negatively affect LE60 and HALE60, whereas per capita GDP and public and private health expenditures positively influence both.
Based on our empirical findings, several policy implications emerge. First, the stringency of environmental policies is very low in Mexico, Brazil, Russia, and Indonesia. Furthermore, the share of renewable energy use in the total energy consumption is very low in the Russian Federation, Mexico, Türkiye, and China. Therefore, these countries should increase the stringency of their environmental policies through legal and market-based instruments such as environmental taxes and tradable permits. Furthermore, the development of renewable energy technologies should be prioritized in these countries. Increases in per capita GDP led to improvements in LE60 and HALE60 in all E7 countries, but Türkiye and Indonesia especially experienced a relatively lower positive effect of increases in per capita GDP on LE60 and HALE60 compared with the other E7 countries. Therefore, these countries should improve income inequality through redistributive policies such as transfer payments and a progressive tax system. Finally, most E7 countries experience a positive effect of public and private health expenditures on LE60 and HALE60, but the health gains of Türkiye and the Russian Federation are relatively larger than those of India, China, and Brazil. Therefore, institutional arrangements to improve the efficiency of health and social security systems, redistributive policies, and further investments in health infrastructure are crucial for increasing the health benefits of public and private health expenditures. Finally, the results of this study imply that the stringency of environmental policies, use of renewable energy, efficiency of health and social security systems, and income redistribution are significant factors in the interaction between CO2 emissions, per capita GDP, public and private health expenditures, and older adults’ health. Therefore, future research should focus on examining the mediating impact of these factors on the nexus between older adults’ health, per capita GDP, and public and private health expenditures.
Data availability statement
The raw data supporting the conclusions of this article will be made available by the authors, without undue reservation.
Author contributions
MAK: Conceptualization, Data curation, Formal analysis, Methodology, Writing – original draft, Writing – review & editing. GS: Conceptualization, Formal analysis, Methodology, Writing – original draft, Writing – review & editing. YB: Conceptualization, Data curation, Formal analysis, Methodology, Writing – original draft, Writing – review & editing. MD: Conceptualization, Data curation, Formal analysis, Methodology, Writing – original draft, Writing – review & editing.
Funding
The author(s) declare that no financial support was received for the research and/or publication of this article.
Conflict of interest
The authors declare that the research was conducted in the absence of any commercial or financial relationships that could be construed as a potential conflict of interest.
Generative AI statement
The authors declare that no Gen AI was used in the creation of this manuscript.
Any alternative text (alt text) provided alongside figures in this article has been generated by Frontiers with the support of artificial intelligence and reasonable efforts have been made to ensure accuracy, including review by the authors wherever possible. If you identify any issues, please contact us.
Publisher’s note
All claims expressed in this article are solely those of the authors and do not necessarily represent those of their affiliated organizations, or those of the publisher, the editors and the reviewers. Any product that may be evaluated in this article, or claim that may be made by its manufacturer, is not guaranteed or endorsed by the publisher.
References
1. WHO (2025). Ageing: Global population. Available online at: https://www.who.int/news-room/questions-and-answers/item/population-ageing (Accessed July 10, 2025).
2. Borzoiepour, S, Alizadeh, G, Jafary, H, and Zarnaq, RK. Identify affecting factors on total fertility rate: a systematic review. Health Scope. (2024) 13:e139351. doi: 10.5812/healthscope-139351
3. He, L, and Li, N. The linkages between life expectancy and economic growth: some new evidence. Empir Econ. (2020) 58:2381–402. doi: 10.1007/s00181-018-1612-7
4. Acemoglu, D, and Johnson, S. Disease and development: the effect of life expectancy on economic growth. J Polit Econ. (2007) 115:925–85. doi: 10.1086/529000
5. Hansen, CP, and Lønstrup, L. The rise of life expectancy and economic growth in the 20th century. Econ J. (2013) 125:838–52. doi: 10.1111/ecoj.12261
6. Ngangue, N, and Manfred, K. The impact of life expectancy on economic growth in developing countries. Asian Econ Financ Rev. (2015) 5:653–60. doi: 10.18488/journal.aefr/2015.5.4/102.4.653.660
7. Alhassan, GN, Adedoyin, FF, Bekun, FV, and Agabo, TJ. Does life expectancy, death rate and public health expenditure matter in sustaining economic growth under COVID-19: empirical evidence from Nigeria? J Public Aff. (2021) 21:e2302. doi: 10.1002/pa.2302
8. Neofytidou, A, and Fountas, S. The impact of health on GDP: a panel data investigation. J Econ Asymmetries. (2020) 21:e00139. doi: 10.1016/j.jeca.2019.e00139
9. WHO (2025). Air Pollution. Available online at: https://www.who.int/thailand/health-topics/air-pollution#tab=tab_1 (Accessed September 17, 2025).
10. de Bont, J, Jaganathan, S, Dahlquist, M, Persson, Å, Stafoggia, M, and Ljungman, P. Ambient air pollution and cardiovascular diseases: an umbrella review of systematic reviews and meta-analyses. J Intern Med. (2022) 291:779–800. doi: 10.1111/joim.13467
11. WHO (2025). Climate change. Available online at: https://www.who.int/news-room/fact-sheets/detail/climate-change-and-health (Accessed September 17, 2025).
12. Jacobson, MZ. On the causal link between carbon dioxide and air pollution mortality. Geophys Res Lett. (2008) 35:L03809. doi: 10.1029/2007GL031101
13. Preston, SH. The changing relationship between mortality and the level of economic development. Popul Stud. (1975) 29:231–48. doi: 10.1080/00324728.1975.10410201
14. Anwar, A, Hyder, S, Mohamed Nor, N, and Younis, M. Government health expenditures and health outcome Nexus: a study on OECD countries. Front Public Health. (2023) 11:1123759. doi: 10.3389/fpubh.2023.1123759
15. Bein, M. The association between medical spending and health status: a study of selected African countries. Malawi Med J. (2020) 32:37–44. doi: 10.4314/mmj.v32i1.8
16. Bayar, Y, Gavriletea, MD, Pintea, MO, and Sechel, IC. Impact of environment, life expectancy and real GDP per capita on health expenditures: evidence from the EU member states. Int J Environ Res Public Health. (2021) 18:13176. doi: 10.3390/ijerph182413176
17. Aytemiz, L, Sart, G, Bayar, Y, Danilina, M, and Sezgin, FH. The long-term effect of social, educational, and health expenditures on indicators of life expectancy: an empirical analysis for the OECD countries. Front Public Health. (2024) 12:1497794. doi: 10.3389/fpubh.2024.1497794
18. Magazzino, C, Auteri, M, Schneider, N, Ofria, F, and Mele, M. Pharmaceutical consumption, economic growth and life expectancy in the OECD: the application of a new causal direction from dependency algorithm and a DeepNet process. J Econ Stud. (2024) 51:249–71. doi: 10.1108/JES-02-2024-0066
19. Abud, T, Kounidas, G, Martin, KR, Werth, M, Cooper, K, and Myint, PK. Determinants of healthy ageing: a systematic review of contemporary literature. Aging Clin Exp Res. (2022) 34:1215–23. doi: 10.1007/s40520-021-02049-w
20. Marzo, RR, Khanal, P, Shrestha, S, Mohan, D, Myint, PK, and Su, TT. Determinants of active aging and quality of life among older adults: systematic review. Front Public Health. (2023) 11:1193789. doi: 10.3389/fpubh.2023.1193789
21. Llorens-Ortega, R, Bertran-Noguer, C, Juvinyà-Canals, D, Garre-Olmo, J, and Bosch-Farré, C. Influence of social determinants of health in the evolution of the quality of life of older adults in Europe: a comparative analysis between men and women. Humanit Soc Sci Commun. (2024) 11:401. doi: 10.1057/s41599-024-02899-5
22. Chen, Z, Ma, Y, Hua, J, Wang, Y, and Guo, H. Impacts from economic development and environmental factors on life expectancy: a comparative study based on data from both developed and developing countries from 2004 to 2016. Int J Environ Res Public Health. (2021) 18:8559. doi: 10.3390/ijerph18168559
23. Rahman, MM, Rana, R, and Khanam, R. Determinants of life expectancy in most polluted countries: exploring the effect of environmental degradation. PLoS One. (2022) 17:e0262802. doi: 10.1371/journal.pone.0262802
24. Nwani, SE, and Imhanzenobe, JO. The carbon emission and life expectancy nexus: mediating roles of agriculture and foreign direct investment in Nigeria. Manag Environ Qual. (2022) 33:1008–25. doi: 10.1108/MEQ-08-2021-0184
25. Radmehr, M, and Adebayo, TS. Does health expenditure matter for life expectancy in Mediterranean countries? Environ Sci Pollut Res. (2022) 29:60314–26. doi: 10.1007/s11356-022-19992-4
26. Javanshirova, Z. The effect of carbon emissions on life expectancy: evidence from Azerbaijan. J Sustain Dev Issues. (2024) 2:67–75. doi: 10.62433/josdi.v2i2.29
27. Khan, A, Khan, MA, and Asif, M. Assessing the impact of car bon emission, health expenditure, IMR and GDP on life expectancy in India: using cointegration approach. J Environ Energy Econ. (2024) 3:54–62. doi: 10.56946/jeee.v3i1.398
28. Saidmamatov, O, Saidmamatov, O, Sobirov, Y, Marty, P, Ruzmetov, D, Berdiyorov, T, et al. Nexus between life expectancy, CO2 emissions, economic development, water, and agriculture in Aral Sea basin: empirical assessment. Sustainability. (2024) 16:2647. doi: 10.3390/su16072647
29. Țarcă, V, Țarcă, E, and Moscalu, M. Social and economic determinants of life expectancy at birth in Eastern Europe. Healthcare. (2024) 12:1148. doi: 10.3390/healthcare12111148
30. Szymańska, A. An empirical assessment of the relationship between life expectancy at birth and carbon dioxide emissions in 27 European Union countries. Panoeconomicus. (2024) 72:583–603. doi: 10.2298/PAN220906013S
31. Altaee, HHA, Rahim, F, Dzhusupov, K, and Toguzbaeva, K. Impact of CO2 emissions, income, and urbanization on health status in GCC countries: a moderating role of energy consumption. Glob Transit. (2025) 7:211–22. doi: 10.1016/j.glt.2025.04.005
32. Zhang, Y, Huang, M, Zhang, Y, Kong, X, Shi, K, and Zhu, B. Air pollution and life expectancy: the role of education and health expenditure in China. Front Public Health. (2025) 13:1553039. doi: 10.3389/fpubh.2025.1553039
33. Wahyudi, H, and Leny, SM. Nexus among carbon dioxide emissions, gross domestic product, average years of schooling on life expectancy at birth in Indonesia. International journal of energy economics and policy. Int J Energy Econ Policy. (2025) 15:60–7. doi: 10.32479/ijeep.18197
34. Khan, F, Sarwar, G, Khan, MA, Noor, S, and Rehman, ZU. Assessing the link between environmental quality and life expectancy in developing nations: an empirical analysis for sustainable development. Int Soc Sci J. (2025) 75:295–310. doi: 10.1111/issj.12553
35. Rjoub, H, Odugbesan, JA, Adebayo, TS, and Wong, W-K. Investigating the causal relationships among carbon emissions, economic growth, and life expectancy in Turkey: evidence from time and frequency domain causality techniques. Sustainability. (2021) 13:2924. doi: 10.3390/su13052924
36. Mahalik, MK, Le, TH, Le, HC, and Mallick, H. How do sources of carbon dioxide emissions affect life expectancy? Insights from 68 developing and emerging economies. World Dev Sustain. (2022) 1:100003. doi: 10.1016/j.wds.2022.100003
37. Yang, Y, and Ying, Q. Political factors, carbon emissions, and life expectancy in India: implications for the sustainable development goal 3. Afr J Reprod Health. (2024) 28:74–80. doi: 10.29063/ajrh2024/v28i3.8
38. Das, S, and Debanth, A. Impact of CO2 emission on life expectancy in India: an autoregressive distributive lag (ARDL) bound test approach. Futur Bus J. (2023) 9:5. doi: 10.1186/s43093-022-00179-9
39. Azam, M, and Adeleye, BN. Impact of carbon emissions sources on life expectancy in Asia and the Pacific region. Nat Res Forum. (2024) 48:35–57. doi: 10.1111/1477-8947.12303
40. Redzwan, N, and Ramli, R. Carbon emissions, health expenditure, and economic effects on life expectancy in Malaysia. WORLD. (2024) 5:588–602. doi: 10.3390/world5030030
41. Hasnawati, S, Usman, M, Elfaki, FA, Faisol, A, and Russel, E. Modeling the relationship between life expec-tancy, population growth, carbon dioxide emission, and GDP growth in Indonesia. Int J Energy Econ Policy. (2024) 14:484–500. doi: 10.32479/ijeep.16303
42. Miladinov, G. Socioeconomic development and life expectancy relationship: evidence from the EU accession candidate countries. Genus. (2020) 76:2. doi: 10.1186/s41118-019-0071-0
43. Şenol, O, Gökkaya, D, and Çıraklı, Ü. The effects of economic variables on health expenditure per capita and life expectancy at birth: panel data analysis for middle top income countries. Mehmet Akif Ersoy Univ J Econ Admin Sci Fac. (2021) 8:1499–515. doi: 10.30798/makuiibf.909994
44. Shi, J, Tarkiainen, L, Martikainen, P, and van Raalte, A. The impact of income definitions on mortality inequalities. SSM Populat Health. (2021) 15:100915. doi: 10.1016/j.ssmph.2021.100915
45. Morina, F, Komoni, A, Kilaj, D, Selmonaj, D, and Selmonaj, S. The effect of health expenditure on life expectancy. Int J Sustain Dev Plann. (2022) 17:1389–401. doi: 10.18280/ijsdp.170502
46. Karunarathne, M, Buddhika, P, Priyamantha, A, Mayogya, P, Jayathilaka, R, and Dayapathirana, N. Restoring life expectancy in low-income countries: the combined impact of COVID-19, health expenditure, GDP, and child mortality. BMC Public Health. (2025) 25:894. doi: 10.1186/s12889-025-22109-4
47. Alwago, WO. The nexus between health expenditure, life expectancy, and economic growth: ARDL model analysis for Kenya. Reg Sci Policy Pract. (2023) 15:1064–86. doi: 10.1111/rsp3.12588
48. Rezapour, A, Mousavi, A, Lotfi, F, Soleimani Movahed, M, and Alipour, S. The effects of health expenditure on health outcomes based on the classification of public health expenditure: a panel data approach. Shiraz E Med J. (2019) 20:e88526. doi: 10.5812/semj.88526
49. Bunyaminu, A, Mohammed, I, Yakubu, IN, Shani, B, and Abukari, AL. The effect of health expenditure on average life expectancy: does government effectiveness play a moderating role? Int J Health Gov. (2022) 27:365–77. doi: 10.1108/IJHG-03-2022-
50. Sarıyıldız, AY. Healthcare workforce and expenditure: influences on life expectancy and infant mortality in Turkey. Anatol Curr Med J. (2025) 7:77–83. doi: 10.38053/acmj.1579199
51. Alimi, OY, Odugbemi, AA, and Osisanwo, BG. Public policy and health outcomes: impact of health expenditure on life expectancy and child mortality. J Bus Admin Soc Stud. (2023) 7:19–31. doi: 10.5152/JBASS.2023.23006
52. Saraç, E, and Torun, N. The effects of health expenditures on health outcomes in Türkiye. IGUSABDER. (2024) 23:882–900. doi: 10.38079/igusabder.1520663
53. WHO (2025). Life expectancy and Healthy life expectancy. Available online at: https://www.who.int/data/gho/data/themes/topics/indicator-groups/indicator-group-details/GHO/life-expectancy-and-healthy-life-expectancy (Accessed July 10, 2025).
54. Climate Watch (2025). Historical GHG Emissions. Available online at: https://www.climatewatchdata.org/ghg-emissions (Accessed July 10, 2025).
55. WHO (2025). Global Health Expenditure Database, Available online at: https://apps.who.int/nha/database/ViewData/Indicators/en (Accessed July 10, 2025).
56. World Bank (2025). GDP per capita (constant 2015 US$). Available online at: https://data.worldbank.org/indicator/NY.GDP.PCAP.KD (Accessed July 10, 2025).
57. Westerlund, J, and Edgerton, DL. A simple test for co-integration in dependent panels with structural breaks. Oxf Bull Econ Stat. (2008) 70:665–704. doi: 10.1111/j.1468-0084.2008.00513.x
58. Eberhart, M., and Bond, S. R. (2009). Cross-sectional dependence in non-stationary panel models: a novel estimator. In Proceedings of the 5th Nordic econometric meetings. Lund 2009.
59. Pesaran, MH, and Smith, R. Estimating long-run relationships from dynamic heterogeneous panels. J Econom. (1995) 68:79–113. doi: 10.1016/0304-4076(94)01644-F
60. Juodis, A, Karavias, Y, and Sarafidis, VA. Homogeneous approach to testing for granger non-causality in heterogeneous panels. Empir Econ. (2021) 60:93–112. doi: 10.1007/s00181-020-01970-9
61. Dhaene, G, and Jochmans, K. Split-panel jackknife estimation of fixed-effect models. Rev Econ Stud. (2015) 82:991–1030. doi: 10.1093/restud/rdv007
62. Xiao, J, Juodis, A, Karavias, Y, Sarafidis, V, and Ditzen, J (2022). Improved Tests for Granger Non-Causality in Panel Data. Available online at: https://mpra.ub.uni-muenchen.de/114231/ (Accessed September 18, 2025).
63. Pesaran, MH. A simple panel unit root test in the presence of cross-section dependence. J Appl Econ. (2007) 22:265–312. doi: 10.1002/jae.951
64. Pesaran, MH. Estimation and inference in large heterogeneous panels with a multifactor error structure. Econometrica. (2006) 74:967–1012. doi: 10.1111/j.1468-0262.2006.00692.x
65. Osei-Kusi, F, Wu, C, Tetteh, S, and Castillo, WIG. The dynamics of carbon emissions, energy, income, and life expectancy: regional comparative analysis. PLoS One. (2024) 19:e0293451. doi: 10.1371/journal.pone.0293451
66. OECD (2025). Environmental Policy Stringency Index. Available online at: https://stats.oecd.org/Index.aspx?DataSetCode=EPS (Accessed September 18, 2025).
67. World Bank (2025). Renewable energy consumption (% of total final energy consumption). Available online at: https://data.worldbank.org/indicator/EG.FEC.RNEW.ZS (Accessed September 18, 2025).
Keywords: CO2 emissions, per capita GDP, older adults’ health, panel econometrics, public health expenditures, private health expenditures
Citation: Köroğlu MA, Sart G, Bayar Y and Danilina M (2025) Do CO2 emissions, per capita GDP, public and private health expenditures matter for the health of older adults: empirical evidence from the E7 countries. Front. Public Health. 13:1694795. doi: 10.3389/fpubh.2025.1694795
Edited by:
Lu Xing, Nanjing University of Science and Technology, ChinaReviewed by:
Emiljan Karma, Catholic University Our Lady of Good Counsel, AlbaniaViktoriia Vovk, Stanisław Staszic University of Applied Sciences in Piła, Poland
Copyright © 2025 Köroğlu, Sart, Bayar and Danilina. This is an open-access article distributed under the terms of the Creative Commons Attribution License (CC BY). The use, distribution or reproduction in other forums is permitted, provided the original author(s) and the copyright owner(s) are credited and that the original publication in this journal is cited, in accordance with accepted academic practice. No use, distribution or reproduction is permitted which does not comply with these terms.
*Correspondence: Muhammet Ali Köroğlu, bXVoYW1tZXQua29yb2dsdUB1c2FrLmVkdS50cg==