 Ding-you Zhang
 Hu Lou
 Jun Liu*
 Bo Li
Bo Li- Institute of Sports Science, Nantong University, Nantong, China
Objective: To explore the key predictors of physical activity (PA) levels of Chinese university students, and to analyse the predictive roles of different variables and their relative importance by means of the Random Forest (RF) algorithm.
Methods: A cross-sectional study was conducted using a stratified whole-group sampling method, covering 17 provinces of the country and collecting 10,182 valid questionnaires. Assessment of PA levels using the Physical Activity Rating Scale-3 (PARS-3) divides participants into attainment and non-attainment groups. The independent variables encompass the individual and interpersonal organisational levels of the socio-ecological model (SEM), comprising a total of 39 variables. These variables include demographic characteristics, psycho-behavioural factors, and social support, which were measured using several standardised scales. Feature importance analysis was performed using the Random Forest algorithm, and the model parameters were optimised with a grid search and 5-fold cross-validation to identify the most significant factors predicting PA.
Results: The RF model had an accuracy of 0.704 and an AUC value of 0.762. Characteristic importance analysis revealed that exercise adherence (exercise behaviour), sex, exercise adherence (effort investment), mastery of sports skills, exercise motivation (ability), alcohol consumption level, exercise adherence [emotional experience, exercise motivation (social), and exercise motivation (fun) ranked as the top nine predictive factors]. Specifically, all sub-dimensions of exercise adherence (exercise behaviour) positively predict PA (SHAP values > 0); sex, males are more likely than females to meet the standard group criteria (OR > 1, p < 0.001); mastery of sports skills correlates positively with PA levels; and among alcohol consumption level, ‘occasional drinking’ shows a negative correlation with the standard attainment rate (p < 0.001).
Conclusion: Exercise adherence, sex, mastery of sports skills, and alcohol consumption level are significant factors predicting PA levels among Chinese university students. Recommendations for promoting PA include enhancing the “emotional value” and social attributes of exercise, addressing female students’ willingness to participate, and improving physical capabilities through skills training to effectively elevate activity levels.
Introduction
Physical activity (PA) refers to any bodily movement produced by skeletal muscle contraction that requires energy expenditure (1). Extensive research demonstrates that maintaining a certain level of PA can significantly alleviate negative emotional symptoms, such as depression and stress, among university students (2), preserve physical health (3), and improve health-related quality of life (2). In 2020, the World Health Organisation (WHO) issued guidelines on PA and sedentary behaviour (3). These guidelines emphasise that to mitigate the adverse health effects of sedentary behaviour, adults should engage in 150–300 min of moderate-intensity aerobic PA, or 75–150 min of vigorous-intensity aerobic PA, or an equivalent combination of both, per week. A 2024 study involving 5.7 million participants revealed that levels of insufficient PA continue to rise globally (4). Despite global recommendations, insufficient PA remains an urgent public health concern, especially among young people (5). A 2022 WHO briefing note indicates that 81% of adolescents aged 13–24 globally fail to meet recommended PA levels. This represents a 5-percentage-point increase since 2010, signalling a persistent widening of the youth PA deficit (6). A 2024 global study of 5.7 million participants revealed a continued rise in insufficient PA, particularly among individuals aged 18–24 (4). Nationwide surveys in China indicate that approximately 70–80% of university students fail to meet WHO-recommended PA levels (5, 7). Recent trends also show low PA levels among adolescents in certain regions, where only 13.2% of subjects meet WHO recommendations (8). Notably, boys’ PA levels tend to exceed those of girls (9). Furthermore, increased financial constraints and academic pressures among some university students further diminish opportunities for PA engagement (10). Given PA’s pivotal role in promoting physical and mental health during early adulthood, understanding and addressing the factors contributing to physical inactivity among Chinese university students has significant public health implications. However, current evidence on PA levels among Chinese university students remains fragmented, with most studies examining only a few variables such as self-efficacy (11), sex (12), social support (5), screen time, and stress (13). To address this gap and improve the current situation of insufficient PA among Chinese university students, this study selected a national sample of 10,182 college students from 16 provinces and municipalities across China. It simultaneously integrated these predictors of student PA to identify the most significant key variables, thereby enhancing PA levels and promoting the physical health of university students.
Bronfenbrenner (14) first systematically proposed the Social-Ecological Model (SEM). Building upon Bronfenbrenner’s social ecological theory, McLeroy (15) introduced a hierarchical analytical framework. Employing spatial metaphors, this framework categorises influencing factors across five progressively broader dimensions: individual, interpersonal, organisational, community, and policy. The individual level focuses on intrinsic personal characteristics, including health perceptions, behavioural patterns, and self-regulation capabilities. The interpersonal level emphasises supportive interactions within social networks such as family members and peer groups. The organisational level examines the structural influences exerted by institutional entities, such as schools and enterprises, through normative frameworks and resource allocation. The community level integrates social and environmental factors, such as cultural traditions and public facilities, within geographical spaces. At the policy level, as a macro-level driving system, it continuously permeates all levels through laws, regulations, cultural values, and national strategies (16, 17). As a core theoretical framework in health behaviour research, the SEM demonstrates significant advantages in analysing the determinants of individual health behaviours through its multidimensional analytical system (18). In this study, the model enables a stratified examination of factors predicting PA levels, precisely identifying root-cause factors within target groups to guide the formulation of tailored health intervention programmes. Consequently, the individual and interpersonal/organisational levels of the SEM were selected as the analytical framework. Factors potentially predicting university students’ PA levels were incorporated into this model to explore the interplay between individual and interpersonal/organisational dimensions, thereby providing systematic solutions for promoting students’ physical health. The exclusion of the community and policy levels was primarily based on the following considerations: This study constitutes the foundational phase of predictive model construction, aiming to rapidly identify key individual factors amenable to intervention. It seeks to provide low-cost, high-return intervention targets for physical education in higher education institutions. All research samples originate from internal university environments, where sporting resources, curriculum design, and management systems are constrained by unified educational policies and institutional frameworks, resulting in minimal policy-level variation. University students’ primary activity spaces are concentrated on campus, with community sporting resources exerting far less influence on their sporting behaviour than on-campus factors. McLeroy et al. (15) similarly note that the SEM does not necessitate the simultaneous inclusion of all hierarchical variables. Researchers may prioritise the most intervention-worthy levels based on study objectives and resource constraints. Overseas studies have also adopted a hierarchical modelling strategy, first establishing individual models before expanding to socio-policy models (19, 20). This research follows these pathways, demonstrating both practical and theoretical validity.
With the rapid advancement of artificial intelligence technology, machine learning applications in fields such as health management and sports science have gradually matured. In 2016, the State Council’s ‘Healthy China 2030’ Planning Outline also proposed for the first time to ‘improve the physical fitness monitoring system and develop applications for big data on national physical fitness monitoring’ (21). Although machine learning has been applied in sports education (22, 23), competitive sports (24, 25), and athletic performance prediction (26), its application in identifying predictors of PA among university students remains unexplored. Machine learning possesses advantages such as ‘massive data processing’, ‘capturing non-linear relationships’, and ‘feature importance ranking’. It can integrate multi-dimensional predictive factors to construct high-precision prediction models, providing technical support to overcome traditional research limitations and enhance the scientific rigour and practicality of physical literacy studies (27). It holds broad application prospects in the prediction and assessment of physical fitness and health. Therefore, to thoroughly explore the predictors of PA among Chinese university students and formulate targeted physical intervention policies and health promotion strategies, this study proposes to employ four machine learning models—Logistic Regression (LR), Random Forest (RF), eXtreme Gradient Boosting (XGBoost), and Light Gradient Boosting Machine (LightGBM)—to model the predictors of PA among Chinese university students. By integrating the SEM with machine learning, this approach enriches and expands analytical methods within the field of PA research, offering new perspectives for related studies.
Methods
Survey subjects
The survey participants comprised students enrolled in ordinary higher education institutions within mainland China, with the list of such institutions referenced from the Ministry of Education’s ‘National List of Ordinary Higher Education Institutions (as of 20 June 2024)’. Following the principles of stratified cluster sampling, representative samples were drawn from 17 provinces across the nation. The final sample comprised 155 higher education institutions, divided into three categories: 42 institutions in ‘Category I’ (provincial capital cities), 73 in ‘Category II’ (municipalities with average socio-economic conditions), and 40 in ‘Category III’ (municipalities with relatively weaker socio-economic conditions). It should be specifically noted that Nantong University, as the lead institution for the project, primarily assumes responsibilities for research design, coordination, and ethical oversight. The sampling framework for this study encompasses the entire nation, with data collection not concentrated in Nantong or its provincial jurisdiction. The nationwide sampling methodology detailed below ensures geographical diversity within the sample, effectively mitigating regional biases that might otherwise arise from a single institution’s dominance.
Sampling method
The study primarily employed epidemiological survey methods. To ensure the national representativeness of the sample, the investigation covered most regions of China, including Jiangsu, Shanghai, Shandong, Jilin, Henan, Sichuan, Chongqing, Guizhou, Yunnan, Shaanxi, Gansu, Qinghai, Ningxia, Xinjiang, Guangxi, Inner Mongolia, and Hainan provinces. This geographical scope encompasses eastern, central, western and north-eastern China, representing diverse levels of socio-economic development. Consequently, it provides macro-level support for the subsequent conclusions’ external validity when extrapolated to the broader population of Chinese university students. A total of 10,182 valid questionnaires were obtained. The survey participants comprised undergraduate students enrolled in China’s regular higher education institutions, specifically including junior college students and undergraduates, but excluding postgraduate students (master’s and doctoral candidates). Samples were stratified by geographical region (e.g., province, municipal administrative level) and university type (e.g., comprehensive universities versus local institutions). Considering the sample size requirements for the RF model employed in this study, we assessed sample adequacy using empirical rules and the events per variable (EPV) criterion (28). RF models typically necessitate sufficient observations per category to ensure model stability, with a generally recommended minimum sample size of at least 10 times the number of independent variables. This study involved 39 independent variables, necessitating a sample size of at least 390 individuals. The final sample size (N = 10,182) substantially exceeded the required sample size. At the same time, the positive event count in the target group (n = 4,529) also met the EPV > 10 criterion, providing sufficient support for the robustness of model training and validation (28).
This study employed stratified, cluster, and multistage sampling methods to select survey subjects. The specific sampling procedures are as follows:
Determine the sampling location
To ensure the representativeness of the test subjects, each province (autonomous region, municipality) was allocated an average of three sampling locations. Based on drawing equal samples from different cities, the specific approach was as follows: - Prefecture-level cities under the jurisdiction of each province or autonomous region were selected as sampling locations. Among these, provincial capitals were designated as ‘Category I’ sampling locations; The selection principles for the other two prefecture-level cities are as follows: while considering the geographical distribution within the province or autonomous region, one prefecture-level city with average socio-economic development is designated as a ‘Category II’ sampling location, and one prefecture-level city with relatively underdeveloped socio-economic conditions is designated as a ‘Category III’ sampling location. In municipalities directly under the central government, sample selection does not need to adhere to the principles above, with random cluster sampling being the primary method of choice. However, the principle of three sampling locations must be observed quantitatively.
Determine the sampling unit
Four primary considerations guided the selection of sampling units: firstly, the higher education institution must be a fully accredited institution registered with the Ministry of Education, including higher vocational colleges; secondly, the unit must satisfy sampling requirements (namely age, student numbers, Grade distribution, etc.); thirdly, the unit must have a designated questionnaire distribution coordinator and demonstrate willingness for long-term participation in the monitoring programme; fourthly, the institution’s students must have returned for the autumn semester.
Grouping
Participants were divided into two groups by sex (male and female), and then further categorised into eight sample groups by Grade.
Data cleaning rules and selection
During data preprocessing, responses exhibiting logical errors, omissions, inaccuracies, or unidentifiable entries were either retested or excluded to ensure the authenticity and validity of the data. Valid questionnaires were incorporated according to the following rules: Step 1: Exclude questionnaires where the full name of the institution was illegible; Step 2: Exclude questionnaires where the respondent’s age was recorded as under 18 or over 25; Step 3: Exclude questionnaires where at least 21 consecutive response codes were identical; Step 4: Following the above exclusions, the average completion time for remaining questionnaires was 539 s. Questionnaires with completion times falling within the ranges [0, 5%] and [95, 100%] were removed.
Ultimately, this study selected 10,182 Chinese university students aged 18–25 as research subjects. Questionnaire data collection was conducted online, with researchers and supervising lecturers present during the data acquisition process. This study was approved by the Ethics Committee of Nantong University [Approval No. Tongda Ethics (2022) 70, dated 16 February 2022]. All participants signed informed consent forms detailing the study’s objectives, methodology, potential risks, and subjects’ rights. This ensured voluntary participation based on ethical review and full disclosure. All participants were informed that the questionnaire would take approximately 12 min to complete and that they could withdraw at any time without repercussions. A pre-survey was conducted before implementation to refine the questionnaire design based on the feedback received. To minimise potential social desirability bias and recall bias inherent in self-reported data, the following measures were implemented during this study: (1) Standardised scales validated for reliability and validity among Chinese university students (e.g., PARS-3) were prioritised to ensure cultural adaptation and measurement efficacy; (2) Conducting a pre-survey prior to formal questionnaire administration, refining question phrasing based on feedback to enhance clarity and unambiguity of items; (3) Researchers or supervising tutors were present during data collection to provide standardised explanations for participants’ queries; (4) Rigorous data cleaning protocols were applied, alongside confidential processing of sample data. Nevertheless, measurement of subjective constructs remains primarily reliant on self-report, a limitation further addressed in the discussion section.
Selection and coding of scales
PA levels
The PA levels of university students in this study were measured using the Physical Activity Rating Scale-3 (PARS-3), developed by Japanese scholar Hashimoto Kimio in 1990 and subsequently translated and revised by Chinese scholar Liang Deqing in 1994 (29). The PARS-3 assesses PA volume across three dimensions: intensity, frequency, and duration per session. Each dimension comprises five options, with scores ranging from 1 to 5. The total score ranges from 0 to 100 points, where a higher score indicates a greater volume of PA.
The PARS-3 normative classification for Chinese adults is as follows: low activity level (≤19 points), moderate activity level (20–42 points), and high activity level (≥43 points) (29). The PARS-3 exhibits a Cronbach’s α coefficient of 0.78, GFI = 0.93, AGFI = 0.92, CFI = 0.88, RMSEA = 0.06, and test–retest reliability of 0.82. The scale has undergone validation of reliability and validity within China, demonstrating sound reliability and validity, and serves well as a general research instrument. According to the World Health Organisation’s PA and Sedentary Behaviour Guidelines, adults aged 18–64 should achieve 150–300 min of moderate-intensity or 75–150 min of vigorous-intensity aerobic activity per week, or an equivalent combination (5). Accordingly, this study combined the ‘moderate activity level’ and ‘high activity level’ categories assessed by PARS-3 into a ‘compliant group’ to define PA levels meeting the guideline requirements.
Independent variable
This study, based on McLeroy’s hierarchical analysis framework (28), selected a total of 39 variables categorised into individual, interpersonal, and organisational levels. This approach aims to comprehensively cover key factors influencing university students’ PA at individual, interpersonal, and organisational levels. Variable selection adhered to three principles: first, theory-driven selection, ensuring all variables corresponded to constructs defined at the individual or interpersonal-organisational levels within the SEM (30); secondly, literature support, with all included variables having been demonstrated in prior research to exhibit significant associations with PA among adolescents or university students (30–33); thirdly, practical feasibility, prioritising psychological and behavioural characteristics observable and amenable to intervention within campus settings. Accordingly, variables reflecting individual intrinsic traits, cognitive patterns, and behavioural modes—such as mastery of sports skills, exercise motivation, psychological resilience, and health literacy—were explicitly categorised as individual-level factors. Variables reflecting the quality of an individual’s interactions with social networks—such as student peer relationships, family support, and socially oriented exercise motivation—were classified as interpersonal-organisational level factors. For instance, psychological resilience and its sub-dimensions are categorised as individual-level factors, as they constitute intrinsic psychological assets that enable individuals to cope with stress and challenges. This study aims to address the shortcomings of previous research, which often focused on isolated factors without a systematic framework, by employing this multi-level, multi-factor integrated analysis. This approach enables more precise identification of key targets for PA interventions.
Introduction to machine learning models
Machine learning models possess the capacity to handle non-linear relationships and higher-order interaction effects, enabling them to effectively capture the intricate interplay mechanisms between cross-level variables within SEM (34); Secondly, they exhibit inherent tolerance to multicollinearity, rendering them suitable for the multidimensional, potentially correlated set of predictor variables in this study (35); furthermore, these models accommodate both continuous and categorical variables without stringent assumptions on variable distributions, thereby enhancing their generalisability and practical adaptability (36). More significantly, through feature importance ranking and SHAP value interpretation, these models can quantify each variable’s marginal contribution to prediction outcomes (37). This aligns logically with the SEM’s emphasis on the independent and synergistic effects of multi-level factors on behaviour, providing data-driven evidence for identifying key intervention targets. Therefore, this study selected the following four machine models for the construction of prediction models and conducted comparisons between the models.
LR
LR, proposed by David Cox in 1958, stands as one of the most maturely applied members within the family of generalised linear models. It employs the logit transformation to map linear combinations onto the 0–1 probability space, enabling maximum likelihood estimation for binary or multi-class classification tasks (38). Despite its simple structure, LR is widely employed in disease risk prediction, credit scoring, consumer behaviour modelling, and sports outcome forecasting due to its highly interpretable coefficients, computational efficiency, and suitability for small-to-medium sample sizes (39–41). Furthermore, its output probabilities can be directly converted into risk assessment scores, providing transparent and auditable decision-making foundations for public health policies and sports betting markets. Specific LR parameters include: C: The reciprocal of regularisation strength; smaller floating-point values impose stronger penalties, preventing overfitting. Typical search range: 0.01–100. penalty: Regularisation type, selectable as L1 (sparsity coefficient), L2 (weight decay), or elasticnet (hybrid of both); L1 suits high-dimensional sparse scenarios, while elasticnet requires additional specification of l1_ratio. solver: Optimisation algorithm, liblinear is suitable for small datasets and supports L1/L2, while saga supports elasticnet and large datasets. max_iter: Maximum iteration count, default 100; may be increased to 200–500 if model fails to converge. class_weight: Category weighting; setting to balanced enables automatic inverse weighting based on sample frequency to mitigate class imbalanc (38).
RF
RF, as a vital component of machine learning, constitute an ensemble learning algorithm based on decision trees, first proposed by Leo Breiman in 2001 (42). They enhance predictive accuracy and robustness by constructing multiple decision trees and aggregating their predictions through voting (43). RF employ a bootstrap aggregating (bagging) algorithm comprising multiple decision trees as predictors. Each decision tree functions as a weak learner, with the final prediction determined through voting or averaging. Existing research demonstrates that RF have achieved significant predictive outcomes in finance (44), medical fields (45–47), energy management (48, 49), and education (50). It has also been applied in sports to predict match outcomes (51, 52), and athletic performance (53). Core RF parameters include: n_estimators: Number of decision trees in the forest. Larger values within 50–500 reduce variance but increase computational load linearly. Typically, 100–300 strikes a balance between accuracy and efficiency. max_depth: The maximum depth of a single tree, controlling its fitting capability; greater depth increases overfitting risk, commonly set to 3–10. min_samples_split: The minimum number of samples required for node splitting; increasing this value suppresses overfitting; typical values range from 2 to 20. min_samples_leaf: Minimum leaf node sample size, synergistically controlling tree complexity with the above parameter; typically set to 1–5. max_leaf_nodes: Maximum leaf nodes per tree. Once set, the tree grows using ‘best-first’ expansion until the leaf node limit is reached or impurity gains plateau. Common search range [4, 6, 8, 10]. Smaller values yield simpler models and prevent overfitting. min_impurity_decrease: Minimum impurity reduction required for node splitting. Splitting ceases below this threshold. Typical grid [0, 0.01, 0.02]. Increasing this value prunes and simplifies the model, enhancing generalisation capability (42).
XGBoost
XGBoost, open-sourced by Tianqi Chen in 2016, is a high-performance ensemble tree method that incorporates second-order derivatives, regularisation, and sparsity-aware algorithms within the gradient boosting framework (54). It progressively optimises the objective function through additive training, fitting the negative gradient of residuals from the previous round at each iteration to achieve strong generalisation capabilities (54). Its built-in gain-based feature importance and SHAP value interpretation modules enable researchers to quantify the marginal contributions of multi-level influencing factors, providing interpretable pathways for precise interventions. n_estimators: Number of boosting rounds, i.e., the number of trees; commonly used values range from 50 to 300. max_depth: Maximum depth per tree, default 6; 3–8 suffices during training, as excessive depth risks overfitting. learning_rate: Learning rate, 0.01–0.3; lower values enhance robustness but require more trees. Subsample: Sampling proportion of training samples per round, 0.6–1.2 introduces randomness to reduce variance. Gamma: Minimum loss reduction required for node splitting; higher values make the model more conservative. Adjustable between 0 and 0.5. reg_lambda: Regularisation penalty for weights, controlling model complexity. Common combinations range from 0 to 5.
LightGBM
LightGBM was released by the Microsoft team in 2017, significantly reducing computational and memory overhead through its histogram-based gradient boosting algorithm (55). Employing a leaf-wise growth strategy and supporting direct input of categorical features, it achieves training speeds several to dozens of times faster while maintaining accuracy (55). LightGBM demonstrates exceptional performance in scenarios involving extremely large samples and high-dimensional sparse data (56), When integrated with the SHAP interpretability framework, the model clearly reveals the interactive effects of different match scenarios or environmental-level variables on outcomes. This provides rapid, scalable, and interpretable evidence support for both sports tactics and public health policy. num_leaves: Number of leaf nodes per tree, jointly controlling complexity with max_depth; typically set to 0.5–1 times 2^(max_depth). max_depth: Maximum tree depth, recommended at 3–8 for leaf-wise growth mode. learning_rate (eta): Same as XGBoost, commonly set at 0.05–0.2. colsample_bytree: Sample and feature sampling ratio, introducing randomness at 0.6–1.0. min_child_samples: Minimum number of samples per leaf node, with higher values suppressing overfitting; commonly set at 10–100.
Statistical methods and machine learning model construction
In this study, data processing primarily utilised three software packages: SPSS 27.0, Excel, and DAMAS. The entire process can be divided into several key stages: (1) Preliminary processing of data collected via the Wenshu Xing platform was conducted using Excel, including re-measurement or removal of incomplete or anomalous data. (2) Data analysis was conducted on the collected student data. For continuous variables, the chi-square test was employed to investigate differences in PA levels. The η2 value ranged between 0 and 1. According to Cohen’s d standards, an effect size of 0.01 indicates a small effect, 0.06 denotes a moderate effect, and 0.14 signifies a large effect (57). A larger η2 suggests a stronger association between the continuous variable and PA levels, as well as a greater explanatory power for differences in PA levels. Conversely, a smaller η2 signifies a weaker association and reduced explanatory power. For categorical variables, cross-tabulation was employed to examine the strength of associations between sex, Grade, age, and student location regarding exercise, romantic involvement, and depression. Cramer’s V ranges from 0 to 1, with higher values indicating a stronger association between categorical variables. Values of 0.0 ≤ V < 0.1 correspond to no or extremely weak association, 0.1 ≤ V < 0.3 to weak association, 0.3 ≤ V < 0.5 to moderate association, and V ≥ 0.5 to strong association (58). (3) Four machine learning models—LR, RF, XGBoost, and LightGBM—were constructed to predict the influencing factors of university students’ PA levels and rank these factors. The training set comprised 80% of the data, with the remaining 20% allocated to the test set. Model parameters were optimised through cross-validation of each parameter combination within a predefined parameter space, with the highest accuracy on the validation set serving as the optimization objective. The parameter combination demonstrating optimal generalisation capability and stability on the test set was ultimately selected to determine the model’s optimal parameter values (59, 60). (4) Following determination of optimal model parameters, performance evaluation utilised confusion matrices and their derived metrics: accuracy, precision, recall, and F1 score. Each confusion matrix metric ranges from 0 to 1, with higher values indicating superior model performance. Additionally, AUC (Area Under the ROC Curve) was employed to quantify overall model performance. AUC denotes the area under the ROC curve, ranging from 0 to 1, where higher values indicate superior model performance. (5) The optimal model is selected, and SHAP (SHapley Additive exPlanations) values are employed to interpret the model’s predictions, providing directional and magnitude information regarding feature contributions.
Results
Descriptive analysis
Table 1 results indicate that among 10,182 Chinese university students aged 18–25, the attainment rate for the standardised group was 44.5%, with males (63.8%) significantly higher than females (28.9%); higher Grades (third and fourth years at approximately 57%) outperformed lower Grades (first and second years at approximately 43%). Mastery of sports skills exhibited a dose–response effect: those proficient in ≥2 skills achieved 52.4% compliance, compared to only 22.6% among those proficient in 0 skills. For exercise motivation, individuals who ‘strongly agreed’ with all five dimensions (‘ability, fun, social, health, appearance’) demonstrated compliance rates of 60–70%, significantly higher than those who were ‘neutral’ (30–37%). Regarding health behaviours, those who occasionally drank alcohol or smoked achieved higher compliance rates, whereas daily screen time exceeding 8 h was associated with reduced compliance. Psychologically, the compliant group exhibited greater psychological resilience, self-efficacy, and life satisfaction, alongside lower depression levels. Scores across all three dimensions of health literacy were significantly superior to those of the non-compliant group.
Table 1. Descriptive analysis summary.
Model performance metrics
The grid parameter tuning results in Table 2 demonstrate that RF achieves an AUC of 0.762, Accury of 0.704, and F1 score of 0.696 under the combination of ‘n_estimators 100, max_depth 4, minimum_samples_split 4, minimum_samples_leaf 2, max_leaf_nodes 6, and min impurity_decrease 0’. These metrics surpass those of LightGBM (0.750, 0.703, 0.695), XGBoost (0.748, 0.701, 0.693), and LR (0.707, 0.662, 0.656). Furthermore, RF exhibited the narrowest 95% confidence interval, indicating optimal stability. The ROC curves in Figure 1 further demonstrate that RF’s orange dashed line consistently occupies the highest position across the entire FPR range. Its AUC significantly outperforms the other three models, providing intuitive validation of RF’s superior generalisation capability and robustness when handling the multidimensional, potentially collinear data in this study.
Table 2. List of parameter optimization results for four machine learning model algorithms.
Figure 1. ROC curve plot.
Analysis of characteristic importance
Figure 2, the Feature Contribution Plot, illustrates the characteristic importance of each feature within the model. A higher feature contribution indicates a more crucial role in the model’s predictive performance. Results indicate that exercise adherence (exercise behaviour), exercise adherence level, sex, exercise adherence (effort investment), exercise motivation (ability), exercise adherence (emotional experience), mastery of sports skills, exercise motivation (social), exercise motivation (fun), and alcohol consumption level rank among the top 10 contributing variables.
Figure 2. Feature contribution plot.
Figure 3 is a Feature Contribution Chart for Permuted Variables. This chart evaluates the importance of a feature by randomly permuting the values of each feature and observing the change in model performance. Results indicate that variables with the highest positive contribution values are: exercise adherence (exercise behaviour), sex, relationship status, mastery of sports skills, exercise motivation (health), alcohol consumption level, and smoking behaviour. Variables with the highest negative contribution values are: exercise adherence [exercise adherence (emotional experience), exercise motivation (social), exercise motivation (ability), exercise adherence level, and exercise adherence (effort investment)].
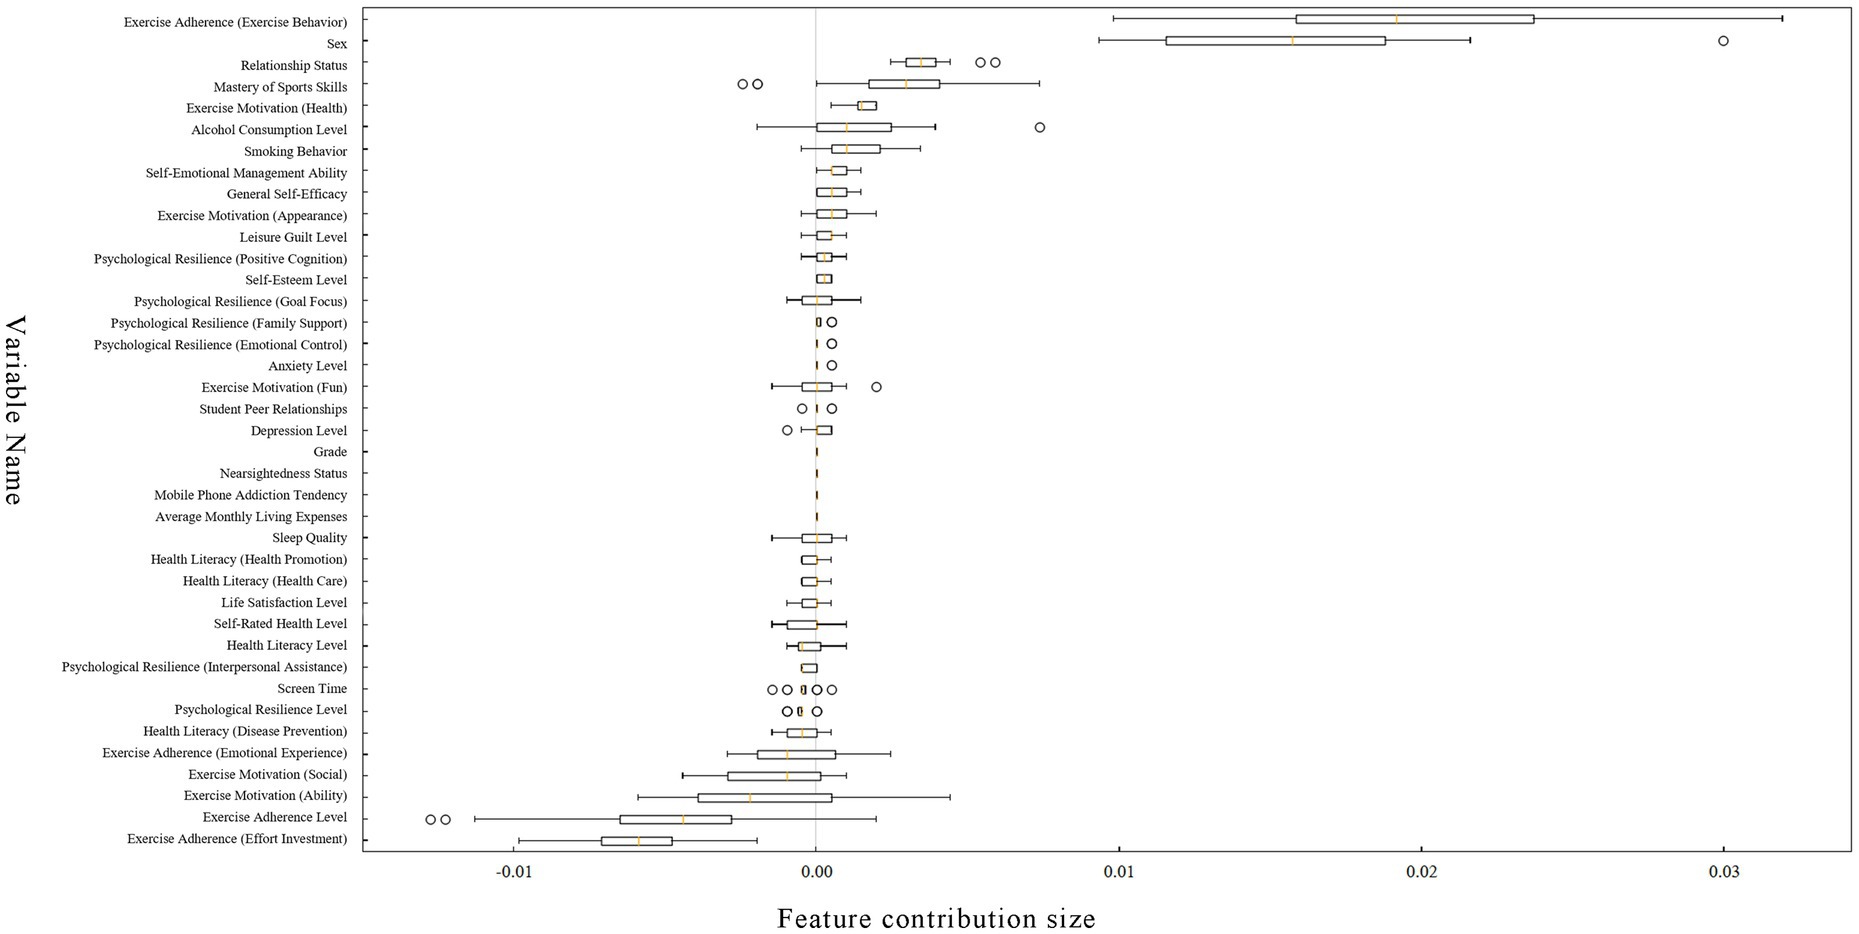
Figure 3. Feature contribution chart for permuted variables.
The slight discrepancies in feature ranking between Figures 2, 3 stem from the differing principles underlying these two evaluation methods. Figure 2 reflects a feature’s overall capability to separate nodes during model construction, whereas Figure 3 measures the feature’s independent contribution to the model’s predictive performance. For instance, the composite variable “exercise adherence level” ranks highly in Figure 2 because it correlates strongly with multiple sub-dimension variables and is frequently utilised during decision tree construction. However, in Figure 3‘s permutational testing, its information is overshadowed by its sub-dimensions, diminishing its independent contribution. Conversely, the sex variable, owing to its lower correlations with other variables, exhibits a more pure manifestation of its independent predictive capability in the permutational importance test, hence achieving a higher ranking. These discrepancies are common phenomena in RF analyses, collectively validating the importance of core factors from multiple perspectives.
Figure 4 presents a summary diagram of SHAP (SHapley Additive exPlanations), wherein dark green points denote smaller values of the feature variable. Should these points exhibit negative SHAP values, it indicates that low-value features exert a negative influence on the dependent variable; conversely, positive SHAP values suggest a positive effect. Light green points represent the opposite scenario. The results in Figure 4 indicate that the top 10 contributing variables are: exercise adherence (exercise behaviour), sex, exercise adherence level, exercise adherence (effort investment), mastery of sports skills, exercise motivation (ability), alcohol consumption level, exercise adherence (emotional experience), exercise motivation (social), and exercise motivation (fun) for exercise adherence. SHAP analysis reveals that high exercise behaviour levels, being male, greater mastery of sports skills, moderate alcohol consumption, and high identification with the ‘exercise motivation(ability)’ category all significantly increase the likelihood of meeting PA standards. Conversely, negative SHAP values associated with being female and abstaining from alcohol reduce the probability of achieving these standards.
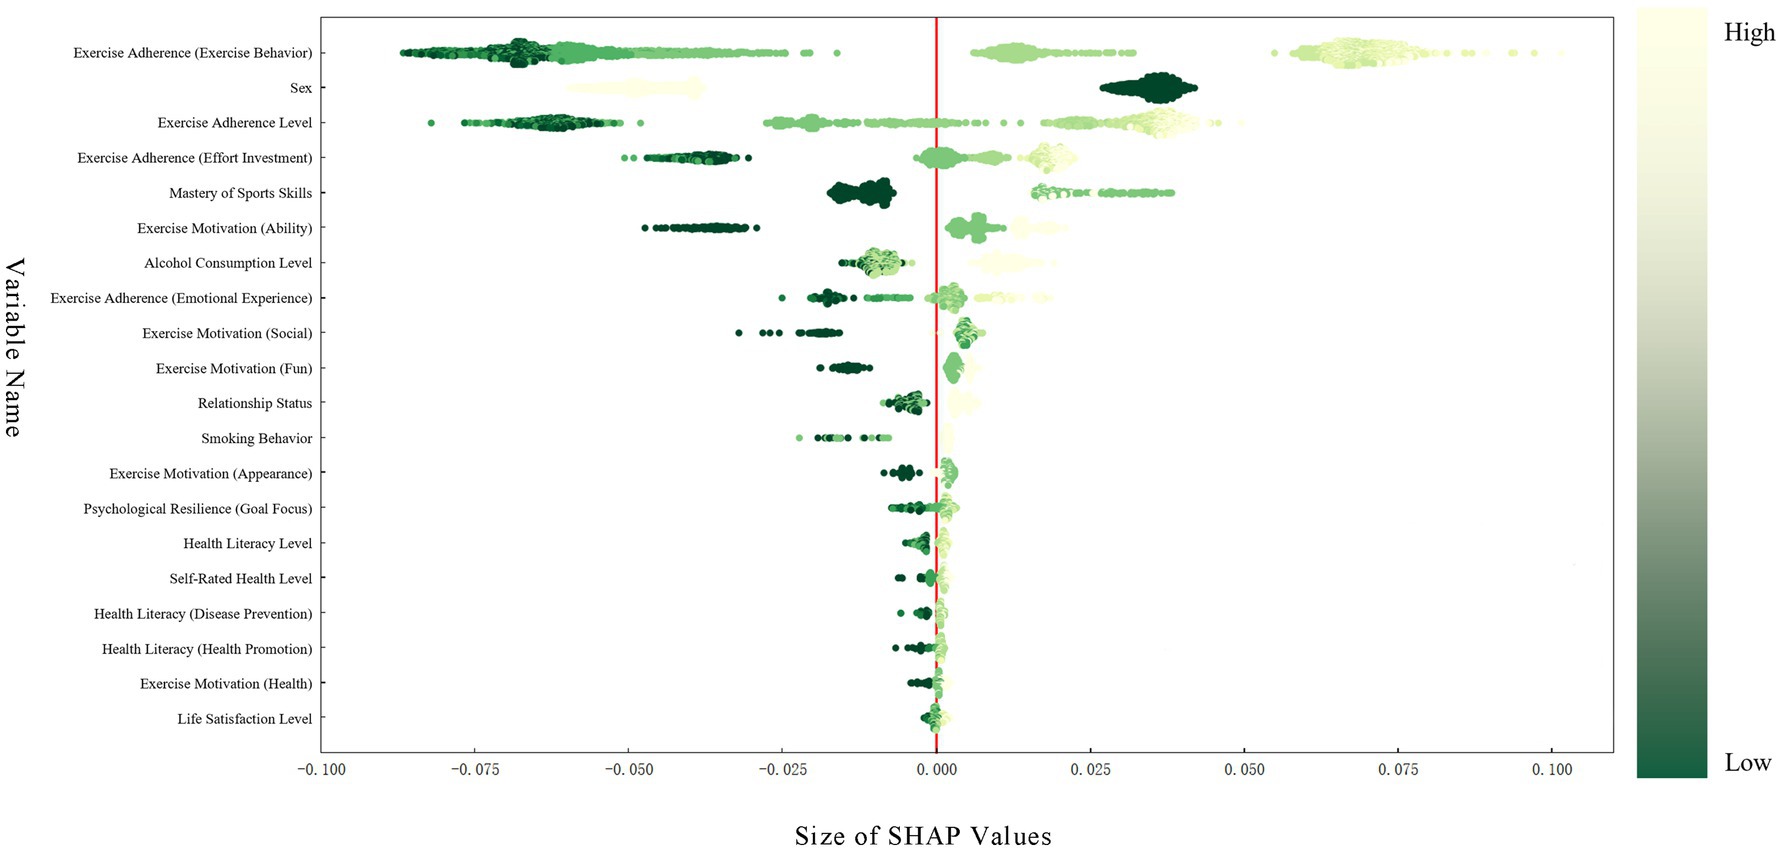
Figure 4. Schematic diagram of SHAP.
Discussion
This study systematically identified key predictors of PA among university students through characteristic importance analysis of a RF model. It must be emphasised that, owing to the inherent limitations of cross-sectional research designs, the findings reveal statistical associations and predictive significance between variables without enabling inferences of strict causality. Nevertheless, exercise adherence and its sub-dimensions, exercise motivation, sex, mastery of sports skills, and alcohol consumption level, were confirmed as the most critical predictors. These findings align with prior literature while deepening our understanding of PA among university students.
The findings reveal that exercise adherence is the most significant predictor of PA, consistent with prior research (61). However, this study further illuminates the independent contribution of exercise adherence’s sub-dimensions to PA, an aspect that has been seldom addressed in previous investigations. Among these, exercise adherence (exercise behaviour) stands as the most crucial predictor of PA. Descriptive analysis indicates that university students who consistently achieved the target PA level scored higher on exercise adherence (exercise behaviour) than those who failed to meet the standard. The SHAP summary plot from the RF model also shows that exercise adherence (exercise behaviour) values are distributed widely and ranked prominently, underscoring its significant role in facilitating the attainment of PA benchmarks. In this study, exercise adherence represents the individual level within the SEM. Active participation in physical exercise yields multiple benefits: psychologically, it enhances mental health and well-being, while alleviating depression, stress, and anxiety (44); physiologically, it improves cardiorespiratory fitness, increases muscle mass and strength, and enhances learning and memory capabilities (62). Current research indicates that a key challenge in promoting PA lies in the discrepancy between individual exercise intentions and actual behaviour—the intention-behaviour gap. Despite strong intentions to exercise, individuals often fail to implement corresponding behaviours due to various influencing factors (63). In this study, the high SHAP value for exercise adherence (emotional experience) at the individual level, alongside the significant contribution of exercise motivation (social) at the interpersonal-organisational level to the predictive model, reveals the crucial role of emotional experiences and social motivation in promoting exercise behaviour. According to the concept of self-efficacy within social cognitive theory (64), when individuals exercise, beyond the act of adherence itself, the ‘emotional value’ derived from this behaviour may also play a role. This ‘emotional value’ may include, but is not limited to, encouragement and praise from those around them, and the social attributes gained from finding friends to exercise with consistently (65). Previous research corroborates this, as evidenced by a 2021 study that demonstrated the significant influence of enjoyment and motivation on exercise adherence (66). Another study showed that perceived self-efficacy among exercisers positively impacts the fulfilment of fundamental psychological needs (67). Therefore, to promote exercise adherence among university students, enhance PA levels, and bridge the gap between exercise intention and behaviour, intervention strategies should be designed across different levels of the SEM. At the individual level, psychological counselling and emotional management training should be employed to strengthen students’ self-efficacy and motivation for exercise. At the interpersonal level, social mechanisms such as sports groups, physical education clubs, and recreational sports events should be utilised to enhance peer support and social motivation, thereby transforming positive emotional experiences into sustained exercise behaviour.
Sex emerged as the second most significant predictor of PA among university students. SHAP analysis revealed positive SHAP values for males and negative values for females, confirming that males were significantly more likely than females to meet PA standards (63.8% vs 28.9%), consistent with prior research findings (68). Although sex itself, as a physiological characteristic, is not amenable to intervention, the socio-cultural preferences and behavioural patterns it reflects warrant attention. Existing research demonstrates an inequality in PA between boys and girls, with girls typically engaging in less PA than boys (69, 70). This disparity is more pronounced in high-income countries and those with higher Human Development Index rankings (71). Further research indicates that sex disparities narrow during vigorous-intensity PA but widen during moderate-intensity PA (72). This may stem from girls’ greater participation in aerobic exercises of lower intensity (56), coupled with perceived deficiencies in physical stamina and motivation for athletic pursuits (73). Concurrently, this may relate to sex-role socialisation processes. Male tend to perceive PA as a means of demonstrating strength and competitiveness, making them more likely to choose challenging, high-intensity activities to assert their masculinity, thereby achieving higher levels of PA. Female conversely, may prioritise the social aspects of sport or appearance enhancement. A toolkit document on sex equality in sport, jointly developed by the European Union and the Council of Europe, further indicates that men are more likely to engage in sport or PA for recreation (33%), socialising with friends (22%), or enhancing physical performance (29%). Female, conversely, are more concerned with weight management (24%), improving appearance (21%), or counteracting the effects of ageing (15%) (74). Consequently, interventions addressing female university students’ sporting challenges may be implemented at both the organisational and policy levels within SEM. At the organisational level, improvements can be made by restructuring physical education curricula, offering diverse intensity levels and interest-based options, and enhancing campus sports environments and institutional arrangements. At the policy level, integrating sex equality metrics into campus sports assessment and management systems encourages institutions to foster sex-friendly sporting environments. Such interventions can diminish the singular focus on competitive outcomes, emphasising instead health, aesthetic appreciation, and social benefits, thereby increasing female students’ motivation and participation in PA.
The findings of this study further indicate that exercise motivation (ability), specifically ‘I exercise to improve my athletic skills,’ and the mastery of sports skills are also significant predictors of PA among university students. SHAP analysis revealed that both a high level of identification with competence-based exercise motivation and the mastery of more sports skills corresponded with positive SHAP values. Descriptive analysis showed that the rate of meeting PA standards was significantly higher among students who mastered two or more skills (52.4%) compared to those who mastered fewer skills (zero skills: 22.6%; one skill: 30.6%). Research indicates that the development of sports skill competence is a primary underlying mechanism promoting individual participation in PA (75), with greater mastery of sports skills facilitating increased engagement in PA. A long-term randomised controlled trial similarly found that students in the specialised sports skills training group demonstrated significantly superior PA levels and physical fitness compared to the general physical education class group (76). This may be achieved through two pathways: the self-efficacy pathway and the social support pathway. As suggested by self-efficacy theory (64) and social cognitive theory (77), university students’ PA behaviour is influenced not only by their own cognitive factors but also by their surrounding environment. When individuals master more sports skills, they are more likely to perform well in PA, which further enhances their willingness to participate and thereby increases their PA levels. Concurrently, students proficient in multiple sports skills are more likely to engage in diverse activities, such as combining endurance and strength training (62), thereby increasing their overall PA levels. In certain team sports, activities requiring cooperation (such as basketball or volleyball) can better promote communication and interaction among college students, enhance the fun of physical activity and social attributes (78, 79). Within the SEM framework, these interventions operate at both individual and organisational levels. At the individual level, self-efficacy and body confidence can be enhanced through skill training and feedback mechanisms. At the organisational level, institutional support, including curriculum design, sports resource allocation, and teacher guidance, provides students with a sustained environment for skill development. The synergistic effect of these approaches fosters a positive cycle, progressing from ‘capability enhancement’ to ‘behavioural adherence,’ thereby significantly elevating PA levels.
Beyond exercise adherence, the exercise motivation, and mastery of sports skills, this study also identified complex predictive role of alcohol consumption level on PA. SHAP analysis revealed moderate drinking was associated with positive SHAP values, whereas abstinence was linked to negative SHAP values. Descriptive data further indicated a higher proportion of ‘occasional drinkers’ in the meeting-the-guidelines group compared to the non-meeting-the-guidelines group (49.8% vs 50.2%). Overwhelming evidence shows that alcohol consumption and smoking inflict damage upon the body (80–85). Chronic alcohol consumption leads to alcohol dependence, a rewarding, chronic, recurrent disorder causing significant health harm (86) to the nervous system, liver, digestive system, immune system, and cardiovascular system (80). Smoking causes multiple fatal diseases, including lung Cancer, respiratory diseases, and cardiovascular diseases (such as coronary heart disease) (87). A cross-sectional study revealed synergistic effects between smoking and alcohol consumption, with both substances jointly damaging the liver (88). Consequently, reducing alcohol intake and smoking is crucial for maintaining university students’ physical health, while engaging in PA offers a potential solution to this issue. One study demonstrated a linear inverse relationship between PA levels and alcohol consumption: individuals who engage in more frequent PA consume less alcohol, whereas those with lower PA levels tend to consume relatively more (89). Another study indicates that individuals with higher levels of PA are less likely to smoke (90). These findings align with the present study, potentially suggesting that moderate PA may reduce excessive alcohol consumption level, though the complex relationship between the two warrants further investigation. Concurrently, regular moderate-to-vigorous physical exercise can counteract the adverse metabolic effects of alcohol consumption on liver function, inflammation, and lipid profiles (89). A potential mechanism may be that PA modulates reward systems and emotional states, thereby reducing alcohol intake driven by its rewarding properties and partially counteracting its adverse effects, thereby decreasing consumption (91). However, it should be noted that other studies have demonstrated a positive correlation between PA and alcohol consumption, with both intensity and duration of PA increasing alongside alcohol intake (92, 93). This aligns with the findings of the present study. A plausible explanation may be that moderate drinkers exhibit greater social engagement and extroverted traits, thereby facilitating participation in collective sporting activities. Some research has also indicated that social drinking may to some extent reflect an individual’s social activity levels and sense of group belonging (94), which corresponds with the social support mechanisms at the interpersonal level within the SEM. However, it is essential to distinguish the behavioural engagement effects of this ‘social drinking’ from the health risks associated with ‘physiological drinking’: the former may temporarily enhance social motivation and exercise participation, while the latter continues to increase negative health outcomes such as liver damage and metabolic disorders over the long term (95). Concurrently, negative SHAP values among abstainers do not imply abstinence itself is harmful. Rather, they may reflect social avoidance or psychologically conservative traits among some individuals in this group, indirectly reducing their opportunities for sports participation. This interpretation is supported by psychosocial research indicating that individuals with low social motivation or avoidant personality tendencies are more likely to exhibit concurrently low PA levels (96). This overlapping neurochemical effect may constitute a biological basis for the positive correlation between PA and alcohol consumption (97). From a SEM perspective, multi-level health promotion strategies can be designed to address drinking behaviour. At the individual level, health education and self-control training should be reinforced; at the interpersonal level, peer role models and social support can influence drinking behaviour; at the organisational level, campus health behaviour management systems should be improved; and at the community and policy levels, public health advocacy and institutional restrictions should be promoted. This approach fosters a supportive environment conducive to PA and healthy behaviour across multiple ecological systems.
The strength of this study lies in its analysis based on large-sample cross-sectional survey data, which innovatively employs machine learning techniques to elucidate the predictive mechanisms of PA among university students. Compared to traditional statistical methods, this approach more effectively captures the nonlinear relationships and interactions between variables. Integrating the SEM framework, the study systematically synthesised multidimensional measurement indicators encompassing personal characteristics, interpersonal interactions, and organisational environments. This established a multi-level predictive factor analysis system, providing multidimensional evidence to support the formulation of precise health intervention strategies. However, several research limitations should be noted. Firstly, the cross-sectional design imposes methodological constraints on revealing causal relationships between variables and capturing temporal dynamic evolution. These findings only indicate associations or predictions of factors. Secondly, the model accuracy in this study was approximately 70%, potentially attributable to: (1) measurement error in PA assessment: the use of a self-reported questionnaire (PARS-3) may introduce recall bias and social desirability bias, leading to inherent inaccuracies compared to objective measurement tools such as accelerometers; (2) Categorical imbalance: although the proportion of the meeting-the-standard group (44.5%) versus the not-meeting-the-standard group (55.5%) was not extremely skewed, this imbalance may still pose a minor challenge to the model’s ability to learn patterns in the minority category; (3) Unmeasured SEM’s factors: Given the study’s scope, the model primarily incorporated individual and interpersonal-organisational level variables, failing to encompass critical community and policy-level factors such as accessibility of campus sports facilities, curriculum design, and sports scholarship policies. This omission of built and policy environments may limit the model’s overall explanatory power and the systematic nature of intervention measures; (4) Sample and feature limitations: Despite the substantial overall sample size, certain subgroups exhibited relatively small sample sizes, and feature engineering may not have fully captured all complex nonlinear relationships predicting PA.
Future research may deepen exploration in this field through the following avenues: Firstly, employing longitudinal tracking designs and causal inference models to clarify causal pathways and temporal dynamics between predictive factors and PA. Secondly, constructing multi-level models integrating community and policy dimensions, systematically incorporating macro-level variables such as campus spatial environments, accessibility of sports resources, and local health policies to address the hierarchical gaps in the SEM used herein. Third, actively promote multi-source data integration. Beyond self-reported data, combine objective behavioural data such as accelerometer readings, smartphone sensor data, and campus card transaction records to capture PA patterns and contexts more precisely and comprehensively, thereby effectively reducing measurement errors inherent in single self-reporting sources. Fourthly, explore more advanced machine learning techniques to handle complex interaction effects, employing strategies such as oversampling to further optimise the model’s classification performance across categories. Through these measures, we aim to comprehensively elucidate the predictive mechanisms of PA among university students, thereby providing stronger evidence-based support for developing precise intervention strategies.
Conclusion
This study systematically identified key factors predicting PA levels among Chinese university students using a RF model. Exercise adherence and exercise motivation ranked highly within the model. Consequently, to effectively enhance students’ PA levels, interventions should prioritise improving exercise adherence, with particular emphasis on strengthening the “emotional value” and social attributes of PA. Designing engaging and socially interactive PA can effectively satisfy students’ intrinsic psychological needs, bridging the gap between exercise intent and actual behaviour. Concurrently, SHAP values clearly indicate that female identity correlates with lower attainment probabilities, necessitating targeted attention to female students’ barriers to PA participation. Interventions should strive to create more female-friendly sporting environments, de-emphasising purely competitive orientations in favour of highlighting the health, aesthetic, and social benefits of participation. Systematically training students in multiple sports skills represents another effective pathway. This recommendation is supported by two highly ranked factors: mastery of sports skills and ability-oriented exercise motivation. Enhancing sports skills not only directly boosts personal efficacy but also lays the foundation for engaging in diverse PA. Future health promotion efforts should closely align with these key predictive factors, designing multi-tiered, precision-targeted intervention strategies to effectively elevate PA levels among Chinese university students through data-driven approaches.
Data availability statement
The raw data supporting the conclusions of this article will be made available by the authors, without undue reservation.
Ethics statement
The studies involving humans were approved by Ethics Committee of Nantong University. The studies were conducted in accordance with the local legislation and institutional requirements. The participants provided their written informed consent to participate in this study. Written informed consent was obtained from the minor(s)’ legal guardian/next of kin for the publication of any potentially identifiable images or data included in this article.
Author contributions
D-yZ: Writing – original draft, Software, Funding acquisition, Investigation, Resources, Formal analysis, Writing – review & editing, Visualization, Methodology, Data curation, Project administration, Validation, Conceptualization, Supervision. HL: Project administration, Conceptualization, Methodology, Supervision, Writing – original draft, Writing – review & editing. JL: Data curation, Methodology, Conceptualization, Project administration, Writing – original draft, Supervision, Writing – review & editing. BL: Writing – original draft, Investigation, Validation, Writing – review & editing, Methodology, Data curation, Supervision, Project administration.
Funding
The author(s) declare that financial support was received for the research and/or publication of this article. This study was supported by the 2024 Postgraduate Research & Practice Innovation Program of Jiangsu Province (No: KYCX25_3617).
Acknowledgments
We sincerely thank all the staff and students from the participating schools and our co-operators for their assistance in data collection.
Conflict of interest
The authors declare that the research was conducted in the absence of any commercial or financial relationships that could be construed as a potential conflict of interest.
Generative AI statement
The author(s) declare that no Gen AI was used in the creation of this manuscript.
Any alternative text (alt text) provided alongside figures in this article has been generated by Frontiers with the support of artificial intelligence and reasonable efforts have been made to ensure accuracy, including review by the authors wherever possible. If you identify any issues, please contact us.
Publisher’s note
All claims expressed in this article are solely those of the authors and do not necessarily represent those of their affiliated organizations, or those of the publisher, the editors and the reviewers. Any product that may be evaluated in this article, or claim that may be made by its manufacturer, is not guaranteed or endorsed by the publisher.
References
1. Van Sluijs, EMF, Ekelund, U, Crochemore-Silva, I, Guthold, R, Ha, A, Lubans, D, et al. Physical activity behaviours in adolescence: current evidence and opportunities for intervention. Lancet. (2021) 398:429–42. doi: 10.1016/S0140-6736(21)01259-9
2. Bermejo-Cantarero, A, Sánchez-López, M, Álvarez-Bueno, C, Redondo-Tébar, A, García-Hermoso, A, and Martínez-Vizcaino, V. Are physical activity interventions effective in improving health-related quality of life in children and adolescents? A systematic review and meta-analysis. Sports Health. (2023) 16:877–85. doi: 10.1177/19417381231190885
3. Bull, FC, Al-Ansari, SS, Biddle, S, Borodulin, K, Buman, MP, Cardon, G, et al. World Health Organization 2020 Guidelines on Physical Activity and Sedentary Behaviour. Br. J. Sports Med. (2020) 54:1451–62. doi: 10.1136/bjsports-2020-102955
4. Strain, T, Flaxman, S, Guthold, R, Semenova, E, Cowan, M, Riley, LM, et al. National, regional, and global trends in insufficient physical activity among adults from 2000 to 2022: a pooled analysis of 507 population-based surveys with 7 million participants. Lancet Glob Health. (2024) 12:e1232–43. doi: 10.1016/S2214-109X(24)00150-5
5. Wang, X, Yang, X, Nasiruddin, NJBM, Wei, S, Dong, D, and Samsudin, SB. Social support and physical activity in college and university students: a meta-analysis. Health Educ Behav. (2024) 51:533–43. doi: 10.1177/10901981231216735
6. Argumedo, G, López y Taylor, JR, Ortiz Brunel, J, Gaytán-González, A, González-Casanova, I, González Villalobos, MF, et al. Results from the 2022 Mexican report card on physical activity for children and adolescents. Front Public Health. (2024) 11:1304719. doi: 10.3389/fpubh.2023.1304719
7. Hou, X, Weng, K, and Liu, J. Physical activity and health status of student groups and school intervention strategies. Chin Public Health. (2020) 36:980–4.
8. Wang, C, He, G, and Ji, G. A study on the relationship between physical activity and physical fitness of adolescents aged 12-14 in Beijing. Chinese School Physical Educ (Higher Educ). (2018) 5:81–5. doi: 10.11847/zgggws1122441
9. Zhang, H. The correlation between sleep quality, physical activity, and screen time among college students. J Jiaxing University. (2025) 37:121–8. Available at: https://link.cnki.net/urlid/33.1432.Z.20250305.1541.006
10. Ye, M, Zhai, X, Gu, Q, Huang, T, and Fan, X. The correlation between screen time, anxiety, and sleep quality in physical activity among college students in Shanghai. Chinese School Health. (2019) 40:1509–13. doi: 10.16835/j.cnki.1000-9817.2019.10.020
11. Zhang, T, Lee, J, Zhang, X, and Gu, X. Social-ecological factors predict college students’ physical activities and sedentary behavior. Sustainability. (2022) 14:12873. doi: 10.3390/su141912873
12. Towne, S, Ory, M, Smith, ML, Peres, S, Pickens, A, Mehta, R, et al. Accessing physical activity among young adults attending a university: the role of sex, race/ethnicity, technology use, and sleep. BMC Public Health. (2017) 17:721. doi: 10.1186/s12889-017-4757-y
13. Ge, Y, Xin, S, Luan, D, Zou, Z, Bai, X, Liu, M, et al. Independent and combined associations between screen time and physical activity and perceived stress among college students. Addict Behav. (2019) 103:106224. doi: 10.1016/j.addbeh.2019.106224
14. Bronfenbrenner, U. Toward an experimental ecology of human development. Am Psychol. (1977) 32:513–31. doi: 10.1037//0003-066X.32.7.513
15. McLeroy, KR, Bibeau, D, Steckler, A, and Glanz, K. An ecological perspective on health promotion programs. Health Educ Q. (1988) 15:351–77.
16. Hutcheson, AK, editor. Occupational sedentary behavior:Application of the social ecological model. Tuscaloosa: The University of Alabama (2017).
17. Manuel, S, editor. Changes in beliefs about aggression in Baton Rouge youth peace Olympics participants. Minnesota: Walden University. (2018).
18. Ewald, DR, Orsini, MM, and Strack, RW. The path to good health: shifting the dialogue and promoting social ecological thinking. SSM - Population Health. (2023) 22:101378. doi: 10.1016/j.ssmph.2023.101378
19. Langille, J-LD, and Rodgers, WM. Exploring the influence of a social ecological model on school-based physical activity. Health Educ Behav. (2010) 37:879–94. doi: 10.1177/1090198110367877
20. Golden, SD, McLeroy, KR, Green, LW, Earp, JAL, and Lieberman, LD. Upending the social ecological model to guide health promotion efforts toward policy and environmental change. Health Educ Behav. (2015) 42:8S. doi: 10.1177/1090198115575098
21. Wang, B, Tang, C, and Zhang, Q. The main changes, target orientation, and practical direction of the National Physical Fitness Testing Standards (revised in 2023). Sports J. (2024) 31:147–52. doi: 10.16237/j.cnki.cn44-1404/g8.2024.03.011
22. Wang, X, Yang, L, and Wang, X. Research on the evaluation model of teaching ability of university public physical education teachers based on multiple machine learning algorithms. J Chengdu Institute Technol. (2025) 28:88–92+116. doi: 10.13542/j.cnki.51-1747/tn.2025.02.015
23. Xie, B. The integration of machine learning and tennis teaching in vocational colleges: design and application of intelligent auxiliary training system. Tennis World. (2024) 6:58–60. Available at: https://kns.cnki.net/kcms2/article/abstract?v=0eC8MkjONMGzN98h39FwcdmDRSpXgLVqQYFMgx0QpVzc1-4GOp7URzvdEwlOIgIdwTQkAoZ59fKskO9PboXyS6BicTw9kO57ljP7sST1I3fa2Xt_IA7pxeSXJYmgb3HlE6KP1dcFnez29X3f2x8MKhQYLjofb_Bf266BuyJ5zUB63RQRQxSPxSYkElql_zrw&uniplatform=NZKPT&language=CHS
24. Zeyu, H. Machine learning based data mining of NBA sports events and analysis of comprehensive competitive level characteristics [dissertation]: University of Shanxi (2024).
25. Guan Xin, A Sports lottery sales prediction system based on machine learning [dissertation]: Beijing University of Posts and Telecommunications (2024).
26. Wang, J. Prediction and analysis of college physical education grades based on machine learning. Modern Electronic Technol. (2017) 40:116–9. doi: 10.16652/j.issn.1004-373x.2017.17.030
27. Pan, T. An improved Apriori algorithm for association mining between physical fitness indices of college students. Int J Emerg Technol Learn. (2021) 16:235–46. doi: 10.3991/ijet.v16i09.22747
28. Peduzzi, P, Concato, J, Kemper, E, Holford, TR, and Feinstein, AR. A simulation study of the number of events per variable in logistic regression analysis. J Clin Epidemiol. (1996) 49:1373–9.
29. Liang, D. Stress level of college students and its relationship with physical exercise. Chin J Ment Health. (1994) 8:2.
30. Lee, Y, and Park, S. Understanding of physical activity in social ecological perspective: application of multilevel model. Front Psychol. (2021) 12:622929. doi: 10.3389/fpsyg.2021.622929
31. Eime, RM, Young, JA, Harvey, JT, Charity, MJ, and Payne, WR. A systematic review of the psychological and social benefits of participation in sport for adults: informing development of a conceptual model of health through sport. Int J Behav Nutr Phys Act. (2013) 10:14. doi: 10.1186/1479-5868-10-98
32. Budzynski-Seymour, E, Conway, R, Wade, M, Lucas, A, Jones, M, and Mann, S. Physical activity, mental and personal well-being, social isolation, and perceptions of academic attainment and employability in university students: the Scottish and British active students surveys. J Phys Act Health. (2020) 17:610–20. doi: 10.1123/jpah.2019-0431
33. Molcho, M, Gavin, A, and Goodwin, D. Levels of physical activity and mental health in adolescents in Ireland. Int J Environ Res Public Health. (2021) 18:1713. doi: 10.3390/ijerph18041713
34. Varoquaux, G, and Colliot, O. Evaluating machine learning models and their diagnostic value In: O Colliot, editor. Machine learning for brain disorders. New York, NY: Springer US (2023). 601–30.
35. Chan, JY, Leow, SM, Bea, KT, Cheng, WK, Phoong, SW, Hong, Z-W, et al. Mitigating the multicollinearity problem and its machine learning approach: a review. Mathematics. (2022) 10:1–17. doi: 10.3390/math10081283
36. Bishnoi, S, Al-Ansari, N, Khan, M, Heddam, S, and Malik, A. Classification of cotton genotypes with mixed continuous and categorical variables: application of machine learning models. Sustainability. (2022) 14:13685. doi: 10.3390/su142013685
37. Lundberg, SM, and Lee, S-I. A unified approach to interpreting model predictions. Proceedings of the 31st International Conference on Neural Information Processing Systems; Long Beach, California, USA: Curran Associates Inc. (2017). 4768–77. doi: 10.48550/arXiv.1705.07874
38. Maalouf, M. Logistic regression in data analysis: an overview. Int J Data Analysis Techniques Strategies. (2011) 3:281–99. doi: 10.1504/IJDATS.2011.041335
39. Bolton, C. Logistic regression and its application in credit scoring. South Africa: University of Pretoria (2009).
40. Shipe, ME, Deppen, SA, Farjah, F, and Grogan, EL. Developing prediction models for clinical use using logistic regression: an overview. J Thorac Dis. (2019) 11:S574–84. doi: 10.21037/jtd.2019.01.25
41. Yilmaz, KG, and Belbag, S. Prediction of consumer behavior regarding purchasing remanufactured products: a logistics regression model. Int J Bus Soc Res. (2016) 6:1. doi: 10.18533/IJBSR.V6I2.923
43. Iranzad, R, and Liu, X. A review of random forest-based feature selection methods for data science education and applications. Int J Data Sci Anal. (2025) 20:197–211. doi: 10.1007/s41060-024-00509-w
44. Wijaya, A. Y., Fatichah, C., and Saikhu, A.. “Prediction of stock trend using random Forest optimization.” 2023 international conference on advanced mechatronics, intelligent manufacture and industrial automation (ICAMIMIA) (2023):1–6.
45. Rasheed, S, Kumar, K, Rani, D, Kantipudi, MP, and M, A. Heart disease prediction using gridsearchcv and random forest. EAI Endorsed Trans Pervasive Health Technol. (2024) 10:5523. doi: 10.4108/eetpht.10.5523
46. Kukreti, S, Al-Attabi, K, Chandrashekar, R, Rani, K, Badhoutiya, A, Boob, N, et al. “Enhancing disease prediction through random forests in healthcare analytics.” (2024) 7th international conference on contemporary computing and informatics (IC3I) (2024) 7:1693–1699.
47. Cafri, G, Li, L, Paxton, E, and Fan, J. Predicting risk for adverse health events using random forest. J Appl Stat. (2018) 45:2279–94. doi: 10.1080/02664763.2017.1414166
48. Li, M, Wang, L, Wang, Y, and Chen, Z. Sizing optimization and energy management strategy for hybrid energy storage system using multiobjective optimization and random forests. IEEE Trans Power Electron. (2021) 36:11421–30. doi: 10.1109/TPEL.2021.3070393
49. Elkari, B, Chaibi, Y, and Kousksou, T. Random forest with feature selection and K-fold cross validation for predicting the electrical and thermal efficiencies of air based photovoltaic-thermal systems. Energy Rep. (2024) 12:988–99. doi: 10.1016/j.egyr.2024.07.002
50. Xu, Q, and Yin, J. Application of random forest algorithm in physical education. Sci Program. (2021) 2021:1996904. doi: 10.1155/2021/1996904
51. Sheng, Y, Liu, C, Yi, Q, Ouyang, W, Wang, R, and Chen, P. Predicting badminton outcomes through machine learning and technical action frequencies. Sci Rep. (2025) 15:10575. doi: 10.1038/s41598-025-87610-7
52. Kasera, M, and Johari, R. Prediction using machine learning in sports: A case study. Data analytics and management: Proceedings of Icdam. Singapore: Springer. (2021). p. 805–813.
53. Wang, C. Optimization of sports effect evaluation technology from random Forest algorithm and elastic network algorithm. PLoS One. (2023) 18:e0292557. doi: 10.1371/journal.pone.0292557
54. Chen, T, and Guestrin, C. “Xgboost: A scalable tree boosting system.” Proceedings of the 22nd ACM SIGKDD international conference on knowledge discovery and data mining; San Francisco, California, USA: Association for Computing Machinery (2016). p. 785–794.
55. Ke, G, Meng, Q, Finley, T, Wang, T, Chen, W, Ma, W, et al. Lightgbm: A highly efficient gradient boosting decision tree. Proceedings of the 31st International Conference on Neural Information Processing Systems; Long Beach, California, USA: Curran Associates Inc. (2017). 3149–57.
56. Chen, S, Park, C, Guo, Q, and Sun, Y. Advancing a major us airline’s practice in flight-level checked baggage prediction. Intelligent Transportation Infrastructure. (2024) 3:liae001. doi: 10.1093/iti/liae001
57. Cohen, J. Statistical Power Analysis for the Behavioral Sciences (2nd Ed.). New York: Routledge (1988).
58. Cramér, H. Mathematical methods of statistics. Department of Mathematical SU. Princeton. (1946).
59. Bergstra, J, and Bengio, Y. Random search for hyper-parameter optimization. J Mach Learn Res. (2012) 13:281–305. doi: 10.1016/j.chemolab.2011.12.002
60. Kohavi, R. A study of cross-validation and bootstrap for accuracy estimation and model selection. Montreal, Canada: Montreal (1995).
61. Kovács, KE, and Szakál, Z. Factors influencing sport persistence still represent a knowledge gap – the experience of a systematic review. BMC Psychology. (2024) 12:584. doi: 10.1186/s40359-024-02098-6
62. Jie, S, Fu, A, Wang, C, and Rajabi, S. A comprehensive review on the impact of polyphenol supplementation and exercise on depression and brain function parameters. Behav Brain Funct. (2025) 21:10. doi: 10.1186/s12993-025-00273-2
63. Englert, C, Rebar, A, Rhodes, RE, and Pfeffer, I. New developments in the intention-behavior gap for physical activity–recent trends, controversies, and a critical outlook. Front Psychol. (2023) 14:1119973. doi: 10.3389/fpsyg.2023.1119973
64. Bandura, A. Self-efficacy: toward a unifying theory of Behavioral change. Psychol Rev. (1977) 84:191–215.
65. Tian, Y, and Shi, Z. The relationship between social support and exercise adherence among Chinese college students during the Covid-19 pandemic: the mediating effects of subjective exercise experience and commitment. Int J Environ Res Public Health. (2022) 19:11827. doi: 10.3390/ijerph191811827
66. Rodrigues, F, Teixeira, D, Macedo, R, Neiva, H, Cid, L, and Monteiro, D. The role of enjoyment and motivational determinants in persistence in the practice of physical exercise. Ciênc Saúde Colet. (2021) 26:5303–13. doi: 10.1590/1413-812320212611.3.01832020
67. Rodrigues, F, Bento, T, Cid, L, Neiva, HP, and Monteiro, D. Can interpersonal behavior influence the persistence and adherence to physical exercise practice in adults? A systematic review. Front Psychol. (2018) 9:2141. doi: 10.3389/fpsyg.2018.02141
68. Jiang, W, Luo, J, and Guan, H. Gender difference in the relationship of physical activity and subjective happiness among Chinese university students. Front Psychol. (2021) 12:12. doi: 10.3389/fpsyg.2021.800515
69. Moreno-Llamas, A, Jesús, G-M, and De la Ernesto, CS. Gender inequality is associated with gender differences and women participation in physical activity. J Public Health. (2021) 44:e519–26. doi: 10.1093/pubmed/fdab354
70. Sáez, I, Solabarrieta, J, and Rubio, I. Motivation for physical activity in university students and its relation with gender, amount of activities, and sport satisfaction. Sustainability. (2021) 13:3183. doi: 10.3390/SU13063183
71. Ricardo, L, Wendt, A, Costa, C, Mielke, G, Brazo-Sayavera, J, Khan, A, et al. Gender inequalities in physical activity among adolescents from 64 global south countries. J Sport Health Sci. (2022) 11:509–20. doi: 10.1016/j.jshs.2022.01.007
72. Owen, KB, Corbett, L, Ding, D, Eime, R, and Bauman, A. Gender differences in physical activity and sport participation in adults across 28 European countries between 2005 and 2022. Ann Epidemiol. (2025) 101:52–7. doi: 10.1016/j.annepidem.2024.12.011
73. Rosselli, M, Ermini, E, Tosi, B, Boddi, M, Stefani, L, Toncelli, L, et al. Gender differences in barriers to physical activity among adolescents. Nutr Metab Cardiovasc Dis. (2020) 30:1582–9. doi: 10.1016/j.numecd.2020.05.005
74. European Commission CoE. All in: towards gender balance in sport (2019). Available online at: https://www.sportanddev.org/sites/default/files/downloads/toolkit_gender_equal_sports-web.pdf (Accessed September 6, 2019).
75. Stodden, DF, Ann, RM, and Clersida, G. A developmental perspective on the role of motor skill competence in physical activity: an emergent relationship. Quest. (2008) 60:290–306. doi: 10.1080/00336297.2008.10483582
76. Ke, Y, Bao, M, Qu, X, Yan, Y, Li, L, and Wang, Y. The effect of diverse sports skills interventions on physical fitness and brain development among Chinese high school students: A cluster randomized controlled trial study protocol. Trials. (2025) 26:102. doi: 10.1186/s13063-025-08788-9
78. Mcewan, D, Shah, EJ, Crawford, KL, Jackman, PC, Hoffmann, MD, Cardinal, E, et al. The psychometric properties of two brief measures of teamwork in sport. J Sport Exercise Psychol. (2023) 45:325–36. doi: 10.1123/jsep.2023-0147
79. Chi, G, and Wang, L. The Association of Sports Participation with depressive symptoms and anxiety disorder in adolescents. Front Public Health. (2022) 10:860994. doi: 10.3389/fpubh.2022.860994
80. Varghese, J, and Dakhode, S. Effects of alcohol consumption on various Systems of the Human Body: A systematic review. Cureus. (2022) 14:e30057. doi: 10.7759/cureus.30057
81. Zahr, NM, and Pfefferbaum, A. Alcohol's effects on the brain: neuroimaging results in humans and animal models. Alcohol Res Curr Rev. (2017) 38:183–206. doi: 10.35946/arcr.v38.2.04
82. Renu, K, Myakala, H, Chakraborty, R, Bhattacharya, S, Abuwani, A, and Lokhandwala, M. Molecular mechanisms of alcohol's effects on the human body: A review and update. J Biochem Mol Toxicol. (2023) 37:e23502. doi: 10.1002/jbt.23502
83. Danpanichkul, P, and Wijarnpreecha, K. Implementing public health policy to tackle alcohol-related harms. Lancet Public Health. (2025) 10:e350–1. doi: 10.1016/S2468-2667(25)00048-9
84. Varghese, J, and Muntode Gharde, P. A comprehensive review on the impacts of smoking on the health of an individual. Cureus. (2023) 15:e46532. doi: 10.7759/cureus.46532
85. Dai, X, Gil, GF, Reitsma, MB, Ahmad, NS, Anderson, JA, and Bisignano, C. Health effects associated with smoking: A burden of proof study. Nat Med. (2022) 28:2045–55. doi: 10.1038/s41591-022-01978-x
86. Gilpin, NW, and Koob, GF. Neurobiology of alcohol dependence: focus on motivational mechanisms. Alcohol Res Health. (2008) 31:185–95. doi: 10.1093/alcalc/agm142
87. West, R. Tobacco smoking: health impact, prevalence, correlates and interventions. Psychol Health. (2017) 32:1018–36. doi: 10.1080/08870446.2017.1325890
88. Park, EY, Lim, MK, Oh, J-K, Cho, H, Bae, MJ, and Yun, EH. Independent and supra-additive effects of alcohol consumption, cigarette smoking, and metabolic syndrome on the elevation of serum liver enzyme levels. PLoS One. (2013) 8:e63439. doi: 10.1371/journal.pone.0063439
89. Niemelä, O, Bloigu, A, Bloigu, R, Halkola, AS, Niemelä, M, and Aalto, M. Impact of physical activity on the characteristics and metabolic consequences of alcohol consumption: A cross-sectional population-based study. Int J Environ Res Public Health. (2022) 19:15048. doi: 10.3390/ijerph192215048
90. Acar, Z, Jackson, S, Klosterhalfen, S, and Kotz, D. Physical activity and tobacco smoking in the German adult population. BMJ Open Sport Exerc Med. (2024) 10:e002087. doi: 10.1136/bmjsem-2024-002087
91. Castejón, E, Fuentes-Verdugo, E, Pellón, R, and Torres, C. Physical activity reduces alcohol consumption induced by reward downshift. Exp Clin Psychopharmacol. (2023) 31:404–13. doi: 10.1037/pha0000587
92. Henderson, CE, Najjar, LZ, Young, CM, Leasure, JL, Neighbors, C, and Gasser, ML. Longitudinal relations between physical activity and alcohol consumption among Young adults. Psychol Addict Behav. (2023) 37:285–93. doi: 10.1037/adb0000807
93. Musselman, JRB, and Rutledge, PC. The incongruous alcohol-activity association: physical activity and alcohol consumption in college students. Psychol Sport Exerc. (2010) 11:609–18. doi: 10.1016/j.psychsport.2010.07.005
94. Kelly, S, Olanrewaju, O, Cowan, A, Brayne, C, and Lafortune, L. Alcohol and older people: A systematic review of barriers, facilitators and context of drinking in older people and implications for intervention design. PLoS One. (2018) 13:e0191189. doi: 10.1371/journal.pone.0191189
95. Liang, J, and Olsen, RW. Alcohol use disorders and current pharmacological therapies: the role of Gabaa receptors. Acta Pharmacol Sin. (2014) 35:981–93. doi: 10.1038/aps.2014.50
96. Vancampfort, D, Stubbs, B, Sienaert, P, Wyckaert, S, De Hert, M, Rosenbaum, S, et al. What are the factors that influence physical activity participation in individuals with depression? A review of physical activity correlates from 59 studies. Psychiatr Danub. (2015) 27:210–24. Available at: https://hrcak.srce.hr/file/239429
Keywords: university students, machine learning, random forest, physical activity, socio-ecological model
Citation: Zhang D-y, Lou H, Liu J and Li B (2025) Random forest-based identification and ranking of predictive factors for physical activity in Chinese college students. Front. Public Health. 13:1699606. doi: 10.3389/fpubh.2025.1699606
Edited by:
Francisco Javier Huertas-Delgado, University of Granada, SpainReviewed by:
Bangbang Syamsudar, STKIP PASUNDAN, IndonesiaSeungbak Lee, State University of New York at Fredonia, United States
Copyright © 2025 Zhang, Lou, Liu and Li. This is an open-access article distributed under the terms of the Creative Commons Attribution License (CC BY). The use, distribution or reproduction in other forums is permitted, provided the original author(s) and the copyright owner(s) are credited and that the original publication in this journal is cited, in accordance with accepted academic practice. No use, distribution or reproduction is permitted which does not comply with these terms.
*Correspondence: Jun Liu, emR5OTc3NDY0OUBxcS5jb20=; Bo Li, d2FuZ3FpdWxpYm9AMTYzLmNvbQ==