 Cecilia Llobet1
 Montserrat Martinez-Alonso
 Oriol Yuguero
- 1ERLab, Research on Emergencies, Biomedical Research Institute of Lleida (IRBLLEIDA), Lleida, Spain
- 2Systems Biology and Statistical Methods for Biomedical Research Group, Institute for Biomedical Research Dr. Pifarré Foundation, IRBLLEIDA, Lleida, Spain
- 3Faculty of Medicine, University of Lleida, Lleida, Spain
Background: Epilepsy, a chronic neurological disorder affecting more than 65 million people worldwide, is characterized by recurrent seizures caused by abnormal neuronal discharges. Beyond its diverse etiologies, growing evidence suggests that environmental and meteorological factors, including air pollution, may influence seizure occurrence.
Objective: To evaluate the association between meteorological variables, air pollutants, and hospital admissions for seizures in the province of Lleida (Spain) over a 10-year period (2010–2019).
Methods: Daily hospital admissions for seizures (ICD-10 code G40) were analyzed together with meteorological variables (temperature, atmospheric pressure, humidity, precipitation, and solar irradiation) and air pollutants (NO2, PM10, CO, O3, and SO2). Distributed lag non-linear models (DLNM) with quasi-Poisson regression were applied to estimate exposure–response relationships and delayed effects, adjusting for long-term trends, seasonality, and day of the week.
Results: A total of 4,755 seizure-related admissions were recorded, representing 0.52% of all emergency visits. The frequency of seizures increased during colder months and periods of poor air quality. Low daily mean temperatures (<2.5th percentile) and high NO2 concentrations (>99th percentile) were both significantly associated with higher seizure risk (up to +40% and +42% relative risk, respectively; p < 0.05). The association with NO2 remained significant after adjusting for temperature.
Conclusion: Cold temperatures and elevated NO2 levels are independently associated with an increased number of seizure-related emergency admissions. These findings highlight the potential neurological impact of air pollution and extreme weather, emphasizing the need for preventive public health measures and further research to clarify the underlying mechanisms.
Background
Although the prevalence of epilepsy may appear moderate, its impact on patients’ quality of life is substantial, affecting education, employment, social relationships, and mental well-being (1). Epilepsy is a chronic, severe, and frequent neurological disorder that affects approximately 65 million people worldwide (2). It encompasses a group of diseases characterized by abnormal electrical discharges in the brain, resulting in sudden and recurrent seizures that may involve loss of consciousness, motor convulsions, and other neurological symptoms. These episodes can lead to significant morbidity, injuries, and even mortality, severely compromising quality of life (3).
The etiology of epilepsy is highly heterogeneous, including causes such as stroke, traumatic brain injury, tumors, genetic alterations, infections, metabolic disturbances, and autoimmune or immune-mediated conditions. However, numerous intrinsic and extrinsic factors may precipitate seizures in predisposed individuals. Among these, alcohol consumption, illicit drug use, sleep deprivation, stress, and environmental or meteorological changes have been identified as relevant triggers (4). In Spain, approximately 500,000 people live with epilepsy, and nearly 20,000 new cases are diagnosed each year, mainly among children and adults over 65 years old (5). Seizures account for between 1 and 3% of all emergency department (ED) admissions and up to 20% of urgent neurological consultations according to the Spanish Society of Neurology (SEN) (6). Clinicians frequently report temporal increases in seizure-related admissions, which some patients associate with seasonal or climatic variations.
The onset of seizures is determined by the interplay between intrinsic factors—such as the etiology of epilepsy, genetic background, and physiological state—and extrinsic factors, including medications, sleep patterns, and environmental exposures (7). Weather conditions exert a measurable influence on multiple physiological systems, and a growing body of evidence suggests that meteorological factors may modulate seizure occurrence (8). Previous studies have linked variations in atmospheric temperature, barometric pressure, humidity, and sunlight exposure to fluctuations in seizure frequency (9). Previous studies have linked epilepsy to climatic factors such as atmospheric temperature, atmospheric pressure, precipitation, and exposure to sunlight (10).
At the biological level, several mechanisms have been proposed to explain how external triggers might influence neuronal excitability. Psychoactive substance use can lower the seizure threshold by disrupting neurotransmitter balance (11). Stress and sleep deprivation induce neuroinflammatory responses and hormonal changes, such as elevated cortisol levels, that enhance neuronal hyperexcitability (12). Furthermore, transient receptor potential (TRP) ion channels expressed in the brain are sensitive to thermal variations and may directly modulate seizure susceptibility through temperature-dependent changes in neuronal firing (13). Poor housing conditions or inadequate insulation may expose individuals to temperature extremes or indoor pollution, indirectly influencing seizure occurrence (14).
In certain geographical areas, where there are significant variations in temperature and humidity throughout the year, these can directly influence the health of the inhabitants, especially those who are vulnerable to specific environmental factors, such as people with epilepsy or those who have experienced seizures (15).
Recent research has expanded the focus from meteorological conditions to air pollution, particularly fine particulate matter (PM2.5 and PM10). Epidemiological evidence consistently links PM2.5 exposure to respiratory, cardiovascular, and neurological diseases (16). Fine particles can penetrate deep into the respiratory system, cross biological barriers, and induce oxidative stress, inflammation, and immune dysregulation, promoting the release of cytokines such as IL-4, IL-6, IL-13, TNF-α, IL-17, and IFN-γ (17). PM2.5-bound chemical components exhibit enhanced toxicity and may disrupt gene expression through non-coding RNA mechanisms, amplifying neuroinflammatory and neurotoxic effects (17). However, most previous studies have focused on identifying pollution sources rather than characterizing direct health consequences, and the neurological impact of air pollution—particularly regarding seizure occurrence—remains underexplored.
Importantly, ambient particulate matter rarely exists in isolation. It commonly interacts with other pollutants such as nitrogen dioxide (NO2) and ozone (O3), which may potentiate each other’s effects on the respiratory, cardiovascular, and nervous systems. Understanding these synergistic interactions is essential for evaluating the cumulative burden of environmental exposures on neurological health.
In regions characterized by pronounced climatic variability, such as the province of Lleida in northeastern Spain, the combined influence of meteorological and air pollution factors on health outcomes may be especially relevant. Therefore, the objective of this study was to analyze the association between weather conditions, air pollutants, and seizure-related emergency department admissions over a 10-year period (2010–2019) in a population exposed to diverse environmental conditions.
Methods
Setting
Data on hospital admissions, meteorological variables, and air pollutants for the Spanish province of Lleida were collected for the period 2010–2019.
Lleida is a province with a population of approximately 0.44 million. Its capital, also named Lleida, accounts for about 32% of the provincial population, while the surrounding health region represents nearly 83% of the total population. According to the Köppen Climate Classification, the southern part of the province (including the capital) has a cold semi-arid climate (BSk), whereas the northern mountainous areas are characterized by temperate climates without dry seasons (Cfa–Cfb) and colder, wetter conditions in the Pyrenean region (Dfb–Dfc).
Data
Daily hospital admissions for seizures were obtained from the Conjunto Mínimo Básico de Datos (CMBD), the mandatory national hospital discharge registry maintained by the Spanish Ministry of Health. The CMBD includes data from all public hospitals since 1997 and from private hospitals since 2016.
Cases were identified using the ICD-10-CM codes G40 (epilepsy and recurrent seizures), which encompass the majority of epileptic and seizure-related hospitalizations. Admissions coded as R56 (febrile convulsions) were excluded to minimize potential misclassification of acute, non-epileptic events. Nevertheless, the use of administrative data may still include a small proportion of cases related to non-epileptic events such as syncope or other causes of transient loss of consciousness (LOC).
The dataset did not include detailed clinical information, such as etiology or prior epilepsy diagnosis, and thus it was not possible to distinguish between acute symptomatic and unprovoked seizures. Data were accessed for research purposes between 15 July 2022 and 25 September 2022.
Meteorological and air pollution variables
Meteorological data included daily (24-h) mean, minimum, and maximum values for temperature, relative humidity, and atmospheric pressure, as well as daily accumulated precipitation, global solar irradiation, and mean and maximum wind speed (measured at 2 meters height). These data were obtained from the Meteorological Service of Catalonia, using four automatic weather stations located in the province. The mean of these stations was computed as representative of the population-weighted average for the region, given the concentration of inhabitants in the capital area. We used air pollution data from a single monitoring station, which is the only station in the province that measures NO and NO2. In contrast, meteorological data were obtained from four different weather stations distributed across the region. That data was obtained in January 2023. Air pollution data were obtained from the Catalonian Air Pollution Monitoring and Forecasting Network (XVPCA). Measurements included daily means and maxima for NOx, NO, NO2, SO2, PM10, and O3, as well as the 8-h moving average for CO and O3. Because only one monitoring station in the province measures nitrogen oxides (NO and NO2), these data were used as reference for the entire study area.
European Air Quality Index thresholds were used to classify poor air quality: CO (10 mg/m3/h), NO2 (120 μg/m3/h), O3 (130 μg/m3/h), PM10 (24-h mean of 50 μg/m3), and SO2 (350 μg/m3/h).
Statistical analysis
We summarized all the exposure and response variables with mean, standard deviation, coefficient of variation, median, interquartile range (IQR), quartile coefficient of dispersion (IQR divided by the sum of quartile 1st and 3rd) and maximum. For temperature measures, the coefficient of variation as well as the quartile coefficient of dispersion were computed in Kelvin units (1 K = 1C° + 273.15). For the pollution variables, the number of days with poor air quality due to each pollutant was also reported.
We used distributed lag non-linear models (DLNM) to estimate the relationship between hospital admissions caused by seizures and the exposure variables of weather and pollution in order to capture possible delayed effects. We fitted a time-series Quasi-Poisson regression model in which the exposure-response association was modeled using a quadratic B-spline with 3 internal knots placed at the 10th, 50th and 90th percentiles of location-specific exposure distribution. Each model took into account seasonality by including a natural cubic spline of the day of the year with 4 degrees of freedom and an interaction between this spline function and the indicator of year to relax the assumption of a constant seasonal trend. Long-term trends were controlled by including a linear term for the day of the study period. In addition, we included indicator variables for the day of the week and holidays. The lag-response association was modeled by a natural cubic spline with an intercept and three internal knots placed at equally spaced values in the log scale. To explore possible short as well as long delays in the effects of exposure variables, the lag period was tested at 3, 7 and extended up to 21 days to capture long lags related to weather or pollution variables. Moreover, we report the estimated relative effect by using the lag providing the minimum AIC.
The results were aggregated over all lags to obtain the overall exposure-response association curves. And were reported as relative risks in reference to the percentile of minimum hospitalizations (minY) estimated from each curve. This minY was replaced by the median or 50th percentile for minY values below 20th or above 80th percentile. These estimated exposure-response curves were used to quantify the percent relative effect of very extreme exposure values, defined as percentiles 1, 2.5, 97.5 and 99.
In case of significant associations with both weather and pollution variables, we used DLNM to assess if, once adjusted by the weather variable inside the model through natural splines with 4 degrees of freedom, the exposure to the pollutant keeps its significant association with hospital emergency room admissions. Although the models accounted for temporal confounders such as seasonality, long-term trends, day of the week, and public holidays, individual-level confounders (e.g., medication use, comorbidities, socioeconomic factors, or lifestyle habits) could not be included in the analysis because such information was not available in the CMBD dataset. Nevertheless, the time-series design inherently controls for stable population characteristics and slowly varying individual factors, reducing the likelihood of major confounding bias.
All analyses were performed with R software (18). The package DLNM was used (19). As stated by Gaspirrini, DLNMs is a “modelling framework to describe simultaneously non-linear and delayed effects of predictors and an outcome, a dependency defined as exposure-lag-response association.” In comparison with traditional time-series regression, DLNMs captures delayed (lagged) possible effects from environmental exposures more flexibly, allowing for non-linear relationships in both dimensions (exposure-response and lag-response). Since environmental exposures (air pollutants and weather) can show non-linear (J or U-shaped) possible effects on health, DLNMs is the best applicable methodology to answer to ours aims with a data-driven model, without having assumed any form of relationship.
Ethics
The project was approved by the Research Committee of Lleida with ID 2323. All the research was conducted following Helsinki Declaration. All data was handled according to current European legislation. The researcher accessed it for research purposes on the 13th of September, 2022. The authors had no access to information that could identify individual participants during or after data collection. The research committee waived the requirement for informed consent.
Results
A total of 4,755 hospital emergency admissions for seizures were recorded from 2010 to 2019, representing 0.52% of all 908,003 emergency visits. Annual counts ranged from 117 to 667. The daily number of seizure-related admissions had a mean of 1.3 (median 1; range 0–11), while the monthly cumulative count had a mean of 39.6 (median 40; range 0–78). The highest median monthly admissions occurred in January (Figure 1).

Figure 1. Distribution of hospital emergency room admissions for seizures per month, 2010–2019.
Among meteorological variables, daily cumulative precipitation was the most variable during the study period (coefficient of variation = 3.9; mean = 1.0 mm; median = 0 mm) (Table 1). In contrast, the 24 h mean temperature showed low variability (CV = 0.03; mean = 14 °C).

Table 1. Descriptive summary.
Among pollutants, the most variable was the 24 h maximum concentration of nitrogen monoxide (NO) (CV = 1.3), more than twice the variability observed for the 24 h maximum of nitrogen dioxide (NO2), daily mean PM10, or the maximum 8 h moving average of ozone (O3), which had CVs of 0.54, 0.52, and 0.45, respectively. The mean concentrations of these pollutants were 37 μg/m3 for NO, 51 μg/m3 for NO2, 24 μg/m3 for PM10, and 70 μg/m3 for O3.
The concentrations of CO and SO2 did not exceed poor-air-quality thresholds on any day during the study period, whereas NO2, O3, and PM10 did. Poor air quality was recorded on 326 days (8.9%) over the 10 years. Specifically, the PM10 limit was exceeded on 158 days, O3 on 143 days, and NO2 on 76 days; 43 days showed simultaneous exceedance of PM10 and NO2, and 8 days for PM10 and O3.
The monthly distributions of meteorological and air pollution variables are shown in Figures 2, 3, respectively. As illustrated in Figure 1, seizure-related admissions followed a convex seasonal pattern, with peaks in the coldest months—those with lower temperatures and solar irradiation, higher relative humidity and atmospheric pressure, and more days with poor air quality driven by elevated NO2 concentrations.
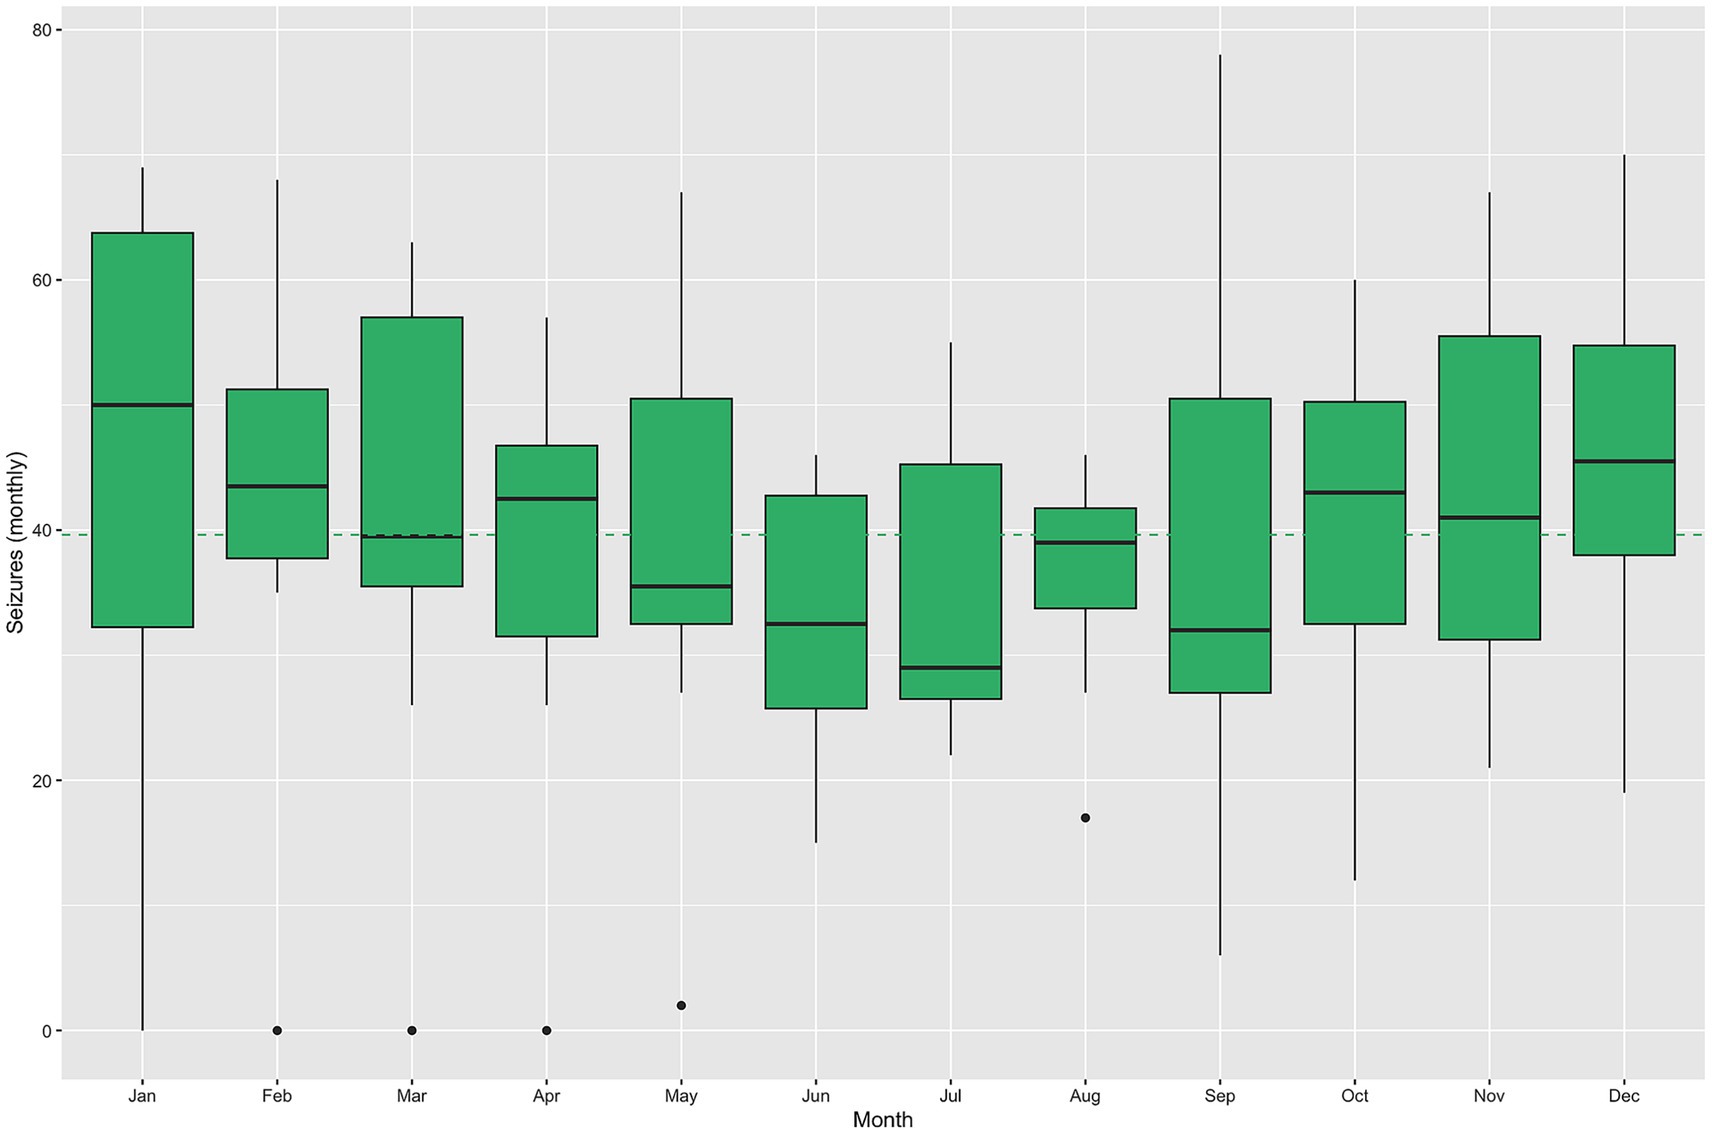
Figure 2. Distribution of daily weather measures and monthly cumulated precipitation by month, 2010–2019. The dashed lines identify the overall mean of each measurement in the color detailed in the corresponding legend.

Figure 3. Distribution of daily pollution measures by month, 2010–2019. The dashed lines identify the overall mean of each measurement in the color detailed in the corresponding legend. The red lines identify poor air quality measures as those above red lines.
The exposure–response curves (Figure 4) revealed that seizure risk increased significantly on days with extremely low temperatures and high NO2 concentrations. Mean daily temperatures below the 2.5th percentile were associated with a marked increase in seizure-related admissions for both 7- and 21-day lags, whereas temperatures above the 97.5th percentile were associated with a decreased risk. Similarly, NO2 concentrations above the 99th percentile were associated with an elevated seizure risk. The percent relative effects at 3-, 7-, and 21-day lags are summarized in Table 2.
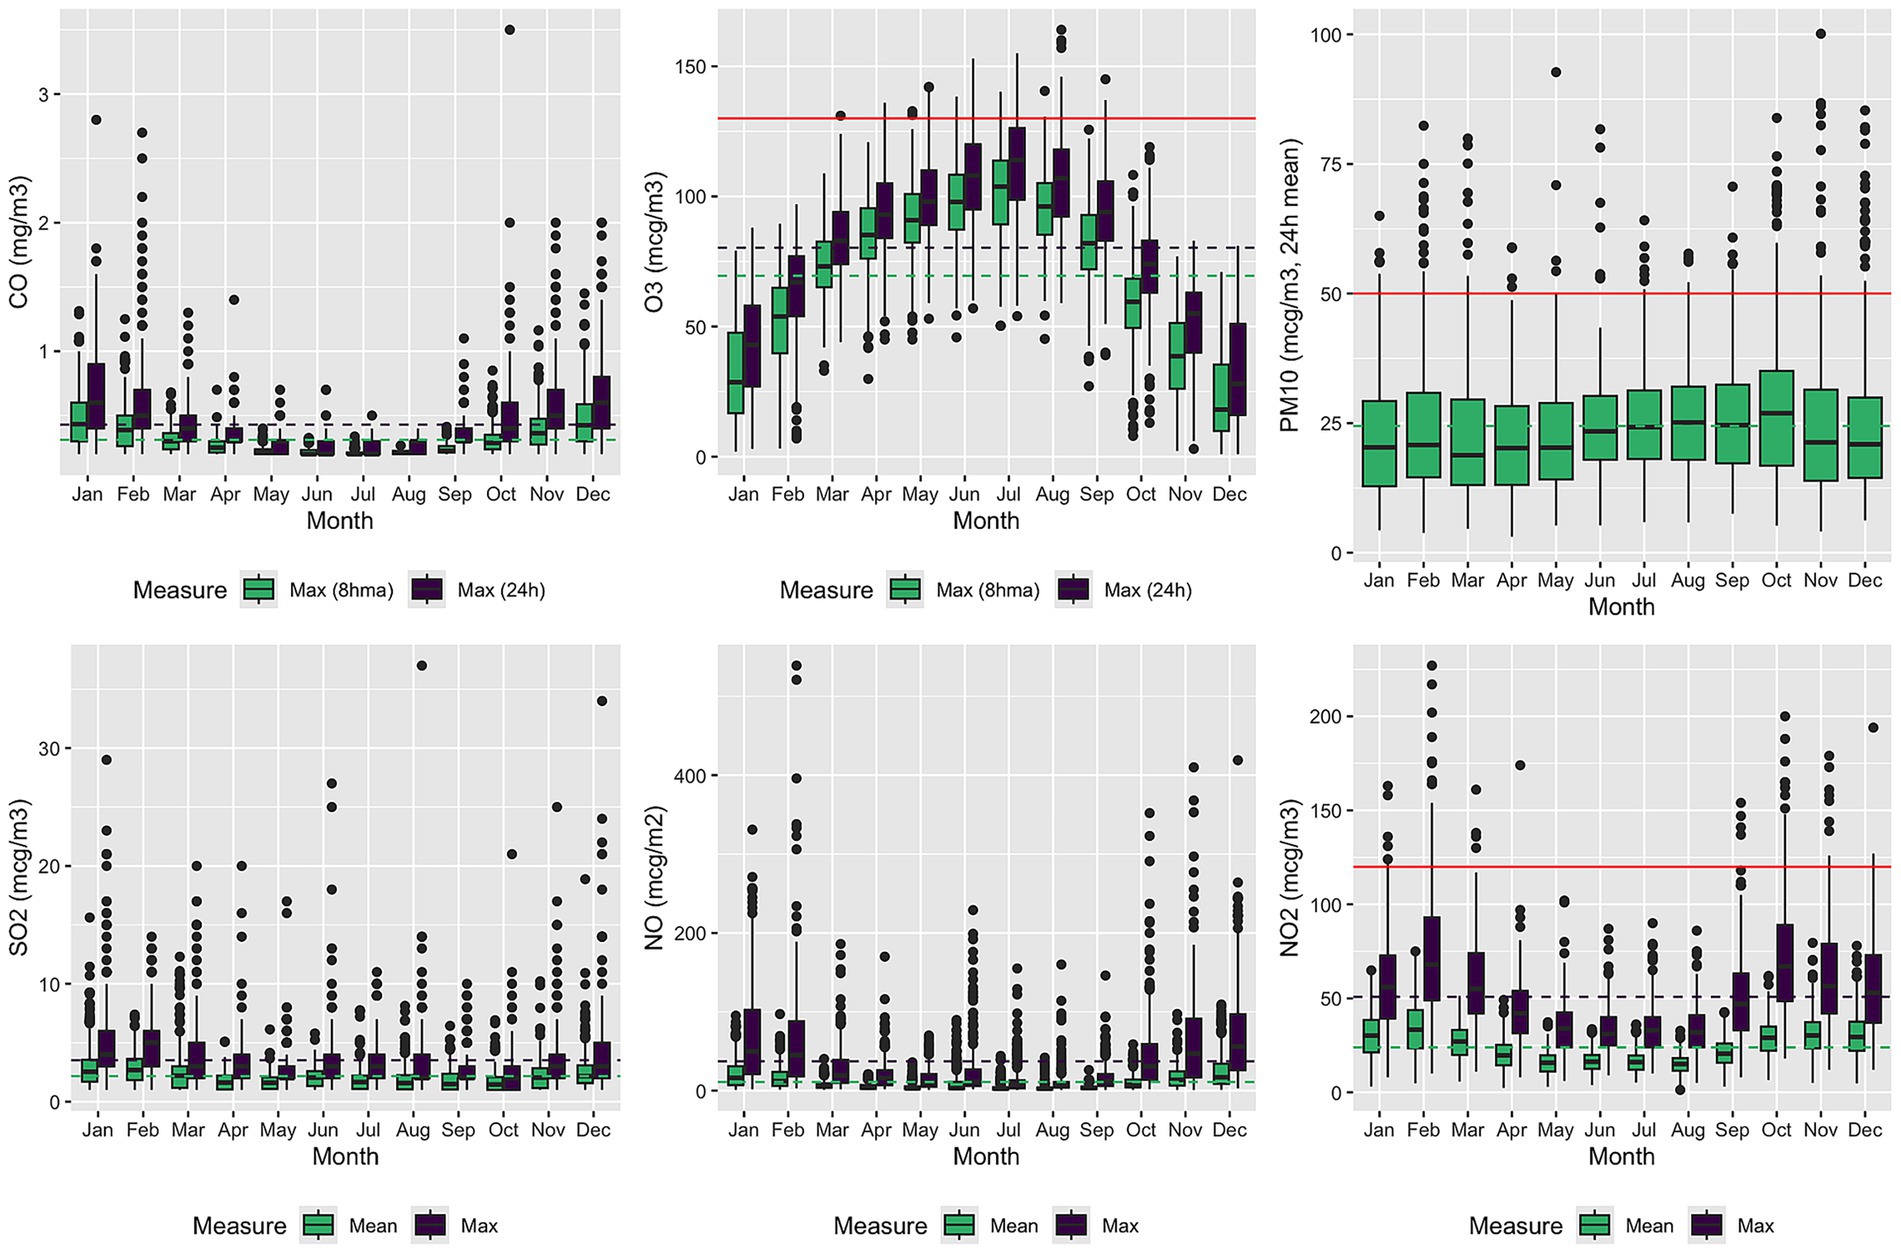
Figure 4. Estimated overall cumulative relationship between seizures and exposure to temperature and NO2 concentrations. The three plots show the results of modeling a possible 3-, 7- or 21-days lag delay.
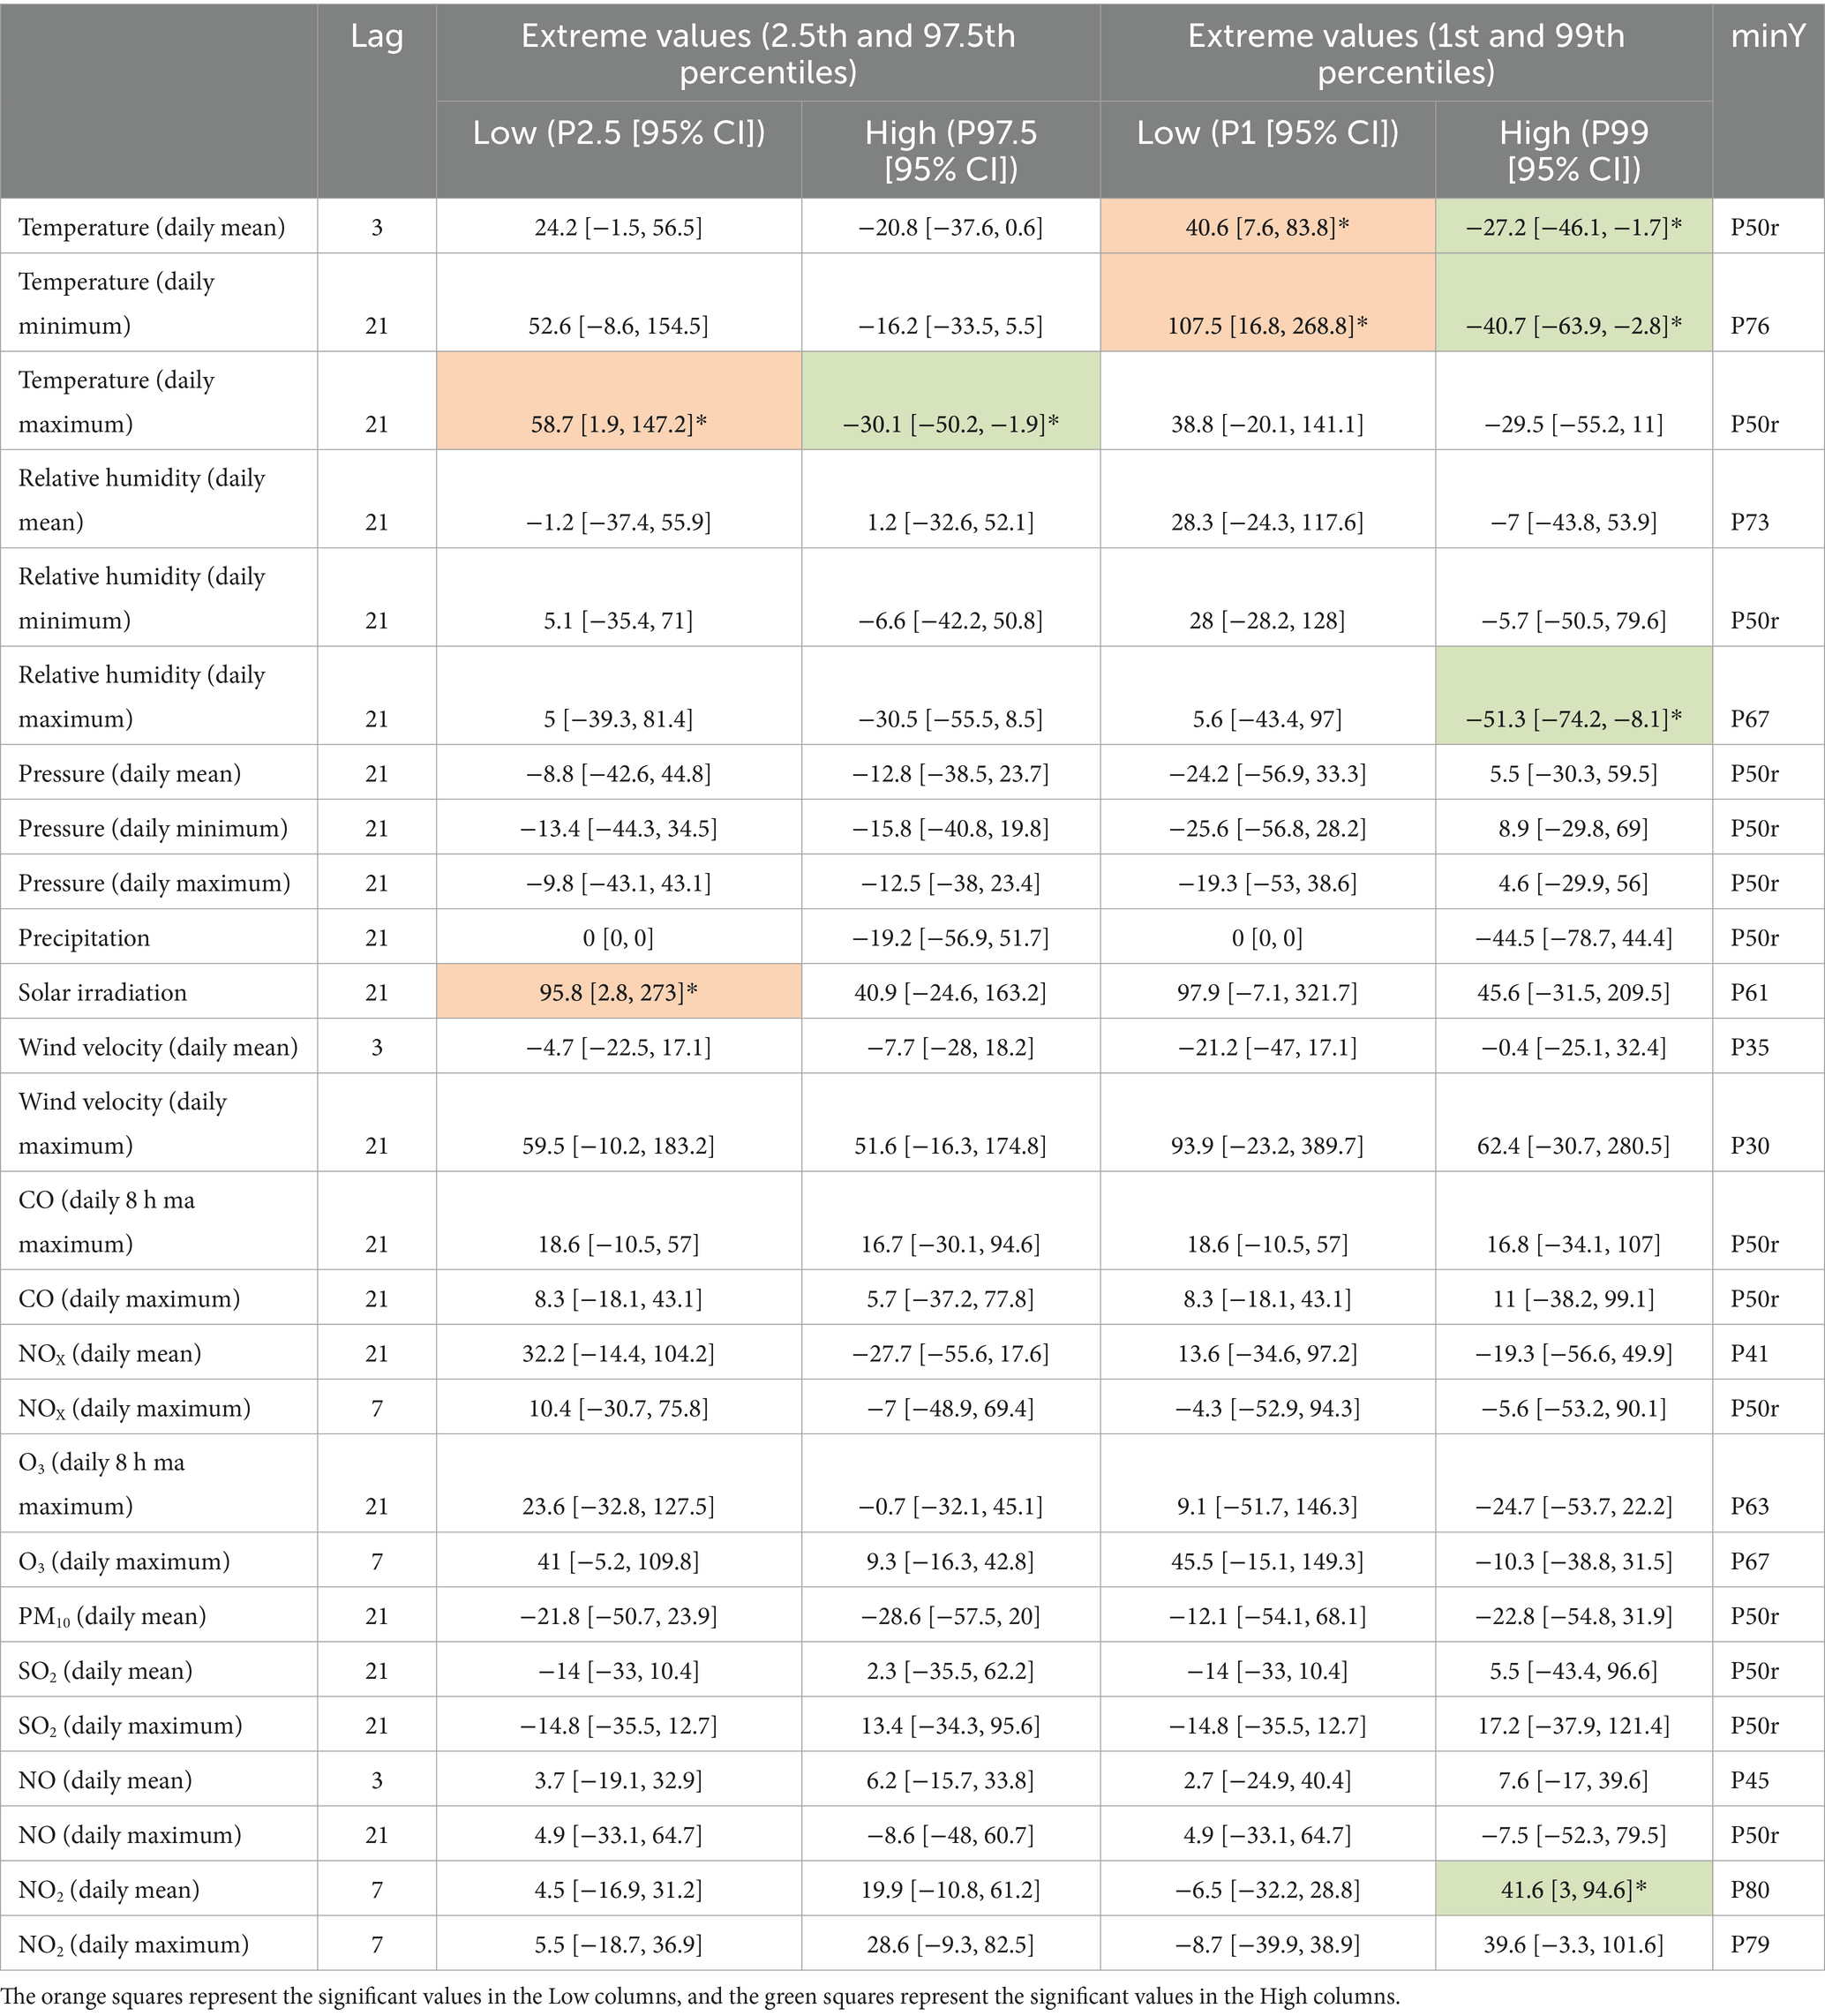
Table 2. Percent change of relative risk associated with weather and pollution exposures.
The association between high daily mean NO2 exposure and seizure admissions remained significant after adjusting for temperature using natural spline terms (Figure 5).
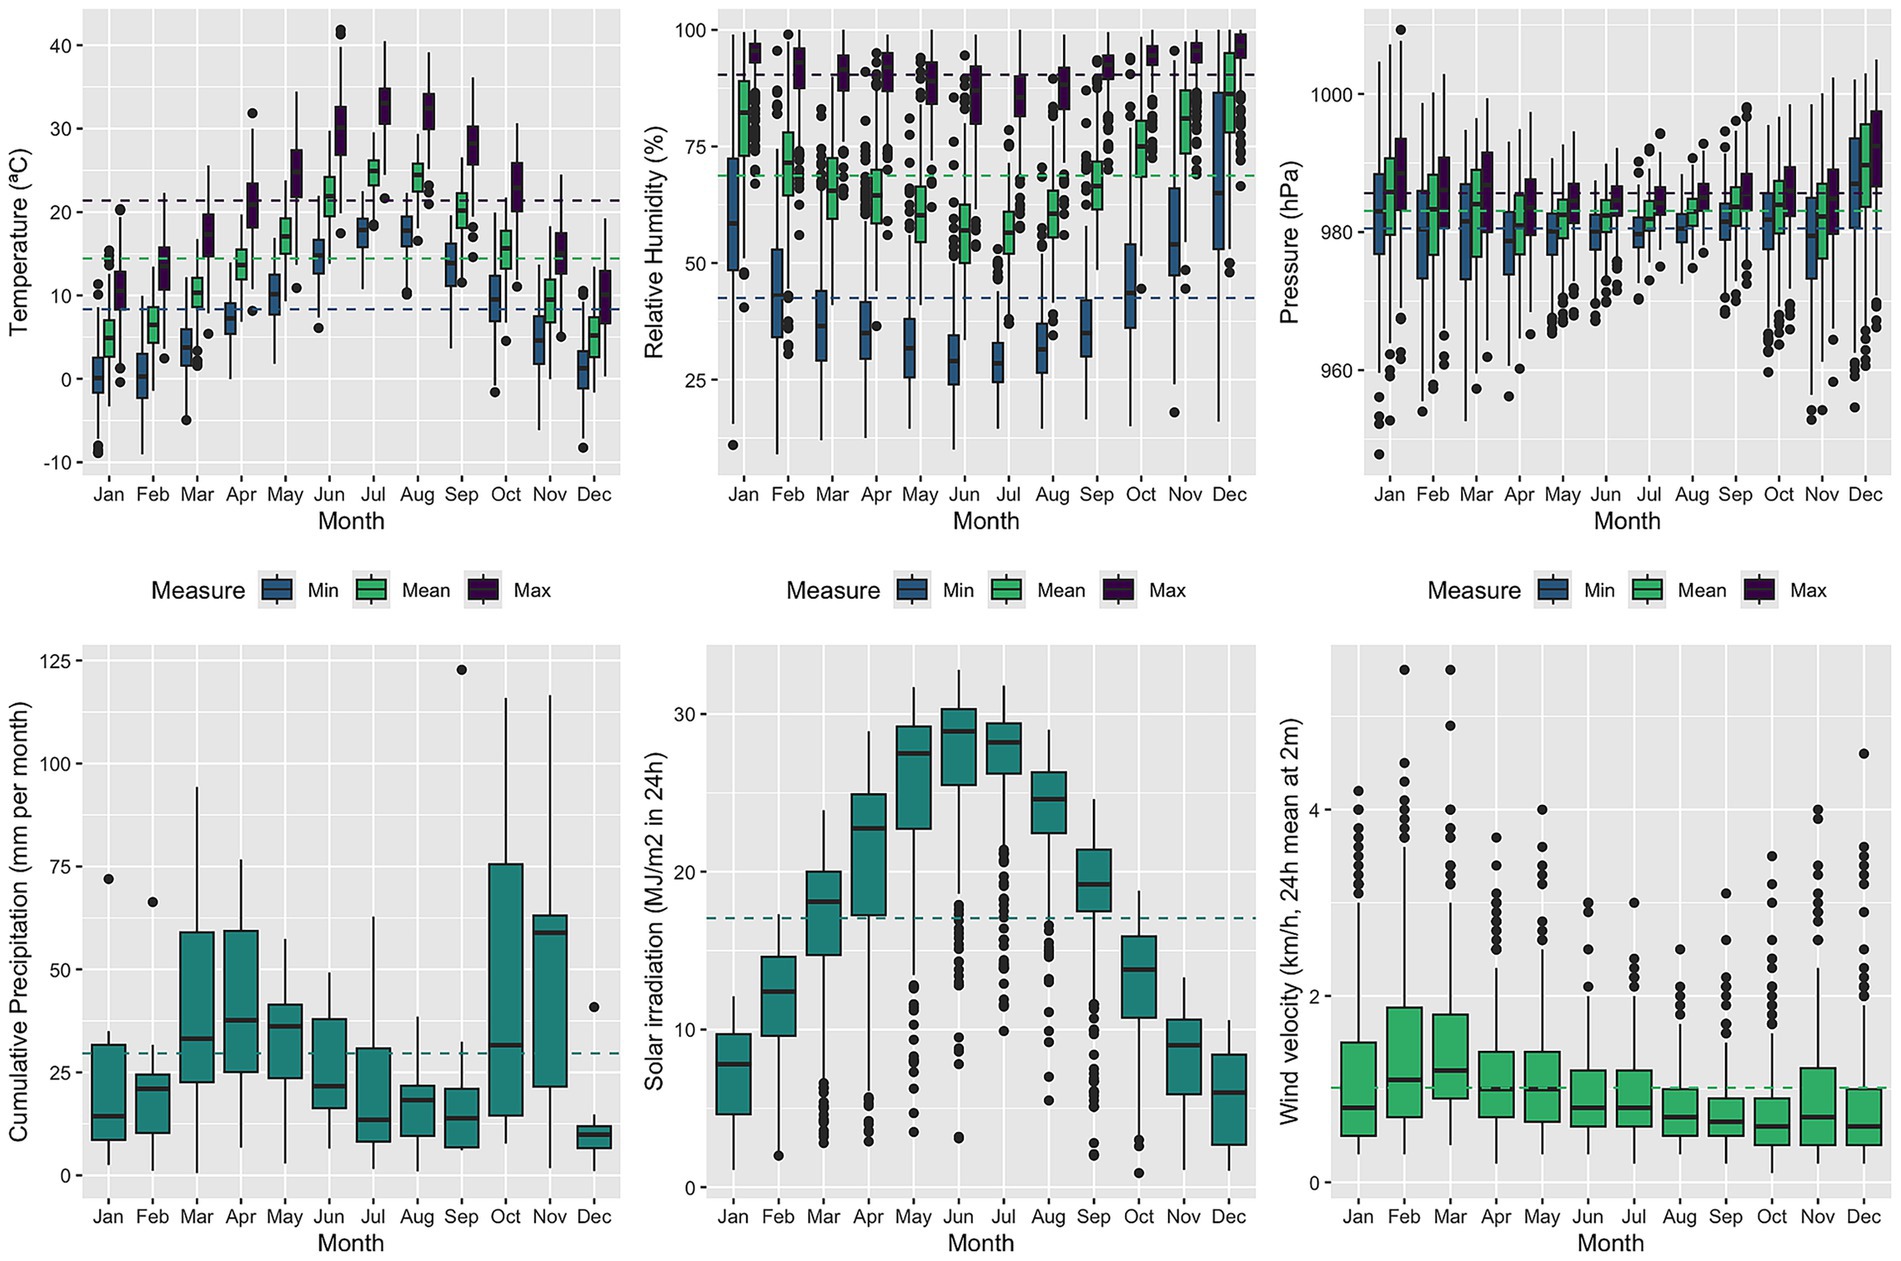
Figure 5. Estimated overall cumulative relationship between seizures and exposure to NO2 concentrations adjusted by temperature. The three plots show the results of modeling a possible 3-, 7- or 21-days lag delay.
Discussion
In our study, we detected a significant association between the onset of epileptic seizures and both high levels of nitrogen dioxide (NO2) and low temperatures. While the primary objective was to explore the relationship between environmental factors and seizure-related emergency visits, the geographic dispersion of hospitals across the health region may have introduced variability in exposure. Although air quality data were obtained from a single monitoring station, seizure-related visits from rural areas—potentially located farther from the monitoring site—were also included. This approach reflects the real-world healthcare utilization patterns of the region but may reduce spatial specificity.
Previous research on meteorological influences on seizure occurrence has produced mixed results. An initial study by Doherty et al. linked seizure frequency to rapid atmospheric pressure changes greater than 5.5 hPa per day (20), though subsequent analyses by the same author did not confirm this association. Other studies have reported associations with high daily temperature fluctuations and sunnier days (21), while high humidity, higher temperatures, and cloudier conditions were suggested to have protective effects (22). In contrast, our findings indicate an increase in emergency consultations for seizures during colder periods.
The greater frequency of seizures during colder months may be related to several physiological and environmental mechanisms. Low temperatures can induce oxidative stress, vascular changes, and sympathetic activation, all of which may reduce the seizure threshold. Cold weather is also associated with higher rates of respiratory infections and fever, which can destabilize seizure control in predisposed individuals. Moreover, reduced physical activity, decreased sunlight exposure, and alterations in circadian rhythm during winter months may further contribute to neuronal excitability.
Regarding NO2, higher concentrations during colder seasons can be explained by increased emissions from heating systems and the combustion of fossil fuels, as well as by thermal inversion phenomena, which trap pollutants near the ground and limit atmospheric dispersion. These mechanisms are consistent with studies from other temperate regions showing seasonal peaks of NO2 during winter months.
Air pollution remains a major global public health concern. Extensive evidence links it to respiratory (23) and cardiovascular diseases (24), and growing research indicates potential neurological effects (25), including stroke, migraines, cognitive impairment, neurodegenerative disorders, and psychiatric conditions. However, relatively few studies have examined its association with seizures. According to a recent review, six epidemiological studies have evaluated air pollution and seizure risk (26), most of which found that elevated atmospheric pollutant levels (CO, NO2, O3, SO2, PM10, and PM2.5) may increase hospitalization rates for seizures, particularly with NO2 exposure (27).
One study using electroencephalogram (EEG) monitoring reported a positive association between CO exposure and subclinical epileptic activity, although no significant relationship was found for NO2, O3, SO2, or PM10 (28). In that Australian study, pollutant concentrations were generally within acceptable limits, contrasting with findings from areas with higher ambient pollution such as China and Chile. In our setting, CO levels remain low, but NO2 concentrations frequently exceed recommended thresholds (29).
Ambient particulate matter rarely acts in isolation. In real-world environments, PM2.5 and PM10 often coexist and interact with gaseous pollutants such as NO2 and O3, producing complex atmospheric mixtures with synergistic toxic effects. NO2 can adhere to the surface of fine particles, enhancing their oxidative potential and enabling reactive nitrogen species to reach deep into the respiratory tract and circulation. Likewise, photochemical reactions involving O3 can alter the composition of particulates, generating secondary organic aerosols and reactive oxygen species. Together, these exposures amplify oxidative stress, systemic inflammation, and endothelial dysfunction—mechanisms that not only affect respiratory and cardiovascular systems but may also promote neuroinflammation and lower the seizure threshold.
The biological plausibility of these findings is supported by emerging evidence. Air pollutants such as NO2 and PM2.5 can trigger oxidative stress, neuroinflammation, and glial activation, disrupting neuronal homeostasis and potentially facilitating epileptic discharges. Recent systematic reviews have confirmed that air pollution, particularly NO2, is associated with increased risks of unprovoked seizures and new-onset epilepsy (8). Similarly, a scoping review by Sharma et al. (2) highlighted the contribution of both air quality and temperature to seizure occurrence, reinforcing the relevance of our findings.
Although the retrospective nature of the data is a limitation, large administrative datasets remain valuable for studying low-frequency conditions such as seizures. They allow for robust statistical modeling and population-level inference. The meteorological data were collected from multiple stations within the region, representing local climatic variability. Nevertheless, rural areas—where pollution levels are generally lower—were underrepresented, as only one station provided NO2 data. In rural settings, ozone levels tend to be higher, whereas NO2 and particulate concentrations are lower. Given population distribution, however, most seizure-related admissions occurred within the urbanized health region, where environmental conditions are similar to those of the provincial capital.
Limitations
Several limitations should be considered. First, seizure-related admissions were identified using ICD-10-CM codes G40, which capture the majority of epileptic seizures, and R56 codes (febrile convulsions) were excluded. However, some G40-coded cases may correspond to non-epileptic events such as syncope or other transient loss-of-consciousness episodes. Second, individual-level confounders—such as medication adherence, comorbidities, socioeconomic status, and lifestyle factors—could not be included due to the nature of the registry data. Nonetheless, the time-series design inherently controls for stable population characteristics, minimizing the risk of major confounding. Third, exposure was assigned based on fixed outdoor monitoring stations, without accounting for indoor pollution or personal activity patterns, which may have led to exposure misclassification.
Conclusion
Our findings suggest that both low temperatures and elevated NO2 concentrations are independently associated with an increased risk of seizure-related emergency visits. These results support the hypothesis that environmental conditions—particularly during colder months—can influence seizure occurrence through physiological and inflammatory mechanisms. Moreover, the seasonal rise in NO2 levels during winter likely amplifies this effect through combined exposure pathways.
This study contributes to the growing body of evidence linking environmental factors to neurological health and highlights the need to integrate air quality and meteorological data into epilepsy surveillance and preventive health strategies. Future research should incorporate individual-level clinical and behavioral data to better clarify causal pathways and identify vulnerable subpopulations. Strengthening public health policies aimed at reducing air pollution could have a meaningful impact not only on cardiovascular and respiratory outcomes but also on neurological diseases such as epilepsy.
Data availability statement
The raw data supporting the conclusions of this article will be made available by the authors, without undue reservation.
Ethics statement
The studies involving humans were approved by CEIm Hospital Universitari Arnau de Vilanova. The studies were conducted in accordance with the local legislation and institutional requirements. The ethics committee/institutional review board waived the requirement of written informed consent for participation from the participants or the participants’ legal guardians/next of kin because retrospective and anonymized data.
Author contributions
CL: Writing – review & editing, Methodology, Project administration, Writing – original draft, Investigation. MM-A: Methodology, Writing – review & editing, Formal analysis, Data curation, Writing – original draft. EJ: Investigation, Writing – review & editing, Writing – original draft. JO: Data curation, Project administration, Writing – review & editing, Writing – original draft. OY: Conceptualization, Investigation, Writing – review & editing, Data curation, Writing – original draft.
Funding
The author(s) declare that no financial support was received for the research and/or publication of this article.
Conflict of interest
The authors declare that the research was conducted in the absence of any commercial or financial relationships that could be construed as a potential conflict of interest.
Generative AI statement
The authors declare that no Gen AI was used in the creation of this manuscript.
Any alternative text (alt text) provided alongside figures in this article has been generated by Frontiers with the support of artificial intelligence and reasonable efforts have been made to ensure accuracy, including review by the authors wherever possible. If you identify any issues, please contact us.
Publisher’s note
All claims expressed in this article are solely those of the authors and do not necessarily represent those of their affiliated organizations, or those of the publisher, the editors and the reviewers. Any product that may be evaluated in this article, or claim that may be made by its manufacturer, is not guaranteed or endorsed by the publisher.
References
1. Dawes, A, Attipoe, S, Mittlesteadt, J, Glynn, P, Rust, S, Debs, A, et al. Measuring the impact of epilepsy on families. Epilepsy Behav. (2020) 111:107254. doi: 10.1016/j.yebeh.2020.107254
2. Sharma, R, Schinasi, LH, Lee, BK, Weuve, J, Weisskopf, MG, Sheffield, PE, et al. Air pollution and temperature in seizures and epilepsy: a scoping review of epidemiological studies. Curr Environ Health Rep. (2024) 12:1. doi: 10.1007/s40572-024-00466-3
3. Falco-Walter, J. Epilepsy-definition, classification, pathophysiology, and epidemiology. Semin Neurol. (2020) 40:617–23. doi: 10.1055/s-0040-1718719
4. Rakers, F, Walther, M, Schiffner, R, Rupprecht, S, Rasche, M, Kockler, M, et al. Weather as a risk factor for epileptic seizures: a case-crossover study. Epilepsia. (2017) 58:1287–95. doi: 10.1111/epi.13776
5. Serrano-Castro, PJ, Mauri-Llerda, JA, Hernández-Ramos, FJ, Sánchez-Alvarez, JC, Parejo-Carbonell, B, Quiroga-Subirana, P, et al. Adult prevalence of epilepsy in Spain: EPIBERIA, a population-based study. TheScientificWorldJournal. (2015) 2015:602710. doi: 10.1155/2015/602710
6. Viloria Alebesque, A, López Bravo, A, Bellosta Diago, E, Santos Lasaosa, S, and Mauri Llerda, JA. Usefulness of electroencephalography for the management of epilepsy in emergency departments. Utilidad del electroencefalograma en el manejo de la epilepsia en el Servicio de Urgencias. Neurologia. (2020) 35:238–44. doi: 10.1016/j.nrl.2017.08.008
7. Holper, S, Foster, E, Chen, Z, and Kwan, P. Emergency presentation of new onset versus recurrent undiagnosed seizures: a retrospective review. Emerg Med Aust. (2020) 32:430–7. doi: 10.1111/1742-6723.13420
8. Antaya, TC, Espino-Alvarado, PH, Oiamo, T, Wilk, P, Speechley, KN, and Burneo, JG. Association of outdoor air and noise pollution with unprovoked seizures and new onset epilepsy: a systematic review and meta-analysis. Epilepsia. (2024) 65:1847–67. doi: 10.1111/epi.18010
9. Gulcebi, MI, Bartolini, E, Lee, O, Lisgaras, CP, Onat, F, Mifsud, J, et al. Climate change and epilepsy: insights from clinical and basic science studies. Epilepsy Behav. (2021) 116:107791. doi: 10.1016/j.yebeh.2021.107791
10. Chang, KC, Wu, TH, Fann, JC, Chen, SL, Yen, AM, Chiu, SY, et al. Low ambient temperature as the only meteorological risk factor of seizure occurrence: a multivariate study. Epilepsy Behav. (2019) 100:106283. doi: 10.1016/j.yebeh.2019.04.036
11. Brigo, F, Igwe, SC, and Bragazzi, NL. Epilepsy and substance use disorders: a narrative review. Epilepsy Behav. (2018) 82:282–92. doi: 10.1016/j.yebeh.2018.03.016
12. Haut, SR, Hall, CB, Masur, J, and Lipton, RB. Seizure occurrence: precipitants and prediction. Neurology. (2007) 69:1905–10. doi: 10.1212/01.wnl.0000278114.45328.46
13. World Health Organization. Housing and health guidelines. (2018). Available online at: https://www.who.int/publications/i/item/9789241550376 (Accessed September 11, 2025).
14. Vriens, J, Nilius, B, and Voets, T. Peripheral thermosensation in mammals. Nat Rev Neurosci. (2014) 15:573–89. doi: 10.1038/nrn3784
15. Epilepsy Group of the Spanish Society of Neurology. The descriptive epidemiology of epilepsy in the Mediterranean Basin: are we different? J Epilepsy Group Spanish Soc Neurol. (2018) 16:3–8.
16. Sangkham, S, Phairuang, W, Sherchan, SP, Pansakun, N, Munkong, N, Sarndhong, K, et al. An update on adverse health effects from exposure to PM2.5. Environ Adv. (2024) 18:100603. doi: 10.1016/j.envadv.2024.100603
17. Li, X, Yang, Y, Wang, Z, Jiang, S, Meng, Y, Song, X, et al. Targeting non-coding RNAs in unstable atherosclerotic plaques: mechanism, regulation, possibilities, and limitations. Int J Biol Sci. (2021) 17:3413–27. doi: 10.7150/ijbs.62506
18. R Core Team. R: a language and environment for statistical computing. Vienna, Austria: R Foundation for Statistical Computing (2024).
19. Gasparrini, A. Distributed lag linear and non-linear models in R: the package dlnm. J Stat Softw. (2011) 43:1–20.
20. Doberty, MJ, Youn, C, Gwin, RP, and Haltimer, AM. Atmospheric pressure and seizure frequency in the epilepsy unit; preliminary observations. Epilepsia. (2007) 48:1764–7. doi: 10.1111/j.1528-1167.2007.01111.x
21. Horwat-Kaczmarek, M, and Rosciszewska, D. Analysis of correlation between seizure incidence and atmospheric pressure and temperature in particular months during years 1982–1987. Abstracts 13th Congress of Neurology, Gdansk. (1987).
22. Ruegg, S, Hunziker, P, Marsch, S, and Schundler, C. Association of environmental factors with the onset os status epilepticus. Epilepsy Behav. (2008) 12:66–73. doi: 10.1016/j.yebeh.2007.08.020
23. Lee, S, Tian, D, He, R, Cragg, JJ, Carlsten, C, Giang, A, et al. Ambient air pollution exposure and adult asthma incidence: a systematic review and meta-analysis. Lancet Planet Health. (2024) 8:e1065–78. doi: 10.1016/S2542-5196(24)00279-1
24. Katznelson, E, Malkani, K, Zhang, R, and Patel, S. Impact of climate change on cardiovascular health. Curr Atheroscler Rep. (2024) 27:13. doi: 10.1007/s11883-024-01261-z
25. Kim, H, Kim, WH, Kim, YY, and Park, HY. Air pollution and central nervous system disease: a review of the impact of fine particulate matter on neurological disorders. Front Public Health. (2020) 8:575330. doi: 10.3389/fpubh.2020.575330
26. Fernandes, M, Carletti, C, deAraújo, LS, Santos, R, and Reis, J. Respiratory gases, air pollution and epilepsy. Rev Neurol (Paris). (2019) 175:604–13. doi: 10.1016/j.neurol.2019.07.013
27. Cakmak, S, Dales, RE, and Vidal, CB. Air pollution and hospitalization for epilepsy in Chile. Environ Int. (2010) 36:501–5. doi: 10.1016/j.envint.2010.03.008
28. Chen, Z, Yu, W, Xu, R, Karoly, PJ, Maturana, MI, Payne, DE, et al. Ambient air pollution and epileptic seizures: a panel study in Australia. Epilepsia. (2022) 63:1682–92. doi: 10.1111/epi.17253
Keywords: epilepsy, seizures, air pollution, nitrogen dioxide, temperature, environmental health
Citation: Llobet C, Martinez-Alonso M, Justribó E, Ortet J and Yuguero O (2025) Seizures, climate and pollution: is there evidence of an association? Front. Public Health. 13:1708538. doi: 10.3389/fpubh.2025.1708538
Edited by:
Cameron S. Metcalf, The University of Utah, United StatesReviewed by:
Worradorn Phairuang, Chiang Mai University, ThailandJorge G. Burneo, Western University, Canada
Copyright © 2025 Llobet, Martinez-Alonso, Justribó, Ortet and Yuguero. This is an open-access article distributed under the terms of the Creative Commons Attribution License (CC BY). The use, distribution or reproduction in other forums is permitted, provided the original author(s) and the copyright owner(s) are credited and that the original publication in this journal is cited, in accordance with accepted academic practice. No use, distribution or reproduction is permitted which does not comply with these terms.
*Correspondence: Oriol Yuguero, T3Jpb2wueXVndWVyb0B1ZGwuY2F0