Abstract
Oysters are ecologically and commercially important species that require frequent monitoring to track population demographics (e.g., abundance, growth, mortality). Current methods of monitoring oyster reefs often require destructive sampling methods and extensive manual effort. However, these methods are destructive and are suboptimal for small-scale or sensitive environments. A recent alternative, the ODYSSEE model, was developed to use deep learning techniques to identify live oysters using video or images taken in the field of oyster reefs to assess abundance. The validity of this model in identifying live oysters on a reef was compared to expert and non-expert annotators. In addition, we identified potential sources of prediction error. Although the model can make inferences significantly faster than expert and non-expert annotators (39.6 s, h, h, respectively), the model overpredicted the number of live oysters, achieving lower accuracy (63%) in identifying live oysters compared to experts (74%) and non-experts (75%) alike. Image quality was an important factor in determining the accuracy of the model and annotator. Better quality images improved human accuracy and worsened model accuracy. Although ODYSSEE was not sufficiently accurate, we anticipate that future training on higher-quality images, utilizing additional live imagery, and incorporating additional annotation training classes will greatly improve the model’s predictive power based on the results of this analysis. Future research should address methods that improve the detection of living vs dead oysters.
1 Introduction
Globally, historical oyster reefs decreased in abundance from historical levels by approximately 85% (Beck et al., 2011). Reductions in global oyster populations were attributed to several factors, including disease (Haskin and Ford, 1982; Andrews, 1988; Petton et al., 2021), overharvest (Rothschild et al., 1994) and climate change (McFarland et al., 2022; Heo et al., 2023; Neokye et al., 2024). Since oysters are ecosystem engineers, the reduced reef area and continuity affect the beneficial services provided to other aquatic organisms, resulting in a disproportional impact on marine communities (Rodney and Paynter, 2006; Grabowski et al., 2022).
The formation of oyster reefs increases the rugosity of the seafloor, producing shear stress that attenuates wave action and downstream velocity (Kitsikoudis et al., 2020; Campbell et al., 2025) and stabilizes sediments (Scyphers et al., 2011; Peyre et al., 2015; Walles et al., 2015). The structures also provide valuable habitat for many fishes and invertebrates (Harding and Mann, 2001; Connolly et al., 2024). Furthermore, oyster filtration was historically capable of filtering entire estuarine regions (Wiltsee, 2023; zu Ermgassen et al., 2013), removing suspended particles, facilitating benthic coupling (Hoellein et al., 2015; Testa et al., 2015; Ray and Fulweiler, 2021), and improving water clarity (Newell and Koch, 2004). Oysters are also culturally and commercially significant for many coastal communities (Michaelis et al., 2021). In the United States alone, wild oyster harvest was valued at $221 million in 2019 (NMFS, 2023), and global oyster aquaculture grows roughly 2% annually (Botta et al., 2020).
The importance of oyster reefs for ecosystem and economic function has led to a global effort to restore natal beds (Carranza and zu Ermgassen, 2020). These efforts often succeed in increasing the population of formerly eradicated reefs, revitalizing threatened species (McAfee et al., 2024), and expanding the reef area (Hernandez et al., 2018), without affecting genetic diversity (Hornick and Plough, 2022). Furthermore, restored reefs provide ecosystem services similar to functionally undisturbed reefs (Grabowski et al., 2022; Smith et al., 2024), further elucidating the benefits of reef restoration efforts. However, while services are observed to improve during the first 2 years, the rate of service provision decreases over the following years, highlighting the need for long-term monitoring (Hemraj et al., 2022).
Reef monitoring to manage local fisheries and assess habitat quality is often conducted annually to biannually, combining efforts from state and academic institutions with varying scales and objectives (e.g., New Jersey, Burt et al. (2023); Delaware; DNREC (2023); Maryland; Tarnowski (2024); Virginia; Southworth (2024)). Although monitoring is regionally specific and is directed to address local interests, many sampling methods and analytical metrics overlap. In Delaware, beds are dredged to collect roughly one bushel of reef material (35.2 L) to identify, count, and measure market-sized and small oysters. These individuals are used to derive size frequency distributions to determine the density of marketable oysters and understand reef population dynamics. Although these metrics provide valuable information on reef health and fisheries status, the processing time to conduct these studies in Delaware alone takes several days of boat time and the concentrated effort of six to seven trained crew members to sample a subset of the existing reefs (Audrey Ostroski, DNREC, personal communications). Furthermore, these assessments require destructive sampling methods, which cannot occur in small or vulnerable reef beds, hardened shoreline restoration projects, or newly seeded beds.
Modern advances in robotics and photogrammetry can facilitate data collection for oyster stock assessments while providing a minimally destructive alternative to traditional sampling methods. Stationary video cameras are often used to identify the abundance, composition, and behavior of nekton associated with coral reefs (Boom et al., 2014), oyster reefs (Connolly et al., 2024), and oyster aquaculture equipment (Mercaldo-Allen et al., 2023; Armbruster et al., 2024; Ambrose and Munroe, 2024). Autonomous vehicles assessed the abundance and distribution of sea scallops in the Mid-Atlantic Bight (Kannappan et al., 2014; Walker et al., 2016; Rasmussen et al., 2017). Aerial drones were successful in imaging the area and morphology of intertidal oyster reefs in North Carolina and Florida (Windle et al., 2019; Bennett, 2024). Hand-towed video cameras provided footage to assess localized habitat quality of harvested and non-harvested oyster beds (Anchondo et al., 2024; Heggie and Ogburn, 2021). The culmination of video-based surveying efforts in marine environments provides valuable information regarding habitat extent, quality, and composition, but at the species or individual level to address abundance or density, hours to days worth of data are required over longer time spans to acquire a sufficient dataset (e.g., Mercaldo-Allen et al., 2023; Jensen et al., 2024). Furthermore, manual efforts to accurately assess video data require significant training and labor to process and quality control datasets, which is time-consuming, labor-intensive, and limits the scalability of research efforts (English et al., 2024). Fortunately, a catalog of more than 11 million benthic images is available open-access through BenthicNet to facilitate training and potential deep learning (DL) applications, expanding opportunities for underwater image-based analyses (Lowe et al., 2025).
Recent advancements on DL have contributed to optimizing surveying methods in marine systems. DL-based visual recognition and detection of aquatic animals combines advanced technologies such as image processing, computer vision, cloud computing, sonar, and sensors to provide automatic and intelligent identification, detection, and tracking of aquatic species (Fernandes and DMello, 2024). In addition, these techniques can be integrated into edge devices and directly help identify marine species, providing crucial support to researchers in the field (Lin et al., 2025). Underwater robots can implement vision models in situ; however, training vision models often requires large datasets and manual annotations, which can be extremely difficult and tedious in coastal marine environments, limiting scalability (Huang and Khabusi, 2025). In recent years, advanced image generation techniques, such as stable diffusion, have allowed the generation of convincing synthetic data to enhance and diversify training data sets for detection models. This approach was used to train the OSYSSEE model to detect live oysters in a reef setting (Lin et al., 2025).
In this study, we compared the performance of the DL oyster identification model, ODYSSEE, against expert and non-expert annotators to delineate potential sources of error associated with the identification of live oysters using photogrammetry methods. We anticipate that the model will accurately identify live oysters and potentially have limitations in its current stage in separating live and dead oysters. The main contribution of this work is to realize the potential sources of error in the model compared to human identifiers that can provide the necessary information to determine the validity of such models, a scientific monitoring tool, and inform pathways that can be used to enhance model performance. Then, utilizing DL as a non-destructive means to census live oysters on a reef can significantly improve current monitoring efforts for stock assessments, restoration efforts, and aquaculture citing and harvest.
2 Methods
2.1 Image acquisition
A set of 150 unique images was obtained using video footage captured on an oyster reef located in Lewes, DE United States (38.7890 N, 75.1624 W) during low tide, spanning multiple efforts between June and September 2024 when the water clarity was favorable. Data were recorded using a handheld camera system (drop camera method) with two GoPro Hero12 cameras mounted on a 2-m-long PVC post or a remotely operated vehicle (ROV) BlueROV2 heavy configuration (Blue Robotics, St. Torrance, CA, United States) with a GoPro Hero12 (GoPro, San Mateo, CA, United States) mounted on the payload skid. All images were unmodified with varied target distance, clarity, and number of oysters to represent the potential range of images available in a field setting. The quality score (QS) of each image was assessed based on previously published works (Padole et al., 2019) to use a score of 0–4, where 0 indicates no visibility of desired features, 1 contains features that are present but are not interpretable, 2 contains features with limited or inconsistent quality, 3 indicates acceptable quality for most of the image, and 4 indicates exceptional quality throughout the entire image. Images with a QS of 0 or 1 were not used in the study.
2.2 Deep learning model
The best-performing model from Lin et al. (2025) (highest recorded mAP 0.657, called ODYSSEE) was developed using the YOLOv10 model platform and trained on a dataset of 30% human-annotated data of oysters in the wild and 70% synthetically generated images to provide an efficient source of data using methods by Lin et al. (2022) to render oysters based on 3D scans of live specimens. These renderings were then passed through a stable diffusion model (Rombach et al., 2022) in conjunction with various ControlNets (Zhang et al., 2023) to improve the generated output and more effectively bridge the sim2real gap.
2.3 Annotation process
To compare the accuracy and detection rate across potential end users, 150 images were analyzed by (i) the oyster detection model, (ii) five expert annotators (biologists who frequently work with oysters), and (iii) five non-expert annotators (deemed by having minimal hands-on experience with oysters outside of this project). All human annotators are listed as coauthors, and no annotations were completed by a third party. The model identifies live oysters with a confidence score (CS) and only accounts for CS greater than 0.5 (potential range = 0–1). Non-expert and expert annotators identified live (confident identification of a live individual), dead (confident identification of a dead individual or loose shell), or unknown (confident identification of an oyster but not confident whether live or dead). Manual annotations were made using RoboFlow (Dwyer et al., 2024) using preset options for each observation class. Annotators drew a bounding box around their observations and marked them with the appropriate class. The program then recorded the number of identifications per class, per image. The images were annotated in the same order and the annotators were not encouraged to review the completed images to standardize the exposure time between all the annotators for each image. The final time to annotate all 150 images was also recorded.
2.4 Analysis of model performance
Across each annotator treatment, pairwise tests were used to determine the average number of live identifications made per image and assess the differences in time needed to complete the annotations, considering an alpha of 0.05. To determine consistency, the intraclass correlation coefficient (ICC) was calculated between and within the annotator groups per image. When comparing annotator treatments with unequal sample sizes, the identifications were averaged and rounded to standardize the range of potential outcomes between the groups.
A random subset of 30 images was evaluated for all unique identifications against all annotators to determine the agreement between the individual oysters observed. The ‘true’ identification was determined in two ways: the first was to account for all potential outcomes, and the second was to consider only live identifications. For the first method, when two or fewer annotators identified an object, we denoted that observation as a false positive. When three or more groups identified the object, we determined that the true value was the observation made the most frequently. If the number of live classifications was equal to dead or unknown, the object would be considered live. If the number of dead classifications was equal to unknown, the object would be considered dead. For the second method, any observation without live identifications was removed from the dataset. Any object with two or fewer live identifications was classified as a false positive and anything with three or more live identifications was considered live. For both methods, a CS was generated for each result by dividing the total number of classifications that matched the true result by the total number of times that object was identified. The confidence matrices were then created to understand the agreement between the individual identifications and to describe the sources of error between the groups of annotators. For live or no-observation evaluation, the resulting outcomes from the confusion matrices were used to derive Area Under Curve (AUC) values to determine false detection rates from each group when identifying live oysters.
3 Results
Of the 150 images used, 54 had a QS of 2 followed by 75 with a QS of 3, and 21 with a QS of 4, following a non-normal distribution (, Shapiro-Wilk test). The model annotated 150 images in 39.6 s, which is negligible compared to experts ( h, n = 5; average standard deviation), which were significantly faster than non-experts ( h, n = 5; , Wilcoxon signed-rank test). Across all images, the model made an average of 4 2.45 live observations per image, which was greater than experts (2.76 3.20), and non-experts (1.89 2.08; , Kruskal–Wallis and Dunn test for all combinations). The model generated an average CS of 0.65 0.18 across all its live observations. Experts made more dead (3.12 3.57) and unknown (3.49 2.62) observations than non-experts (2.04 2.53, 4.69 2.85, respectively; , Wilcoxon signed-rank test, Figure 1).
FIGURE 1
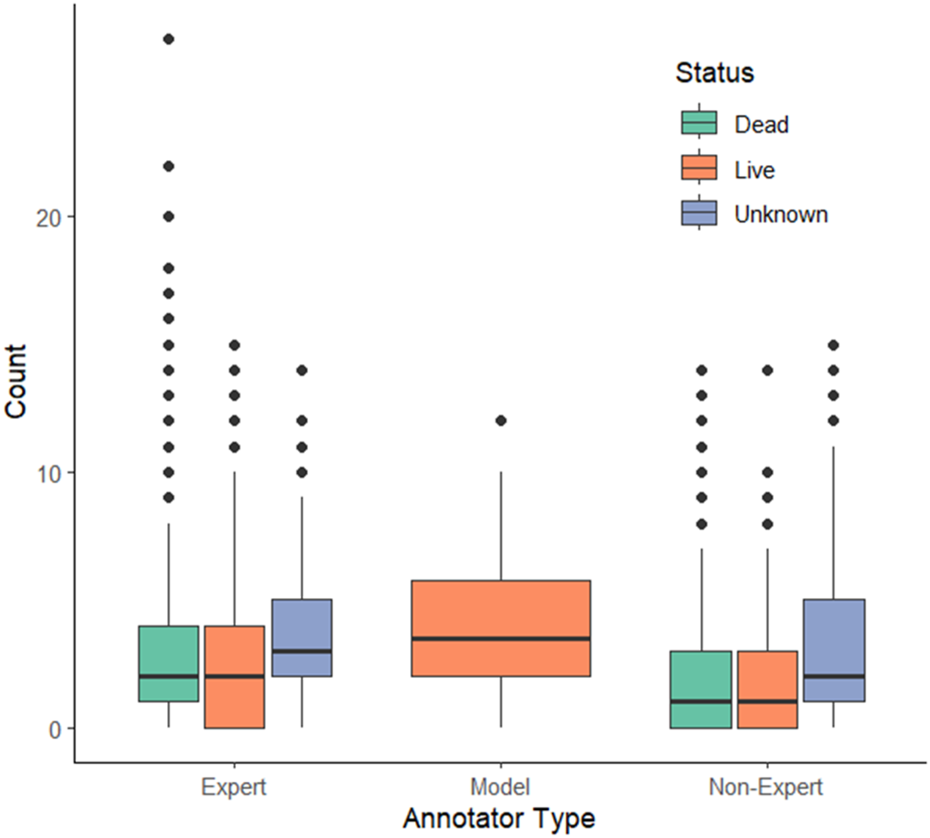
The model appears to over-predict live (orange) oysters compared to expert and non-expert annotators. Expert annotators also make a greater number of dead (green) and unknown (purple) annotations per figure compared to non-experts. The model treatment has a wider box for live annotations since it only has the capability of making live identifications.
At the image scale, the consistency of live detections between all annotator groups for an image was poor (ICC = 0.430, ) and was moderate between experts and non-experts (ICC = 0.673, , Figure 2). Similarly, the consistency of the experts and non-experts in observing dead and unknown detections in each image was also poor (ICC = 0.379, ; ICC = 0.282, ; respectively). However, the consistency of observations increased with better image quality. The consistency of live observations across all annotator groups increased from 0.366 at QS = 2 to 0.420 at QS = 4. Expert and non-expert groups had poor consistency of live observations at QS = 2 and moderate consistency at QS = 3 and QS = 4 (ICC = 0.466, 0.696, 0.658, respectively, ). For dead observations, images with a QS of 2 and 3 had moderate consistency and good consistency at QS = 4 (ICC = 0.528, 0.657, 0.890, respectively, ). However, the consistency of unknown observations decreased with QS between expert and non-expert annotators (ICC when QS = 2, 0.649; when QS = 3, 0.540, ) showing poor consistency at QS = 4 (ICC = 0.226, p = 0.156).
FIGURE 2
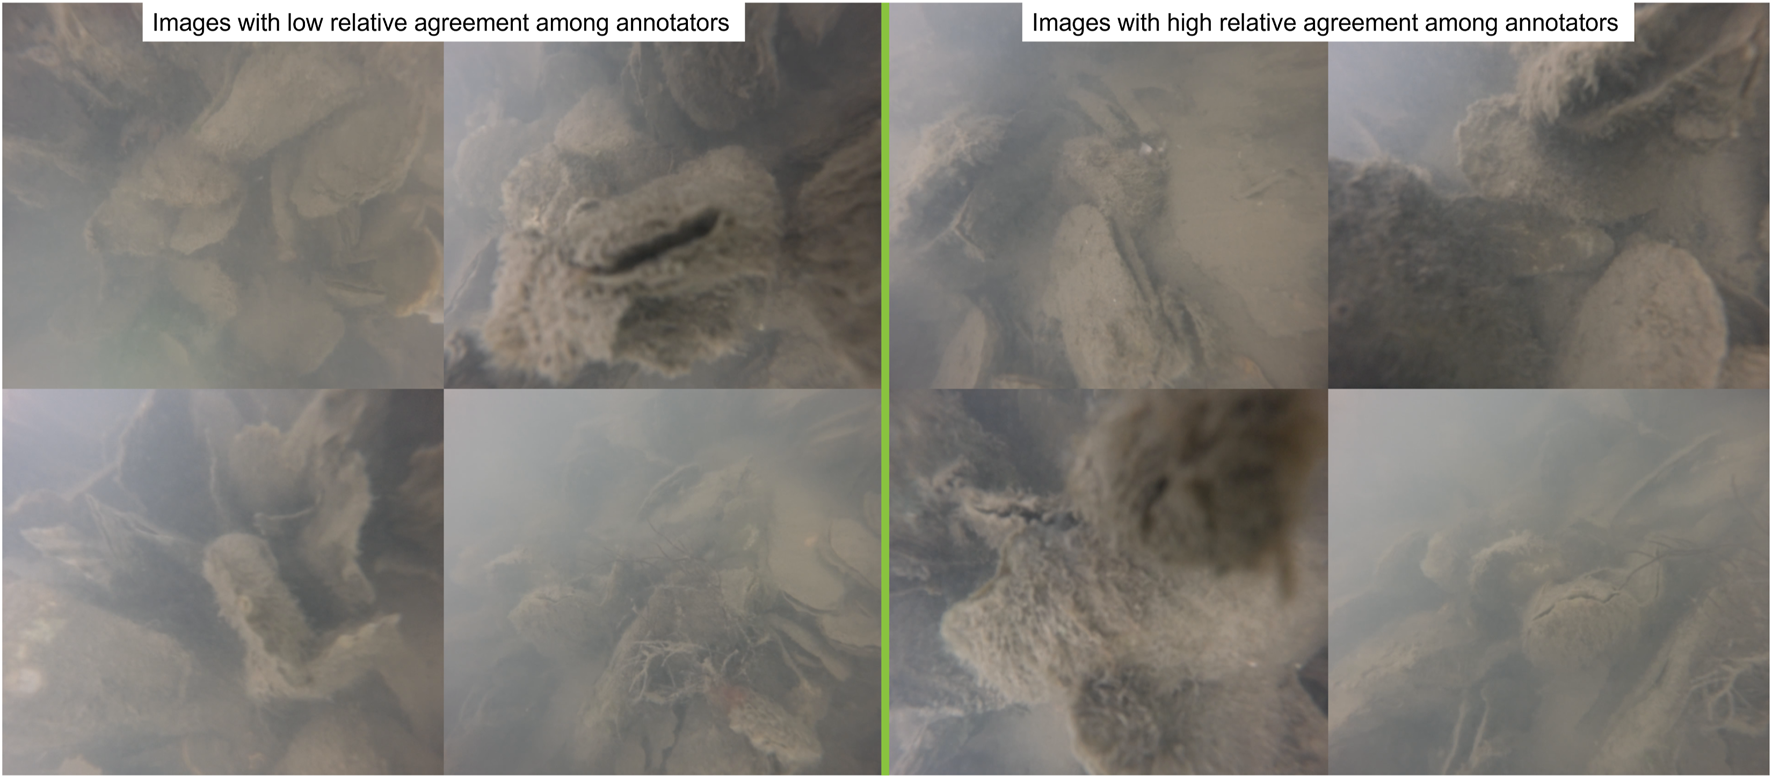
Examples of images used that represented low (left) and high (right) relative agreement between all annotators.
To determine the accuracy (Acc), Precision (Pre), and Recall (Rec) of each annotator group, 30 images were randomly selected to compare all unique observations made. From this subset, 125 live oysters (CS = 0.50 0.17), 99 dead (CS = 0.57 0.16), 135 unknown, and 113 false oyster detections were classified. The model made 36 correct observations, missed 89 live oysters, and misidentified 26 dead, 33 unknown, and 3 false-positive oysters as live (Figure 3). Experts, who classified an average of 72.2 67.5 live oysters, positively identified 39% of the live oysters. Non-experts, who classified 49 24.5 live oysters, only positively identified 27% of the live oysters. Of the average 76 63.8 dead observations made by experts and 56 47.8 by non-experts, 46% and 33% of dead oysters were positively categorized, respectively. When comparing all independent responses and results from expert and non-expert annotators, accurate and false negative classifications were most often observed, regardless of image QS, however, accuracy did increase positively with QS (Figure 4). Images with a QS = 2 resulted in 47% Acc (F1 = 0.39, Pre = 0.27, Rec = 0.69), while images with a QS = 3 resulted in 50% Acc (F1 = 0.45, Pre = 0.33, Rec = 0.69) and images with a QS = 4 resulted in 55% Acc (F1 = 0.70, Pre = 68, Rec = 0.73).
FIGURE 3
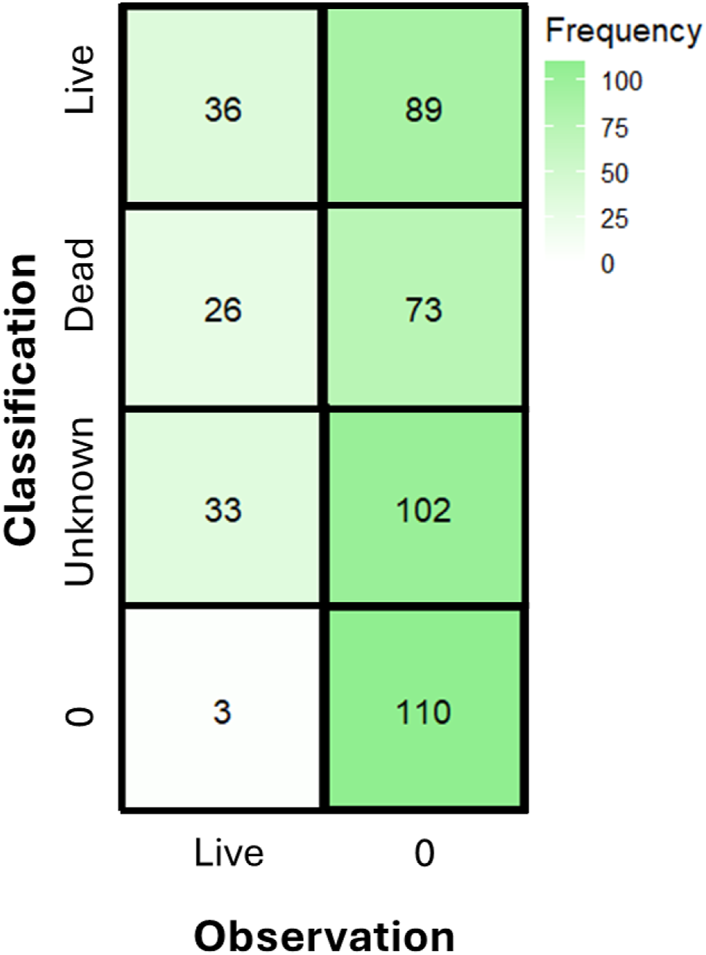
Confusion matrix from the model demonstrates that the majority of classifications were not identified by the model, primarily “unknown” oysters. A classification or observation of “0” denotes a false positive or missed observation.
FIGURE 4
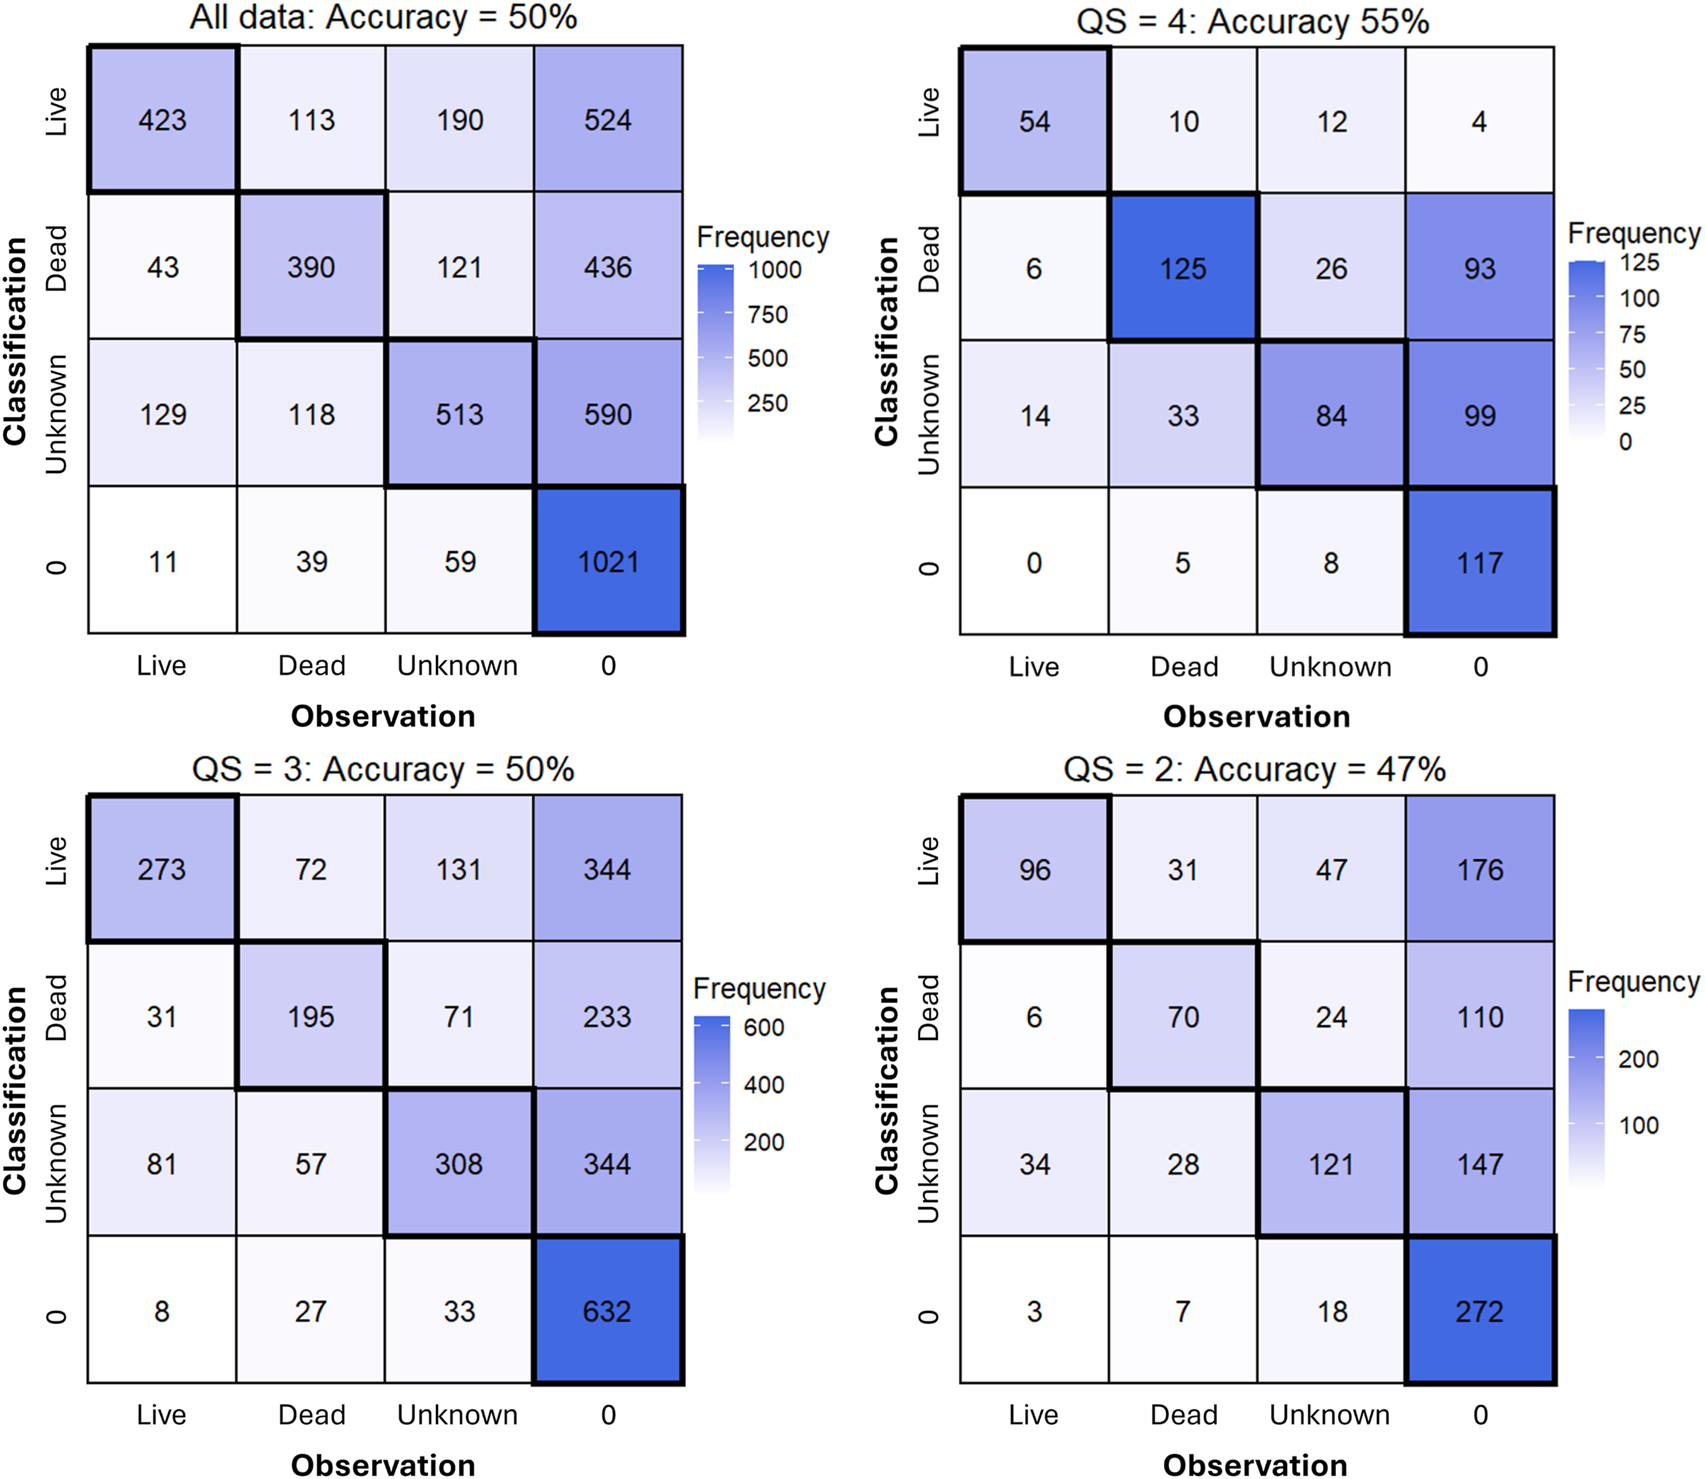
Confusion matrices from all data across expert and non-expert annotators (top left) and separated by QS show an increase in prediction accuracy and reduction in false positive detections (denoted as ‘0’) with increasing QS.
To standardize outcomes between the model and human annotators, we simplified all observations and classifications to ‘live’ or ‘not observed.’ Using these criteria in the independent observations of the 30 images subsampled, 91 live oysters (CS = 0.41 0.18) and 190 false detections were made. The model made 98 live observations and 47% were correct. Experts with an average 72.2 67.5 live observations accurately predicted 48% of live classifications and non-expert made 49 24.5 live observations and were correct 40% of the time. From the confusion matrices, when all annotator groups were pooled, there was 74% accuracy among correct or true negative observations (live detections, F1 = 0.52, Pre = 0.44, Rec = 0.63). Experts (Acc = 73%; live detections, F1 = 0.54, Pre = 0.48, Rec = 0.61) and non-experts (Acc = 76%; live detections, F1 = 0.52, Pre = 0.40, Rec = 0.74) generally had improved performance compared to the model (Acc = 63%; live detections, F1 = 0.46, Pre = 0.47, Rec = 0.44). The accuracy and receiver operating characteristics (ROC) are more ideal across higher QS for expert and non-experts and have the opposite effect on the model (Figure 5). Similarly, all annotator groups demonstrate a skew towards more false positive detections, with the model generating the largest deviance, followed by experts, the average across all annotators, then non-experts.
FIGURE 5
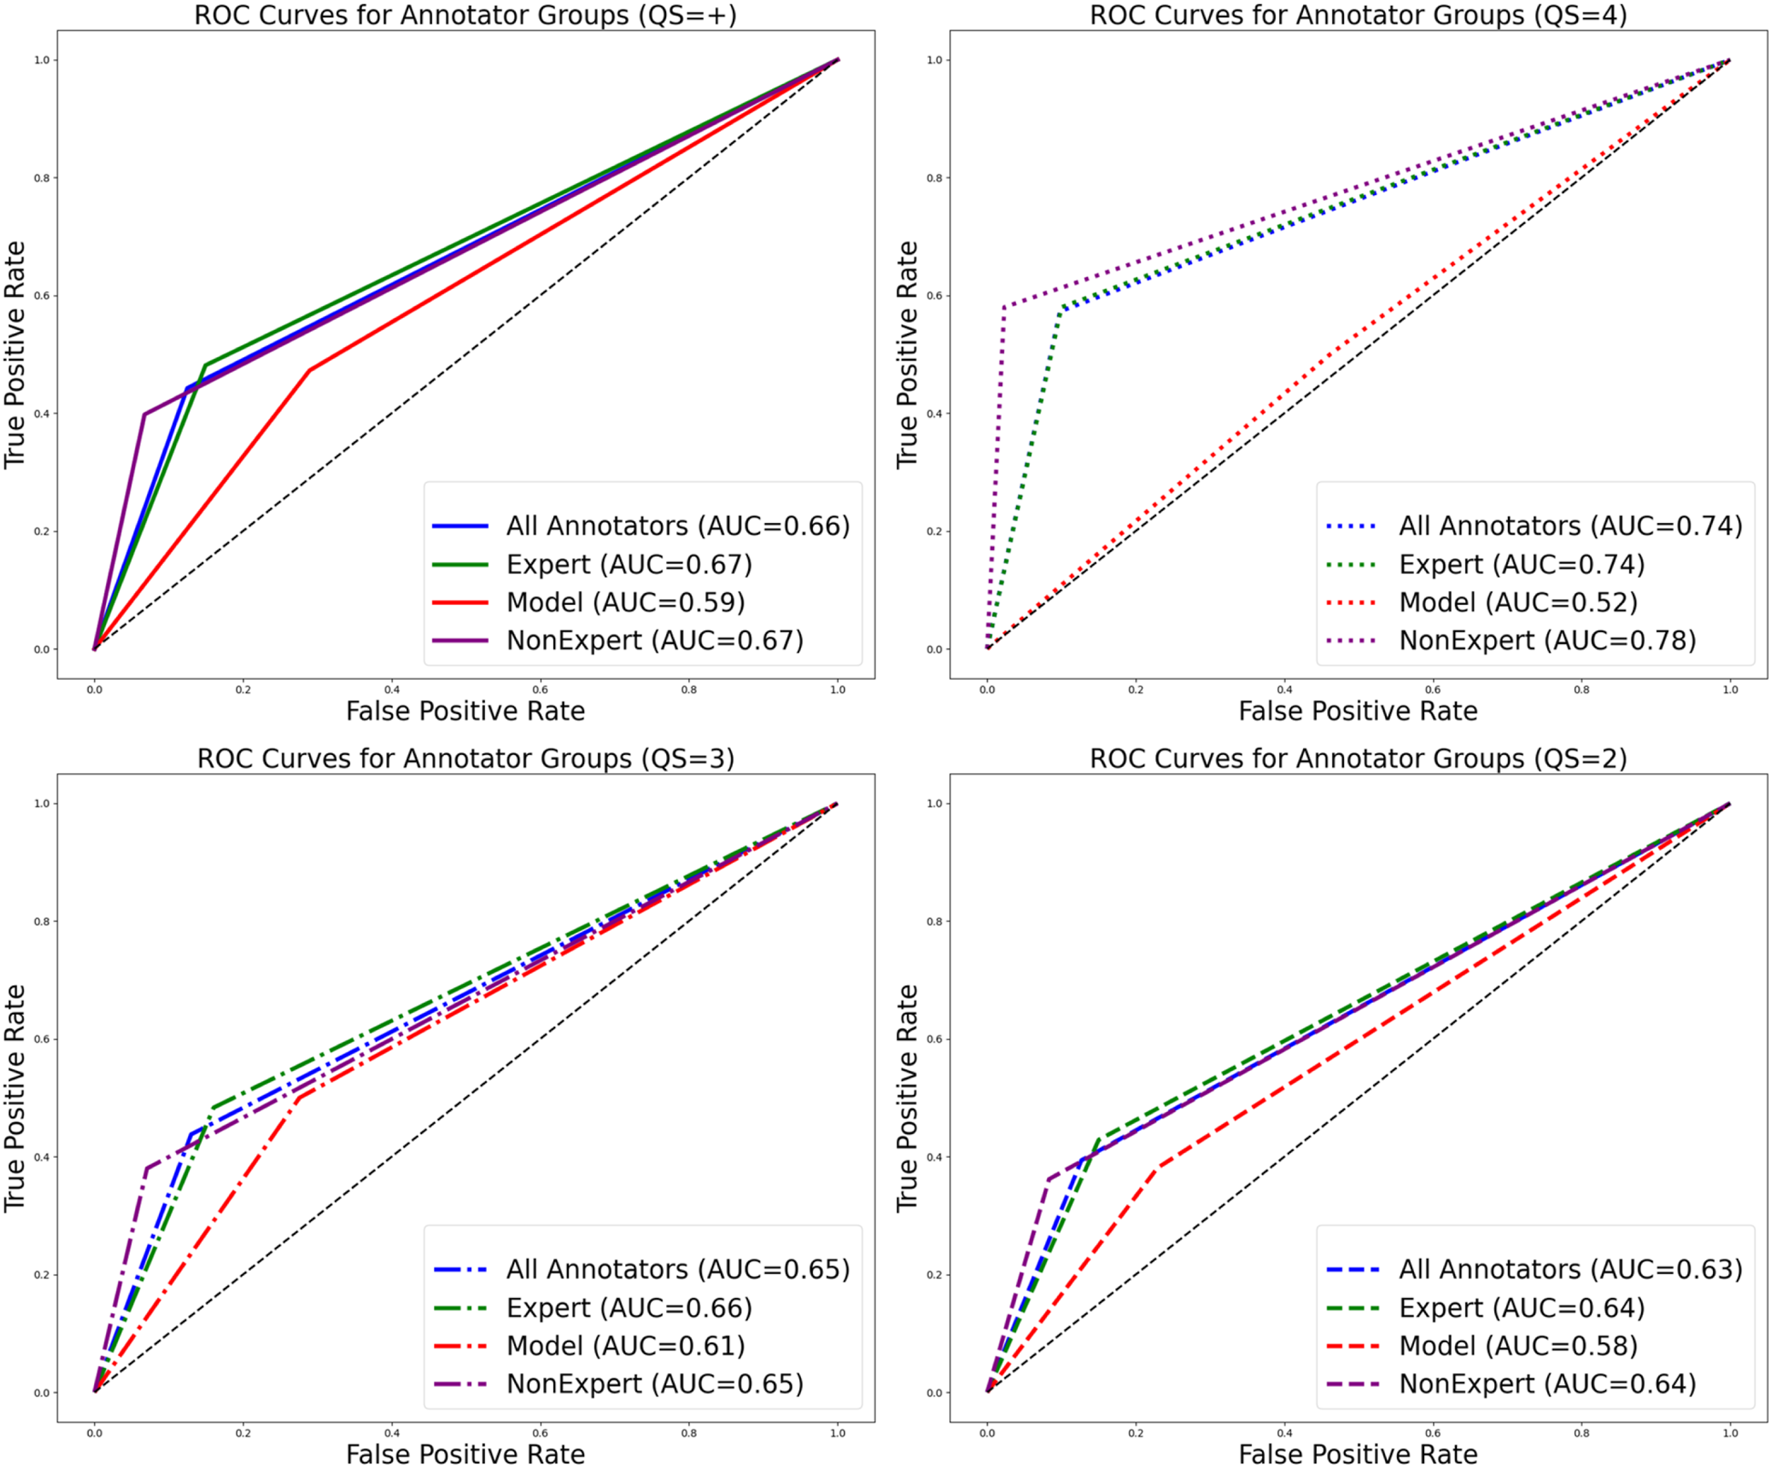
Receiver Operating Characteristic (ROC) curve plots including the dataset where all observations and classifications were simplified to ‘live’ or ‘not observed’ for all annotator groups. Plots and line types are separated by quality score and color is separated by annotator group. Data including all QSs is represented in the top left plot. Higher area under the curve values observed with increasing QS for expert and non-expert annotators and lower area under the curve values observed for the model with increasing QS.
4 Discussion
In this study, we evaluated the ability of a developed DL model to distinguish and quantify living oysters from their surroundings accurately. We then compared the performance of the DL model to observations made by expert and non-expert annotators. Accurately identifying oysters using automated detection models would greatly improve the efficiency and cost of reef surveying, permitting greater scalability. While the image processing time was immediate and can run in situ (Lin et al., 2025), the model greatly over-predicted the presence of live oysters with poor consistency (ICC = 0.430, ), lower accuracy, and higher false positive rates (Acc = 63%, AUC = 0.59) compared to expert (Acc = 73%, AUC = 0.67) and non-expert annotators (Acc = 76%, AUC = 0.67). Between human groups, experts annotated images almost twice as fast. They made more accurate observations than non-experts, but had a greater false negative rate and a less balanced skew between accurate and false detections. There was a considerable difference in accuracy with image quality, highlighting a gap in the current training process for the model. Human annotators had an overall increasing accuracy in detecting live and dead oysters as image quality increased, while the model was less accurate when image quality increased.
The ODYSSEE model provides a valuable estimate of living oysters in reefs by identifying the presence of live and dead animals within a dense aggregation of shells, a functional need for an abundant reef to be present. However, a stronger differentiation between live and dead oysters during the annotation process is required to properly quantify living oyster abundance and act as a reliable quantitative tool for oyster reef censusing for aquaculture, fisheries, and restoration applications. Still, estimating oyster shell density can be used for analysis in areas of large, living oyster aggregations where relative measures of abundance are sufficient. Having a relative abundance metric can be useful for on-bottom oyster farmers and the wild capture fishery to more efficiently site harvestable beds using imagery coupled with GPS data. The concept of constructing an oyster distribution map through ROV operation was simulated using the OysterSim model (Lin et al., 2022), and when applying the proposed framework ShellCollect, by Wang et al. (2024), the map can be used to generate an optimal harvesting path. The current stage of ODYSSEE likely provides sufficient context to develop harvest paths using these existing frameworks, and the continued improvements to ODYSSEE will better resolve the efficiency of the harvest paths generated. These maps can also be implemented in restoration efforts to determine locations to strategically replenish shell to support reef development and support other local fisheries Marquardt et al. (2025) by targeting areas of low relative oyster density. Beyond harvest path planning, alterations to the ODYSSEE model for pure detection of oyster shell substrate could prove valuable to site selection for both habitat restoration (George et al., 2015; Hughes et al., 2023) and oyster larval planting efforts (Spires et al., 2023).
Several considerations in our annotating procedures and data processing should be acknowledged for future studies. First, when annotating oysters in situ using photogrammetry methods, the presence of dead oysters that are forced shut from trapped sediment (referred to as ‘mudders’) would likely be counted as a live oyster in any computer-based survey method, inflating the number of live oysters counted in a study compared to hand-grading methods, where manual assessments post-harvest can detect mudders by feeling for atypical density and differences in sound emitted when hit against a known live oyster. Another source of error could be attributed to the variable gaping behavior of oysters when they feed, which may be indistinguishable from dead oysters, providing a source of disagreement between annotators and potential error when counting live individuals. Although ICC analyses provide some context and can establish relative consistency through future model iterations, manually analyzing all unique observations across all annotators provides a more precise assessment of consistency since ICC metrics rely on perfect agreement from an image scale rather than an individual identification scale, although manually checking unique observations for a more in-depth analysis is time-consuming and tedious.
To improve model performance, the number of false negative and false positive observations need to be reduced and consistency between the model and human annotators needs to increase. Qualitatively, most false positives were caused by rocks, mussels, and shadows. A potential avenue is to use a larger percentage of live imagery in our training datasets. ODYSSEE is currently trained using 30% real oyster images and 70% synthetic oyster images (Lin et al., 2025). Although incorporating synthetic data helps to provide a larger training dataset, it can overlook features of oysters noticeable in natural imagery, reducing precision (Nowruzi et al., 2019; Corvi et al., 2023; Wang and Perez, 2017). Furthermore, providing additional higher-quality imagery and determining an intentional distribution of image quality to the existing training dataset would likely improve model performance by providing more variable content for the model to learn from. Furthermore, several annotators should annotate real images, and the associated CS classification should provide context for clear and less clear observations (Sullivan et al., 2018). Lastly, providing additional annotations to the detection model (i.e., dead, unknown, and other objects such as mussels, rocks, and debris), and better quantifying sources of false positive detections can be a possible solution to minimize false positive detections (Shorten and Khoshgoftaar, 2019).
While comparing model accuracy to expert and non-expert annotators provides some context on model performance using a relative measure of a live oyster, a more valid ground-truth with known live oysters would be a more insightful test of model performance. A comparison to hand-counted living oysters in a reef setting would be an ideal method for making model accuracy assessments. However, such an assessment would be difficult and costly to perform. This methodology is frequently used in terrestrial landscapes, although there are considerably fewer logistical barriers (Shah et al., 2024).
Our study demonstrates the potential of DL models to automate oyster detection from underwater imagery, offering a non-invasive alternative to traditional, labor-intensive monitoring methods like dredging. By integrating real and synthetic data for training, we reduce reliance on destructive sampling while improving the efficiency and accessibility of reef assessments under variable conditions. These advances have broad applications, benefiting restoration and fisheries management efforts, where frequent and minimally invasive monitoring is essential. This approach has promise for oyster farmers looking to utilize technology to reduce labor demands and streamline aquaculture operations. Using tools that reduce processing time provides a foundation for sustainable reef management while supporting the growing intersection of aquaculture and technology.
Statements
Data availability statement
The datasets presented in this study can be found in online repositories. The names of the repository/repositories and accession number(s) can be found below: https://github.com/Campbellb13-UD/OysterDetectionValidation.
Ethics statement
The manuscript presents research on animals that do not require ethical approval for their study.
Author contributions
BC: Conceptualization, Data curation, Formal Analysis, Investigation, Methodology, Project administration, Validation, Visualization, Writing – original draft, Writing – review and editing. AW: Conceptualization, Formal Analysis, Investigation, Methodology, Project administration, Resources, Writing – original draft, Writing – review and editing. KB: Conceptualization, Data curation, Investigation, Methodology, Project administration, Resources, Software, Supervision, Writing – original draft, Writing – review and editing. AC: Investigation, Validation, Writing – review and editing, Data curation. RD: Formal Analysis, Investigation, Visualization, Writing – review and editing, Data curation. RH: Data curation, Investigation, Project administration, Resources, Writing – review and editing, Formal Analysis. XL: Conceptualization, Data curation, Methodology, Project administration, Resources, Software, Writing – review and editing. VM: Conceptualization, Methodology, Supervision, Writing – review and editing. BN: Conceptualization, Data curation, Investigation, Writing – review and editing, Formal Analysis. AS: Data curation, Investigation, Methodology, Resources, Writing – original draft, Writing – review and editing, Project administration, Formal Analysis. AV: Conceptualization, Data curation, Investigation, Writing – review and editing. AT: Funding acquisition, Resources, Supervision, Writing – review and editing. HT: Funding acquisition, Resources, Supervision, Writing – review and editing. EH: Data curation, Funding acquisition, Investigation, Resources, Supervision, Writing – review and editing.
Funding
The author(s) declare that financial support was received for the research and/or publication of this article. This material is based upon work supported by the US Army Corps of Engineers, ERDC Contracting Office under Contract No.W912HZ-22-2 0015, “Transforming Shellfish Farming with Smart Technology and Management Practices for Sustainable Production” grant no. 2020-68012-31805/project accession no. 1023149 from the USDA National Institute of Food and Agriculture, grant G23AC00149-00 from the USGS Next Generation Water Observing System (NGWOS) Research and Development program, and NOAA’s Project ABLE via award number NA22OAR4690620-T1-01. Any opinions, findings, conclusions, or recommendations expressed in this material are those of the author(s) and do not necessarily reflect the views of the US Army Corps of Engineers, ERDC Contracting Office or the U.S. Department of Agriculture.
Acknowledgments
We would like to acknowledge the various funding agencies that supported this work and the Autonomous Systems Bootcamp (ASB) for providing the opportunity for this global interdisciplinary collaboration. Furthermore, we thank Matthew Gray and Yiannis Aloimonos for their support and mentorship and Maxwell Collins for providing technical support during fieldwork and in processing some of the preliminary imagery.
Conflict of interest
The authors declare that the research was conducted in the absence of any commercial or financial relationships that could be construed as a potential conflict of interest.
Generative AI statement
The author(s) declare that no Generative AI was used in the creation of this manuscript.
Publisher’s note
All claims expressed in this article are solely those of the authors and do not necessarily represent those of their affiliated organizations, or those of the publisher, the editors and the reviewers. Any product that may be evaluated in this article, or claim that may be made by its manufacturer, is not guaranteed or endorsed by the publisher.
References
1
Ambrose A. Munroe D. (2024). Habitat usage on an oyster aquaculture farm: impacts of farm activities and biological fouling on marine communities. J. Shellfish Res.43, 389–397. 10.2983/035.043.0310
2
Anchondo Z. B. Tracy A. M. Raza A. Meckler K. A. Ogburn M. B. (2024). Reefs in no-take reserves host more oysters, macroparasites, and macrofauna than harvested reefs across an estuarine salinity gradient. Mar. Ecol. Prog. Ser.739, 65–83. 10.3354/meps14615
3
Andrews J. D. (1988). Epizootiology of the disease caused by the oyster pathogen perkinsus marinus and its effects on the oyster industry. Am. Fish. Soc.18. Available online at: https://ir.library.oregonstate.edu/concern/articles/qz20t046m.pdf.pdf.
4
Armbruster A. D. Mercaldo-Allen R. Rose J. M. Seda K. Clark P. Phillips G. et al (2024). Territorial and occupancy behavior of black sea bass on oyster aquaculture gear and boulder habitat. Front. Mar. Sci.11. 10.3389/fmars.2024.1380484
5
Beck M. W. Brumbaugh R. D. Airoldi L. Carranza A. Coen L. D. Crawford C. et al (2011). Oyster reefs at risk and recommendations for conservation, restoration, and management. Bioscience61, 107–116. 10.1525/bio.2011.61.2.5
6
Bennett A. (2024). Assessing unoccupied aircraft and ground-based methods for detecting differences in intertidal oyster (Crassostrea virginica) reef structure. Master’s thesis, Univ. North Fla.Available online at: https://digitalcommons.unf.edu/etd/1313.pdf.
7
Boom B. J. He J. Palazzo S. Huang P. X. Beyan C. Chou H. M. et al (2014). A research tool for long-term and continuous analysis of fish assemblage in coral-reefs using underwater camera footage. Ecol. Inf.23, 83–97. 10.1016/j.ecoinf.2013.10.006
8
Botta R. Asche F. Borsum J. S. Camp E. V. (2020). A review of global oyster aquaculture production and consumption. Mar. Policy117, 103952. 10.1016/j.marpol.2020.103952
9
Burt I. McGurk E. Bushek D. (2023). Delaware bay New Jersey oyster seedbed monitoring program 2022 status report. Tech. rep., Rutgers Haskin Shellfish Res. Laboratory.
10
Campbell B. Gurbisz C. Testa J. M. Hale E. Gray M. W. (2025). Assessing the spatial variability of cage movement and velocity attenuation of an off-bottom oyster farm and its influence on eastern oyster (crassostrea virginica) growth performance. Aquaculture595, 741701. 10.1016/j.aquaculture.2024.741701
11
Carranza A. zu Ermgassen P. S. (2020). A global overview of restorative shellfish mariculture. Front. Mar. Sci.7. 10.3389/fmars.2020.00722
12
Connolly R. M. Herrera C. Rasmussen J. Buelow C. A. Sievers M. Jinks K. I. et al (2024). Estimating enhanced fish production on restored shellfish reefs using automated data collection from underwater videos. J. Appl. Ecol.61, 633–646. 10.1111/1365-2664.14617
13
Corvi R. Cozzolino D. Zingarini G. Poggi G. Nagano K. Verdoliva L. (2023). “On the detection of synthetic images generated by diffusion models,” in ICASSP 2023-2023 IEEE international conference on acoustics, speech and signal processing (ICASSP) (IEEE), 1–5.
14
DNREC (2023). 2023 survey of natural oyster beds. Tech. rep., Del. Dep. Nat. Resouces Environ. Control.
15
Dwyer B. Nelson J. Hansen T. , (2024). Roboflow
16
English G. Lawrence M. J. McKindsey C. W. Lacoursière-Roussel A. Bergeron H. Gauthier S. et al (2024). A review of data collection methods used to monitor the associations of wild species with marine aquaculture sites. Rev. Aquac.16, 1160–1185. 10.1111/raq.12890
17
Fernandes S. Dmello A. (2024). Artificial intelligence in the aquaculture industry: current state, challenges and future directions. Aquaculture598, 742048. 10.1016/j.aquaculture.2024.742048
18
George L. M. De Santiago K. Palmer T. A. Beseres Pollack J. (2015). Oyster reef restoration: effect of alternative substrates on oyster recruitment and nekton habitat use. J. Coast. Conservation19, 13–22. 10.1007/s11852-014-0351-y
19
Grabowski J. H. Baillie C. J. Baukus A. Carlyle R. Fodrie F. J. Gittman R. K. et al (2022). Fish and invertebrate use of restored vs. natural oyster reefs in a shallow temperate latitude estuary. Ecosphere13, 1–17. 10.1002/ecs2.4035
20
Harding J. M. Mann R. (2001). Oyster reefs as fish habitat: opportunistic use of restored reefs by transient fishes. J. Shellfish Res.20, 951–959.
21
Haskin H. H. Ford S. E. (1982). Haplosporidium nelsoni (msx) on Delaware bay seed oyster beds: a host-parasite relationship along a salinity gradient. J. Invertebr. Pathology40, 388–405. 10.1016/0022-2011(82)90178-1
22
Heggie K. Ogburn M. B. (2021). Rapid video assessment detects qualitative differences in oyster reef habitat. Mar. Ecol. Prog. Ser.667, 219–224. 10.3354/meps13708
23
Hemraj D. A. Bishop M. J. Hancock B. Minuti J. J. Thurstan R. H. Ermgassen P. S. E. Z. et al (2022). Oyster reef restoration fails to recoup global historic ecosystem losses despite substantial biodiversity gain. Sci. Adv.8, 8747. 10.1126/sciadv.abp8747
24
Heo J.-M. Kim S.-S. Kim D.-Y. Lee S. W. Lee J. S. Kang M. H. et al (2023). Impact of exposure temperature rise on mass mortality of tidal flat pacific oysters. Front. Mar. Sci.10. 10.3389/fmars.2023.1275521
25
Hernández A. B. Brumbaugh R. D. Frederick P. Grizzle R. Luckenbach M. W. Peterson C. H. et al (2018). Restoring the eastern oyster: how much progress has been made in 53 years?Front. Ecol. Environ.16, 463–471. 10.1002/fee.1935
26
Hoellein T. J. Zarnoch C. B. Grizzle R. E. (2015). Eastern oyster (crassostrea virginica) filtration, biodeposition, and sediment nitrogen cycling at two oyster reefs with contrasting water quality in great bay estuary (New Hampshire, USA). Biogeochemistry122, 113–129. 10.1007/s10533-014-0034-7
27
Hornick K. M. Plough L. V. (2022). Genome-wide analysis of natural and restored eastern oyster populations reveals local adaptation and positive impacts of planting frequency and broodstock number. Evol. Appl.15, 40–59. 10.1111/eva.13322
28
Huang Y.-P. Khabusi S. P. (2025). Artificial intelligence of things (aiot) advances in aquaculture: a review. Processes13, 73. 10.3390/pr13010073
29
Hughes A. Bonačić K. Cameron T. Collins K. Da Costa F. Debney A. et al (2023). Site selection for European native oyster (Ostrea edulis) habitat restoration projects: an expert‐derived consensus. Aquatic conservation Mar. Freshw. Ecosyst.33, 721–736. 10.1002/aqc.3917
30
Jensen O. P. Vastano A. R. Allen M. C. Hernandez M. F. Lockwood J. L. Vasslides J. M. et al (2024). Migratory passage and run size of american shad and river herring in the raritan river, New Jersey, USA. Trans. Am. Fish. Soc.153, 289–300. 10.1002/tafs.10467
31
Kannappan P. Walker J. H. Trembanis A. Tanner H. G. (2014). Identifying sea scallops from benthic camera images. Limnol. Oceanogr. Methods12, 680–693. 10.4319/lom.2014.12.680
32
Kitsikoudis V. Kibler K. M. Walters L. J. (2020). In-situ measurements of turbulent flow over intertidal natural and degraded oyster reefs in an estuarine lagoon. Ecol. Eng.143, 105688. 10.1016/j.ecoleng.2019.105688
33
Lin X. Jha N. Joshi M. Karapetyan N. Aloimonos Y. Yu M. (2022). “Oystersim: underwater simulation for enhancing oyster reef monitoring,” in OCEANS 2022, hampton roads (IEEE), 1–6.
34
Lin X. Mange V. Suresh A. Neuberger B. Palnitkar A. Campbell B. et al (2025). “Odyssee: oyster detection yielded by sensor systems on edge electronics,” in In proceedeings of the IEEE international conference on robotics and automation. (in print).
35
Lowe S. C. Misiuk B. Xu I. Abdulazizov S. Baroi A. R. Bastos A. C. et al (2025). Benthicnet: a global compilation of seafloor images for deep learning applications. Sci. Data12, 230. 10.1038/s41597-025-04491-1
36
Marquardt A. R. Southworth M. Scheld A. M. Button A. Mann R. (2025). Oyster reef recovery: impacts of rotational management and restoration efforts on public fishing grounds. J. Environ. Manag.375, 124179. 10.1016/j.jenvman.2025.124179
37
McAfee D. McLeod L. D. Carruthers S. Connell S. D. (2024). Reversing functional extinction: successful restoration of eradicated oyster reefs. Restor. Ecol.32. 10.1111/rec.14169
38
McFarland K. Vignier J. Standen E. Volety A. (2022). Synergistic effects of salinity and temperature on the eastern oyster crassostrea virginica throughout the lifespan. Mar. Ecol. Prog. Ser.700, 111–124. 10.3354/meps14178
39
Mercaldo-Allen R. Auster P. J. Clark P. Dixon M. S. Estela E. Liu Y. et al (2023). Oyster aquaculture cages provide fish habitat similar to natural structure with minimal differences based on farm location. Front. Mar. Sci.10. 10.3389/fmars.2023.1058709
40
Michaelis A. K. Walton W. C. Webster D. W. Shaffer L. J. (2021). Cultural ecosystem services enabled through work with shellfish. Mar. Policy132, 104689. 10.1016/j.marpol.2021.104689
41
Neokye E. O. Wang X. Thakur K. K. Quijon P. Nawaz R. A. Basheer S. (2024). Climate change impacts on oyster aquaculture - part i: identification of key factors. Environ. Res.251, 118561. 10.1016/j.envres.2024.118561
42
Newell R. I. Koch E. W. (2004). Modeling seagrass density and distribution in response to changes in turbidity stemming from bivalve filtration and seagrass sediment stabilization. Estuaries27, 793–806. 10.1007/bf02912041
43
NMFS (2023). Pacific oyster: aquaculture. Tech. rep., Natl. Ocean. Atmos. Adm. Natl. Mar. Fish. Serv.
44
Nowruzi F. E. Kapoor P. Kolhatkar D. Hassanat F. A. Laganiere R. Rebut J. (2019). How much real data do we actually need: analyzing object detection performance using synthetic and real data. arXiv Prepr. arXiv:1907, 07061. 10.48550/arXiv.1907.07061
45
Padole A. M. Sagar P. Westra S. J. Lim R. Nimkin K. Kalra M. K. et al (2019). Development and validation of image quality scoring criteria (iqsc) for pediatric ct: a preliminary study. Insights into Imaging10, 95. 10.1186/s13244-019-0769-8
46
Petton B. Destoumieux-Garzón D. Pernet F. Toulza E. de Lorgeril J. Degremont L. et al (2021). The pacific oyster mortality syndrome, a polymicrobial and multifactorial disease: state of knowledge and future directions. Front. Immunol.12, 1–10. 10.3389/fimmu.2021.630343
47
Peyre M. K. L. Serra K. Joyner T. A. Humphries A. (2015). Assessing shoreline exposure and oyster habitat suitability maximizes potential success for sustainable shoreline protection using restored oyster reefs. PeerJ3, e1317. 10.7717/peerj.1317
48
Rasmussen C. Zhao J. Ferraro D. Trembanis A. (2017). “Deep census: auv-based scallop population monitoring,” in Proceedings of the IEEE international conference on computer vision (ICCV) workshops.
49
Ray N. E. Fulweiler R. W. (2021). Meta-analysis of oyster impacts on coastal biogeochemistry. Nat. Sustain.4, 261–269. 10.1038/s41893-020-00644-9
50
Rodney W. S. Paynter K. T. (2006). Comparisons of macrofaunal assemblages on restored and non-restored oyster reefs in mesohaline regions of chesapeake bay in Maryland. J. Exp. Mar. Biol. Ecol.335, 39–51. 10.1016/j.jembe.2006.02.017
51
Rombach R. Blattmann A. Lorenz D. Esser P. Ommer B. (2022). High-resolution image synthesis with latent diffusion models, 10674, 10685. 10.1109/cvpr52688.2022.01042
52
Rothschild B. J. Ault J. S. Goulletquer P. Héral M. (1994). Decline of the chesapeake bay oyster population: a century of habitat destruction and overfishing. Mar. Ecol. Prog. Ser.111, 29–39. 10.3354/meps111029
53
Scyphers S. B. Powers S. P. Heck K. L. Byron D. (2011). Oyster reefs as natural breakwaters mitigate shoreline loss and facilitate fisheries. PLoS ONE6, e22396. 10.1371/journal.pone.0022396
54
Shah J. Kothari S. Verma J. Papakostas G. A. (2024). Leveraging ground truth data and gis technologies for reliable crop analysis and agricultural production optimization. Int. J. Inf. Technol.16, 5247–5259. 10.1007/s41870-024-02101-8
55
Shorten C. Khoshgoftaar T. M. (2019). A survey on image data augmentation for deep learning. J. big data6, 60–48. 10.1186/s40537-019-0197-0
56
Smith C. S. Kochan D. P. Neylan I. P. Gittman R. K. (2024). Living shorelines equal or outperform natural shorelines as fish habitat over time: updated results from a long-term baci study at multiple sites. Estuaries Coasts47, 2655–2669. 10.1007/s12237-024-01429-5
57
Southworth M. (2024). Virginia oyster stock assessment and replenishment archive (VOSARA). Tech. Rep. Va. Mar. Resour. Comm.
58
Spires J. E. North E. W. Westby S. R. Steppe C. N. Dumhart J. M. Hildebrandt S. S. (2023). Direct setting of eastern oyster (crassostrea virginica) larvae confirmed with calcein, a fluorochrome dye. Estuaries Coasts46, 723–739. 10.1007/s12237-023-01178-x
59
Sullivan D. P. Winsnes C. F. Åkesson L. Hjelmare M. Wiking M. Schutten R. et al (2018). Deep learning is combined with massive-scale citizen science to improve large-scale image classification. Nat. Biotechnol.36, 820–828. 10.1038/nbt.4225
60
Tarnowski M. (2024). Maryland oyster population status report 2023 fall survey. Tech. rep., Md. Department Nat. Resour.
61
Testa J. M. Brady D. C. Cornwell J. C. Owens M. S. Sanford L. P. Newell C. R. et al (2015). Modeling the impact of floating oyster (crassostrea virginica) aquaculture on sediment-water nutrient and oxygen fluxes. Aquac. Environ. Interact.7, 205–222. 10.3354/aei00151
62
Walker J. H. Trembanis A. C. Miller D. C. (2016). Assessing the use of a camera system within an autonomous underwater vehicle for monitoring the distribution and density of sea scallops (placopecten magellanicus) in the mid-atlantic bight. Fish. Bull.114, 261–273. 10.7755/fb.114.3.1
63
Walles B. Mann R. Ysebaert T. Troost K. Herman P. M. Smaal A. C. (2015). Demography of the ecosystem engineer crassostrea gigas, related to vertical reef accretion and reef persistence. Estuar. Coast. Shelf Sci.154, 224–233. 10.1016/j.ecss.2015.01.006
64
Wang C.-Y. Nandhan A. G. Shen Y.-T. Chen W.-Y. Kumar S. S. S. Long A. et al (2024). Shellcollect: a framework for smart precision shellfish harvesting using data collection path planning. IEEE Access12, 177829–177843. 10.1109/access.2024.3505849
65
Wang J. Perez L. , (2017). The effectiveness of data augmentation in image classification using deep learning. Convolutional Neural Netw. Vis. Recognit.11, 1–8. 10.48550/arXiv.1712.04621
66
Wiltsee L. E. (2023). Determining feeding rates in eastern oysters (Crassostrea virginica) using natural seston flow-through system. College Park: University of Maryland. Master’s thesis.
67
Windle A. E. Poulin S. K. Johnston D. W. Ridge J. T. (2019). Rapid and accurate monitoring of intertidal oyster reef habitat using unoccupied aircraft systems and structure from motion. Remote Sens.11, 2394. 10.3390/rs11202394
68
Zhang L. Rao A. Agrawala M. (2023). Adding conditional control to text-to-image diffusion models, 3813, 3824. 10.1109/iccv51070.2023.00355
69
zu Ermgassen P. S. Spalding M. D. Grizzle R. E. Brumbaugh R. D. (2013). Quantifying the loss of a marine ecosystem service: filtration by the eastern oyster in us estuaries. Estuaries Coasts36, 36–43. 10.1007/s12237-012-9559-y
Summary
Keywords
oyster aquaculture, deep learning, image identification, YOLOv10, confusion matrix, reef ecology
Citation
Campbell B, Williams A, Baxevani K, Campbell A, Dhoke R, Hudock RE, Lin X, Mange V, Neuberger B, Suresh A, Vera A, Trembanis A, Tanner HG and Hale E (2025) Is AI currently capable of identifying wild oysters? A comparison of human annotators against the AI model, ODYSSEE. Front. Robot. AI 12:1587033. doi: 10.3389/frobt.2025.1587033
Received
03 March 2025
Accepted
08 May 2025
Published
06 June 2025
Volume
12 - 2025
Edited by
Eleni Kelasidi, NTNU, Norway
Reviewed by
Jonathan M. Aitken, The University of Sheffield, United Kingdom
Martin Føre, Norwegian University of Science and Technology, Norway
Updates
Copyright
© 2025 Campbell, Williams, Baxevani, Campbell, Dhoke, Hudock, Lin, Mange, Neuberger, Suresh, Vera, Trembanis, Tanner and Hale.
This is an open-access article distributed under the terms of the Creative Commons Attribution License (CC BY). The use, distribution or reproduction in other forums is permitted, provided the original author(s) and the copyright owner(s) are credited and that the original publication in this journal is cited, in accordance with accepted academic practice. No use, distribution or reproduction is permitted which does not comply with these terms.
*Correspondence: Brendan Campbell, bpc@udel.edu; Alan Williams, awilliams@umces.edu; Kleio Baxevani, kleio@umd.edu
Disclaimer
All claims expressed in this article are solely those of the authors and do not necessarily represent those of their affiliated organizations, or those of the publisher, the editors and the reviewers. Any product that may be evaluated in this article or claim that may be made by its manufacturer is not guaranteed or endorsed by the publisher.