 Daniel E. Osorio-Macías
 Raúl Ferrer-Gallego
 Jaeyeong Choi4
 Björn Bergenståhl
- 1Division of Food and Pharma, Department of Process and Life Science Engineering, Faculty of Engineering, Lund University, Lund, Sweden
- 2School of Chemistry, Faculty of Pure and Natural Sciences, Universidad Mayor de San Andrés, La Paz, Bolivia
- 3Department of Ecology, Desertification Research Centre (CIDE-CSIC-UV-GV), Valencia, Spain
- 4Department of Chemistry, Hannam University, Daejeon, Republic of Korea
Colloids and macromolecules are the major compounds in wine particulate matter and play an important role in many wine properties that change during the winemaking process. However, methodologies are lacking to characterize and quantify the changes these compounds undergo throughout the process. This work uses asymmetric flow-field fractionation coupled to multiple detectors (AF4–MALS–dRI–UV) to separate, characterize, and quantify colloidal and macromolecular properties. Furthermore it provides useful information on the evolution and dynamics of these colloidal and macromolecular fractions throughout five winemaking stages. The results showed that the (AF4–MALS–dRI–UV) technique allows monitoring changes in specific colloidal and macromolecular properties during the winemaking process. In this study, three populations were separated and classified according to their nature and main properties throughout the winemaking process. It was observed that concentration, c, and specific absorptivity (ɛ) tend to vary more depending on the wine variety and the vinification stage. However, the maturation and aging stages tended to stabilize changes in the early stages. In contrast, properties such as hydrodynamic radius (rH), molar mass (MW) and regularly the apparent density (
1 Introduction
Wine colloids and wine macromolecules are the major compounds present in the wine particle matter. These colloidal compounds play a significant role during the winemaking process, i.e., through the transfer of the must (Alexandre et al., 1997), in the sedimentation of the lees (De Iseppi et al., 2021), throughout the filtration and aging (Charpentier et al., 2004; Coelho et al., 2018), in wine stability, i.e., tartaric precipitations, color stability (Coelho et al., 2017), haze and precipitate formation (Poncet-Legrand et al., 2007; Riou et al., 2002). In addition, the interactions between these colloidal and macromolecular compounds also influence the sensory properties such as flavour, palatability, astringency, smoothness, and bitterness (Vidal et al., 2004) and, finally by determining the final quality of the wine product (Marangon et al., 2022).
Wine colloids largely include complexes of condensed tannins, made up particularly of anthocyanins and flavanols derived from grapes, which are highly reactive and able to bind colloidal proteins (Marangon et al., 2024) and originated from the grapes or yeast autolysis (Doco et al., 2003; Ribereau-Gayon et al., 2006a). The particles also include carbohydrate components, like arabinogalactans (type I and II) (Ferreira et al., 2001), rhamnogalacturonans (type I and II) (Escot et al., 2001; Jones-Moore et al., 2022). The proteins include carbohydrate moieties such as mannoproteins and glycoproteins, representing around 30% of the total polysaccharide content with a molar mass up to 800 kDa (Saulnier et al., 1991).
The macromolecular and colloidal materials change and evolve throughout the vinification procedures (Nunan et al., 2001). Other factors that influence the composition are the microorganisms present (Saccharomyces cerevisiae, Oenococcus oeni, and Lactobacillus plantarum), the type or aging technique (sometimes using wood), the length of the aging period, and the storage method used (Ribereau-Gayon et al., 2006b).
Recently, a few investigations have been published using asymmetric field-flow fractionation (AF4) coupled with multiple detectors as a novel technique to allow to fractionate the wine particle matter and characterize wine colloids and macromolecules. The advantage of using AF4 over other separation techniques is that AF4 provides low shear degradation and low sample loss. Thus, AF4 is expected to give results even for relatively large particles without altering the particle structure. Thereby, AF4 is expected to be an efficient technique to separate and characterize the wine colloids and macromolecules according to their size.
Coelho evaluated the separation efficiency between AF4 and Size Exclusion Chromatography (SEC) when characterizing the colloidal composition of a white Chardonnay wine at three different stages of vinification (Coelho et al., 2017). The results of both methods showed six fractions after separation, in which the fraction with molar masses between 30 and 60 kDa was the major fraction (fraction III in their study). Tyrosine-type protein structures were identified in this fraction. In addition, a proteomic analysis of the fraction confirmed the presence of β-glucosidases from grape and yeast cells (Vitis vinifera and S. cerevisiae). The β-glucosidases are associated with the aroma formation of the wine. Overall, more accurate separation and characterization results were achieved using the AF4-UV-MALS-dRI compared with the SEC technique since interactions with the stationary phase occurred in the latter, which may provide misleading results.
Pascotto and co-workers have published on the relationship between the colloidal fraction of wine and sensory properties such as astringency using AF4 coupled with multiple detectors in a wine model carrier (Pascotto et al., 2021). Thus, the characterization of the macromolecular data of the population distributions (UV, dRI, MALS, Mw, and fractions of AF4 of permeate and retentate) was related to data of the sensory analysis for fifty commercial red wines. The findings reported in this study showed that the astringency is proportionally related to colloidal polyphenols greater than 5 kDa. Moreover, the astringency increases as the molar mass of the colloidal polyphenols increases. In contrast, the fraction of polyphenols that were not retained and permeated did not show any contribution.
In the same direction but with a different approach, a recent study used the AF4 technique to separate and characterize wine colloids in 2 different red wine samples (Marassi et al., 2021). The fractionation results allowed them to characterize 12 fractions for both wines, where the proteins, polysaccharides, and phenolics of the colloidal particle matter were chemically analysed by adapting methods already established and related to the radius of gyration ranging between 25 and 50 nm. Moreover, the results of the chemical characterization before and after the fractionation were compared, suggesting possible explanations regarding the interactions and structural formations that can occur in the different fractions as well as the proportions of the different compounds found, such as, for example, that the aggregates phenolic/protein in wine colloids are present in a small radius, and that the protein content was found up to the second fraction. In contrast, the aggregates between polysaccharides and phenols showed a much higher radius. Thus, it was proposed that two types of particles coexist in the colloidal structure, one composed of covalently linked protein-phenolics that can interact by non-covalent forces with polysaccharides and another in which only polysaccharides and phenolics are present. They concluded that the proportion of these different aggregates can vary in each wine and that the relative amount depends on the grape varieties and vinification processes. Finally, Figué et al., proposed a methodology that involves the simultaneous use of AF4 coupled to ultra-high performance liquid chromatography (UHPLC) in order to analyse proteins and mannoproteins in real time using standards. The results allowed to differentiate grape varieties based on their profile and macromolecular composition. In addition, the proposed methodology demonstrated advantages since it allows the separation of samples according to their size, identifying compounds with similar hydrophobicity in addition to concentrating the sample avoiding the denaturation of the analysed proteins (Figué et al., 2024).
Thereby, the importance of describing, evaluating, and monitoring the dynamics and evolution of these compounds (and without affecting their structure) throughout the different stages of the winemaking process, followed by a characterization of their macromolecular properties, resides in being able to take the necessary actions to modify and improve the nature and composition of these colloidal and macromolecular fractions. This can allow us to generate useful information and knowledge to achieve controlled changes in their properties (fraction concentration and size-to-molar mass ratio), which ultimately affect both the stability of the wine and its sensory attributes.
An alternative method of characterization the fractions using AF4-UV-MALS-dRI by just using the standard on-line detectors has recently been proposed (Osorio-Macías et al., 2020). In addition to a macromolecular characterization (molar mass, hydrodynamic radii, and apparent density) of the fractionated populations, this methodological approach allows for online evaluation of the total concentrations and specific absorptivity to describe the nature of these fractions without chemical analyses of separated material. In the study, 6 Argentine high-altitude red wines bottled after at least 2 years of aging, were characterized. Another work using the same methodology has evaluated the changes that occur in the colloidal and macromolecular fractions during the clarification process over a raw white wine and by using different types of clarifiers to characterize the wine before and after the clarification process, in addition to the specific type of properties that are modified according to the nature of each type of clarifier, furthermore, to the understanding of the necessary dose of the clarifier added to remove specific quantities of undesired material (Osorio-Macías et al., 2022).
However, there is a lack of studies that assess and describe the changes, evolution, dynamics, and characterization of the colloidal and macromolecular compounds during the different stages of vinification. In this work, Asymmetrical Flow Field-Flow Fractionation coupled with online detection is used to monitor the evolution that occurs in the particle formation of the wine colloids and wine macromolecules after five stages of the vinification (Alcoholic fermentation, malolactic fermentation, clarification and cold stabilisation, early aging in tank followed by bottling, and finally after 1 year of aging).
The objective is to describe the dynamics of particle formation during the red wine vinification process. Furthermore, the study is intended to demonstrate the feasibility of providing useful information on changes in macromolecular properties by using only the AF4 technique coupled with on-line (AF4-UV-MALS-dRI) detection. The research is applied to each stage of vinification of six different grape varieties, revealing the potential implications of the role of each unit operation during the process.
2 Material and methods
2.1 Winemaking process and wine samples
The grapes used in this study were obtained from destemmed grapes collected in Catalonia (Spain) from the 2019 vintage. Grapes were collected manually. The grapes were loaded in boxes and transferred to the Wine Technology Centre (VITEC) for further elaboration. A further description of the samples is provided in Supplementary Materia S1. Samples of Garnacha-1 and Garnacha-2 differ in vineyard origin (both in the same appellation of origin) and harvest time. Garnacha-1 was harvested on September 28th, and Garnacha-2 on October 7th.
The grapes were destemmed and crushed, followed by an addition of 3 g/hL of SO2 (Sulphur 18, Agrovin S.A, Spain). The oenological parameters of all musts are described in Supplementary Materia S1.
All wines were processed in duplicate at pilot scale using 30 L stainless steel tanks for the alcoholic fermentation (AF). Musts from Tempranillo, Cariñena and Garnacha were inoculated (30 g/hL) by S. cerevisiae yeast VINIFERM PDM® (Agrovin, Ciudad Real, Spain) and Merlot was inoculated (30 g/hL) by S. cerevisiae yeast ANCHOR ALCHEMY® (Oenobrands SAS, Montferrier-sur-Lez, France). A fermentation aid in the form of MAXAFERM® (Oenobrands SAS, France) (cell wall material, diammonium phosphate, and tiamin) was added, 45 g/hL at the beginning of the AF process and 45 g/hL at the middle of the process. However, the sample Merlot-1 was fermented without adding the fermentation aid. The AF process was performed under a controlled temperature (22°C–28°C). The maceration was conducted throughout the AF process. The formed cap of skins and seeds were manually punched down twice daily (at 8.00 a.m. and 7.00 p.m.) during the fermentation to enhance extraction efficiency. The fermentation was finalized when the residual total sugar concentration was below 0.3 g/L. A stainless steel vertical hydraulic press separated the skins and seeds from the wine. The yield was around 65%. The fermentation kinetics and the temperature during the AF are given in the Supplementary Materia S2.
The malolactic fermentation (MLF) was made by inoculation of O. oeni bacteria (1 g/hL) using MALOFERM® PLUS (Oenobrands SAS, Montferrier-sur-Lez, France) for the Tempranillo, Cariñena and Garnacha batches and by using VINIFLORA® CH16 (Chr. Hansen Holding A/S, Hoersholm, Denmark) for the Merlot batches. The MLF process lasted around 7–11 days.
During the clarification and cold stabilization (CCS) stage, the wines were clarified using pasteurized egg white (70 mL/hL). The formed lees and the wine are separated by decanting under normal gravity. The cold stabilization was performed in stainless steel tanks for a short time, 7 days, and for a long time, around 75 days, at 0°C using a temperature-controlled chamber. After the cold stabilization, the formed lees and the wine were separated by decanting under normal gravity.
In the bulk maturation and bottling (BMB) stage, the samples were allowed to mature for 1 respectively 2 months in stainless steel tanks under CO2 protective atmosphere in a controlled temperature chamber (14°C–16°C). Before bottling, a double filtration was performed using a 1 µm pore-sized filter, followed by a second filtration using a 0.65 µm pore-sized filter (Millipore Merck, Darmstadt, Germany).
During the maturation in bottles (MB) stage, the wines were stored horizontally in bottles at 14°C–16°C for 12–13 months.
All the wines were sampled at five sampling points (See Table 1). Stage 1: end of the alcoholic fermentation (AF). Stage 2: end of malolactic fermentation (MLF). Stage 3: after clarification and cold stabilization (CCS). Stage 4: after bulk maturation, filtration, and bottling (BMB). Stage 5: after maturation in bottles (MB).
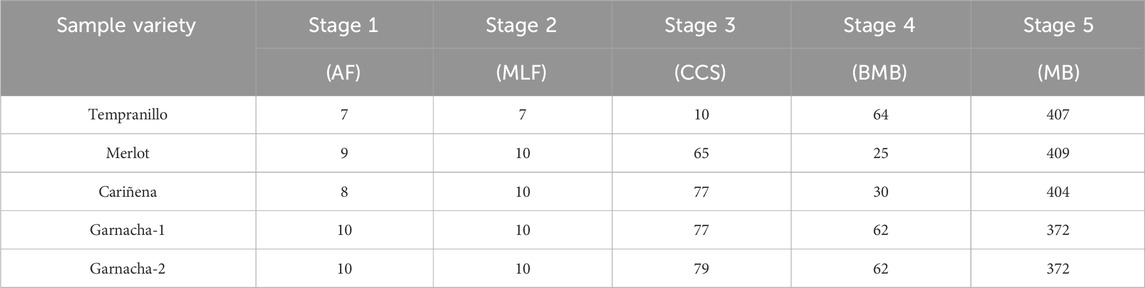
Table 1. Grape varieties and time (in days) for each winemaking stage.
2.2 Chemicals
Tartaric acid, sodium azide, sodium nitrate p.a. grade, and sodium carbonate were from Merck (Darmstadt, Germany). Ethanol 99.5% was obtained from VWR (Fontenay-sous-Bois, France). Bovine serum albumin (BSA) was purchased from Sigma-Aldrich (St. Louis, MO, United States). Ultra-pure water with a specific resistivity of 18 MΩ cm as used throughout the experiments (Millipore Corporation, Molsheim, France).
2.3 Asymmetrical flow field-flow fractionation (AF4) system and operation
The separation system, methodology, and determination of the macromolecular and specific properties were similar to those previously used (Osorio-Macías et al., 2020). In brief, an ultrafiltration membrane with a molecular weight cut-off (MWCO) of 10 g/mol (Microdyn-Nadir GmbH, Wiesbaden, Germany) was used to cover the ceramic frit of the AF4 channel. A long separation channel with a trapezoidal geometry (tip-to-tip length of 26.5 cm and inlet and outlet widths of 2.6 and 0.6 cm, respectively) was used (Wyatt Technology, Goleta, Ca). The channel spacer has a nominal thickness of 350 μm, giving a calibrated channel thickness of 279.2 μm, obtained by calibration with BSA (Håkansson et al., 2012). The outlet flow from the channel was monitored at a wavelength of 280 nm using a UV detector (Jasco Corporation, Tokyo, Japan), a Dawn Heleos II multi-angle light scattering detector (MALS), and an Optilab T-rEX differential refractive index detector (dRI), both measuring at 632.8 nm (both from Wyatt Technology, Goleta, Ca).
The separation method used a constant flow rate of 0.5 mL/min during the analysis. The flow was divided into two streams, one entering from the inlet and the other from the outlet. The two streams met in the channel at the focusing point, situated 1.83 cm downstream from the injection inlet. The sample volume injected into the channel was 40 µL with a 0.2 mL/min flow. The injection, a relaxation/focusing step, was maintained for 3 min with an additional 3 min of focusing before elution. During elution, the initial crossflow rate was set to 2.5 mL/min with exponential decay of 4 min (half-life), reaching a constant crossflow of 0.22 mL/min at 22 min for 15 min. The liquid carrier was an aqueous solution with pH 3.6% and 13% (v/v) ethanol with 20 mM tartaric acid (30 mM ionic strength) as a model of wine-like conditions. The samples were run in triplicate, and the resulting fractograms showed reproducibility between the replicates.
Data acquisition and control of the carrier pump and the flow direction valves of the AF4 separation system were carried out with VISION CSH® Software. Processing light scattering data was made by Astra Software version 6.1.7.17 (Wyatt Technology). The weight-average molar mass was obtained using the Berry fitting, and the dn/dc values for the peaks were calculated and described in Section 2.7.
2.4 Hydrodynamic radii determination and apparent densities
The hydrodynamic radius
where F is a differential function describing how the sample with a diffusion coefficient D(rt) at the retention coefficient rt that move along the canal, z direction, depending on the time dependent crossflow Q(t).
The
where kB is the Boltzmann constant, T temperature in Kelvin.
The apparent densities were obtained from molar mass and the
where MW is the molar mass,
where
2.5 Specific absorptivity (Ɛ) determination
The absorptivity measurement refers to the UV absorbance per mass unit of the material present in the fractionated populations. The equation is obtained by comparing the ratio between the UV absorbance with the dRI intensity of the actual material in the population and using BSA as a calibration reference.
The specific absorptivity of the population j in sample i is obtained from
where
The absorptivity coefficients of the populations are obtained as the value at the peak position of the dRI curve.
2.6 Absolute concentration determination
The absolute concentration was determined according to the formula deduced from the fractograms and elution data
where
2.7 Dialysis experiment and determination of dn/dc
The samples from the cold clarification stage, S3, were concentrated using a dialysis experiment for 6 days using standard regenerated cellulose (RC) tubing with 12 g/mol MWCO (Spectra/Por from Roth, Karlsruhe, Germany). The dialysis was performed against the carrier liquid for 4 days, followed by dialysis against deionized water for another 2 days. The liquid was changed twice daily. Then, the samples were frozen at −20°C in a 1–2 cm thick layer and freeze-dried (Epsilon 2-6D LSC plus, Osterode, Germany) for 4 days.
The refractive index, n, of the total solids from the freeze dried retentate of the dialyzes, and after freeze-drying was measured dissolved in the carrier liquid of the AF4 using a digital refractometer (Hanna Instrument, HI 96801, Woonsocket RI, United States).
The colloidal wine material consists of three main populations determined by the AF4. The first population shows UV-absorbing properties, while the third population is non-UV-absorbing. The second population shows intermediate values of UV-absorbing material, and according to the particular wine sample, the presence of UV-absorbing material can be considered high or neglected.
The dn/dc of the total colloidal/macromolecular material is determined from the refractive index increment of the total solids retentate from the dialysis experiment of stage 3. It is assumed to be formed from the mass-weighted average of the dn/dc of the three peaks.
where TS refers to wine colloids and macromolecular material, and p1 to p3 refers to populations 1 to 3. There is a mass balance assuming that all non-volatile material in the retentate is present in the total solid fraction:
The integrated peak areas of the dRI signals forms three equations:
There are 4 measured parameters of totally 11 variables in Equations 7–9. To solve this, the particle types is separated in three classes. Wine colloids, P1, intermediate population, P2, and wine macromolecules, P3. It is assumed that population 1 can be classified as wine colloids, population 2 as an intermediate fraction, and population 3 as wine macromolecules. It is also assumed that the refractive index increment of the wine macromolecular population,
The solution for the refractive index increment of the wine colloid population populations then becomes:
The dn/dc values obtained for the wine colloidal fraction (P1) were 0.224 [mL/mg] for Tempranillo, 0.213 [mL/mg] for Merlot-1, 0.268 [mL/mg] for Merlot-2, 0.312 [mL/mg] for Cariñena, 0.296 [mL/mg] for Garnacha-1 and 0.280 [mL/mg] for Garnacha-2.
3 Results
3.1 Fractionation of the red wine samples using asymmetrical flow field-flow fractionation (AF4)
The evolution of wine colloids and wine macromolecules, in addition to other macromolecular properties, were characterized and monitored during the five stages of the winemaking using AF4. Figure 1 shows the five resulting fractograms for the Tempranillo wine sample. The fractograms corresponding to the five stages are labeled as after alcoholic fermentation a), after malolactic fermentation b), after clarification and cold stabilization c), after bulk maturation, filtration and bottling d), and after maturation in bottles e).
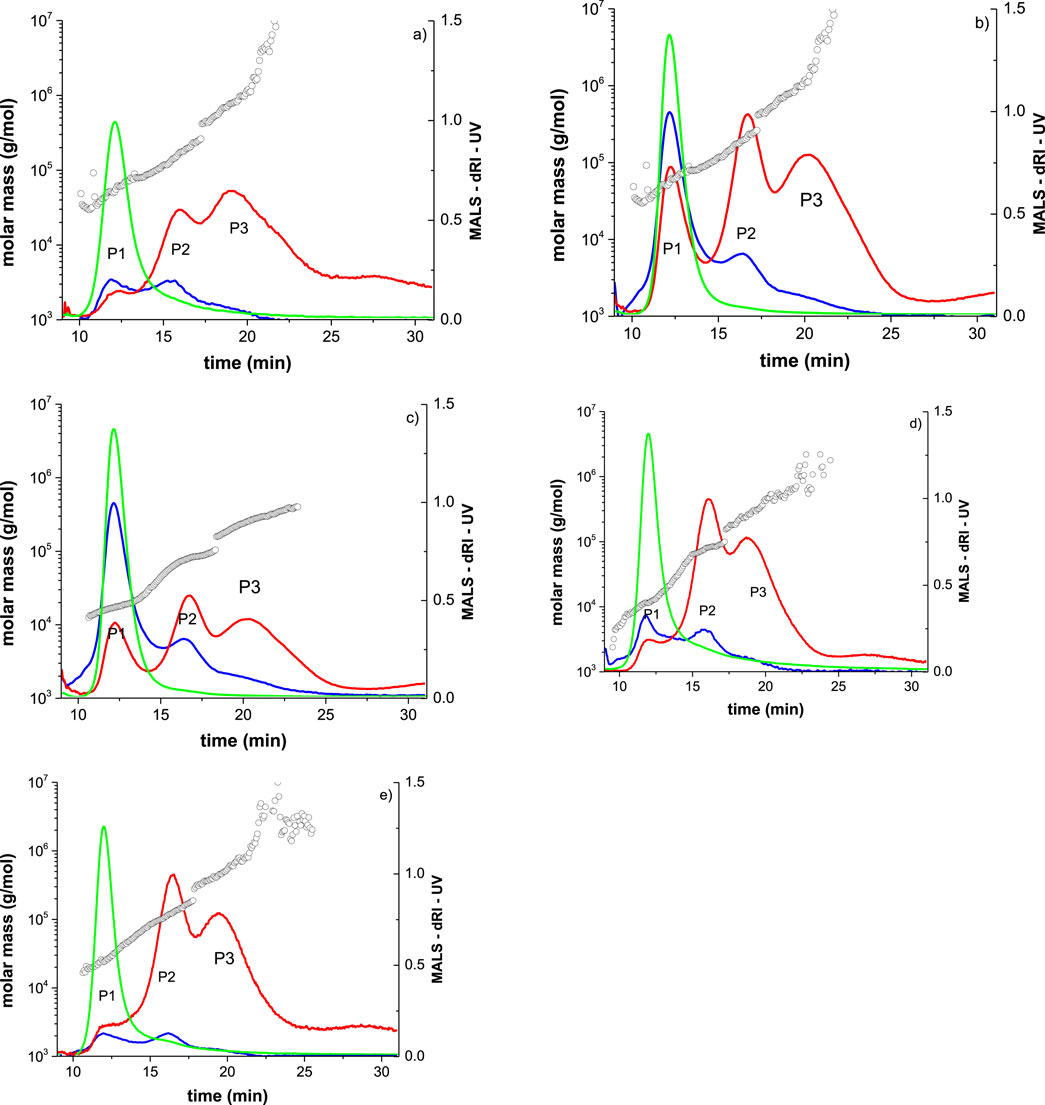
Figure 1. Fractograms of the evolution of the wine colloids and wine macromolecules during the wine making of the Tempranillo samples. (a) after end of alcoholic fermentation, S1, (b) after end of malolactic fermentation S2, (c) after clarification and cold stabilisation, S3 (d) after maturation in bulk and bottling, S4, and (e) and after maturation in bottles. Green is the UV signal, blue is the dRI signal and the red is the MALS signal. The open circles are the molar mass obtained from the MALS signal. The MALS signals are normalised.
The AF4 elutes the material gradually according to the hydrodynamic diameter. Under the present condition, the analysis is starting with low molecular material, 30,000 g/mol, and ending with the large molecular masses of 1,000,000 g/mol. The Figure shows variations in the signal patterns (UV-MALS-dRI) during the elution, showing the signal intensity as a function elution time. Changes in the dRI signal (in the blue trace) show the proportional changes in concentration. Changes in the MALS signal (in red) are exponentially proportional to radius, and changes in the UV signal (in green) operating at 280 nm provide information on concentration of UV-absorbing compounds, such as polyphenols and proteins.
The fractograms according to the different detectors and the elution profile show three populations throughout all the vinification stages. The first peak, population-1, P1, is charactersed by high UV absorbance and small size, the second peak, population-2, P2, have a moderate UV absorbance and intermediate size, and the third peak, population-3, P3, has a low UV absorbance and a large size. Hence, Population-1 is described as wine colloids due to high UV absorbance, Population-2 is described as an intermediate fraction between wine colloids and wine macromolecules with properties that can vary depending on the composition, and Population-3 is described as wine macromolecules which are constituted mainly by wine polysaccharides. Previous studies for red wines have shown similar results (Pascotto et al., 2020; Marassi et al., 2021; Marangon et al., 2024) while in others only two populations have been observed (Osorio-Macías et al., 2020).
In the sample after the first stage of the vinification, alcoholic fermentation, AF S1, Figure 1a, shows a low dRI signal suggesting that after this stage the concentration of the wine colloids and wine macromolecules are rather low in the three populations. In contrast, the UV signal for population-1 is considerably high suggesting high specific absorptivity of the wine colloids material present.
After the second stage, malolactic fermentation, MLF S2, Figure 1b, shows higher dRI, MALS and UV signals, indicating the concentration and absorptivity of the populations may be increased during the second fermentation and particularly for the wine colloids.
After the clarification and cold stabilization stage, CCS S3, Figure 1c, the different signals show that the MALS signal and the dRI signal above 20 min have decreased noticeable, this result can be expected since during the clarification larger particles such as aggregates of molecules and/or macromolecules that were formed during fermentation and maceration stages (Maury et al., 2003; Maury et al., 2016) are removed (Sarni-Manchado et al., 1999).
After the bulk maturation and bottling, BMB S4, Figure 1d, the dRI has decreased considerably sugesting that the concentration of the colloidal and macromolecular compounds have decreased considerably during the maturation which can be reflected in the low molar mass around the retention time of 10 min (see black circles trace in Figure 1d). In addition, the MALS signal has increased for populations 2 and 3 which may indicate a growth of the larger particles. After the maturation in bottles stage, MB stage 5, Figure 1e, the results appears somewhat comparable to stage 4.
A second example is shown in Figure 2, showing the AF4-MALS-dRI-UV fractograms the vinification of the Merlot-1 wine sample. After the alcoholic fermentation, Figure 2a, the UV absorptivity and the dRI signal shows low concentration of the three populations. The MALS signal shows a higher intensity indicating the presence of larger particles from populations 2 and 3. After the malolactic fermentation, Figure 2b, the results shows an increase of the dRI signal for populations 1 and 2 with a slightly higher UV signal for the wine colloids of population-1, indicating an increase of the concentration and specific absorptivity of these populations.

Figure 2. Fractograms of the evolution of the wine colloids and wine macromolecules during the wine making for the Merlot sample, (a) end of alcoholic fermentation, (b) end of malolactic fermentation, (c) after clarification, (d) after bottling and, (e) aging in bottle. Green is the UV signal, blue is the dRI signal and the red is the MALS signal. The open circles are the molar mass obtained from the MALS signal. The MALS signals are normalised.
After the clarification and cold stabilisation stage, Figure 2c, a decrease in UV and increase in the dRI signal for populations 1 and 2, were noticed respectively. Thereby, suggesting an increasing of the colloid particle concentration but with a lower UV absorbance. These observations differes from the Tempranillo sample where we observed higher intensity of the UV. After the bulk maturation and bottling stage, Figure 2d, shows a sort of similar intensity of the UV signal in the peaks compared to the clarification stage, which still refers to a low specific absorptivity for population-1.
After the maturation in bottles stage, Figure 2e, a reduction of the dRI signal, therefore, suggesting that the concentration dropped from the previous stage. On the contrary, the UV and MALS signals increased indicating higher specific absorptivity of the remaining wine colloids present and higher molar masses of the larger particles, respectively.
All the fractograms for the vinification for the 6 samples made with different grape varieties are in the Supplementary Materia S3.
In an overall view, in this set of wines under study the fractograms results showed different patterns suggesting that the winemaking process caused changes at their colloidal and macromolecular profiles.
However, since the interpretation of fractograms with the naked eye can be biased or misleading a more quantitative interpretation of the results are needed. In the previous study, (Osorio-Macías et al., 2020), an approach was developed for a more quantitative evaluation of the combination of the dRI, UV signals and retention times to obtain the concentration, absorptivity and the apparent density of the particles and macromolecules (the details are described in Method Sections 2.5–2.7).
3.2 Changes in the macromolecular properties during the winemaking (molecular mass, hydrodynamic radii and apparent density)
Table 2 shows the average molecular mass (MW) results of the three fractionated populations for five stages of the winemaking of the 6 wine samples.
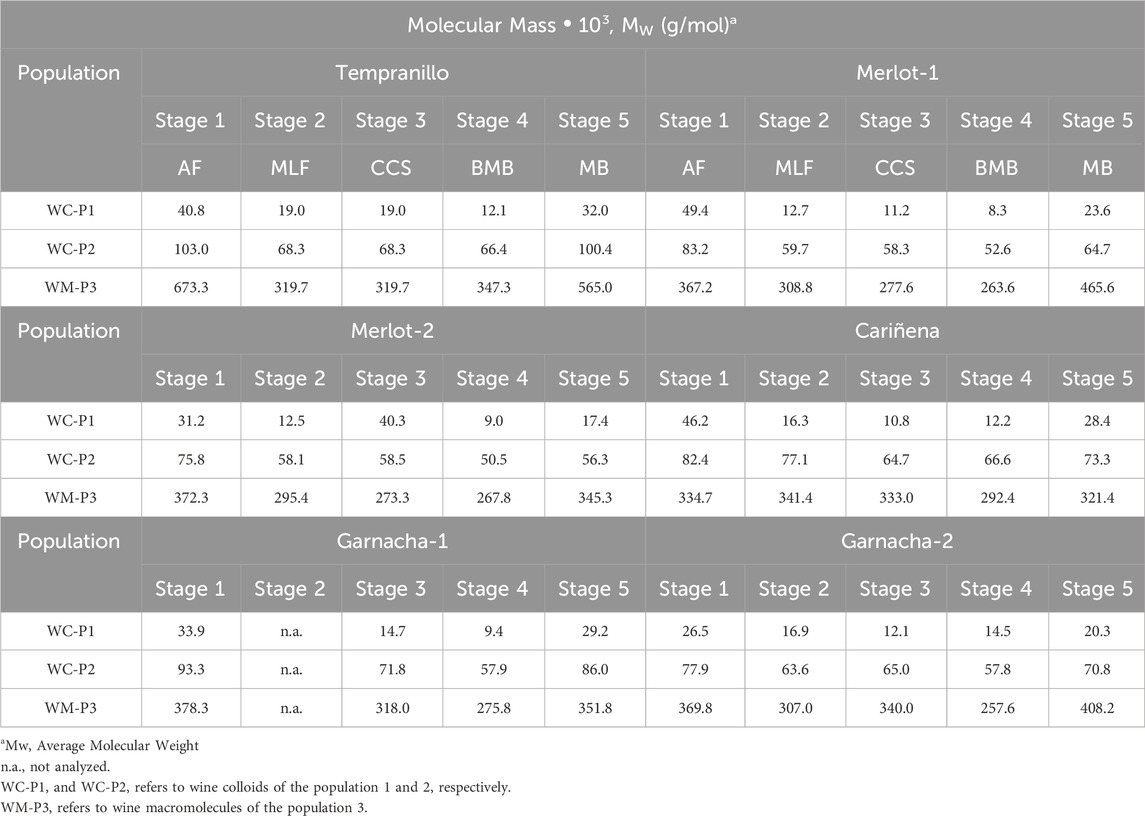
Table 2. The Molecular Mass of the different grape varieties during stages of the winemaking. The data is obtained directly from the Astra software using the Berry fitting model as described in 2.3.
In particular, the Tempranillo wine sample have shown higher values of the molar mass in the three populations throughout the vinification.
The first population, wine colloids WC-P1, varies between 8 and 50 kg/mol, the intermediate population, wine colloids, WC-P2 between 50 and 100 kg/mol, and wine macromolecules WM-P3 varies between 250 and 670 kg/mol. The average molar masses value for all the samples for the wine colloids and macromoelcules of populations 1, 2 and 3 reaches approximately 21 kg/mol, 68 kg/mol and 336 kg/mol, respectively. These values for the wine colloids and wine macromolecules agrees resonably with data previously reported in red wines (Osorio-Macías et al., 2020; Pascotto et al., 2020).
Table 3 shows the values of the hydrodynamic radius obtained from the retention time. The general average results for the vinification of populations 1, 2 and 3 for all the grape varieties ranged from 3.3, 7.6 and 15.9 nm, respectively. These results for the wine colloids of population-1 agrees with a previous study in bottled Argentinian red wine wines (Osorio-Macías et al., 2020). However, are slightly higher for the wine macromolecules of populations-3.
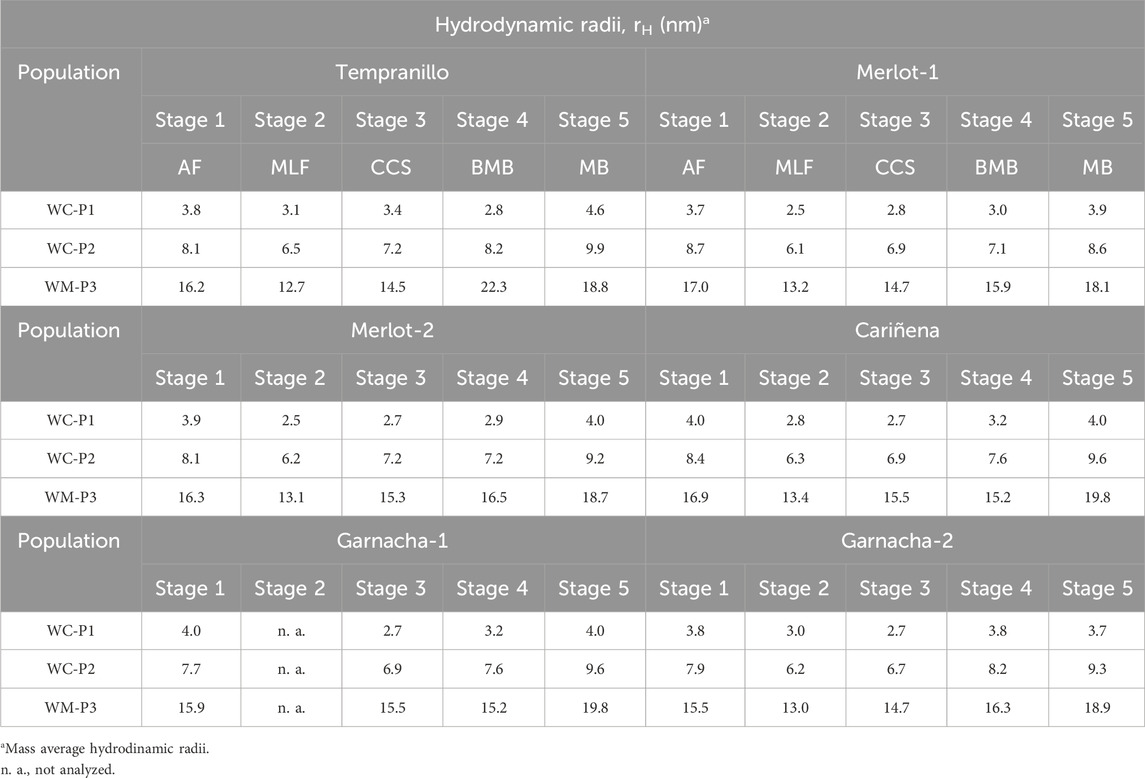
Table 3. Changes in the Hydrodynamic Radius for the different grape varieties along with the winemaking process.
The overall trend is a decrease in the values after the malolactic ferementation (MLF) and later a posterior increase during the maturation stages. These results follows the molar masses trend in addition to the noticeable gap in reduction of the values between stage 1 and stage 2.
The results of the different grape samples after each of the stages of the winemaking are obtained from the retention time according to Equations 1, 2. The results are given as mass weighted averages over the three populations.
The apparent density is a parameter that is obtained by taking the ratio of the molar mass over object volume assuming a spherical geometry using the hydrodynamic radii. The apparent density shows a dense structure or a loose structure. A very dense structure could be a particle while a loose structure could be an aggregate. The apparent density values for the three populations of the different wine samples along the vinification are shown in Table 4. The results show typical values for wine colloids of population-1 which on average are 7 times higher than the wine macromolecules of population-3. The overall average values of the populations of the whole wine samples range from 277 kg/m3 for Population-1, 67 kg/m3 for Population-2 and 34 kg/m3 for Population-3. These values are in accordance with values previously reported for wine colloids and wine macromolecules in Argentinian red wines (Osorio-Macías et al., 2020).

Table 4. Changes in the Apparent densities of the different grape varieties during the four stages of the winemaking.
The overall tendency of the results during the vinification shows higher apparent density values during the first two stages, precisely the highest values were found at the end of the malolactic ferementation, stage 2, possible due to the material released during the fermentation processes which grows into the wine colloids (condensed tannins) and wine macromolecules (polysaccharides) while the lowest values were found during bottling and aging, in stages 4 and 5.
Also is possible to observe that during the clarification and cold stabilisation performed in stage 3 there is an increase of the apparent density values which demonstrates the changes due to the clarification and cold stabilisation processes for the stabilization of the wine where the larger particles are removed, telling that the nature of the populations have changed after clarification.
3.3 Changes in the specific properties, concentration and specific absorptivity (ε) of the wine colloids and wine macromolecules during the vinification
The particle concentration of each population can be obtained from the dRI signal by using the dn/dc of each population using Equation 6. The dn/dc of each population is determined after dialyses followed by freeze drying and redispersion of known amount as described in Section 2.6. In this study we have assumed that the dn/dc values of each wine sample for the three populations is constant for all as it is only determined after stage 3.
Table 5 shows the results of the total and individual concentrations of the populations from each of the winemaking stages. The total average concentration for all the wine samples as well as for the populations 1, 2 and 3 found is 0.56, 0.13, 0.25, and 0.17 mg/mL, respectively. These results somewhat agree with the data previously reported in argentinian red wines (Osorio-Macías et al., 2020) and with data found in clarified white wines (Osorio-Macías et al., 2022). Furtheremore with data reported by (Marassi et al., 2021) who performed chemical analyses of collected fractions separated by using the AF4 technique in two red wines samples and with (Seidel et al., 2024) who has estimated the total colloidal concentration in wines obtained as the sum of the polysaccharide and protein content from isolated colloids as dry matter.

Table 5. Concentration of the wine colloid fractions and the wine polymer fraction and how they evolute during the winemaking stages. The concentrations are estimated as an integral over the peaks of the dRI signal using Equation 6.
The results have shown that during the winemaking process, the concentration of the wine colloids and wine macromolecules increases during the malolactic fermentation (secondary fermentation), and remain more or less contant through or reach a miximum after the clarification and cold stabilization stage, and finally, the concentrations tends to decrease during bulk maturation and aging in bottles.
However, there appears to be differences between the wine samples. For instance, from the Cariñena wine, we observe that the total concentration reaches its maximum at the last aging stage, S5. These findings tells how the particle formation may vary throughout the vinification in dependance of the particular wine sample and grape variety as well as the particular treatment to which they were subjected to.
Subsequently, with respect to the observations on the evolution and variations of the each of individualconcentrations of the populations; the Tempranillo sample showed a predominance of wine colloids of population-1, but it should be noted that this particular sample had a shorter fermentation time, while the Merlot sample showed predominance by the colloidal and macromolecular fraction of population-2. Moreover, the Carinena and Garnacha-1 samples showed higher levels of the wine macromolecules (polysaccharides) content during its development and evolution within population-3. In addition, a clear differenece between both Garnachas can be observed as the Garnacha-2 showed much less particle concentration for the wine macromolecules in population 3 during the winemaking process. It should be noted that Garncha-1 and Garnacha-2 differed in the harvest time and vineyard origin. In general the higher values of population 3 were found after the malolactic fermentation in Stage 2, which can be atributed to the release of mannoproteins form the yeast for most varieties.
In addition to the concentration also the specific absorbtivity (Ɛ) in mL/(mg cm) at 280 nm was analysed by comparing the UV absorption with the dRI and normalising it against the UV signal from the calibration run with BSA, using Equation 5. The idea of this analyses is that it should indicate the extent of the phenolic composition of the wine colloids and wine macromolecules.
Table 6 shows the evolution of the specific absorptivity of the wine colloid populations and the wine macromolecule population throughout the vinification. The total average absorptivities for all the final wine samples (stage 5) for the populations 1, 2 and 3 found are 1.62, 0.5, and 0.15 mL/(mg cm), respectively. These results agree with the data previously reported in argentinian red wines (Osorio-Macías et al., 2020) and with data found in clarified white wines (Osorio-Macías et al., 2022).
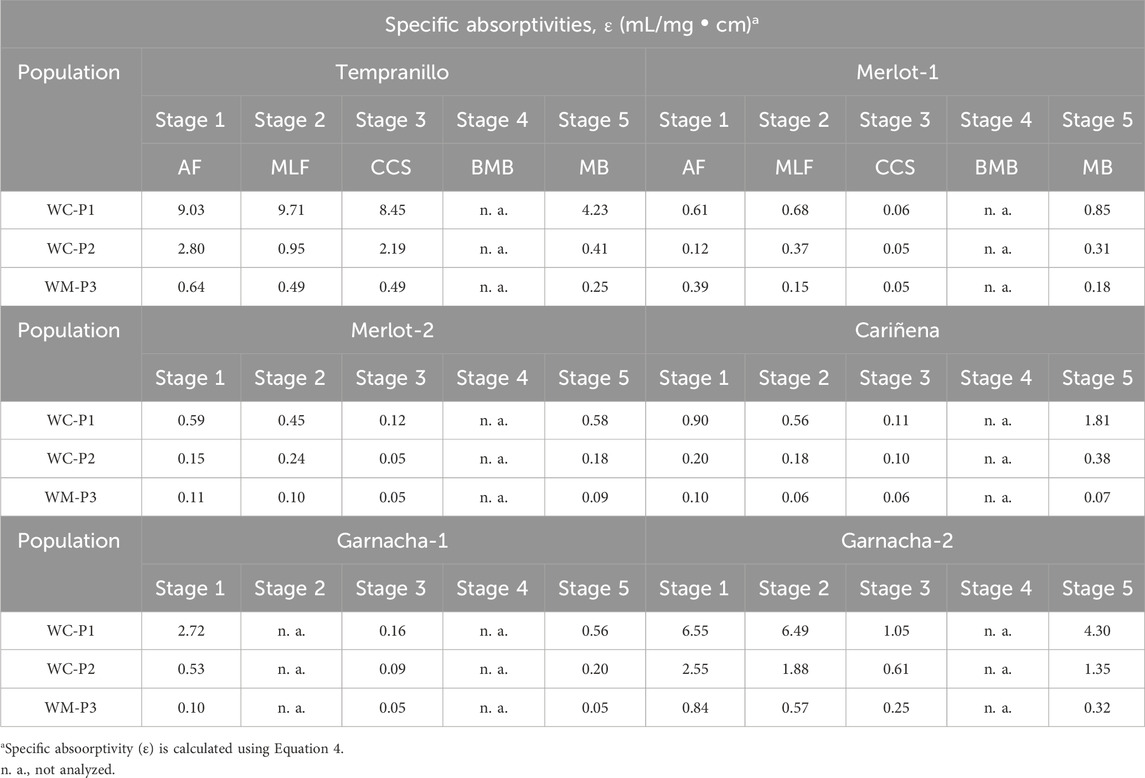
Table 6. Specific Absorptivities evolution of the different grape varieties during the winemaking stages.
For the evolution of the absorptivity of the samples it can be noted that the bulk maturation stage leads to a loss of absorptivity for all samples and the clarification followed by the cold stabilization leads to a loss of absorptivity for all samples except the Tempranillo sample. The results of the specific absorbtivities after stage 4 are not analyzed. The maturation in the bottles (stage 5) leads to a regain of absorptivity for all wine colloid fraction (P1 and P2) for all samples.
4 Discussions
The intention of this study is to evaluate the dynamics of wine colloids and macromolecules during vinification of red wine. The principal methodology has been Flow-field flow fractionation supported by online UV absorbance, refractive index and light scattering measurements, AF4-UV-MALS-dRI. The only off-line measurement that has been added is a determination of the solids in retentate after dialysis that was performed after clarification and cold stabilisation, stage 3, which is the last active operation during the vinification process. There are three principal assumptions with this procedure. The first, is that the dn/dc is constant over the process but differ between the wines. The most drastic change of the particle composition is expected to be as a consequence of the malolactic fermentation, stage 2, as the amount of particle and macromolecular material increase drastically. However, despite this it appears not to alter the composition very strongly as the apparent density and the absorptivity remain more or less constant over this operation. The second set of assumptions is due to the presence of 3 populations of particle and macromolecular material and we only can measure a single dn/dc of the total particle and macromolecular material. In this study it is assumed that the P3 has a dn/dc of 0.14 as was done in the previous studies (Osorio-Macías et al., 2020). For the intermediate population (P2) it was assumed that an intermediate value can be used, like the dn/dc for protein, 0.19. However, it should be noted that it is quite unlikely that the P2 consists of pure protein particles, but more likely particles with proteins, polysaccharides and a smaller fraction of polyphenols. With those assumptions, it is possible to obtain a dn/dc for the wine colloid population, P1, using Equation 10. The third assumption is that the recovery of the analyses is 100%. There is always a risk of loss of material during the analyses due to absorption at the membrane surface during the analysis. However, no drastic signs of strong absorption have been observed such as discoloration of the membrane in the AF4 channel separation or changes in the elution curves over repeated injections. Thus, it is concluded that the quantification may underestimate the material somewhat, the quantitative relation between the populations may be slightly impacted, but our estimation is that the systematic errors are comparably small when comparing with between wine, and between stage, variation. The magnitude of the results also appears realistic when compared with other methods of quantification.
The methodology includes a standard measurement of BSA that is used to determine the actual cell height. With this procedure, the retention time can be used to determine the diffusivity and, thereby, the hydrodynamic size. The procedure also allows us to determine the size of the most minor fraction, P1, where the light scattering does not supply sufficiently accurate results to obtain the radius of gyration. The UV absorptivity data of the BSA is also used as a reference for the specific absorptivity determinations. Consequently, the results from the analysis of the samples become a material characterization supporting the distinction of the compositions of the populations.
The six grapes used in this study were followed during the vinification process, and the properties were evaluated 5 times during the process (Stage 1 to Stage 5). After each of these stages, different analyses based on the online detectors dRI, MALS, and UV were performed to obtain the parameters molar mass, hydrodynamic radius, apparent density, concentration, and specific absorptivity at 280 nm to characterize the evolution of the colloidal and macromolecular material during the vinification process. Figure 3 provides a general overview of the unit operations used during the winemaking stages and how this processing affects and changes the wine samples’ different macromolecular and specific properties.
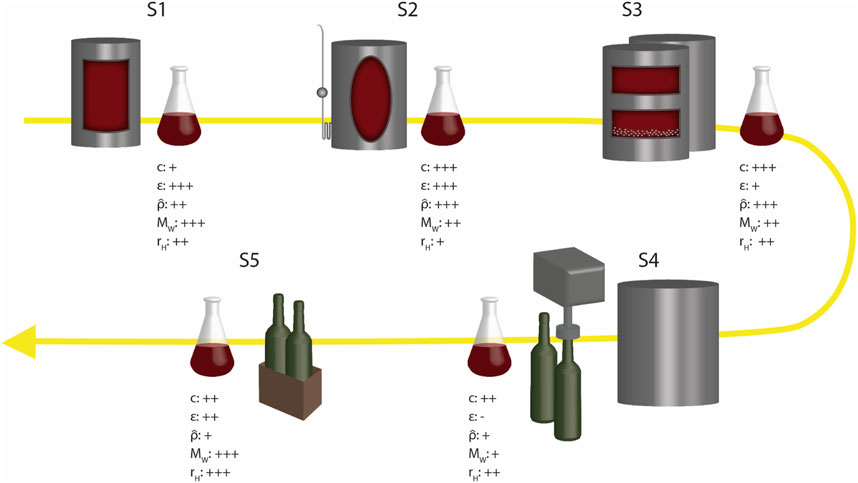
Figure 3. Stages of winemaking: S1, alcoholic fermentation; S2, malolactic fermentation; S3, clarification and cold stabilization; S4, bulk maturation, and bottling; and S5, maturation in bottles. The magnitude of each characterization after each stage is indicated using a scale from +, low level to +++ high level.
The first parameter is the molar mass. The results are presented as two averages of the wines from the 6 grape varieties. The groups are based on the concentration of wine colloids (P1) after stage 3, clarification, and cold stabilization. This stage is the end point of the active vinification operations. The “high” group has a concentration of P1 above 0.11 mg/mL (Tempranillo and Garnacha 2), the “low” group has a concentration of P1 below 0.11 mg/mL (Merlot 1 and Merlot 2, Carina and Garnacha 1). Although the boundary between these two groups is arbitrary and based on this relatively small experimental material, the groups appear to reflect different characteristics, particularly in the wine colloid populations (P1). The result in Figure 4a shows that the molar masses of all three populations fall during the active phase of the vinification process and increase again after maturation. The magnitude of the changes is in the range 2. Previous studies have reported that both the colloid and macromolecule contents after fermentation vary due to a loss of grape-related components and a gain due to yeast-related mannoproteins in addition to the degradation or precipitation of polysaccharides (galacturonic acid-rich polysaccharides) (Seidel et al., 2024). The hydrodynamic radius (Figure 4b) follows the molar mass. High after alcoholic fermentation drops during vinification and the increase during maturation. Notably, there appear not to be any systematic differences between the two groups of grapes in these two parameters.
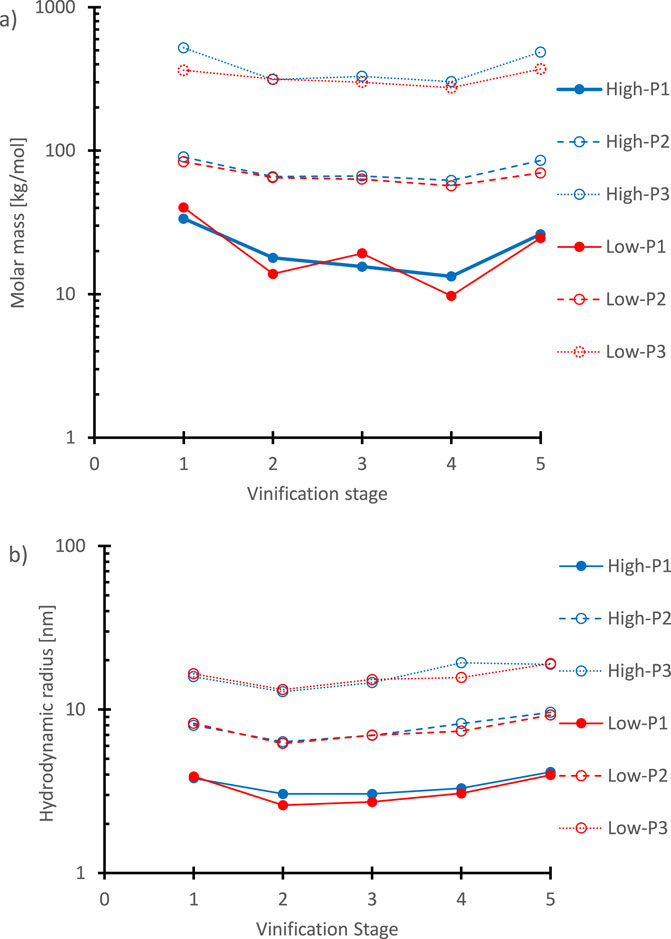
Figure 4. Molar mass (a), hydrodynamic radius (b), and molar mass of the particle populations P1, P2, and P3 of the two groups of samples. The group of wines “High”, with a high concentration of P1 after stage 3, clarification and cold stabilization, and the group “Low”, with a low concentration after stage 3, are identified by the blue respectively red color. The data is from Tables 2, 3.
The apparent density is a parameter comparing the molar mass with the volume obtained from the hydrodynamic radius. A fully compact particle should have a density close to 1,000 kg/m3 and a loose aggregate or a well-hydrated random coil should have much lower values. Examples of densities for molecular objects are given in Table 7. From the results in Figure 5, the apparent density is provided as a function of molar mass for all samples. The wine colloid populations, P1, have high densities, between 100 and 1,000 kg/m3 throughout the process. The intermediate populations, P2, are between 40 and 120 kg/m3 and the wine macromolecular populations, P3, are between 20 and 60 kg/m3. In the previous study on Argentinian wines, the apparent density of wine colloids varied between 400 and 1,200 kg/m3 and the wine macromolecules between 30 and 100 kg/m3 for quite mature wines (Osorio-Macías et al., 2020). The results show that the apparent density is higher for smaller particles and lower for larger particles. It can also be seen that the density depends on the vinification process. Particularly, fraction 2 loses density during maturation. Starting from an average of 100 kg/m3, comparable with WC-P1 after clarification and cold stabilization, changing to around 30 kg/m3, in the same range as the apparent density of WM-P3. It can be noticed that both the densities of wine colloids and wine macromolecules are independent of or even tend to increase with increasing molar mass. If it is assumed that the wine colloids are fractal aggregates, the apparent density should drop with increasing molar mass. Thus, it can be concluded that the structure of the aggregates has a relatively even density and appears to be non-fractal.
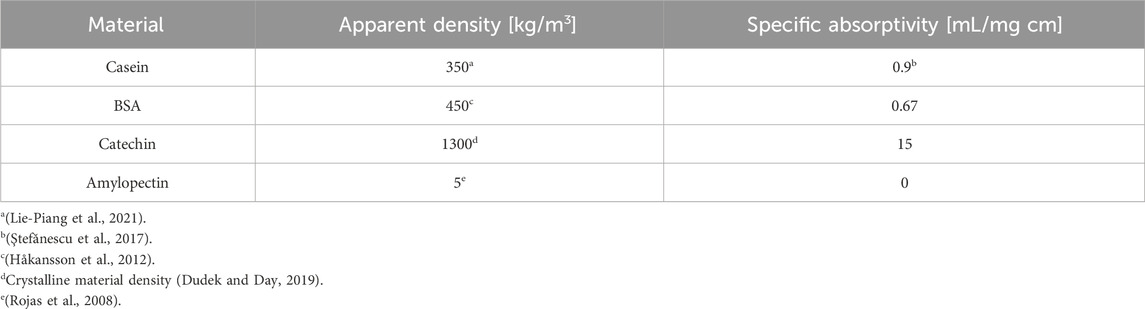
Table 7. Apparent density and specific absorptivities (at 280 nm) for example, molecules.

Figure 5. Apparent density as a function of molar mass for all investigated samples. The data is from Tables 2, 4. S1 to S5 refers to the process stages, and P1 to P3 refers to the populations of the separated particles.
In Figure 6a, the concentration trajectories through the vinification process are shown. The concentrations of the particles in 3 populations increase during the malolactic fermentation with a factor of 3–5. Then, the concentrations remain more or less stable during the clarification and cold stabilization processes. For the group with a low content of wine colloids-P1, the concentration lowers during the clarification and cold stabilization. Then, during the maturation, there is a gain in the concentration of P1. For the group with a high concentration of wine colloids-P1, after clarification and cold stabilization, there is a material loss in population P1 during maturation. In the group of wines with a low P1 concentration, there is a comparable high P2 and P3 concentration. The population P2 and the wine macromolecules, P3, increase during the malolactic fermentation but remain more or less stable during the clarification and cold stabilization and the maturation stages.

Figure 6. Concentration (a) and specific absorptivity (b) of particle fraction P1, P2, and P3 in a group of wines “High”, with a high concentration of P1 after stage 3, clarification and cold stabilisation, and a group “Low” with a low concentration after stage 3. Data from Tables 5, 6.
The specific absorptivity at 280 nm, Figure 6b, is an indicative measure of the composition. Examples of data are given in Table 7. Polyphenols have a high specific absorptivity, typically 10–20 mL/(mg cm), and proteins between 0.5 and 1 mL/(mg cm). Thus, high specific absorptivities, such as observed for Tempranillo and Garnacha-2 in this investigation, show a significant fraction of polyphenols in the aggregates. In other wines, the absorptivity may, to a large extent, originate from the protein.
This study shows that the two groups of grapes with a low respective high concentration of wine colloids, P1, after clarification and cold stabilization, S3, also display different absorptivity and thus have a different chemical composition. The wines with a low concentrationin population-1, P1,also have a low specific absorptivity of the material of the colloids, suggesting that the polyphenol content of the colloids is low, likely less than 10% of the particles after the alcoholic fermentation. It appears that most of the added material during the malolactic fermentation has a low level of polyphenols, and thus, the concentration drops during the further vinification process. However, during the maturation, it is possible to notice an absorption of material with absorptivity, proteins, and some polyphenols (at a maximum of 10%). The wines with a high concentration of the population P1 also have a high absorptivity and, thus, have polyphenol rich colloids. Most likely, the material consists of about 50% of polyphenols after alcoholic and malolactic fermentation. It looks like the absorptivity drops during the vinification, and the composition may change to around 30% of the wine colloid material after maturation.
Another novel property proposed in the present methodology is the particle number concentration. The number concentration can be determined from the concentration and the average molar mass of the particles of each population:
where cj is the concentration and
In Figure 7, it can be noted that the particle number concentration increases with a factor of 10 during the malolactic fermentation. The number concentration is higher for the samples with a higher concentration of colloidal material, while the molar mass and the actual dimension are more or less constant. Thus, we can expect that new particles mainly generate the observed increase of particle matter during the malolactic fermentation through nucleation while particle growth is limited. Through clarifying and cold stabilization, the particle number concentration remains constant, followed by a decreasing tendency of the number concentration during the maturation stages for the group of wines with a high particle concentration. In contrast, the wines with a low concentration showed a more persistent number concentration during the maturation.
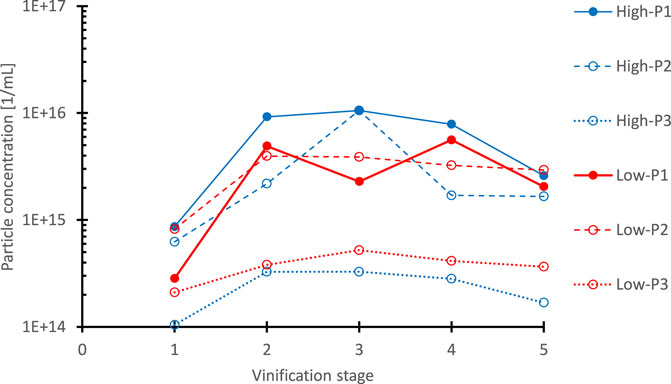
Figure 7. Particle number concentration (N) of particle populations P1, P2, and P3 of the two groups of wines. The group of wines “High”, with a high mass concentration (c > 0.11 mg/mL) of P1 after stage 3, clarification and cold stabilization, and the group “Low”, with a low concentration (c < 0.11 mg/mL) after stage 3 are identified by the blue respectively red color. The data is from Tables 2, 3 and obtained after applying Equation 11.
Not all of the polyphenols of the wine are connected to the wine colloids. In the previous investigation of matured Argentinian wines, the fraction of polyphenols connected to the wine colloids appeared to vary between 7% and 40% (Osorio-Macías et al., 2020). Similar results have also been obtained for a large data set of Italian wines, 2%–45% (Marangon et al., 2024). The present results suggest that the nature of the wine colloids very much depends on the properties of the grape juice and the outcome of the alcoholic and malolactic fermentations. Then, the properties are moderated during the maturation.
The total polysaccharide content in the collection of Italian wines investigated by Marangon and co-authors was between 0.3 and 1 mg/mL (Marangon et al., 2024). Marassi observed that the polysaccharide content was between 10% and 30% of the wine colloid fractions and about 80%–95% of the macromolecular fraction (Marassi et al., 2021). The wine macromolecule content in the present investigation is between 0.07 and 0.28 mg/mL which is on the lower side compared to the data by Marassi and Marangon. The wine macromolecular fraction is formed during the alcoholic and malolactic fermentation stages and appears more or less stable throughout the further stages of the vinification process. However, other studies have shown that polysaccharide concentrations tend to decrease slowly during the aging stage (Doco et al., 1999), which may modify the stability and the ionic balance of the wines (Apolinar-Valiente et al., 2014; Gawel et al., 2016; Gil et al., 2015).
The wine protein concentration in the wines analyzed by Marangon and coworkers varied between 0.01 and 0.15 mg/mL (Marangon et al., 2024). Marassi analyzed the composition of wine colloidal material corresponding to P1 in the present material and found that the protein content was between 5% and 25% of the mass of P1 (Marassi et al., 2021). These numbers are well in the range of the results of this investigation as the concentration of wine colloids in this material of Spanish wines varies between 0.4 and 0.8 mg/mL. According to the concentration of both wine colloids and wine macromolecular material, it is clear that there is a minor fraction present after the alcoholic fermentation and that the content of all fractions increases with a factor of 3-5 during the malolactic fermentation, well in agreement with what has been previously suggested as a release of cellular mannoproteins (Dupin et al., 2000; Waters et al., 1994). Coelho investigated the origin of the wine proteins and found that they both originated from the Oenococcus and the Saccharomyces cultures and included enzymes from the grapes (Coelho et al., 2017).
If we analyze particular stages in the vinification process, it is evident that ethanol content is an essential parameter in the alcoholic fermentation stage (stage 1). The sample Garnacha-2 had an alcohol content of 15.3% compared to 14.1–14.6 for the other wine samples, see Supplementary Materia S1. The alcohol content may be one reason why Garnacha-2 had a comparably high polyphenol (high absorbtivity after stage 1, Table 6), and it may be reflected in a somewhat low content of wine polymers (Table 5) as the alcohol is known to reduce the polysaccharide concentration by precipitation (Guadalupe and Ayestarán, 2007).
The overall picture of the transformation of wines during the vinification is illustrated in Figure 8, with sketches of the wine colloid and macromolecular aggregates. The intention is to show how the particle number concentration changes and how eventual growth or shrinkage of the particle or molecular size changes the structural character of the wine. In particular, the increase of the numbers of particles and macromolecules during the malolactic fermentation,S2, through nucleation and the loss of the number of particles and growth in the size of the P1 wine colloids during maturation, possibly through a ripening process. The figure also illustrates that the volume fraction dispersed phase becomes comparable high, about 1%–5% of the total volume.
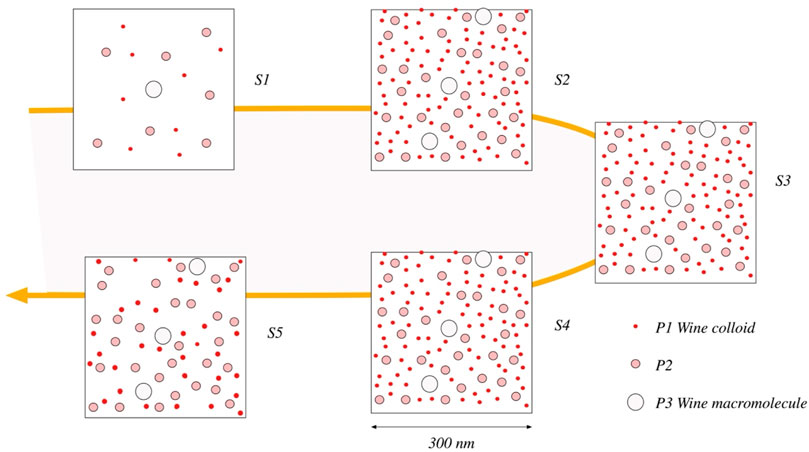
Figure 8. Sketches illustrating the number, concentration, and sizes of the wine particles and macromolecules in the populations P1, P2, and P3 at the different stages of the vinification process. The drawings refer to a volume of 300 × 300 × 100 nm. The objects are drawn at approximately correct dimensions and number concentrations.
5 Conclusion
This study has demonstrated the usefulness of the AF4-UV-MALS-dRI technique to separate and characterize particle matter during the vinification process using different wine samples. In addition to the quantification of the species in these fractions using specifically the system’s detectors (UV/dRI). These online quantifications produced results that are consistent with previous offline studies that are more demanding and expensive.
Furthermore, the proposed AF4-UV-MALS-dRI methodology allowed to differentiate and classify the separated fractions among the samples according to their particular nature, specifically from the wine colloids of population-1 as these showed to be more dynamic during the entire vinification process.
Different varieties of wines were classified according to their characteristic colloidal concentration, c, profile which along with the specific absorptivity (ε) defined the nature of the fractions as they tended to change more, while properties such as the molar mass (MW), hydrodynamic radii (
Thereby with online detection, the specific and macromolecular properties together with the number concentration parameter allow to reflect the magnitude of the dynamics and nature of the changes that occur in the colloidal fractions, whether new particles are formed or rearranged throughout the entire process.
The present results suggests that the nature of the wine colloids very much depends on the properties of the grape juice and the outcome of the alcoholic and malolactic fermentations as shown in the number concentration of the colloidal particles. Posteriorly, the properties are moderated during the maturation.
Finally, the findings of this study can guide decision-making during any of the stages of the winemaking process to achieve an adequate balance by controlling the dynamics and properties of the components based on the desired wine profile. In addition, the methodology allows for the analysis of large quantities of samples quickly and efficiently at each stage, which leads to savings in equipment, analysis, and reagent costs, as well as the prevention of significant amounts of chemical waste.
Data availability statement
The original contributions presented in the study are included in the article/Supplementary Material, further inquiries can be directed to the corresponding author.
Author contributions
DO-M: Conceptualization, Data curation, Formal Analysis, Investigation, Methodology, Validation, Visualization, Writing – original draft, Writing – review and editing. RF-G: Investigation, Resources, Writing – review and editing. JC: Investigation, Methodology, Writing – review and editing. BB: Conceptualization, Data curation, Formal Analysis, Funding acquisition, Methodology, Project administration, Supervision, Writing – original draft, Writing – review and editing.
Funding
The author(s) declare that financial support was received for the research and/or publication of this article. The present study was supported by the Swedish International Development Cooperation Agency (SIDA) in a collaborative project between Universidad Mayor de San Andres (UMSA, Bolivia) and Lund University (Sweden).
Conflict of interest
The authors declare that the research was conducted in the absence of any commercial or financial relationships that could be construed as a potential conflict of interest.
Generative AI statement
The author(s) declare that no Generative AI was used in the creation of this manuscript.
Publisher’s note
All claims expressed in this article are solely those of the authors and do not necessarily represent those of their affiliated organizations, or those of the publisher, the editors and the reviewers. Any product that may be evaluated in this article, or claim that may be made by its manufacturer, is not guaranteed or endorsed by the publisher.
Supplementary material
The Supplementary Material for this article can be found online at: https://www.frontiersin.org/articles/10.3389/frsfm.2025.1579973/full#supplementary-material
References
Alexandre, H., Lubbers, S., and Charpentier, C. (1997). Research report: interactions between toxic fatty acids for yeasts and colloids, cellulose and yeast ghost using the equilibrium dialysis method in a modelwine system. Food Biotechnol. 11 (1), 89–99. doi:10.1080/08905439709549924
Apolinar-Valiente, R., Romero-Cascales, I., Williams, P., Gómez-Plaza, E., López-Roca, J. M., Ros-García, J. M., et al. (2014). Effect of winemaking techniques on polysaccharide composition of Cabernet Sauvignon, Syrah and Monastrell red wines. Aust. J. Grape Wine Res. 20 (1), 62–71. doi:10.1111/ajgw.12048
Charpentier, C., Dos Santos, A. M., and Feuillat, M. (2004). Release of macromolecules by Saccharomyces cerevisiae during ageing of French flor sherry wine “Vin jaune.”. Int. J. Food Microbiol. 96 (3), 253–262. doi:10.1016/j.ijfoodmicro.2004.03.019
Coelho, C., Julien, P., Nikolantonaki, M., Noret, L., Magne, M., Ballester, J., et al. (2018). Molecular and macromolecular changes in bottle-aged white wines reflect oxidative evolution–impact of must clarification and bottle closure. Front. Chem. 6, 95. doi:10.3389/fchem.2018.00095
Coelho, C., Parot, J., Gonsior, M., Nikolantonaki, M., Schmitt-kopplin, P., Parlanti, E., et al. (2017). Asymmetrical flow field-flow fractionation of white wine chromophoric colloidal matter. Anal. Bioanal. Chem. 409, 2757–2766. doi:10.1007/s00216-017-0221-1
De Iseppi, A., Marangon, M., Vincenzi, S., Lomolino, G., Curioni, A., and Divol, B. (2021). A novel approach for the valorization of wine lees as a source of compounds able to modify wine properties. LWT 136, 110274. doi:10.1016/j.lwt.2020.110274
Doco, T., Quellec, N., Moutounet, M., and Pellerin, P. (1999). Polysaccharide patterns during the aging of carignan noir red wines. Am. J. Enology Vitic. 50 (1), 25 LP–32. doi:10.5344/ajev.1999.50.1.25
Doco, T., Williams, P., Pauly, M., O’Neill, M. A., and Pellerin, P. (2003). Polysaccharides from grape berry cell walls. Part II. Structural characterization of the xyloglucan polysaccharides. Carbohydr. Polym. 53 (3), 253–261. doi:10.1016/S0144-8617(03)00072-9
Dudek, M. K., and Day, G. M. (2019). Explaining crystallization preferences of two polyphenolic diastereoisomers by crystal structure prediction. CrystEngComm 21, 2067–2079. doi:10.1039/c8ce01783b
Dupin, I. V. S., McKinnon, B. M., Ryan, C., Boulay, M., Markides, A. J., Jones, G. P., et al. (2000). Saccharomyces cerevisiae mannoproteins that protect wine from protein haze: their release during fermentation and lees contact and a proposal for their mechanism of action. J. Agric. Food Chem. 48 (8), 3098–3105. doi:10.1021/jf0002443
Escot, S., Feuillat, M., Dulau, L., and Charpentier, C. (2001). Release of polysaccharides by yeasts and the influence of released polysaccharides on colour stability and wine astringency. Aust. J. Grape Wine Res. 7 (3), 153–159. doi:10.1111/j.1755-0238.2001.tb00204.x
Ferreira, R. B., Picarra-Pereira, M. A., Monteiro, S., and Teixeira, A. R. (2001). The wine proteins. Trends Food Sci. and Technol. 12, 230–239. doi:10.1016/s0924-2244(01)00080-2
Figué, A., Gosset, M., and Violleau, F. (2024). AF4-UHPLC: two-dimensional separation of macromolecules in four white wines from South-Western France. J. Chromatogr. A 1738, 465456. doi:10.1016/j.chroma.2024.465456
Gawel, R., Smith, P. A., and Waters, E. J. (2016). Influence of polysaccharides on the taste and mouthfeel of white wine. Aust. J. Grape Wine Res. 22 (3), 350–357. doi:10.1111/ajgw.12222
Gil, M., Quirós, M., Fort, F., Morales, P., Gonzalez, R., Canals, J.-M., et al. (2015). Influence of grape maturity and maceration length on polysaccharide composition of cabernet sauvignon red wines. Am. J. Enology Vitic. 66 (3), 393 LP–397. doi:10.5344/ajev.2014.14114
Guadalupe, Z., and Ayestarán, B. (2007). Polysaccharide profile and content during the vinification and aging of Tempranillo red wines. J. Agric. Food Chem. 55 (26), 10720–10728. doi:10.1021/jf0716782
Håkansson, A., Magnusson, E., Bergenståhl, B., and Nilsson, L. (2012). Hydrodynamic radius determination with asymmetrical flow field-flow fractionation using decaying cross-flows. Part I. A theoretical approach. J. Chromatogr. A 1253, 120–126. doi:10.1016/j.chroma.2012.07.029
Jones-Moore, H. R., Jelley, R. E., Marangon, M., and Fedrizzi, B. (2022). The interactions of wine polysaccharides with aroma compounds, tannins, and proteins, and their importance to winemaking. Food Hydrocoll. 123, 107150. doi:10.1016/j.foodhyd.2021.107150
Lie-Piang, A., Leeman, M., Castro, A., Börjesson, E., and Nilsson, L. (2021). Revisiting the dynamics of proteins during milk powder hydration using asymmetric flow field-flow fractionation (AF4). Curr. Res. Food Sci. 4, 83–92. doi:10.1016/j.crfs.2021.02.004
Marangon, M., De Iseppi, A., Gerbi, V., Mattivi, F., Moio, L., Piombino, P., et al. (2022). The macromolecular diversity of Italian monovarietal red wines. OENO One 56 (2 SE-Original research articles), 81–90. doi:10.20870/oeno-one.2022.56.2.5394
Marangon, M., Marassi, V., Roda, B., Zattoni, A., Reschiglian, P., Mattivi, F., et al. (2024). Comprehensive analysis of colloid formation, distribution, and properties of monovarietal red wines using asymmetrical flow field-flow fractionation with online multidetection. Food Res. Int. 187, 114414. doi:10.1016/j.foodres.2024.114414
Marassi, V., Marangon, M., Zattoni, A., Vincenzi, S., Versari, A., Reschiglian, P., et al. (2021). Characterization of red wine native colloids by asymmetrical flow field-flow fractionation with online multidetection. Food Hydrocoll. 110, 106204. doi:10.1016/j.foodhyd.2020.106204
Maury, C., Sarni-Manchado, P., Lefebvre, S., Cheynier, V., and Moutounet, M. (2003). Influence of fining with plant proteins on proanthocyanidin composition of red wines. Am. J. Enology Vitic. 54 (2), 105 LP–111. doi:10.5344/ajev.2003.54.2.105
Maury, C., Sarni-Manchado, P., Poinsaut, P., Cheynier, V., and Moutounet, M. (2016). Influence of polysaccharides and glycerol on proanthocyanidin precipitation by protein fining agents. Food Hydrocoll. 60, 598–605. doi:10.1016/j.foodhyd.2016.04.034
Nunan, K. J., Davies, C., Robinson, S. P., and Fincher, G. B. (2001). Expression patterns of cell wall-modifying enzymes during grape berry development. Planta 214 (2), 257–264. doi:10.1007/s004250100609
Osorio-Macías, D. E., Bolinsson, H., Linares-Pastén, J. A., Ferrer-Gallego, R., Choi, J., Peñarrieta, J. M., et al. (2022). Characterization on the impact of different clarifiers on the white wine colloids using Asymmetrical Flow Field-Flow Fractionation. Food Chem. 381, 132123. doi:10.1016/j.foodchem.2022.132123
Osorio-Macías, D. E., Song, D., Thuvander, J., Ferrer-Gallego, R., Choi, J., Peñarrieta, J. M., et al. (2020). Fractionation of nanoparticle matter in red wines using asymmetrical flow field-flow fractionation. J. Agric. Food Chem. 68 (49), 14564–14576. doi:10.1021/acs.jafc.9b07251
Pascotto, K., Cheynier, V., Williams, P., Geffroy, O., and Violleau, F. (2020). Fractionation and characterization of polyphenolic compounds and macromolecules in red wine by asymmetrical flow field-flow fractionation. J. Chromatogr. A 1629, 461464. doi:10.1016/j.chroma.2020.461464
Pascotto, K., Leriche, C., Caillé, S., Violleau, F., Boulet, J.-C., Geffroy, O., et al. (2021). Study of the relationship between red wine colloidal fraction and astringency by asymmetrical flow field-flow fractionation coupled with multi-detection. Food Chem. 361, 130104. doi:10.1016/j.foodchem.2021.130104
Poncet-Legrand, C., Doco, T., Williams, P., and Vernhet, A. (2007). Inhibition of grape seed tannin aggregation by wine mannoproteins: effect of polysaccharide molecular weight. Am. J. Enology Vitic. 58 (1), 87 LP–91. doi:10.5344/ajev.2007.58.1.87
Ribereau-Gayon, P., Dubourdieu, D., Doneche, B., and Lonvaud, A. (2006a). Handbook of enology: the microbiology of wine and vinifications. Second Edition. John Wiley and Sons Ltd.
Ribereau-Gayon, P., Dubourdieu, D., Doneche, B., and Lonvaud, A. (2006b). “Handbook of enology vol 2,” in The chemistry of wine stabilization and treatments. Second Edn (John Wiley and Sons Ltd).
Riou, V., Vernhet, A., Doco, T., and Moutounet, M. (2002). Aggregation of grape seed tannins in model wine—effect of wine polysaccharides. Food Hydrocoll. 16 (1), 17–23. doi:10.1016/S0268-005X(01)00034-0
Rojas, C. C., Wahlund, K.-G., Bergenståhl, B., and Nilsson, L. (2008). Macromolecular geometries determined with field-flow fractionation and their impact on the overlap concentration. Biomacromolecules 9 (6), 1684–1690. doi:10.1021/bm800127n
Sarni-Manchado, P., Deleris, A., Avallone, S., Cheynier, V., and Moutounet, M. (1999). Analysis and characterization of wine condensed tannins precipitated by proteins used as fining agent in enology. Am. J. Enology Vitic. 50 (1), 81 LP–86. doi:10.5344/ajev.1999.50.1.81
Saulnier, L., Mercereau, T., and Vezinhet, F. (1991). Mannoproteins from flocculating and non-flocculating Saccharomyces cerevisiae yeasts. J. Sci. Food Agric. 54 (2), 275–286. doi:10.1002/jsfa.2740540214
Seidel, L., Albuquerque, W., Happel, K., Ghezellou, P., Gand, M., Spengler, B., et al. (2024). Composition, ζ potential, and molar mass distribution of 20 must and wine colloids from five different cultivars obtained during four consecutive vintages. J. Agric. Food Chem. 72 (4), 1938–1948. doi:10.1021/acs.jafc.2c09048
Ştefănescu, R., Brebu, S., Matei, M., Risca, I. M., Surleva, A. R., and Drochioiu, G. (2017). Contribution to casein determination by UV spectrophotometry. Acta Chem. Iasi 25, 112–126. doi:10.1515/achi-2017-0011
Vidal, S., Francis, L., Williams, P., Mariola, K., Gawel, R., Véronique, C., et al. (2004). The mouth-feel properties of polysaccharides and anthocyanins in a wine like medium. Food Chem. 85, 519–525. doi:10.1016/S0308-8146(03)00084-0
Keywords: AF4, wine colloids, wine macromolecules, characterization, winemaking
Citation: Osorio-Macías DE, Ferrer-Gallego R, Choi J and Bergenståhl B (2025) Asymmetric flow field-flow fractionation for the monitoring of red wine colloids and macromolecules throughout the winemaking process. Front. Soft Matter 5:1579973. doi: 10.3389/frsfm.2025.1579973
Received: 19 February 2025; Accepted: 05 May 2025;
Published: 19 May 2025.
Edited by:
Jiangtao Zhou, ETH Zürich, SwitzerlandCopyright © 2025 Osorio-Macías, Ferrer-Gallego, Choi and Bergenståhl. This is an open-access article distributed under the terms of the Creative Commons Attribution License (CC BY). The use, distribution or reproduction in other forums is permitted, provided the original author(s) and the copyright owner(s) are credited and that the original publication in this journal is cited, in accordance with accepted academic practice. No use, distribution or reproduction is permitted which does not comply with these terms.
*Correspondence: Björn Bergenståhl, Ympvcm4uYmVyZ2Vuc3RhaGxAcGxlLmx0aC5zZQ==