 Naveed Hayat
 Ghulam Mustafa
 Muhammad Naeem
 Bader Alhafi Alotaibi
 Abou Traore3
- 1Department of Economics, Division of Management and Administrative Science, University of Education, Lahore, Pakistan
- 2Department of Agricultural Extension and Rural Society, College of Food and Agriculture Sciences, King Saud University, Riyadh, Saudi Arabia
- 3Department of Community Sustainability, College of Agricultural and Natural Resources, Michigan State University, East Lansing, MI, United States
The contemporary business environment places significant emphasis on sustainability, safety, and quality, particularly within the food processing industry. This sector is intrinsically linked to environmental stewardship, occupational health, and food safety, necessitating stringent standards to ensure compliance and enhance performance. As a result, management systems certifications such as ISO 14001 (Environmental Management System), ISO 45001 (Occupational Health and Safety Management System), and ISO 22000 (Food Safety Management System) have gained prominence. This paper analyzes the effect of ISO 14001, ISO 45001, and ISO 22000 on the food processing companies ‘environmental and financial performance. The analysis of fixed effect regressions applied to data from 19 food processing companies listed on the Pakistan Stock Exchange shows that management system certifications have a substantial positive impact on both environmental and financial performance. This evidence suggests that such certifications are key drivers of sustainable performance in the food processing sector. Additionally, factors such as company size, market share, and export ratio positively influence environmental performance. Conversely, real raw materials costs, real energy costs, and involvement in the food and beverage sector negatively affect environmental performance. In terms of financial performance, sales growth, current ratio, and asset turnover ratio show positive effects, while the dairy, food and beverages, and edible oil sectors have a negative impact.
1 Introduction
The sustainable performance of food processing companies encompasses environmental, social, and financial dimensions. To make the food processing companies liable to achieve sustainable performance, various policymakers introduced several regulatory measures like liability laws, emission standards, pollution taxes, emission permits, strict bans, and other regulatory measures. Recently, voluntary measures for achieving sustainable performance in the food processing industries have gained a global importance. The adoption of voluntary management system certifications are the most important and effective voluntary measures that promise a sustainable performance in the food processing sector. The common management system certifications in the food processing sector are ISO 14001 (Environmental Management System), ISO 45001 (Occupational Health and Safety Management System), and ISO 22000 (Food Safety Management System) (Agus et al., 2020). These voluntary certifications help the food processing companies in securing food safety, reducing adverse environmental impact of their operations, and reducing workplace hazards. This ultimately reduce the adverse environmental impact of food processing companies, enhance the efforts they take for fulfilling their social responsibilities, and improve their financial performance (Emamisaleh et al., 2018). At the consumer side, the demand for certified food products in the global market is growing, this open new opportunities for food processing companies. Thus, by adopting ISO 14001, ISO 45001, and ISO 22000 standard for their environmental, health and safety, and food safety management systems, the food processing companies on one side can achieve sustainable performance and on other side can expand their customer base and market share (Carrillo-Labella et al., 2020; Gonçalves et al., 2020).
ISO 14001, a globally recognized standard for environmental management system helps the food processing companies to manage their environmental responsibilities on a holistic manner. The implementation of ISO 14001 has promise improvement in environmental performance because the standard enables the companies in resource utilization, waste management, and energy use (Boiral and Henri, 2012). To investigate this fact empirically, several researchers in the past carried out their studies focusing on food processing companies. For an instant, Prajogo et al. (2014) found that the adoption of ISO 14001 certification helped the food processing companies in reduction of greenhouse gas emissions, waste, and energy usage which ultimately improved their environmental performance. Similarly, Nawrocka et al. (2009) found a significant reduction in the waste generation and energy consumption of the ISO 14001 certified companies. Besides, the adoption of ISO 14001 makes it easier for the companies to easily comply with environmental regulation. The outcomes of Potoski and Prakash (2005) are consistent with this fact, they found that the implementation of ISO 14001 make it easier for the companies to comply easily with local and global environmental laws and regulations. Moreover, ISO 14001 also enable the companies to use their resources up to an optimal level, which further cut-off the production cost. Findings from Melnyk et al. (2003) study revealed that ISO 14001-certified companies experienced a significant reduction in resources consumption and waste generation. Likewise, the implementation of ISO 14001 not only improve the companies’ performance but it can help the companies in image building and attracting eco-consumers. The findings of Darnall et al. (2008) support this statement, they found that as compared to non-certified companies, the ISO 14001 certified companies had a competitive edge in the local and foreign markets.
For an efficient occupational health and safety management system, the International Standardization Organization (ISO) introduced ISO 45001 standard (replacement for OHSAS 18001) in 2018. The implementation of ISO 45001 control the workplace hazards, keeping the workers healthy and energetic, and enhance their productivities (Zwetsloot et al., 2020). The implementation of ISO 45001 promise healthy and safe workplace for worker, this further improve production efficiencies and lower down the number of workplace incidents, health risks, and absence from work (Fernández-Muñiz et al., 2009). ISO 45001 purely deals with occupational health and safety management; however, its adoption can also help in enhancing environmental performance of the companies. As Nordlöf et al. (2017) pointed out that along with health and safety the adoption of ISO 45001 standard has the potential to reduce the environmental impacts of the companies. Likewise, the adoption of ISO 45001 also played an important role in cost saving because it reduces the companies’ health insurance and compensation expenses. Fernández-Muñiz et al. (2009) revealed that the companies who adopted ISO 45001 standard for their occupational health and safety management systems were experience fewer workplace incidents, illness, absenteeism from work and hence fewer compensation and medical expenses. Further, Vinodkumar and Bhasi (2010) found that the implementation of ISO 45001 provides healthy and safe working environment at workplace which further improve the production of the companies.
ISO 22000 is an international standard for food safety management system. The standard followed the principles of Hazard Analysis and Critical Control Points (HACCP). The adoption of ISO 22000 forced the food processing companies to strictly follow the food safety procedures at all stages of food processing; resultantly, the companies provide safe and healthy foods to its customers that reduce the chances of food-poisoning and other food borne diseases (Mensah and Julien, 2011). Thus, the adoption of this standard not only increase the customer base and market share but it can also promote healthy society by provide safe foods (Wallace et al., 2018). This standard also helps the companies in introducing and using sustainable food processing methods, this further reduce the food waste and enhance raw materials efficiency. Karaman et al. (2012) found that ISO 22000 certified food processing companies experience better environmental performance, improved reputation in the market, increased customer trust, and better competitive position in the market.
The integration of ISO 14001, ISO 45001, ISO 22000 certifications by food processing companies is more beneficial than using a signal management system standard because integrations enhancing the companies’ financial and environmental performance quickly. The integration on one hand, improve the companies’ environmental outcomes by reducing pollution load, waste generation, limiting the use of hazardous chemicals, fewer greenhouse gas emissions, efficient water usage, and efficient resource use and on other hand, it enhances financial performance (or profitability) by resources utilization, production efficiencies, increase in customer trust, and finding new market opportunities with customers that are ready to pay premium prices for management system certified products (Jannah et al., 2020). This resulting in long-term advantages to both the environment and the company’s reputation. As a result, food labelling and certifications are effective instruments for increasing sustainability in the food processing industry (Sirieix et al., 2013).
The integration of management system standards also makes it easy for companies to comply with international rules and regulation and increase brand loyalty; thus, open ways for the companies to exports its food product to most profitable foreign destinations (Agus et al., 2020). Therefore, strategically exploiting food labelling and certification can lead to sustainable financial growth and a competitive edge in the market (Liu et al., 2020). According to Agus et al. (2020) and Jannah et al. (2020), the integration of management system standards leads to a holistic management system which further improve the social reputation of the food processing companies by improved worker health, provide safe working environment for workers, and supplying safe food items for customers (Agus et al., 2020; Jannah et al., 2020).
According to the preceding discussion, most of the prior research looking into the impact of management system certifications on companies’ performance have concentrated on food processing companies in technologically advanced countries. Similarly, these studies often look at the impact of one or two types of management system certifications on the companies’ performance. However, the food processing sector of Pakistan differs significantly from the food processing sectors in technologically advanced countries in terms of food labeling and certifications. In Pakistan, regulatory authorities for food safety labeling, such as the Pakistan Standards and Quality Control Authority (PSQCA) and the Punjab, Sindh, Khyber Pakhtunkhwa, and Baluchistan Food Authorities, mostly oversee the local mandatory food labeling and certifications. Thus, the food processing companies in the county is less willing to adopt the internationally recognized voluntary certifications like ISO 14001, ISO 45001, and ISO 22000. Furthermore, consumer awareness about the internationally certified food products in Pakistan is still limited, with price often being the primary purchase factor, whereas in advanced economies, consumers actively seek products with labels indicating organic certification, sustainability, and ethical sourcing (Khan et al., 2020). Thus, there is a substantial gap in the research regarding the analysis of such effects on food processing companies in Pakistan, particularly those listed on the Pakistan Stock Exchange (PSX). Management system certifications can improve the physical and environmental quality and safety of products in Pakistan’s food processing industry, building connections with consumers and stakeholders. Implementing best production practices and adopting sustainable manufacturing procedures can allows the food processing companies of Pakistan to not only strengthen their local and global market presence, but also promote confidence and credibility among customers and stakeholders.
Given this context, the current study seeks to assess the impact of Environmental, Occupational Health and Safety, and Food Safety Management Systems Certifications (ISO 14001, ISO 45001, and ISO 22000) on the environmental and financial performance of Pakistani food processing companies. Adoption of these certifications has the potential to significantly improve these companies’ long-term performance. The current study will help managers and policymakers in understanding the impact of management system certifications on Pakistan’s food processing industry. The findings will be critical for policymakers in evaluating the existing use of these certificates and implementing strategies to encourage their widespread acceptance across the industry, ultimately supporting a more sustainable food production system.
2 Materials and methods
2.1 Data and its source
In order to assess how ISO 14001, ISO 45001, and ISO 22000 affect the financial and environmental performance of food processing companies, we examined panel data from 19 food processing companies that have been listed for 15 years, from 2009 to 2023, on the Pakistan Stock Exchange (PSX). Initially, we selected the entire 22 food processing companies listed at PSX but we found that 3 companies listed at PSX stopped production for certain years. Therefore, we did not include these companies into our data set. Our final dataset consists of 19 food processing companies1. The relevant data is taken from the State Bank of Pakistan (2010, 2013, 2015, 2017, 2018, 2022) and from the annual reports of the companies. The State Bank of Pakistan (2010, 2013, 2015, 2017, 2018, 2022) provided information on financial performance indicators such as net profit margin, total sales, export sales, current ratio, debt-to-equity ratio, and asset turnover ratio. Additionally, annual reports supplied data on output (production), company size, and age.
For constructing a resource efficiency index, data on raw material consumption and consumption of fuel, steam, electricity, and water were obtained from the companies’ annual reports. Notably, data for 2023 were missing for some variables; these gaps were filled using information from annual reports. Due to incomplete data for some companies across various years, our study employs an unbalanced panel data approach. Information regarding the adoption of ISO 14001, ISO 45001, and ISO 22000 was gathered by visiting the companies’ websites and reviewing their annual reports, where most companies disclose their certification status.
Additionally, data on the subsectors and cities in which these companies operate were collected from their official websites. All quantitative variables from these data sources were initially in nominal terms. Therefore, we adjusted them to real terms by dividing by the Consumer Price Index (CPI) for the respective years. The CPI data were sourced from the World Bank (2024). These real variables were then used in our empirical estimations.
2.2 Empirical estimates
In this section, we discuss the empirical methods to analyze the effect of ISO 14001, ISO 45001, and ISO 22000 on the food processing companies’ environmental and financial performance. To provide theoretical background to this study we follow the Resource-Advantage (R-A) theory. According to R-A theory a company superior performance and a sustainable competitive position depends primarily on its resources. The key challenge for a company is to transform its basic resources into core competencies, which form the foundation of superior competitive positions in market. The basic idea of R-A theory is that if a company use resources that are difficult to imitate and substitute leads to superior performance for that company. For achieving the superior performance, a company cannot acquired these resources but the company can developed these resources (O'Keeffe et al., 1998). To link ISO 14001, ISO 45001, and ISO 22000 to the food processing company environmental and financial performance in the light of R-A theory, we focused on three intangibles namely, innovation resources, human capital, and reputation resources (Djupdal, 2011). In order to analyze the effect of ISO 14001, ISO 45001, and ISO 22000 on the companies environmental and financial performance in the light of R-A theory, we follow the panel data model of (Azomahoua et al., 2001). The model specification is as follows:
where represents the explained variable for the company at time , specifically the environmental performance measured by the resource efficiency index, denotes the dependent variable for the company at time , representing the financial performance, such as the net profit margin, is a dummy variable that equals 1 if the company has adopted ISO 14001, ISO 45001, or ISO 22000 at time , and 0 otherwise. The variables and are sets of explanatory variables affecting the environmental and financial performance of the company, respectively. and are random error terms, while , , , and are parameters to be estimated. These parameters may be positive or negative and can achieve statistical significance at various levels, 1% (p < 0.01), 5% (p < 0.05), and 10% (p < 0.1); alternatively, they may also be found to be insignificant. represents the company fixed effect and replicates left out variables which are remain roughly the same over time for the company, and capture unobservable firm heterogeneity. represents the time/year fixed effect and replicates omitted variables which effect the company in time period . Equations 1 and 2 represent the generalized forms of the two-way fixed effect panel data models. In these models, the dependent variables are the resource efficiency index and the net profit margin. The explanatory variables include: ISO 14001, ISO 45001, ISO 22000 adoption status of the company, company-specific factors, export status of the company, company growth, resource consumption, company competitiveness, and company financial performance indicators which are described below:
2.2.1 Environmental performance
ISO certifications enhance companies’ environmental performance (EP) by promoting more sustainable production processes. These certifications drive improvements in environmental practices, leading to greater overall sustainability in their operations (King et al., 2005). Measuring the environmental performance of a company is not an easy task because there are several indicators which reflect the environmental performance of a company. Combing these indicators to one environmental performance measure is very difficult. Therefore, various researchers used different environmental indicators for measuring the environmental performance at the company level. Tyteca (1996) identified three key types of EP indicators for companies: consumption of resource, waste discharge, and direct impacts on the natural environment. Details of these indicators are outlined in Table A of the Appendix. But, in emerging countries like Pakistan, companies often exhibit reluctance to disclose data on wastewater components and air pollutants, such as Biological Oxygen Demand (BOD), Chemical Oxygen Demand (COD), Total Suspended Solids (TSS), pH levels, nitrites, phosphates, heavy metals, carbon dioxide (CO2), nitrogen oxides (NOx), and sulfur dioxide (SO2). Additionally, information regarding the impact of their activities on biodiversity, landscape, the greenhouse effect, ozone layer depletion, and acid rain is frequently withheld (Tyteca, 1996). Due to the unavailability of data on wastewater and air pollutants, we focus on the first set of indicators; raw materials and energy consumption to construct a Resource Efficiency Index (REI). This index, adapted from the methodologies of Azomahoua et al. (2001), Tyteca et al. (2002), and Wagner et al. (2002), assesses a company’s efficiency in utilizing raw materials and energy during production. To develop this index, we calculate the real raw materials consumption per unit of output (RMC) and the real energy consumption per unit of output (EC) for each company using Equations 3 and 4, following the approaches outlined by Alanya et al. (2005), Chettiyappan et al. (1999) and Fei-Baffoe et al. (2013). To assess a company’s environmental performance, we use the REI as a proxy:
Subsequently, we use the following formula to determine each company’s RMC index:
where in Equation 5 is the lowest RMC value observed across all companies. The company with the lowest RMC is given the highest value of 1, which is allocated to this index, which has a range of 0 to 1. Likewise, we apply a similar methodology to determine each company’s Energy Consumption (EC) index:
where Equation 6 represents the lowest EC value observed across all companies. Lastly, we take the average of the RMC and EC indices to calculate the Resource Efficiency Index (REI) for every company:
This index given in Equation 7 has a value between 0 and 1, where 1 represents the greatest degree of resource efficiency among all companies.
2.2.2 Financial performance
The conventional microeconomic literature shows that implementing voluntary standards has a positive and significant effect on a company’s financial performance. To evaluate financial performance, we employ the net profit margin (Neeveditah et al., 2017). The net profit margin is defined as the fraction of profit that remains for the owners from each rupee of sales after deducting all expenses and taxes (Fraj‐Andrés et al., 2009).
2.2.3 ISO certifications adoption status of the company
The implementation of voluntary standards improves a company’s environmental and financial performance (Iraldo et al., 2009). We create three dummy variables with values 1 if the company acquired ISO 14001, ISO 45001, and ISO 22000 in year , 0 otherwise (Sarumpaet, 2006), such as:
2.2.4 Company-specific factors
In addition to adopting voluntary standards, specific company factors also impact environmental and financial performance (Iraldo et al., 2009). We take into account two important variables: the age of the company (Iraldo et al., 2009) and its size (Wagner et al., 2002). Company size is measured by the total number of employees, while company age is calculated based on the number of years the company has been operational (Horbach, 2008; Rehfeld et al., 2007; Tsireme et al., 2012).
2.2.5 Resource consumption
The company resource consumption also significantly affects its environmental performance. We use two resource consumption factors namely, the raw materials cost of the company and energy cost of the company (De Medeiros et al., 2014; Triguero et al., 2013).
2.2.6 Competitiveness
Adopting voluntary standards enables a company to potentially increase its rivals’ costs and enhance its competitive position within the market and industry. To assess the impact of competitiveness on environmental and financial performance, we use market share, defined as the ratio of the company’s actual sales to the total sales within all companies included in the sample (Delmas and Pekovic, 2015; Gumbau-Albert and Maudos, 2002; O'Brien and Torugsa, 2011; Segarra-Blasco and Jove-Llopis, 2019).
2.2.7 Export status of the company
Pressure from foreign consumers and international environmental, health, and food safety regulations can drive a company to enhance its environmental performance. Producing environmentally friendly, healthy, and safe food products can lead to increased demand in foreign markets. To assess this impact, we use the export ratio, which is calculated as the ratio of the company’s real export sales to its total real sales (Miroshnychenko et al., 2017; Wagner et al., 2002).
2.2.8 Firm growth
There is also a vast amount of research that suggests that the company growth has a positive influence on the company performance. As a proxy for firm growth, the difference of real sales for company between time and is used (Amiri et al., 2015; Goedhuys and Mohnen, 2017; Nishitani, 2011).
2.2.9 Financial performance indicators
A company’s financial performance is significantly impacted by financial leverage (Khan et al., 2018; Raihan et al., 2017). The debt-to-equity ratio is used to account for financial leverage (Wagner et al., 2002). Profitability can only be increased by efficient liquidity management, which reduces input needs and offers competitive advantages in recessions. The current ratio, which is computed by dividing current assets by current liabilities, is used to assess a company’s liquidity (Batchimeg, 2017; Vieira et al., 2019; Yusop et al., 2021). In addition, we evaluate asset efficiency using the asset turnover ratio, which assesses how successfully a company uses its assets to produce sales revenue.
2.2.10 Firms’ characteristics
To analyze fixed effects within the food processing subsector, we introduce dummy variables for the four subsectors represented in our sample. We use three dummies, where each dummy is assigned a value of 1 if the company belongs to a specific subsector and 0 otherwise (Grolleau et al., 2007; Horbach, 2008). Similarly, to account for city-specific effects, we include dummies for the cities where the companies operate (Hayat et al., 2020). Since many firms are based in Karachi and Lahore, we create two dummies: one for Karachi and one for Lahore. Each dummy is assigned a value of 1 if the company is located in the respective city and 0 otherwise.
3 Results and discussion
3.1 Trends in management systems certifications overtime
To analyze the trends in the adoption of Environmental Management System (ISO 14001), Occupational Health and Safety Management System (ISO 45001), and Food Safety Management System (ISO 22000) among Pakistani food processing companies from 2009 to 2023, we use data from 19 companies listed on the Pakistan Stock Exchange (PSX). As shown in Figure 1, in 2009, only 20% of these companies were ISO 14001 certified. By 2023, this number had increased to 35%, representing a 15% rise over the period. Similarly, the proportion of ISO 45001 certified companies grew from 15% in 2009 to 35% in 2023, reflecting a 20% increase. The percentage of companies with ISO 22000 certification rose from 20% in 2009 to 45% in 2023, marking a 25% increase.
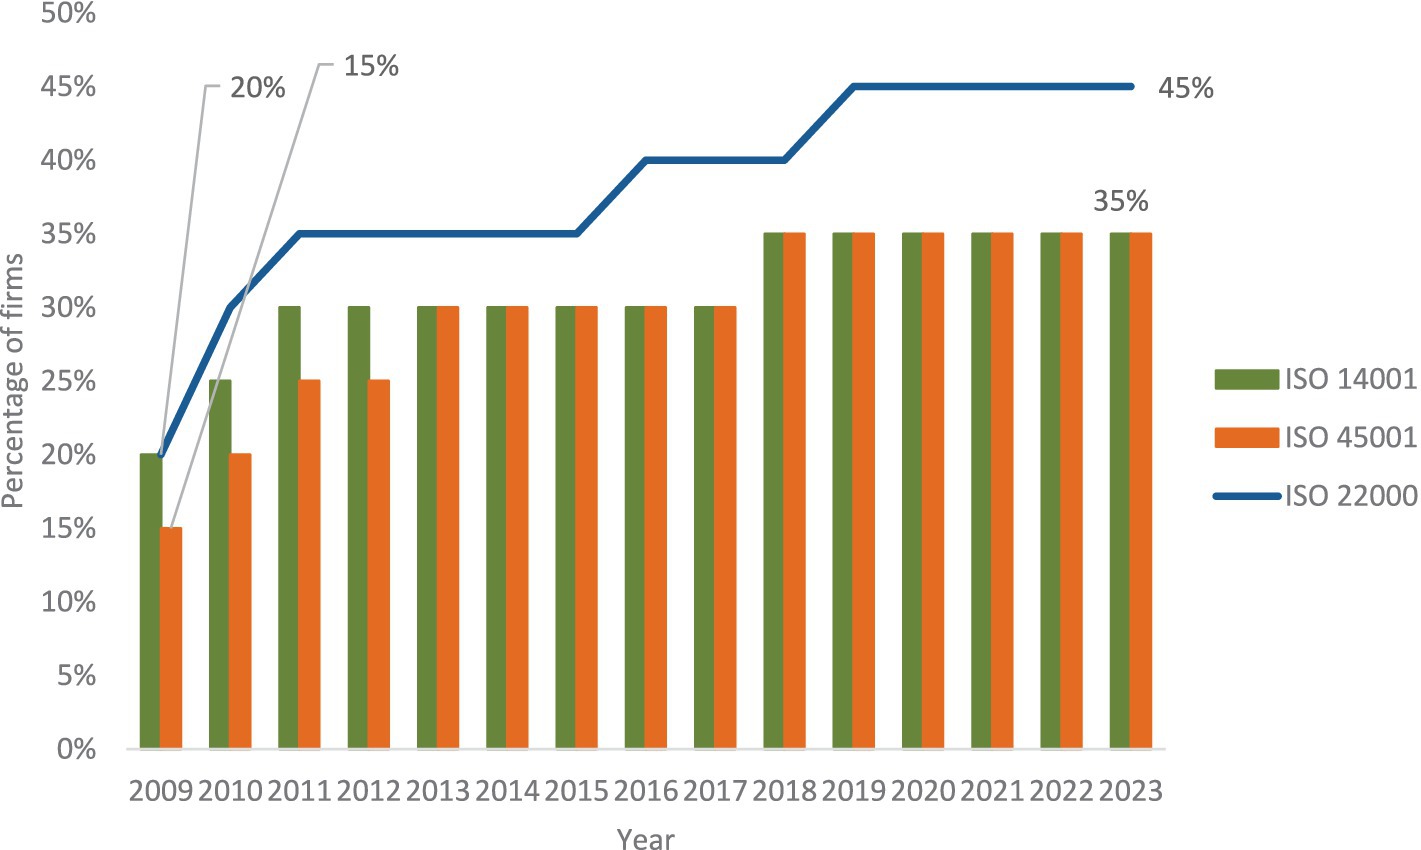
Figure 1. ISO 14001, ISO 45001, and ISO 22000 certified food processing companies listed at PSX. Source: Calculated by the authors using data from food processing companies listed on the PSX.
This significant increase in ISO 14001, ISO 45001, and ISO 22000 certifications can be linked to a greater understanding of the environmental, financial, economic, and social benefits of these certifications. Furthermore, increased demand for sustainable and safe food items in both domestic and foreign markets is believed to have influenced this development. The certifications provide major practical benefits to food processing companies, such as reduced raw material usage, lower energy consumption, greater process efficiency, lowered waste generation and disposal costs, and enhanced resource recovery.
Because of these benefits, ISO 14001, ISO 45001, and ISO 22000 certified food processing companies have superior resource efficiency than non-certified companies. Similarly, the application of ISO 14001, ISO 45001, and ISO 22000 enabled food companies to make better use of their inputs such as physical capital, human capital, and raw resources. Furthermore, the use of ISO 14001, ISO 45001, and ISO 22000 improves operational safety. This better utilization of inputs increases total factor productivity of the certified companies. Consequently, the ISO 14001, ISO 45001, and ISO 22000 certified companies’ experiences higher economic efficiency is compared to the non-certified companies.
3.2 Descriptive statistics
Table 1 provides the descriptive statistics and definitions of the key variables used in this study. It is noted that the average environmental performance, as indicated by the Resource Efficiency Index, is higher for ISO 14001, ISO 45001, and ISO 22000 certified food processing companies (0.18) compared to non-certified companies (0.16 and 0.17). Financial performance, measured by the net profit margin, is also significantly better for ISO 14001 and ISO 45001 certified companies (0.09) compared to non-certified firms (−0.01). However, the financial performance of ISO 22000 certified companies (0.05) is like that of non-certified companies. Regarding company-specific variables, the average age of ISO 14001, ISO 45001, and ISO 22000 certified companies ranges from 19 to 21 years, whereas non-certified companies have an average age between 16 and 17 years. The average size of certified companies ranges from 966 to 1772 employees, compared to 511 to 888 employees for non-certified companies. In terms of environmental factors, certified companies have higher average values for real raw materials cost and real energy cost (both logged) compared to their non-certified counterparts. Market share is also notably higher for ISO 14001, ISO 45001, and ISO 22000 certified companies (0.98, 0.93, 0.51) versus non-certified companies (0.22, 0.21, 0.42). Similarly, the average export ratio for certified companies (0.36, 0.35, 0.35) exceeds that of non-certified firms (0.04, 0.08, 0.1).
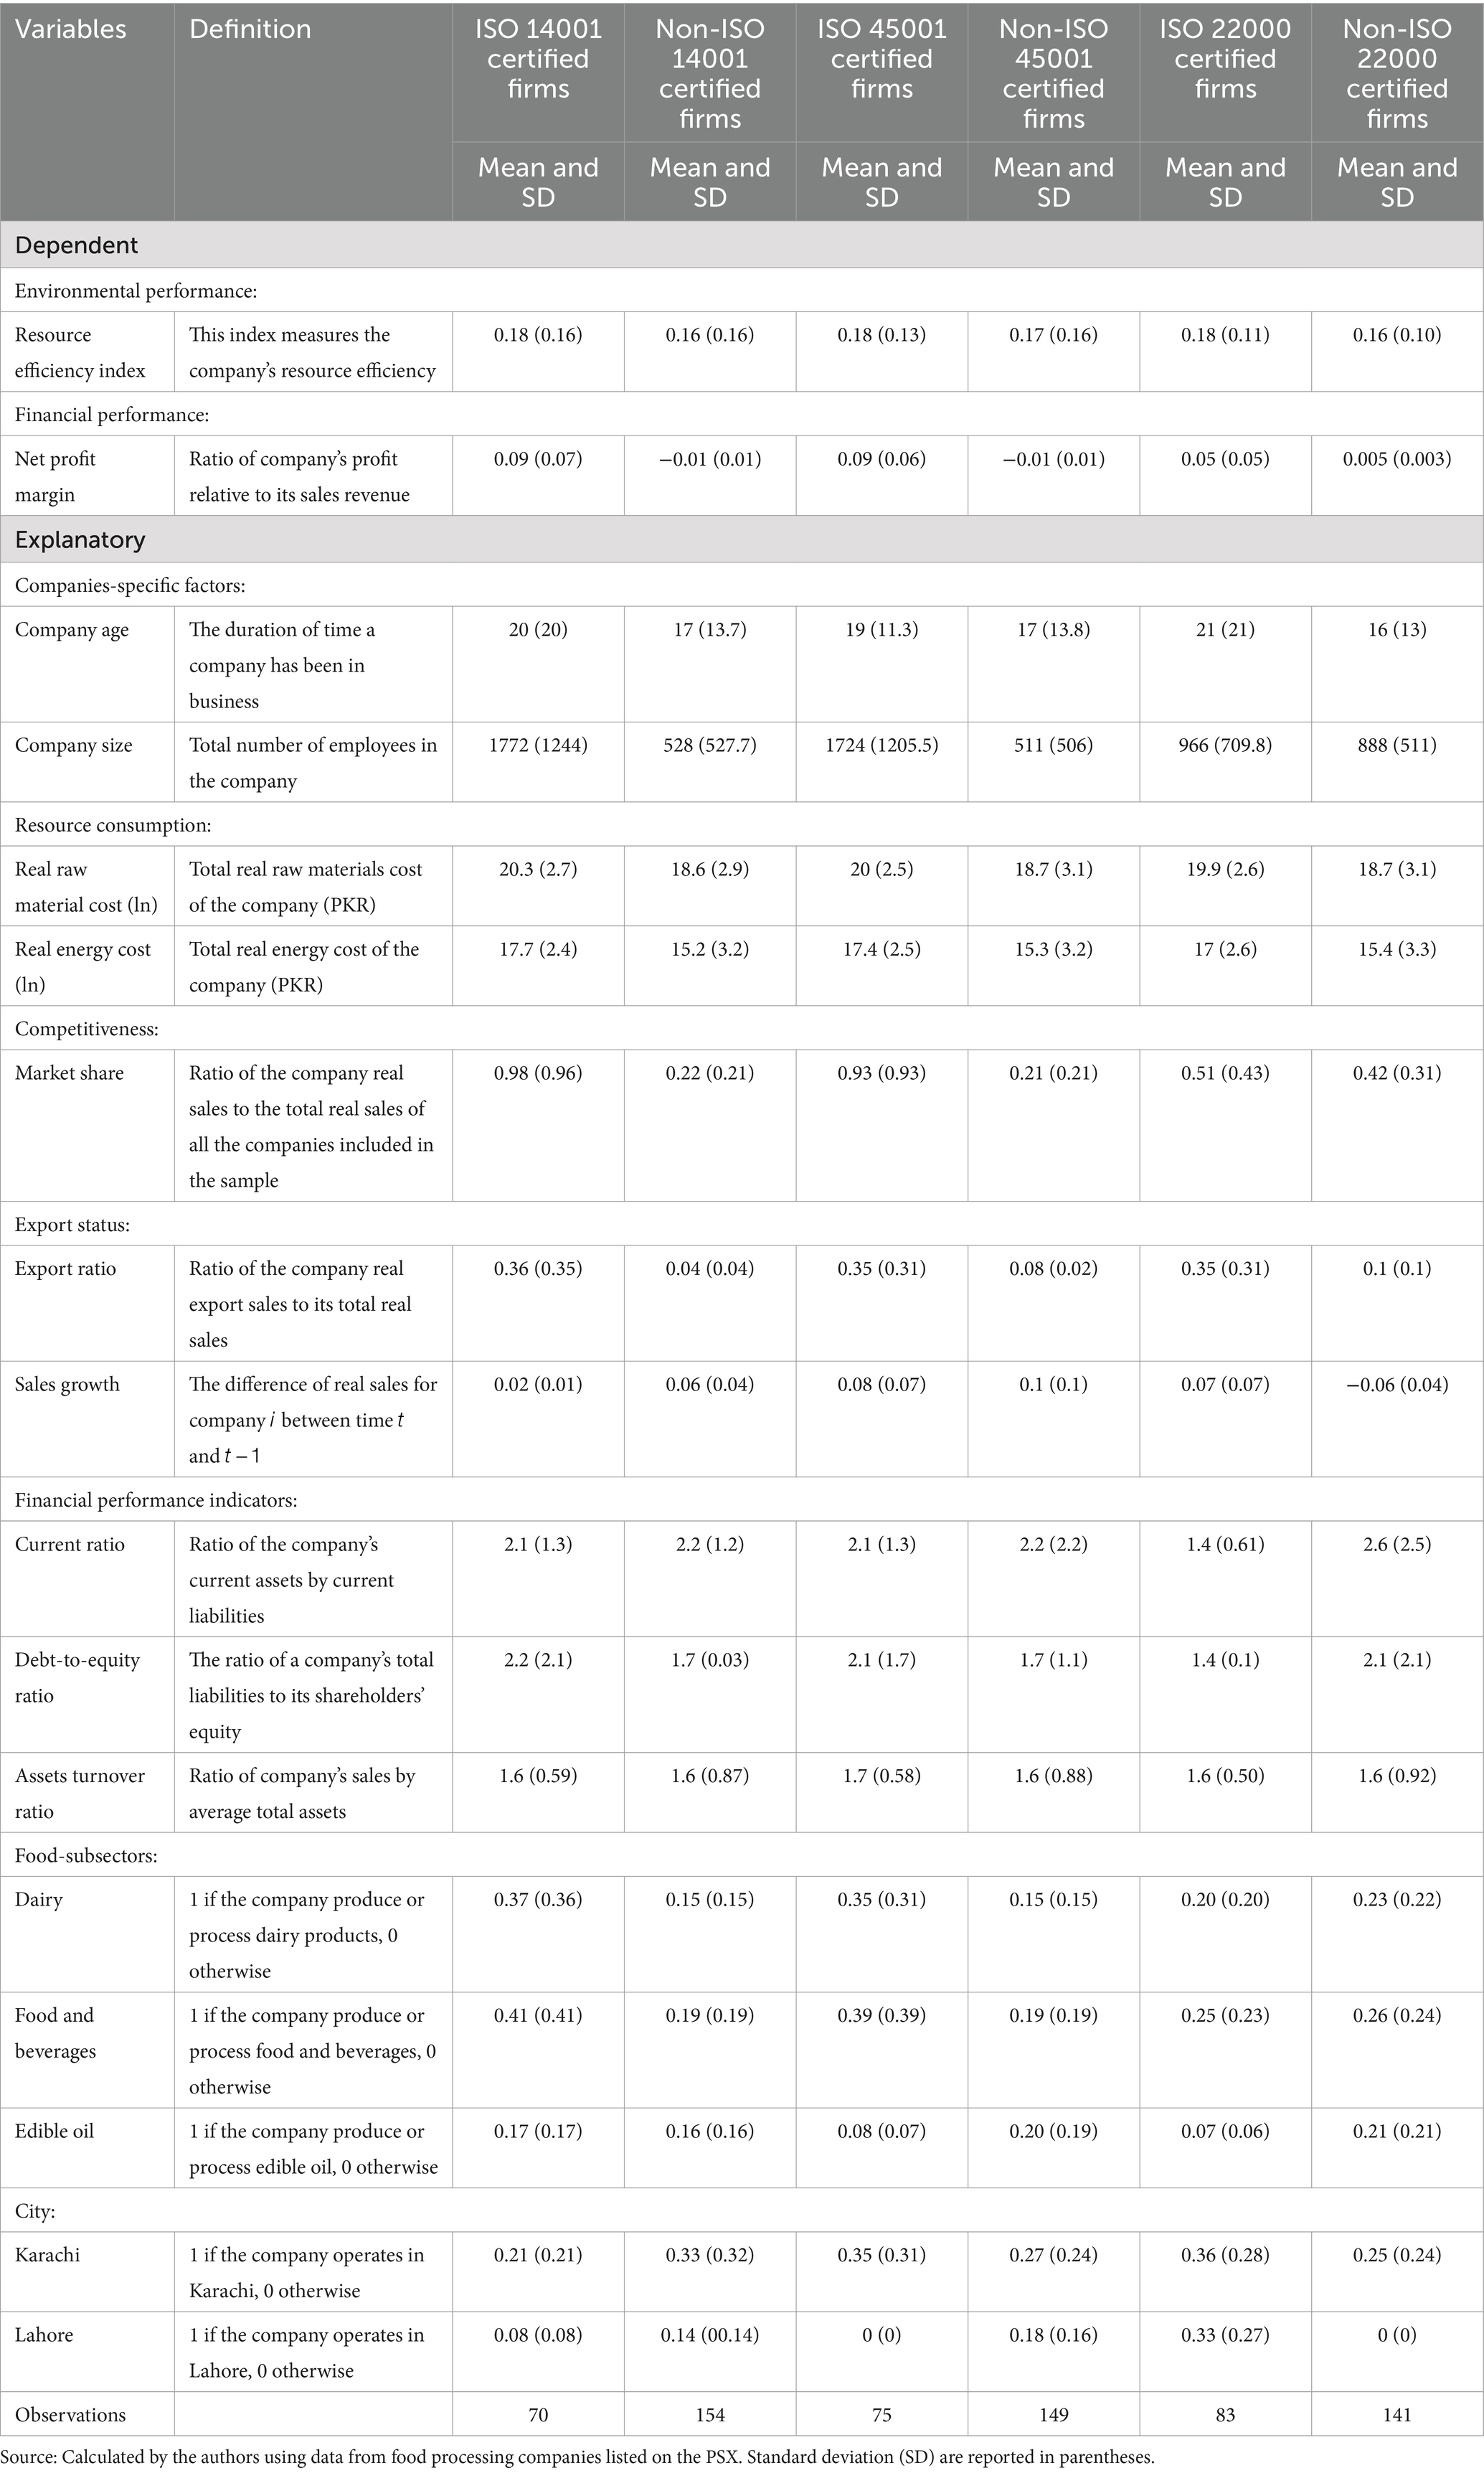
Table 1. Descriptive statistics.
Sales growth varies across certifications: ISO 14001 and ISO 45001 certified companies show lower average sales growth (0.02, 0.08) compared to non-certified firms (0.06, 0.1), whereas ISO 22000 certified companies exhibit higher sales growth (0.07) compared to their non-certified counterparts (−0.06). Current ratios are relatively lower for ISO 14001 and ISO 45001 certified companies but higher for ISO 22000 certified companies related to non-certified companies. The debt-to-equity ratio is higher for ISO 14001 and ISO 45001 certified companies compared to non-certified companies, while ISO 22000 certified companies have a lower debt-to-equity ratio. Additionally, the asset turnover ratio is higher for ISO 45001 certified companies compared to non-certified firms, while ISO 14001 and ISO 22000 certified companies show similar asset turnover ratios to non-certified companies. Among ISO 14001 certified companies, 37% are in the dairy processing subsector, 41% are in the food and beverages subsector, and 17% are in the edible oil subsector.
In similar fashion, the companies who acquired ISO 45001, 35 percent of them belong to dairy processing subsector, 39 percent of them belongs to food and beverages subsector, and 8 percent of them belongs to edible oil subsector. Likewise, the companies who acquired ISO 22000, 20 percent of them belong to dairy processing subsector, 25 percent of them belongs to food and beverages subsector, and 7 percent of them belongs to edible oil subsector. Finally, the companies who implemented ISO 14001, 21 percent of them operating in Karachi and 8 percent of them operating in Lahore. Similarly, the companies who acquired ISO 45001, 35 percent of them operating in Karachi. Likewise, the companies who acquired ISO 22000, 36 percent of them operating in Karachi and 33 percent of them operating in Lahore.
3.3 Results of the fixed effect regressions
In this section, we present the findings from fixed effect regressions to examine how Environmental, Occupational Health and Safety, and Food Safety Management Systems Certifications (ISO 14001, ISO 45001, ISO 22000) impact the environmental and financial performance of food processing companies. We estimate fixed effect models for two performance measures: the Resource Efficiency Index and the Net Profit Margin. Specifically, we perform a total of six regressions for each performance measure. For the environmental performance measure, we incorporate both time and company fixed effects in the initial set of regressions. In the second set, focusing on financial performance, we include only time fixed effects. The diagnostic test results for the three environmental performance models are summarized in the final section of Table 2.
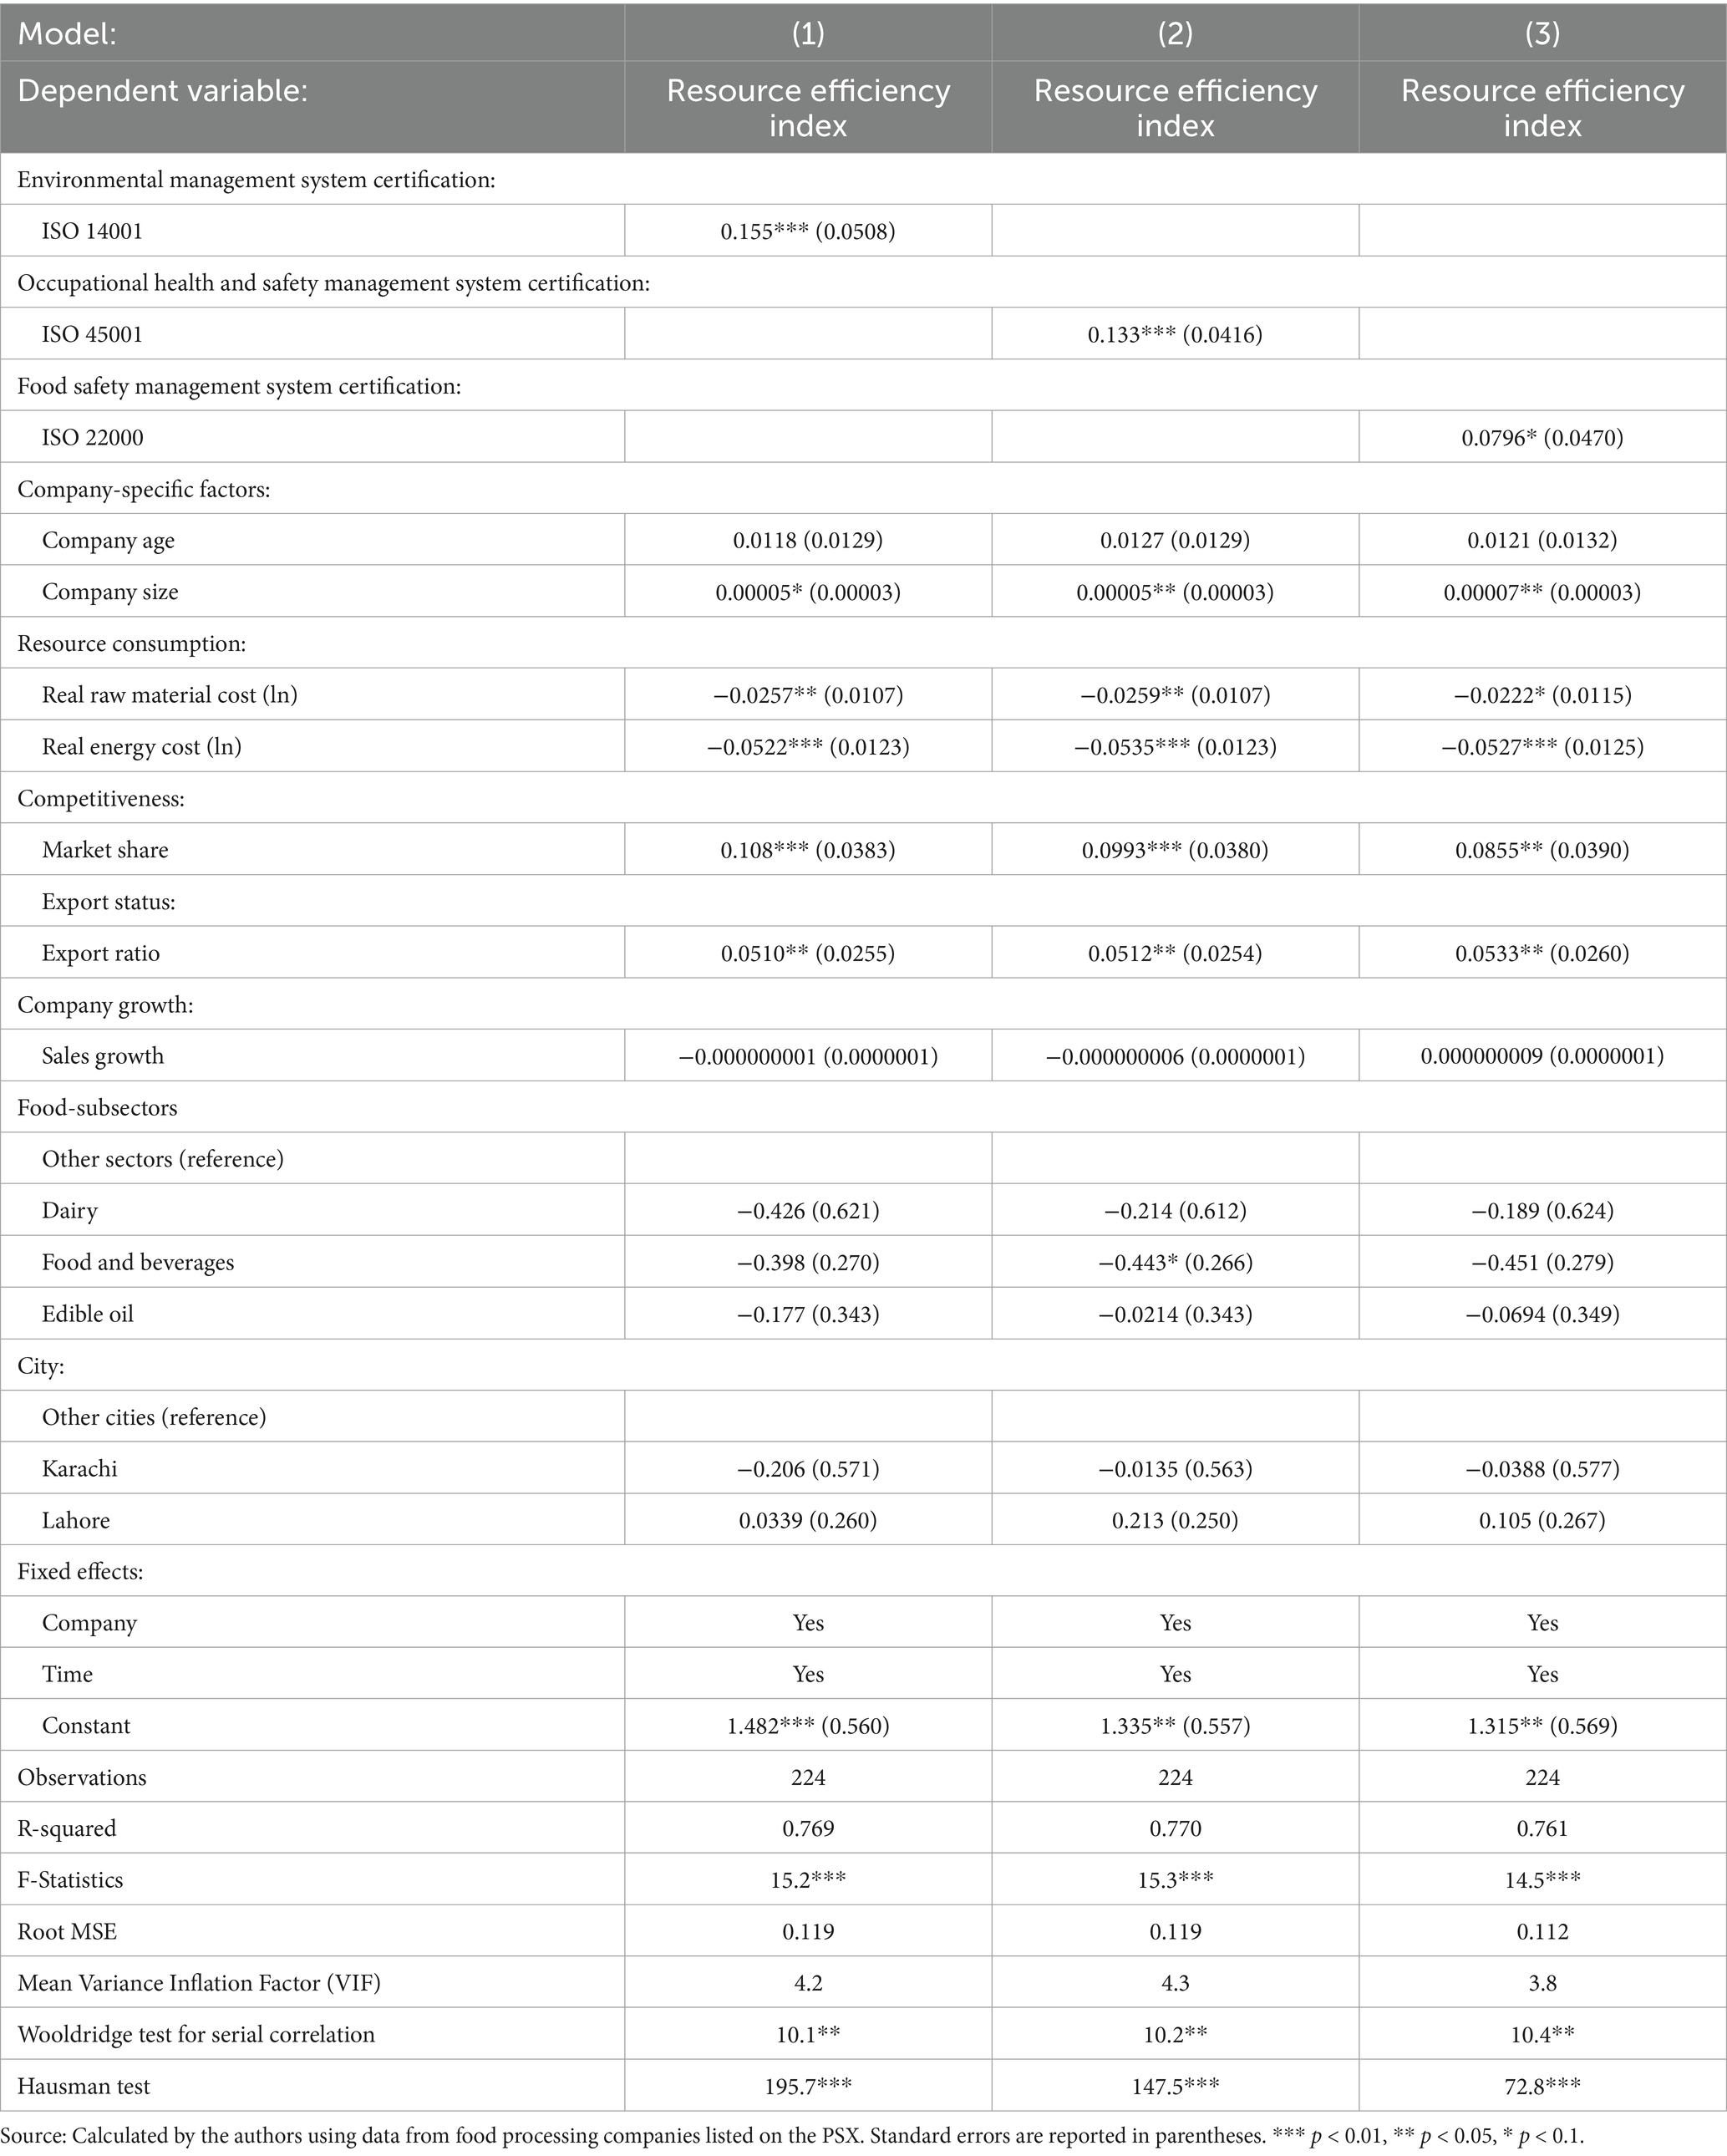
Table 2. Results of fixed effect regression with resource efficiency index (environmental performance).
Here, the R-squared values range from 0.76 to 0.77, with the Root Mean Square Error (Root MSE) varying between 0.11 and 0.12. The F test results indicate that the regression models are statistically significant at the 1% level for all three environmental regressions. Similarly, the diagnostic test results for the financial performance models are detailed in the last section of Table 3. In these models, the R-squared values range from 0.20 to 0.24, and the Root MSE ranges from 0.25 to 0.26. The F test results demonstrate that these regression models are statistically significant at the 5 and 10% levels for each of the three financial performance regressions. Furthermore, the Mean Variance Inflation Factor (VIF) of the six regression models are lower than 10, indicating that there is no multicollinearity among the explanatory variables used in the six regression models. It is reasonable since we combined cross-sectional and time series data (panel data) which is one of the most important remedial measures to correct the problem of multicollinearity. For checking the serial correlation among the variables, we perform Wooldridge test for serial correlation. Based on statistically significant values of the test for the six regression models, we reject the null hypothesis of no serial correlation. However, the problem of serial correlation is corrected using firm, time, sub-sector, and regional fixed effects into our six regression models. Finally, on the basis of statistically significant values of the Hausman test for the six regressions models, we reject the null hypothesis that random effects models are consistent and efficient compared to fixed effects models. Thus, we concluded that the fixed effect models are more appropriate than random effect models. Therefore, we have proceeds with fixed effect models.
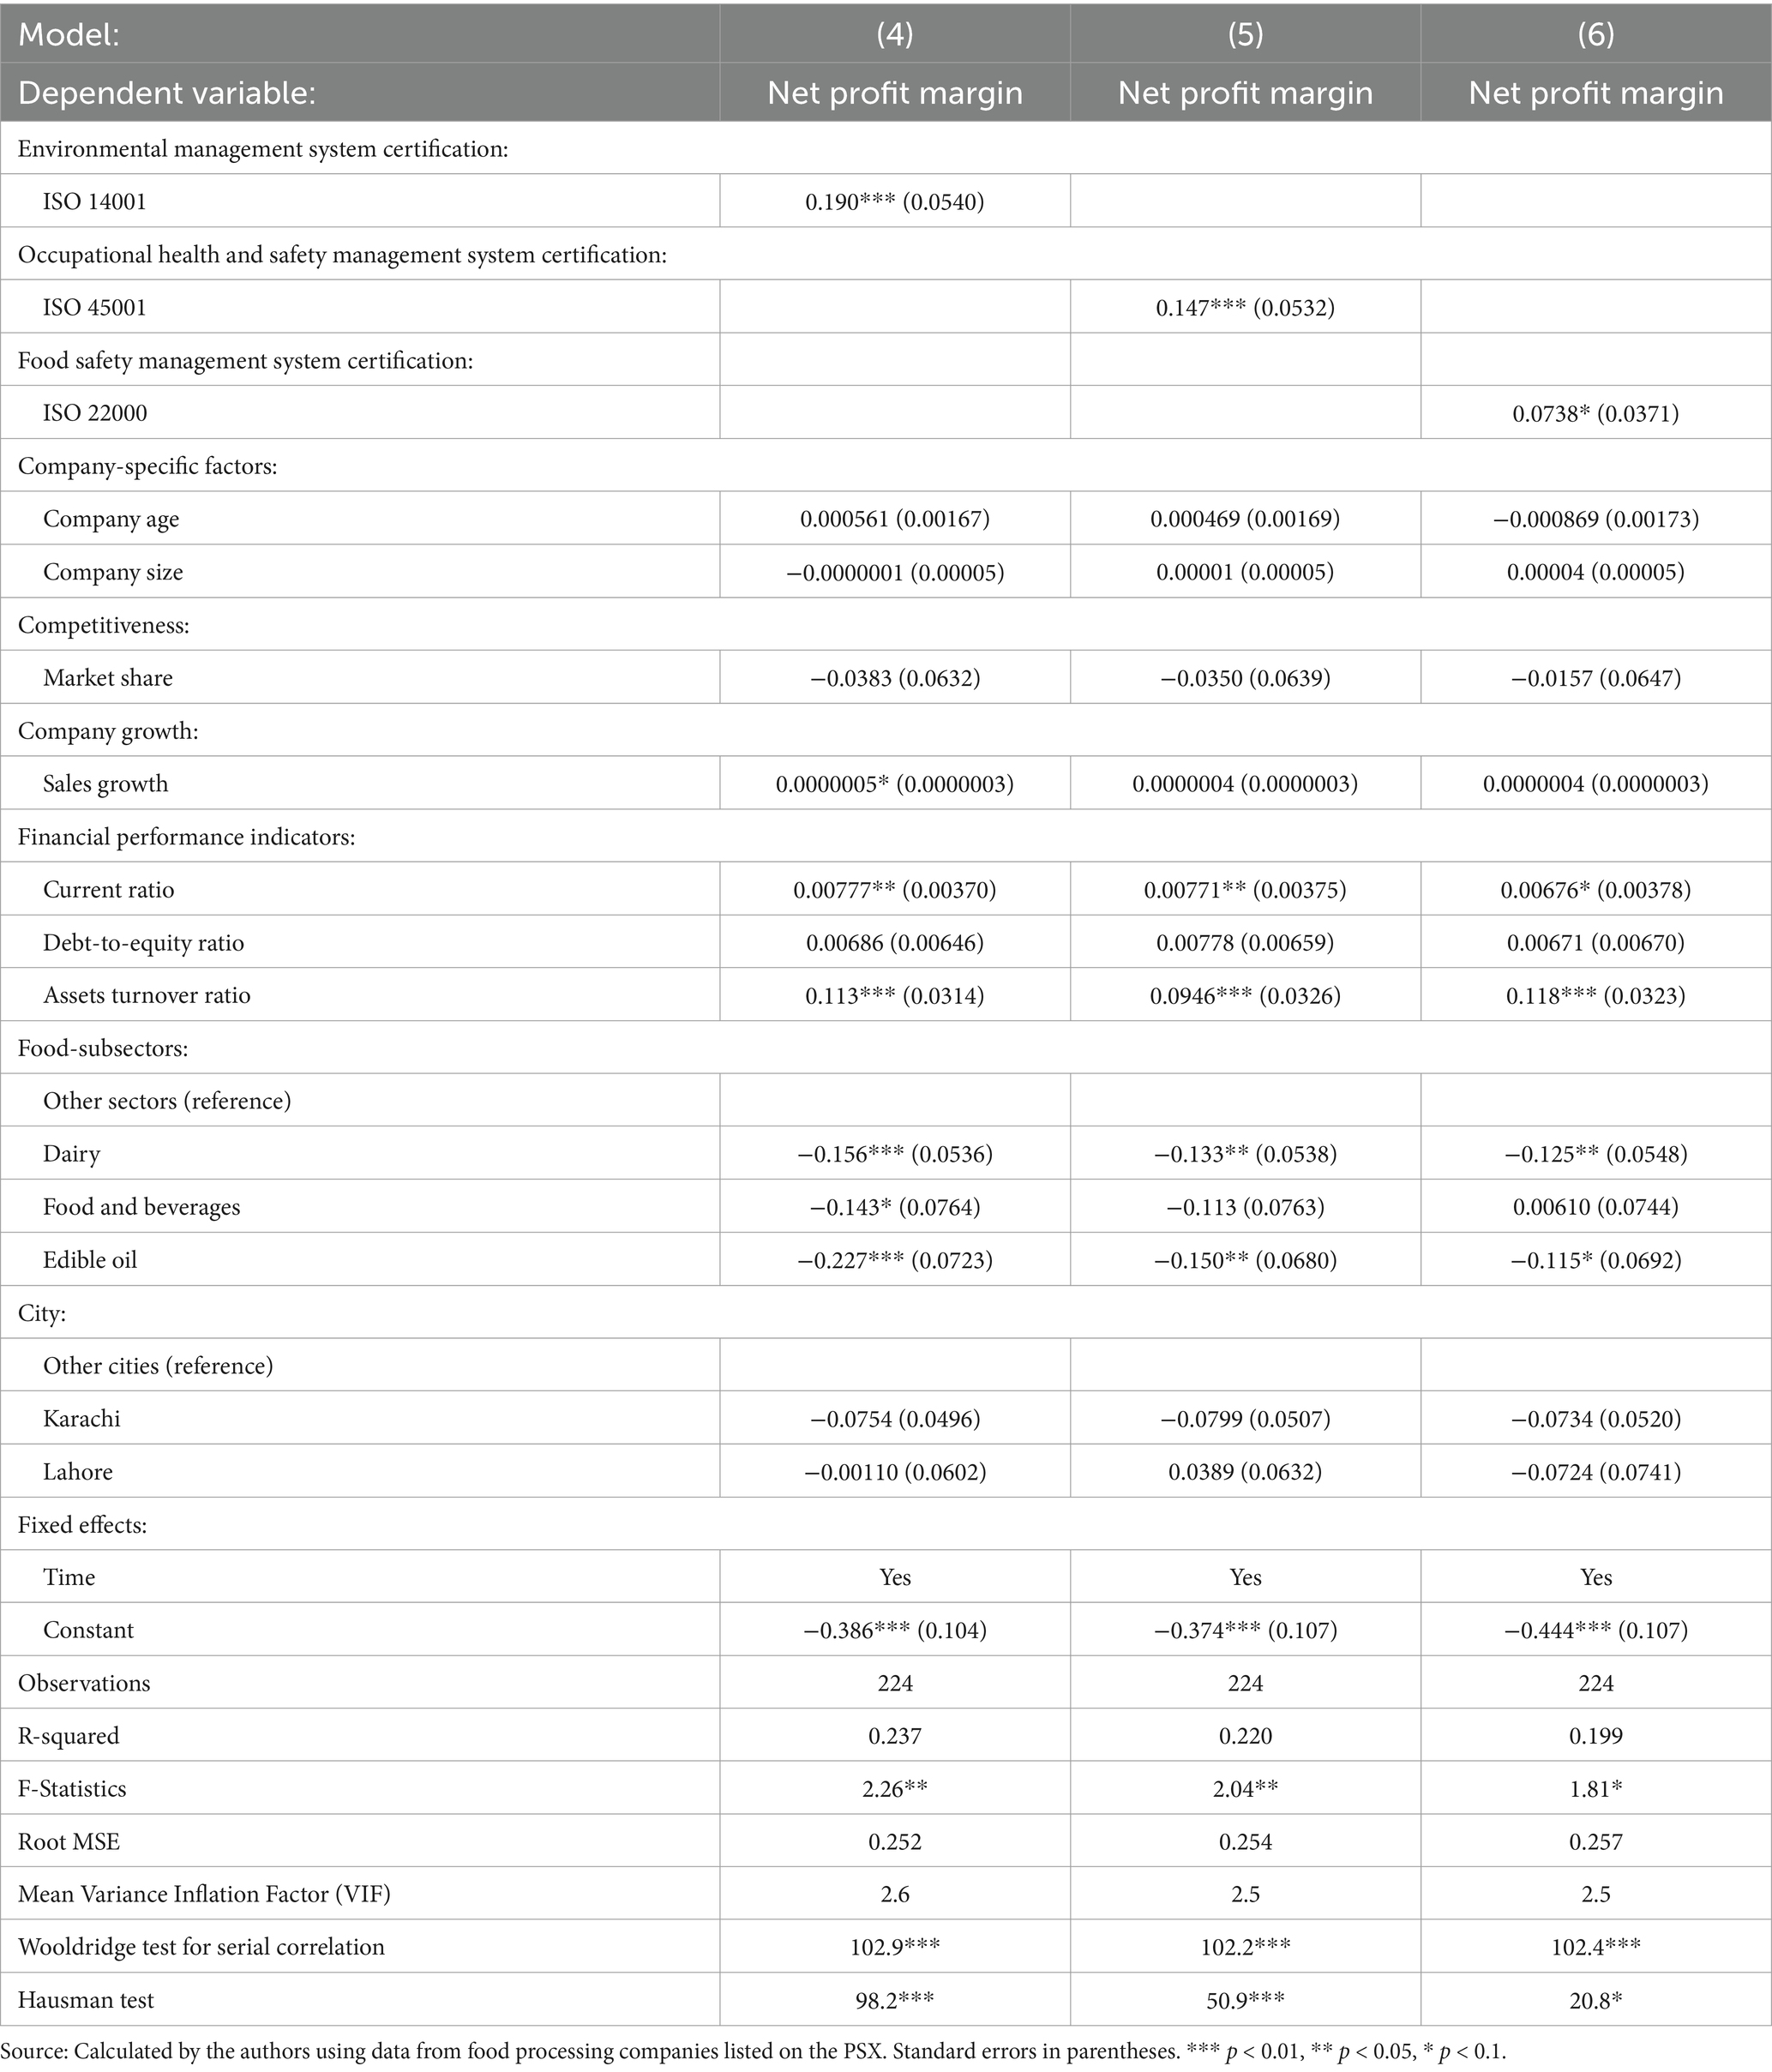
Table 3. Results of fixed effect regression with net profit margin (financial performance).
The results from the environmental performance regressions in models (1), (2), and (3) presented in Table 2 indicate that ISO 14001, ISO 45001, ISO 22000 certifications, company size, market share, and export ratio all have a significant positive impact on the environmental performance of the companies. Conversely, real raw materials cost, real energy cost, and the food and beverages subsector are found to have a significant negative effect on environmental performance.
In model (1), we observe that the estimated coefficient of ISO 14001 is statistically significant at 1 percent level and the sign of the estimated coefficient is positive. This indicates that resource efficiency of ISO 14001 certified food processing companies is, on average, 0.15 points higher than that of non-certified companies. This finding suggests that ISO 14001 certified companies exhibit greater resource efficiency compared to their non-certified counterparts. A possible explanation for this improvement is that the ISO 14001 standards require certified companies to implement various strategies aimed at reducing resource consumption Resultantly, these strategies reduce the companies’ raw material use and energy (electricity, water, gas) consumption and improve their environmental performance. Comparing this result with other studies, Djekic et al. (2014) found that adopting ISO 14001 enhanced the environmental performance of Serbian food processing companies. Moreover, Emamisaleh et al. (2018) observed a statistically-significant positive impact of sustainable supply chain management practices on the environmental performance of food processing companies. Similarly, Atienza-Sahuquillo and Barba-Sánchez (2014) found that the implementation of an effective environmental management system reduces a food processing company’s environmental impact. Furthermore, Diab et al. (2015) observed a significant positive impact of green supply chain management practices on the food processing companies’ environmental performance.
Model (2) shows that the estimated coefficient of ISO 45001 is statistically significant at 1 percent level and the sign of the estimated coefficient is positive. This specifies that ISO 45001 certified food processing companies have an average resource efficiency of 0.13 points greater than non-certified companies. This result reveals that ISO 45001 certified companies have superior resource efficiency than non-certified companies. The adoption of ISO 45001 encourages employees to participate in the development, implementation, and improvement of an effective occupational health and safety management system. Employees that are properly engaged in the development, implementation, and improvement of an efficient occupational health and safety management system are better equipped to give innovative ideas for enhancing company procedures, discovering inefficiencies in manufacturing processes, and eliminating waste. Employees’ active participation can develop a culture of continual improvement inside the company, resulting in more efficient resource utilization.
According to model (3), the estimated coefficient of ISO 22000 is statistically significant at 10 percent level and the sign of the estimated coefficient is positive. This shows that resource efficiency of ISO 22000 certified food processing companies is, on average, 0.08 points greater than that of non-certified companies. This finding indicates that resource efficiency is higher in ISO 22000 certified companies than in non-certified ones. The adoption of ISO 22000 encourages companies to establish and maintain effective control measures and operational procedures to ensure food safety. These measures can also contribute to restructuring production processes, reducing inefficiencies, and minimizing resource consumption. Resultantly, a well implemented operational procedures and best practices can lead to more efficient use of raw materials, energy, water, and other resources. The findings of Liu et al. (2021) supported this result; however, instead of ISO 22000, they used Hazard Analysis Critical Control Point (HACCP) management system. Their results indicated that HACCP certification reduced production costs of food processing companies.
In all the three models, the estimated coefficients of company size are statistically significant at 5 and 10 percent levels and the signs of the estimated coefficients are positive. This indicates that if the size of the companies increases by one employee the resource efficiency of the companies increases by 0.00005 to 0.00007 points. A possible explanation for this positive relationship is that big companies have more resources and budget to invest in more environmentally friendly technologies and health and food safety management practices which further improve their environmental performance by minimizing their resources consumption. Delmas and Pekovic (2015); Gumbau-Albert and Maudos (2002); O'Brien and Torugsa (2011), and Segarra-Blasco and Jove-Llopis (2019) found a significant positive impact of company size on the companies’ resource efficiency strategies.
In all the three models, the estimated coefficients of real raw material cost are statistically significant at 5 and 10 percent levels and the signs of the estimated coefficients are negative. This shows that a one-point increase in raw materials cost decrease the resource efficiency of the companies by 0.02 to 0.03 points. This result is plausible because when the companies consume more raw-materials then it increases raw materials cost of the companies and ultimately decreases their raw materials efficiency. In other words, the companies produce less output consuming costly raw materials which badly affect the resource efficiency plans of the companies and reduce their environmental performance. Hayat et al. (2020) found a similar result but instead of ISO 14001, ISO 45001, and ISO 22000 they used eco-labels. Similarly, in all the three models, the estimated coefficients of real energy cost are statistically significant at 1 percent levels and the signs of the estimated coefficients are negative. This specify that a one-point increase in energy cost decrease the resource efficiency of the companies by 0.05 points. This result is plausible because when the companies consume more energy than it increases energy cost of the companies and ultimately decrease their energy efficiency. In other words, the companies produce less output consuming costly energy which badly affect the resource efficiency plans of the companies and further reduce their environmental performance.
In all the three models, the estimated coefficients of market share are statistically significant at 1 percent levels and the signs of the estimated coefficients are positive. This indicates that a one-point increase in market share increase the resource efficiency of the companies by 0.08 to 0.1 points. This result shows that the more competitive the companies the higher their resource efficiency. Participating in resource efficiency competitions allows companies to set their products apart from those of competitors who rely on resource-intensive production methods. By adopting a strategy of resource-efficient product differentiation, companies can attract new customers and create barriers to entry for new firms. These barriers can be technological, environmental, economic, safety-related, or cultural. This approach not only increases the costs for rivals but also enhances the companies’ overall environmental performance. Segarra-Blasco and Jove-Llopis (2019) also found a significant positive effect of the companies’ competitive advantage on their energy efficiency.
Moreover, in all the three models, the estimated coefficients of export ratio are statistically significant at 5 percent levels and the signs of the estimated coefficients are positive. This specifies that a one-point increase in export ratio increase the resource efficiency of the companies by 0.05 points. The pressure from the companies’ foreign customers and foreign environmental, health safety, and food safety regulations and standards may force the exporting companies to improve their environmental performance by minimizing its resources consumption. Furthermore, the exporting food processing companies of Pakistan face strict competition with foreign companies. This strict competition forced the Pakistani food processing companies to improve their resource efficiency. Delmas and Pekovic (2015) also observed a significant positive impact of exports on the companies’ resource efficiency strategies.
Finally, the estimated coefficient of food and beverages is statistically significant at 10 percent level and the sign of the estimated coefficient is negative. This shows that resource efficiency of the food processing companies operating in food and beverages subsector is on average 0.44 points lower as compared to the companies operating in other food processing subsectors. Food and beverage products require proper packaging to ensure freshness, safety, and shelf life of the products. A huge consumption of packaging materials and waste management practices can significantly impact resource efficiency of the companies. Food processing companies in the food and beverages subsector may face challenges related to packaging optimization, waste reduction, and recycling, which can negatively affect resource efficiency compared to the food processing companies in other subsectors with less packaging-intensive products.
The financial performance regression results from models (4), (5), and (6) in Table 3 demonstrate that ISO 14001, ISO 45001, ISO 22000, sales growth, current ratio, and asset turnover ratio have a significant positive influence on a firm’s financial performance. In contrast, firms in the dairy, food and beverages, and edible oil sectors experience a notable negative impact on their financial performance.
In model (4), we observe that the estimated coefficient of ISO 14001 is statistically significant at 1 percent level and the sign of the estimated coefficient is positive. This indicates that the financial performance of the ISO 14001 certified companies is on average 0.2 points higher as compared to the non-certified companies. The ISO 14001 certification enable the companies to capture huge amount of environmentally conscious consumers and earned a price premium which ultimately improves their financial position. Besides, ISO 14001 certification also helps the companies in better utilization of resources and reduction in production costs which further improve their financial performance. Comparing this result with other studies, Segarra-Oña et al. (2011) found a significant positive impact of ISO 14001 on several financial performance indicators like net sales, profit margin, and profit per employee. Similarly, Emamisaleh et al. (2018) indicated that sustainable supply chain management practices positively impact the financial performance of food processing companies. Similarly, Diab et al. (2015) found a significant positive impact of green supply chain management practices on the food processing companies financial performance. Furthermore, Menike (2020) found that environmental accounting disclosure had a significant positive impact on return on assets of listed Sri Lankan food processing companies. However, the findings of Kakouris and Sfakianaki (2018) regarding the financial benefits of ISO 9001 certification are not convincing. They found that the financial benefits from the adoption of ISO 9001 are intangible for food and beverages companies.
In model (5), we find that the estimated coefficient of ISO 45001 is statistically significant at 1 percent level and the sign of the estimated coefficient is positive. This specifies that financial performance of the ISO 45001 certified companies is on average 0.15 points higher as compared to the non-certified companies. The adoption of ISO 45001 certification differentiates companies from their competitors by demonstrating their commitment to occupational health and safety excellence. In today modern era, customers, investors, and other stakeholders increasingly prioritize workers safety and sustainability when making decisions regarding a company. In such circumstances, ISO 45001 certified companies can use their certification as a competitive advantage, attracting new customers, investors, and other stakeholders, and can earn premium prices for their products, ultimately leading to improved financial performance.
In model (6), we observe that the estimated coefficient of ISO 22000 is statistically significant at 10 percent level and the sign of the estimated coefficient is positive. This shows that the financial performance of the ISO 22000 certified companies is on average 0.07 points higher as compared to the non-certified companies. ISO 22000 certification is increasingly recognized worldwide, and valued by customers, suppliers, and regulatory agencies as a mark of excellence in food safety and quality management. Thus, the ISO 22000 certified companies can gain a competitive advantage in the domestic and international markets by differentiating products from non-certified competitors. This product differentiation based on ISO 22000 certification can further attracts new customers, and can securing contracts with retailers, distributors, and food service providers. This can further increase demand for ISO 22000 certified products, contributing to higher sales and improve financial performance. This result is consistent with the findings of Liu et al. (2021); However, instead of ISO 2200, they used Hazard Analysis Critical Control Point (HACCP) management system. Their results indicated that HACCP certification has both short and long-term impacts on food processing companies’ profitability.
In addition, in all the three models, the estimated coefficients of current ratio are statistically significant at 5 and 10 percent levels and the signs of the estimated coefficients are positive. This indicates that a one-point increase in current ratio increase the financial performance of the companies by 0.007 points. Normally a high liquidity is a sign of financial strength. The effective liquidity management helps companies to reach higher profitability by reducing their input needs. Furthermore, holding cash also provides some advantages at the company level first; It covers daily expenses such as salaries, materials, and taxes. Additionally, because future cash flows can be unpredictable, holding cash provides a safety buffer against potential downturns. Lastly, having cash on hand enables the company to seize highly profitable investment opportunities that require immediate payment. Therefore, companies with high liquidity are less likely to face financial constraints and have more resources at hand to undertake profit enhancing activities. This result contradicts the findings of Menike (2020), he found that liquidity had insignificant impact on return on assets of listed food processing companies in Sri Lanka.
In all the three models, the estimated coefficients of assets turnover ratio are statistically significant at 1 percent levels and the signs of the estimated coefficients are positive. This specifies that a one-point increase in assets turnover ratio increase the financial performance of the companies by 0.1 points. An increase in the asset turnover ratio for a food processing company indicates that the company is generating more revenue relative to its assets. This reflects effective use of assets to drive sales, which can contribute to improved profitability and financial performance. Similar findings were reported by Iwata and Okada (2011) and Wagner et al. (2002), who, instead of using the asset turnover ratio, examined its inverse, known as the capital intensity ratio.
Finally, in all the three models, the estimated coefficients of dairy and edible oil are statistically significant at 1, 5, and 10 percent levels and the signs of the estimated coefficients are negative. Similarly, in model (4), the estimated coefficient of food and beverages is statistically significant at 10 percent level and the sign of the estimated coefficient is negative. This shows that the financial performance of the food processing companies operating in dairy, food and beverages, and edible oil subsector is on average 0.1 and 0.2 points lower as compared to the companies operating in other food processing subsectors. Food processing companies in the dairy, food and beverages, and edible oil subsectors face challenges related to input costs, including raw materials, ingredients, packaging, and transportation. These companies heavily rely on agricultural commodities and perishable products, which can be subject to price fluctuations and supply chain disruptions. The proper management of input costs and supply chain challenges are often more complex and costly for companies in these subsectors. Thus, the companies operate in these subsectors often shows lower financial performance compared to companies in other food subsectors.
4 Conclusion and recommendations
This study examines the impact of Environmental, Occupational Health and Safety, and Food Safety Management Systems Certifications (ISO 14001, ISO 45001, ISO 22000) on the food processing companies environmental and financial performance. To achieve this, fixed effect regressions are performed using data from 19 food processing companies listed on the PSX. The regression results reveal that ISO 14001, ISO 45001, and ISO 22000 certifications significantly enhance both environmental and financial performance. This suggests that these certifications contribute to the sustainable performance of food processing companies. Additionally, factors such as company size, market share, and export ratio positively affect environmental performance, while real raw materials cost, real energy cost, and involvement in the food and beverages sector negatively impact it. Furthermore, sales growth, current ratio, and asset turnover ratio are positively related to financial performance, whereas firms in the dairy, food and beverages, and edible oil sectors experience a negative impact on financial performance.
The finding that ISO 14001, ISO 45001, and ISO 22000 enhance the environmental performance of food processing companies is highly relevant for their management teams. Many food processing companies are actively looking for environmental measures to reduce raw material usage and energy consumption. Adopting ISO 14001, ISO 45001, and ISO 22000 is a potential approach because these standards compel companies to apply strategies that reduce resource usage. As a result, these measures can lead to lower raw material and energy use, hence enhancing environmental performance. Additionally, these certifications have a significant impact on the financial performance of food processing companies. The increasing customer demand for sustainable, safe, and health-conscious products drives food processing companies to look into various environmental, health, and safety measures. Integrating ISO 14001, ISO 45001, and ISO 22000 enables companies to offer products that satisfy these specifications while maintaining greater price premiums. Furthermore, the combination of ISO 14001, ISO 45001, and ISO 22000 certification can assist food processing companies in better resource utilization and lowering per unit production costs, hence improving their financial performance. Furthermore, SO 14001, ISO 45001, and ISO 22000 promote the long-term performance of food processing firms. This makes it attractive for management teams to obtain these certificates since they guarantee improved long-term performance, which is increasingly important. Governments can also play an important role in encouraging non-certified companies to acquire these standards. To encourage the implementation of ISO 14001, ISO 45001, and ISO 22000, governments should provide incentives such as grants to cover certification expenses. Another useful option would be to provide green tax exemption to companies who acquire certification. These incentives would significantly encourage firms to voluntarily implement these standards, with green tax relief being particularly impactful in motivating the adoption of ISO 14001, ISO 45001, and ISO 22000.
The current analysis of ISO 14001, ISO 45001, and ISO 22000 and their impact on sustainability is limited to public sector food processing companies in the country. Future research could extend this analysis to private sector food processing companies in Pakistan. Additionally, the scope of the analysis has been confined to the food processing sector. It would be valuable to explore similar studies in other key manufacturing sectors in Pakistan, such as textiles, footwear, chemicals, pharmaceuticals, motor vehicles, auto parts, sugar, machinery, oil, power, gas, and electrical equipment. Furthermore, there is a lack of comprehensive data on ISO certification adoption and its effects on company performance. Therefore, the Pakistan Bureau of Statistics (PBS) has a critical role in gathering nationwide data on ISO certifications. This could be achieved by including relevant questions in the next round of the Census of Manufacturing Industries (CMI) to better capture the adoption and impact of ISO certifications.
Data availability statement
The original contributions presented in the study are included in the article/supplementary material, further inquiries can be directed to the corresponding authors.
Author contributions
NH: Conceptualization, Data curation, Methodology, Project administration, Software, Writing – original draft, Writing – review & editing. GM: Conceptualization, Formal analysis, Methodology, Project administration, Supervision, Visualization, Writing – original draft, Writing – review & editing. MN: Data curation, Formal analysis, Methodology, Software, Supervision, Writing – review & editing. BA: Data curation, Formal analysis, Funding acquisition, Investigation, Project administration, Resources, Supervision, Writing – original draft, Writing – review & editing. AT: Conceptualization, Data curation, Formal analysis, Funding acquisition, Methodology, Resources, Validation, Visualization, Writing – review & editing.
Funding
The author(s) declare that financial support was received for the research and/or publication of this article. This research was funded by Researchers Supporting Project Number (RSP2025R443), King Saud University, Riyadh, Saudi Arabia.
Acknowledgments
Authors are thankful to King Saud University and University of Education, Lahore for supporting this research.
Conflict of interest
The authors declare that the research was conducted in the absence of any commercial or financial relationships that could be construed as a potential conflict of interest.
Correction note
This article has been corrected with minor changes. These changes do not impact the scientific content of the article.
Publisher’s note
All claims expressed in this article are solely those of the authors and do not necessarily represent those of their affiliated organizations, or those of the publisher, the editors and the reviewers. Any product that may be evaluated in this article, or claim that may be made by its manufacturer, is not guaranteed or endorsed by the publisher.
Footnotes
1. ^In developing country like Pakistan, the data of private food processing companies is not available. However, the data of listed food processing companies is easily available in State Bank of Pakistan reports and annual reports of the listed companies. Thus, due to data availability of the listed food processing companies, in this study we used data from food processing companies listed at PSX.
References
Agus, P., Ratna Setyowati, P., Arman, H. A., Masduki, A., Innocentius, B., Priyono Budi, S., et al. (2020). The effect of implementation integrated management system ISO 9001, ISO 14001, ISO 22000 and ISO 45001 on Indonesian food industries performance. Test Eng. Manag. 82, 14054–14069.
Alanya, S., Ozturk, F., Morova, U., Yetis, F., Dilek, G., and Demirer, N. (2005). Environmental performance evaluation of textile wet processing sector in Turkey. Ankara, Turkey: Environmental Engineering. Middle East Technical University.
Amiri, M. M., Noubbigh, H., Naoui, K., and Choura, N. (2015). Environmental management system: environmental impacts and productivity. Int. J. Bus. Manag. 10:107. doi: 10.5539/ijbm.v10n11p107
Atienza-Sahuquillo, C., and Barba-Sánchez, V. (2014). Design of a measurement model for environmental performance: application to the food sector. Environ. Eng. Manag. J. 13, 1463–1472. doi: 10.30638/eemj.2014.162
Azomahoua, T., Nguyen, V., Phu,, and Wagner, M. (2001). Economic performance of firms: an empirical analysis of the European Paper Industry. Theme seminar and econometrics seminar at BETA. Seeon (Bavaria).
Batchimeg, B. (2017). Financial performance determinants of organizations: the case of Mongolian companies. J. Compet. 9, 22–33. doi: 10.7441/joc.2017.03.02
Boiral, O., and Henri, J.-F. (2012). Modelling the impact of ISO 14001 on environmental performance: A comparative approach. J. Environ. Manag. 99, 84–97. doi: 10.1016/j.jenvman.2012.01.007
Carrillo-Labella, R., Fort, F., and Parras-Rosa, M. (2020). Motives, barriers, and expected benefits of ISO 14001 in the agri-food sector. Sustain. For. 12:1724. doi: 10.3390/su12051724
Chettiyappan, V., Kumar, S., Priambodo, A., and Vigneswaran, S. (1999). Energy and environmental indicators in the Thai textile industry. School of Environment, resources and development. Pathumthani 12120, Thailand: Asian Institute of Technology. Klong Luang.
Darnall, N., Henriques, I., and Sadorsky, P. (2008). Do environmental management systems improve business performance in an international setting? J. Int. Manag. 14, 364–376. doi: 10.1016/j.intman.2007.09.006
De Medeiros, J. F., Ribeiro, J. L. D., and Cortimiglia, M. N. (2014). Success factors for environmentally sustainable product innovation: a systematic literature review. J. Clean. Prod. 65, 76–86. doi: 10.1016/j.jclepro.2013.08.035
Delmas, M. A., and Pekovic, S. (2015). Resource efficiency strategies and market conditions. Long Range Plan. 48, 80–94. doi: 10.1016/j.lrp.2013.08.014
Diab, S. M., Al-Bourini, F. A., and Abu-Rumman, A. H. (2015). The impact of green supply chain management practices on organizational performance: a study of Jordanian food industries. J. Manag. Sustain. 5:149. doi: 10.5539/jms.v5n1p149
Djekic, I., Rajkovic, A., Tomic, N., Smigic, N., and Radovanovic, R. (2014). Environmental management effects in certified Serbian food companies. J. Clean. Prod. 76, 196–199. doi: 10.1016/j.jclepro.2014.04.062
Djupdal, K. (2011). “Eco-labelling and firm financial performance.” in Paper Presented at the 8th ESU Conference on Entrepreneurship. pp 1–26.
Emamisaleh, K., Rahmani, K., and Iranzadeh, S. (2018). Sustainable supply chain management practices and sustainability performance in the food industry. South East Asian J. Manag. 12, 1–19.
Fei-Baffoe, B., Botwe-Koomson, G. K., Mensa-Bonsu, I. F., and Appiah Agyapong, E. (2013). Impact of ISO 14001 environmental management system on key environmental performance indicators of selected gold mining companies in Ghana. J. Waste Manag. 2013:935843. doi: 10.1155/2013/935843
Fernández-Muñiz, B., Montes-Peón, J. M., and Vázquez-Ordás, C. J. (2009). Relation between occupational safety management and firm performance. Saf. Sci. 47, 980–991. doi: 10.1016/j.ssci.2008.10.022
Fraj‐Andrés, E., Martínez‐Salinas, E., and Matute‐Vallejo, J. (2009). Factors affecting corporate environmental strategy in Spanish industrial firms. Business strategy and the Environment 18, 500–514. doi: 10.1002/bse.611
Goedhuys, M., and Mohnen, P. J. J. (2017). Management standard certification and firm productivity: micro-evidence from. Africa 19, 61–83. doi: 10.5325/jafrideve.19.1.0061
Gonçalves, J., Rodrigues, B., Teixeira, M., Domingues, P., and Cabecinhas, M. (2020). ISO 22000 standard implementation: benefits, motivations and obstacles.
Grolleau, G., Mzoughi, N., and Thomas, A. (2007). What drives agrifood firms to register for an environmental management system? Eur. Rev. Agric. Econ. 34, 233–255. doi: 10.1093/erae/jbm012
Gumbau-Albert, M., and Maudos, J. (2002). The determinants of efficiency: the case of the Spanish industry. Appl. Econ. 34, 1941–1948. doi: 10.1080/00036840210127213
Hayat, N., Hussain, A., and Lohano, H. D. (2020). Eco-labeling and sustainability: A case of textile industry in Pakistan. J. Clean. Prod. 252:119807. doi: 10.1016/j.jclepro.2019.119807
Horbach, J. (2008). Determinants of environmental innovation—new evidence from German panel data sources. Res. Policy 37, 163–173. doi: 10.1016/j.respol.2007.08.006
Iraldo, F., Testa, F., and Frey, M. (2009). Is an environmental management system able to influence environmental and competitive performance? The case of the eco-management and audit scheme (EMAS) in the European Union. J. Clean. Prod. 17, 1444–1452. doi: 10.1016/j.jclepro.2009.05.013
Iwata, H., and Okada, K. (2011). How does environmental performance affect financial performance? Evidence from Japanese manufacturing firms. Ecol. Econ. 70, 1691–1700. doi: 10.1016/j.ecolecon.2011.05.010
Jannah, M., Fahlevi, M., Paulina, J., Nugroho, B. S., Purwanto, A., Subarkah, M. A., et al. (2020). Effect of ISO 9001, ISO 45001 and ISO 14000 toward financial performance of Indonesian manufacturing. Syst. Rev. Pharm. 11, 894–902. doi: 10.31838/srp.2020.10.134
Kakouris, A. P., and Sfakianaki, E. (2018). Impacts of ISO 9000 on Greek SMEs business performance. Int. J. Qual. Reliab. Manag. 35, 2248–2271. doi: 10.1108/IJQRM-10-2017-0204
Karaman, A. D., Cobanoglu, F., Tunalioglu, R., and Ova, G. (2012). Barriers and benefits of the implementation of food safety management systems among the Turkish dairy industry: A case study. Food Control 25, 732–739. doi: 10.1016/j.foodcont.2011.11.041
Khan, N. U., Hassan, F., Deeba, F., Yamin, H., and Afzaal, S. (2020). Critical analyses of laws relating to the management of food safety in Pakistan and way forward. J. Hyg. Eng. Design 32, 33–40.
Khan, H., Khan, F., Saif-ur-Rehman, T. M., and Jadoon, I. (2018). Role of environmental management systems certification. Corporate Governance and Ownership Structure in Firm’s Efficiency: A Comparison of ISO, 14001, 2.
King, A., Lenox, M., and Terlaak, A. (2005). The strategic use of decentralized institutions: exploring certification with the ISO 14001 management standard. Acad. Manag. J. 48, 1091–1106. doi: 10.5465/amj.2005.19573111
Liu, F., Rhim, H., Park, K., Xu, J., and Lo, C. K. (2021). HACCP certification in food industry: trade-offs in product safety and firm performance. Int. J. Prod. Econ. 231:107838. doi: 10.1016/j.ijpe.2020.107838
Liu, J., Yuan, C., Hafeez, M., and Li, X. (2020). ISO 14001 certification in developing countries: motivations from trade and environment. J. Environ. Plan. Manag. 63, 1241–1265. doi: 10.1080/09640568.2019.1649642
Melnyk, S. A., Sroufe, R. P., and Calantone, R. (2003). Assessing the impact of environmental management systems on corporate and environmental performance. J. Oper. Manag. 21, 329–351. doi: 10.1016/S0272-6963(02)00109-2
Menike, L. (2020). Impact of environmental disclosure on firm performance: an empirical analysis of food, beverage and tobacco sector companies listed in Colombo Stock Exchange, Sri Lanka. Int. J. Acad. Res. Bus. Soc. Sci. 10, 518–536. doi: 10.6007/IJARBSS/v10-i10/7977
Mensah, L. D., and Julien, D. (2011). Implementation of food safety management systems in the UK. Food Control 22, 1216–1225. doi: 10.1016/j.foodcont.2011.01.021
Miroshnychenko, I., Barontini, R., and Testa, F. (2017). Green practices and financial performance: A global outlook. J. Clean. Prod. 147, 340–351. doi: 10.1016/j.jclepro.2017.01.058
Nawrocka, D., Brorson, T., and Lindhqvist, T. (2009). ISO 14001 in environmental supply chain practices. J. Clean. Prod. 17, 1435–1443. doi: 10.1016/j.jclepro.2009.05.004
Neeveditah, P.-M., Karishma, A., and Devi, R. N. (2017). Environmental management systems and financial performance: the case of listed companies in Mauritius. Theoret. Econ. Lett. 7, 2054–2069. doi: 10.4236/tel.2017.77139
Nishitani, K. (2011). An empirical analysis of the effects on firms’ economic performance of implementing environmental management systems. Environ. Resour. Econ. 48, 569–586. doi: 10.1007/s10640-010-9404-3
Nordlöf, H., Wiitavaara, B., Högberg, H., and Westerling, R. (2017). A cross-sectional study of factors influencing occupational health and safety management practices in companies. Saf. Sci. 95, 92–103. doi: 10.1016/j.ssci.2017.02.008
O'Brien, K., and Torugsa, A. (2011). Supply-side determinants of energy consumption and efficiency (ECE) innovations.
O'Keeffe, M., Mavondo, F., and Schroder, B. (1998). The Resource-Advantage Theory of Competition: Implications For Australian Agribusiness.
Potoski, M., and Prakash, A. (2005). Covenants with weak swords: ISO 14001 and facilities' environmental performance. J. Policy Anal. Manag. 24, 745–769. doi: 10.1002/pam.20136
Prajogo, D., Tang, A., and Lai, K.-H. (2014). The diffusion of environmental management system and its effect on environmental management practices. Int. J. Oper. Prod. Manag. 34, 565–585. doi: 10.1108/IJOPM-10-2012-0448
Raihan, S., Tulon, K. M. N. I., and Angkur, M. T. N. (2017). Factors affecting total factor productivity: firm-level evidence from manufacturing sector of Bangladesh. Int. J. SME Dev. 3, 1–18.
Rehfeld, K.-M., Rennings, K., and Ziegler, A. (2007). Integrated product policy and environmental product innovations: an empirical analysis. Ecol. Econ. 61, 91–100. doi: 10.1016/j.ecolecon.2006.02.003
Sarumpaet, S. (2006). The relationship between environmental performance and financial performance of Indonesian companies. Jurnal Akuntansi dan Keuangan 7, 89–98. doi: 10.9744/jak.7.2.pp.%2089-98
Segarra-Blasco, A., and Jove-Llopis, E. (2019). Determinants of energy efficiency and renewable energy in european smes. Econ. Energy Environ. Policy 8:117–140. doi: 10.5547/2160-5890.8.2.aseg
Segarra-Oña, M., Peiró-Signes, A., Miret-Pastor, L., and Albors-Garrigós, J. (2011). Uncovering non-obvious relationship between environmental certification and economic performance at the food industry. Information Technologies in Environmental Engineering: New Trends and Challenges. pp. 325–338.
Sirieix, L., Delanchy, M., Remaud, H., Zepeda, L., and Gurviez, P. (2013). Consumers' perceptions of individual and combined sustainable food labels: a UK pilot investigation. Int. J. Consum. Stud. 37, 143–151. doi: 10.1111/j.1470-6431.2012.01109.x
State Bank of Pakistan. (2010). Financial statements analysis (FSA) of companies (non-financial) listed in Pakistan stock exchange. Pakistan. Available online at: https://www.sbp.org.pk/reports/annual/FSANFC/Years.htm (Accessed March 3, 2024).
State Bank of Pakistan. (2013). Financial statements analysis (FSA) of companies (non-financial) listed in Pakistan stock exchange. Pakistan. Available online at: https://www.sbp.org.pk/reports/annual/FSANFC/Years.htm (Accessed March 3, 2024).
State Bank of Pakistan. (2015). Financial statements analysis (FSA) of companies (non-financial) listed in Pakistan stock exchange. Pakistan. Available online at: https://www.sbp.org.pk/reports/annual/FSANFC/Years.htm (Accessed March 3, 2024).
State Bank of Pakistan. (2017). Financial statements analysis (FSA) of companies (non-financial) listed in Pakistan stock exchange. Pakistan. Available online at: https://www.sbp.org.pk/reports/annual/FSANFC/Years.htm (Accessed March 3, 2024).
State Bank of Pakistan. (2018). Financial statements analysis (FSA) of companies (non-financial) listed in Pakistan stock exchange. Pakistan. Available online at: https://www.sbp.org.pk/reports/annual/FSANFC/Years.htm (Accessed March 3, 2024).
State Bank of Pakistan. (2022). Financial statements analysis (FSA) of companies (non-financial) listed in Pakistan stock exchange. Pakistan. Available online at: https://www.sbp.org.pk/reports/annual/FSANFC/Years.htm (Accessed March 3, 2024).
Triguero, A., Moreno-Mondéjar, L., and Davia, M. A. (2013). Drivers of different types of eco-innovation in European SMEs. Ecol. Econ. 92, 25–33. doi: 10.1016/j.ecolecon.2013.04.009
Tsireme, A., Nikolaou, E., Georgantzis, N., and Tsagarakis, K. P. (2012). The influence of environmental policy on the decisions of managers to adopt G-SCM practices. Clean Techn. Environ. Policy 14, 953–964. doi: 10.1007/s10098-012-0461-x
Tyteca, D. (1996). On the measurement of the environmental performance of firms—a literature review and a productive efficiency perspective. J. Environ. Manag. 46, 281–308. doi: 10.1006/jema.1996.0022
Tyteca, D., Carlens, J., Berkhout, F., Hertin, J., Wehrmeyer, W., and Wagner, M. (2002). Corporate environmental performance evaluation: evidence from the MEPI project. Bus. Strateg. Environ. 11, 1–13. doi: 10.1002/bse.312
Vieira, E. S., Neves, M. E., and Dias, A. G. (2019). Determinants of Portuguese firms’ financial performance: panel data evidence. Int. J. Product. Perform. Manag. 68, 1323–1342. doi: 10.1108/IJPPM-06-2018-0210
Vinodkumar, M., and Bhasi, M. (2010). Safety management practices and safety behaviour: assessing the mediating role of safety knowledge and motivation. Accid. Anal. Prev. 42, 2082–2093. doi: 10.1016/j.aap.2010.06.021
Wagner, M., Van Phu, N., Azomahou, T., and Wehrmeyer, W. (2002). The relationship between the environmental and economic performance of firms: an empirical analysis of the European paper industry. Corp. Soc. Responsib. Environ. Manag. 9, 133–146. doi: 10.1002/csr.22
Wallace, C. A., Sperber, W. H., and Mortimore, S. E. (2018). Food safety for the 21st century: Managing HACCP and food safety throughout the global supply chain. Hoboken, New Jersey, U.S.A: John Wiley & Sons.
World Bank. (2024). World Development Indicators. Available online at: http://databank.worldbank.org/data/home.aspx (Accessed March 3, 2024).
Yusop, N. Y., Alhyari, J. A., and Bekhet, H. A. (2021). Dynamic elasticities between financial performance and determinants of mining and extractive companies in Jordan. J. Asian Finan. Econ. Bus. 8, 433–446. doi: 10.13106/jafeb.2021.vol8.no7.0433
Zwetsloot, G., Leka, S., Kines, P., and Jain, A. (2020). Vision zero: developing proactive leading indicators for safety, health and wellbeing at work. Saf. Sci. 130:104890. doi: 10.1016/j.ssci.2020.104890
Appendix

Table A. List of environmental performance indicators.
Keywords: management systems certifications, ISO 14001, ISO 45001, ISO 22000, sustainable performance, food processing companies, fixed effect regressions
Citation: Hayat N, Mustafa G, Naeem M, Alotaibi BA and Traore A (2025) Assessing the impact of environmental, occupational health and safety, and food safety management systems on the sustainable performance of food processing companies. Front. Sustain. Food Syst. 9:1491456. doi: 10.3389/fsufs.2025.1491456
Edited by:
Raul Avila-Sosa, Benemérita Universidad Autónoma de Puebla, MexicoReviewed by:
Rogelio Sánchez Vega, Autonomous University of Chihuahua, MexicoSomnath Hazra, CLA Global, India
Copyright © 2025 Hayat, Mustafa, Naeem, Alotaibi and Traore. This is an open-access article distributed under the terms of the Creative Commons Attribution License (CC BY). The use, distribution or reproduction in other forums is permitted, provided the original author(s) and the copyright owner(s) are credited and that the original publication in this journal is cited, in accordance with accepted academic practice. No use, distribution or reproduction is permitted which does not comply with these terms.
*Correspondence: Ghulam Mustafa, Z2h1bGFtLm11c3RhZmFAdWUuZWR1LnBr; Bader Alhafi Alotaibi, YmFsaGFmaUBrc3UuZWR1LnNh