 Shanshan Wang1,2
 Mingjie Shi1,2
 Yanmin Fan1,2*Pingan Jiang1,2*Shuhuang Chen3Yunhao Li1,2
 Lijie Huang1,2Jiahao Zhao1,2
- 1Xinjiang Engineering Technology Research Center of Soil Big Data, Xinjiang Agricultural University, Urumqi, China
- 2Xinjiang Key Laboratory of Soil and Plant Ecological Processes, Xinjiang Agricultural University, Urumqi, China
- 3Xinjiang Academy of Agricultural Sciences, Institute of Soil Fertiliser and Agricultural Water Conservation, Urumqi, China
Both climate change and human activities play critical roles in shaping the spatial distribution of cotton cultivation, particularly in arid and semi-arid environments. However, existing studies have not sufficiently quantified their synergistic effects, and regional-scale applications remain limited. This study selected key variables from 31 environmental factors—including climate, soil, topography, and human footprint—and employed an optimized MaxEnt model to project cotton distribution across three Shared Socioeconomic Pathways (SSP126, SSP245, and SSP585). We developed models based on (i) current climate conditions, (ii) an integrated model incorporating both current climate conditions and human footprint, and (iii) future climate projections for the 2030s, 2050s, and 2070s. The results indicate that human footprint, mean diurnal temperature range (bio2), mean temperature of the coldest quarter (bio11), precipitation of the coldest quarter (bio19), and solar radiation intensity are the primary factors influencing cotton distribution. Under prevailing climate conditions, suitable cotton habitats are mainly located in Aksu, Kashgar, Tacheng, Bayingolin Mongol Autonomous Prefecture, and Changji, where human activities have significantly expanded the cultivation range. Future climate projections indicate a decrease in the extent of suitable cotton habitats, with its distribution center shifting toward lower-altitude areas. This study offers key empirical evidence and conceptual understanding to address climate-induced risks to cotton farming, forming a basis for informed strategies in sustainable cultivation and habitat conservation.
1 Introduction
Climate change and human activities are the principal forces driving the evolution of global agricultural ecosystems, profoundly shaping agricultural production patterns through their impacts on crop phenology, yield stability, and the boundaries of cultivation zones (Yue et al., 2019; Onuegbu et al., 2024; Zafar et al., 2024). Climate factors such as solar radiation, temperature, and precipitation have a significant impact on crop growth (Sun et al., 2017; Jiang et al., 2021). Solar radiation is fundamental to photosynthesis, while moderate diurnal temperature fluctuations enhance cotton growth. As a tropical crop, cotton is highly sensitive to low temperatures, with frost potentially causing damage that disrupts the interaction between cotton roots, soil, and microbial communities, thus inhibiting seed germination (Li et al., 2023b; Li et al., 2024). Particularly in arid and semi-arid regions, the synergistic effects of climate change and human activities have significantly increased the vulnerability of agricultural ecosystems, leading to more complex environmental changes (Zain-ul-Hudda et al., 2024; Nazarova et al., 2025). Studies from South Asia and Africa show that the increased frequency of droughts and the reduction of water resources caused by climate change have directly impacted the distribution of cotton cultivation areas (Gérardeaux et al., 2018; Ullah et al., 2022). Furthermore, human activities such as land-use changes and infrastructure development further influence the spatial distribution of cotton cultivation (Chen et al., 2022). Soil properties, such as organic carbon content and soil texture, provide the necessary environmental conditions for cotton growth, while natural factors like topography play a crucial role in regulating water and nutrient supply (Malode et al., 2021; Wu et al., 2024). Therefore, the distribution of cotton is influenced not only by climate change but also by the combined effects of human activities, soil properties, and topographical features.
Xinjiang is one of the largest cotton-producing regions in China (Kuang et al., 2024; Zahra et al., 2025). However, as climate change intensifies, challenges such as water scarcity, temperature fluctuations, and precipitation uncertainty are significantly altering the cotton-growing environment, profoundly impacting the boundaries of suitable cultivation areas (Li et al., 2023a). Similar trends have been observed in major cotton-growing regions, including the United States, India, and Australia (Hebbar et al., 2013; Williams et al., 2015; Nouri et al., 2021). The effects of climate change on cotton production manifest in different patterns across these regions, with some variations influenced by local water management strategies. Nevertheless, many of these regional studies often overlook the combined impact of human activities and climate change.
Globally, considerable research has been conducted on crop distribution modeling (Benito Garzón et al., 2019). Existing studies have demonstrated that ecological niche models (ENMs) and species distribution models (SDMs) are effective tools for assessing the potential impacts of climate change on agricultural ecosystems (Roy et al., 2022). The MaxEnt (Maximum Entropy) approach has gained recognition for its superior predictive accuracy, owing to its computational efficiency, resilience to missing data, and capacity to deliver accurate predictions from limited occurrence records (Elith et al., 2011; Merow et al., 2013) Consequently, the MaxEnt model has been extensively utilized in agricultural and ecological studies (Xu et al., 2019; He et al., 2023).
Recent studies on cotton have widely adopted MaxEnt to examine how climate variability influences its geographic distribution (Shi et al., 2021; Li et al., 2023a; Mai and Liu, 2023). These studies investigate how shifts in climate conditions may alter suitable cultivation zones by analyzing differences between current and projected cotton distributions, thereby supporting adaptation strategies in cotton farming. While the influence of climate change on cotton distribution has been widely acknowledged, it is equally important to recognize that cotton growth and distribution are substantially influenced by anthropogenic activities, particularly through water resource management, land-use changes, and genetic advancements (Wu et al., 2022; Lang et al., 2023; Shi et al., 2023). Although previous studies have delineated climate suitability zones for cotton across various provinces and regions, there remains a significant gap in research integrating both climate change and anthropogenic activities in the evaluation of cotton’s climate suitability (Li et al., 2020b). Most existing studies have primarily concentrated on evaluating climatic influences on cotton suitability, largely overlooking the roles of human activities. Nonetheless, the synergistic impacts of climate change and anthropogenic activities on cotton distribution patterns constitute a critical yet underexplored research domain.
To assess the combined influence of climate dynamics and anthropogenic factors (as indicated by the human footprint), this study examines their interactive effects on cotton distribution patterns. Accordingly, key variables influencing cotton growth in Xinjiang—including bioclimatic conditions, soil characteristics, topography, and human activities—were selected and analyzed using the MaxEnt model. The objectives of this study are: (1) to compare cotton habitat distributions in Xinjiang under scenarios with and without human intervention; (2) to evaluate changes in cotton habitat distribution patterns under multiple future climate scenarios; and (3) to examine the spatial dynamics and development trends of cotton cultivation in Xinjiang. The results enhance the understanding of how climate variability and human activities jointly influence cotton distribution in Xinjiang, thereby informing more effective cultivation strategies, rational resource use, and long-term agricultural sustainability in the region.
2 Materials and methods
2.1 Study area
Located in the northwestern part of China, Xinjiang (73°40′–96°18′E, 34°25′–48°10′N) represents the country’s most extensive provincial-level region and experiences a typical temperate continental climate. As China’s primary cotton production base, Xinjiang plays a critical role in national cotton yield and quality, owing to its extensive land resources and favorable thermal and solar conditions (Li et al., 2020b). However, situated within an arid and semi-arid region, Xinjiang experiences scarce natural precipitation, rendering cotton growth highly dependent on artificial irrigation. Therefore, Xinjiang serves as an ideal region for studying the suitability distribution of economic crops in arid and semi-arid environments.
2.2 Data sources
2.2.1 Species occurrence data
This study utilized field survey data collected from agricultural regions of Xinjiang between 2015 and 2020. GPS was used to record the latitude, longitude, and elevation of cotton planting sites, thereby generating occurrence data for cotton distribution across Xinjiang. To reduce redundancy and avoid overfitting, ENMTools.pl. was applied to preprocess the dataset, allowing a single valid record per spatial grid. After this refinement, 1,195 unique cotton presence points remained and were used in the modeling phase (Figure 1).
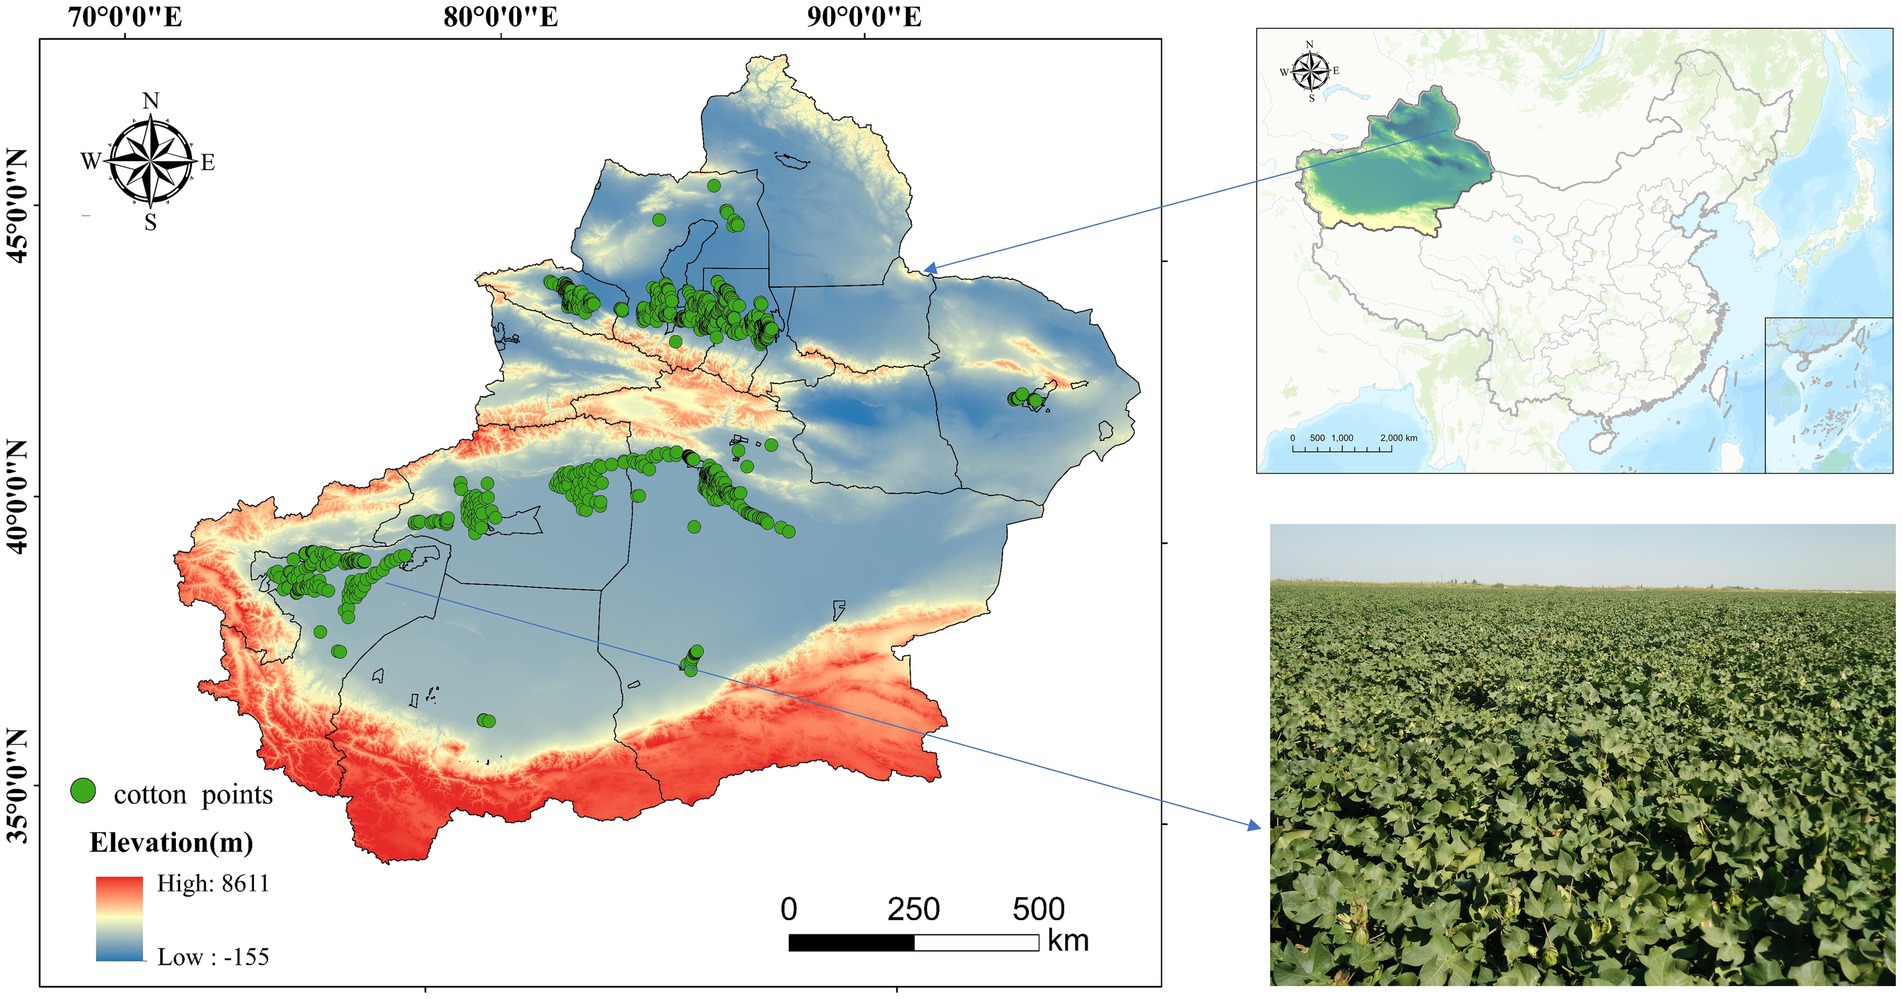
Figure 1. Cotton occurrence data in Xinjiang.
2.2.2 Environmental variables
In order to estimate how cotton may be distributed across Xinjiang in projected climate conditions, this study adopted the BCC-CMS2-MR global climate model (GCM), as recommended in the IPCC’s Sixth Assessment Report. This model, optimized from earlier versions, demonstrates strong predictive capabilities for future climate scenarios. The analysis incorporated three Shared Socioeconomic Pathways (SSPs)—SSP126, SSP245, and SSP585—to develop predictive models of cotton suitability distribution in Xinjiang under future climate scenarios.
Additionally, 31 environmental variables potentially affecting cotton distribution were collected, encompassing soil, topography, solar radiation, bioclimatic characteristics, and human activities to build an integrated analytical framework. Specifically, soil data were sourced from the HWSD database to assess soil characteristics. Topographic data were acquired from the Geographic Space Data Cloud Platform and processed with ArcGIS 10.8 to derive slope and aspect features. Solar radiation data, representing both current and future scenarios, were sourced from WorldClim and the NASA NEX-GDDP-CMIP6 high-resolution datasets (Table 1).
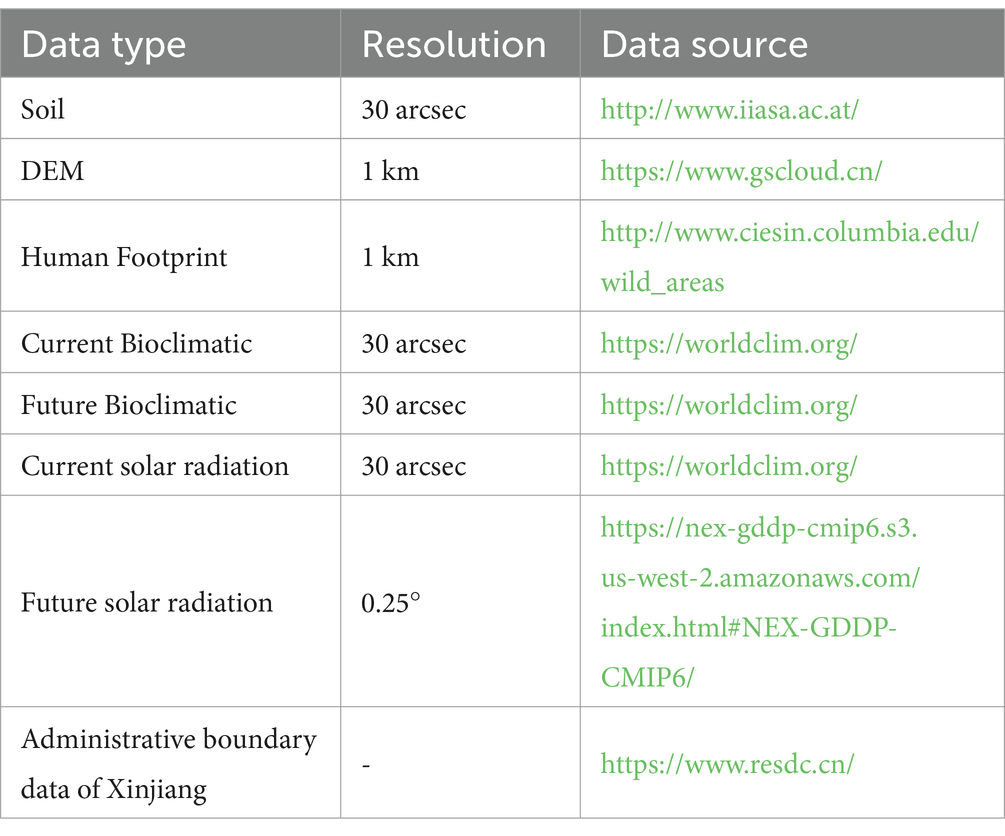
Table 1. Data sources and descriptions.
Research has shown a close relationship between the severity, extent, and spread of the human footprint and the suitability of land for agriculture. Human footprint data were retrieved from the Global Human Impact Dataset (Venter et al., 2016), which integrates information on land use, population density, and infrastructure to quantify the intensity of human activities. These components serve as indirect proxies for agricultural activities, such as infrastructure development and land conversion, especially in arid regions where direct irrigation data is often lacking. Previous studies have demonstrated significant correlations between the human footprint index and changes in hydrological systems, agricultural expansion, and ecological pressure (Jaramillo and Destouni, 2015; Grill et al., 2019; Lines et al., 2021; Grill et al., 2019; Jaramillo and Destouni, 2015). Therefore, in this study, we incorporate the human footprint index as a continuous variable into the MaxEnt model to represent the combined effects of human activity on the suitability distribution of cotton. The relationship between human footprint intensity and agricultural suitability highlights the critical role of human-induced land use and infrastructure development in shaping crop growth potential, particularly in areas with limited natural climate resources.
These data reflect both natural and human-driven factors influencing cotton distribution in Xinjiang. Future scenario predictions for the 2030s, 2050s, and 2070s were generated under the assumption that topography and soil characteristics would remain constant, offering a robust basis for assessing potential suitable regions for cotton cultivation in Xinjiang (Egli et al., 2018). These analyses lay the groundwork for investigating how climate variability and human interventions affect cotton distribution and for optimizing planting strategies. This study integrates multiple climate scenarios for the 2030s, 2050s, and 2070s, resulting in nine distinct future scenarios: SSP126-30s, SSP126-50s, SSP126-70s, SSP245-30s, SSP245-50s, SSP245-70s, SSP585-30s, SSP585-50s, and SSP585-70s. To reduce multicollinearity among variables, a correlation analysis module in ENMTools.pl. was employed to remove those with a correlation coefficient greater than 0.8 (Warren et al., 2021) (Figure 2). Through a stepwise backward selection process, 17 environmental variables were ultimately selected for model analysis (Rodriguez-Caballero et al., 2018) (Table 2).
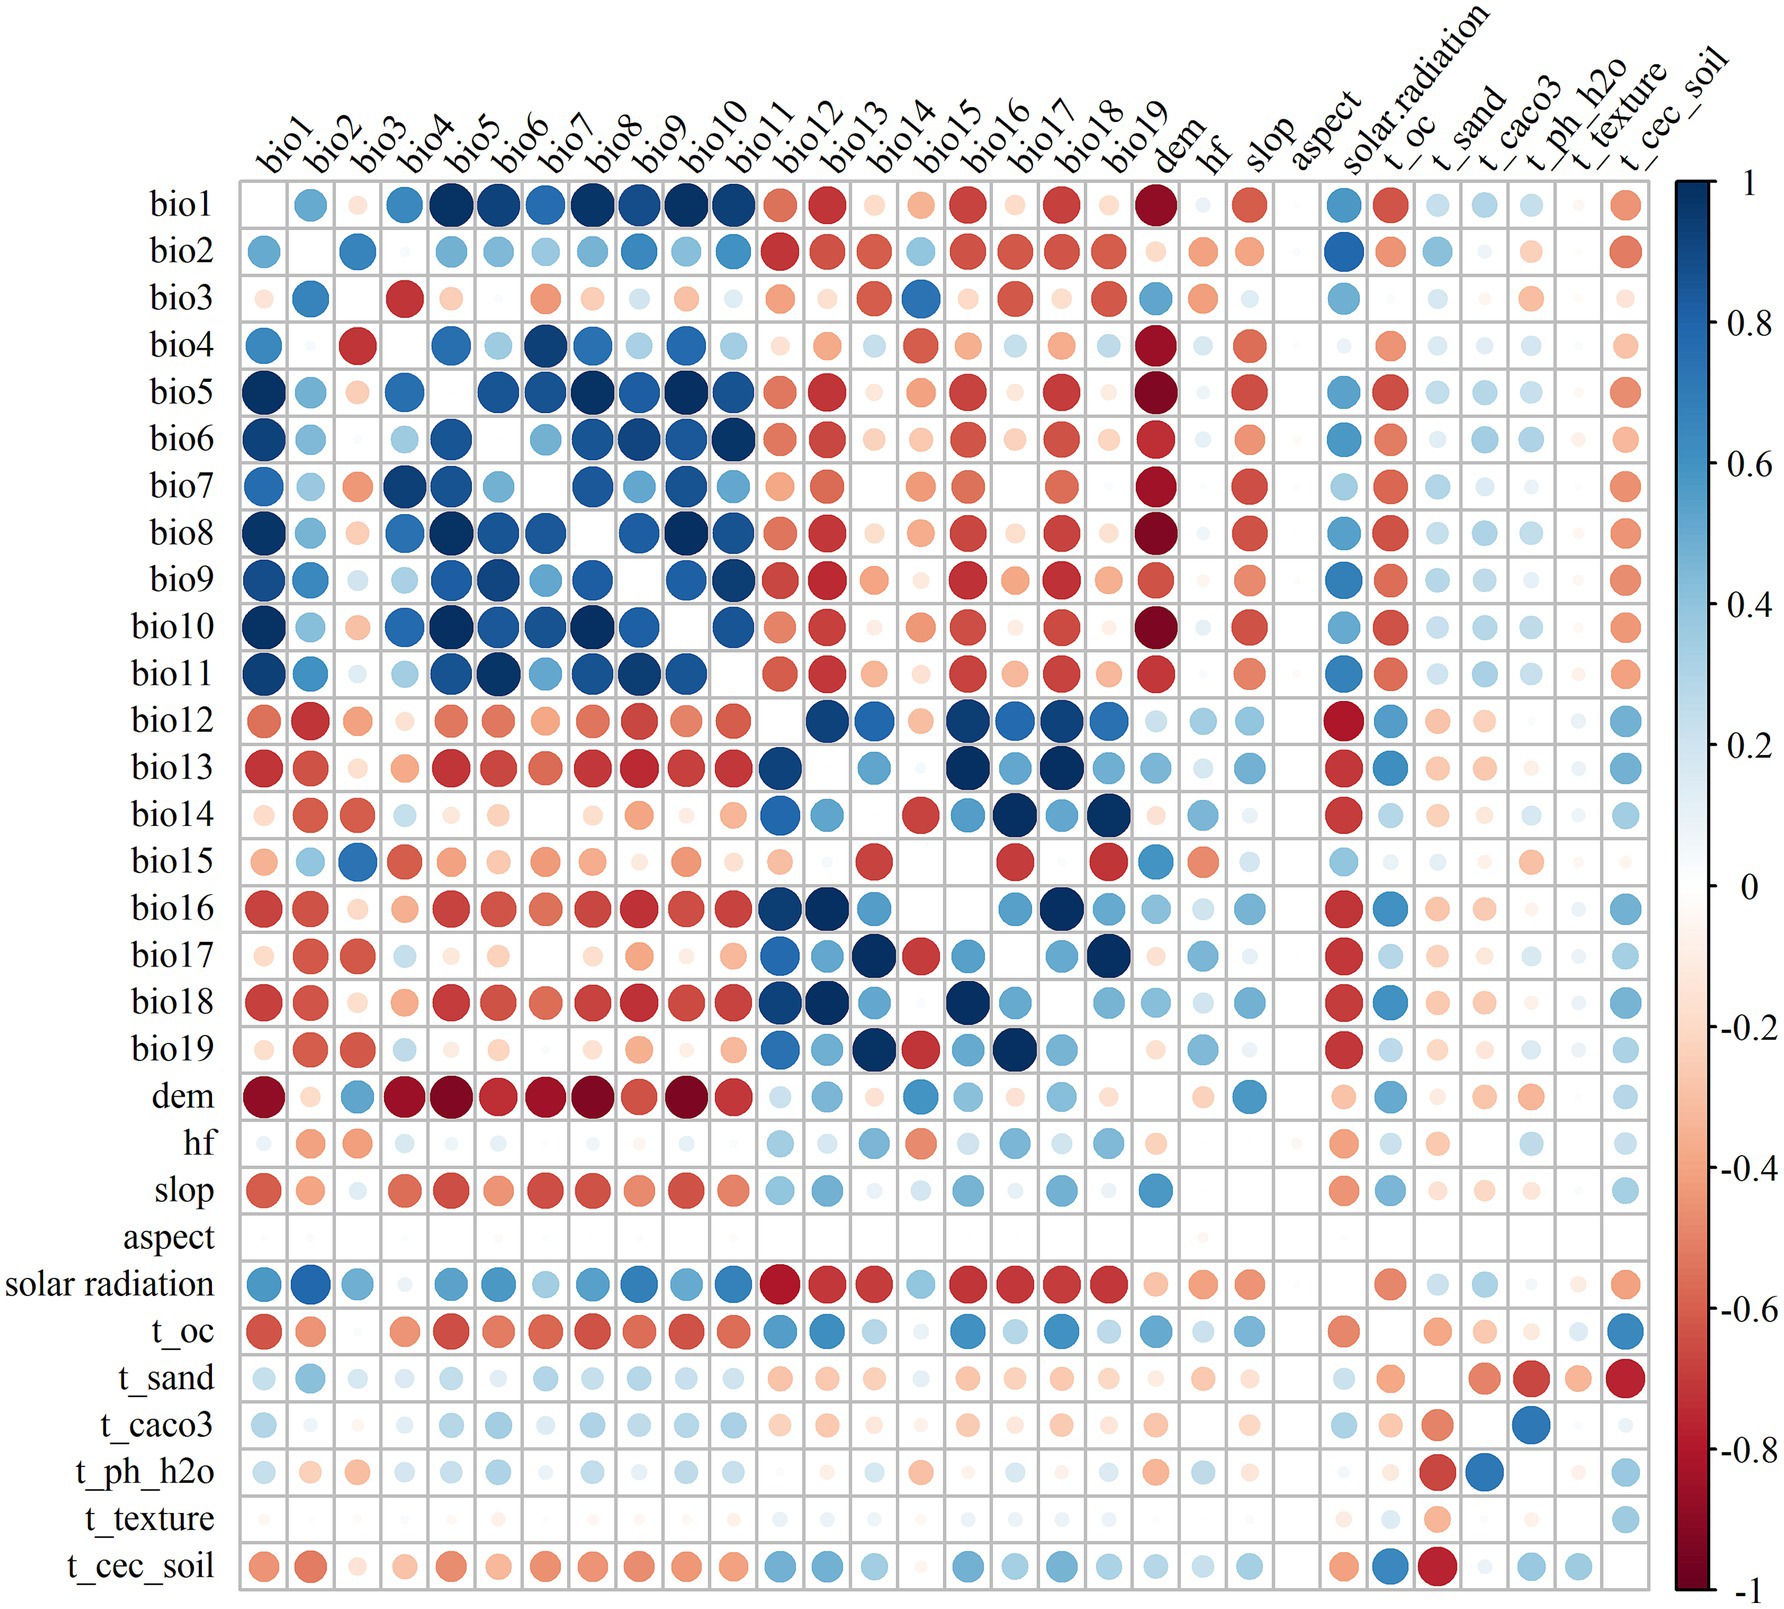
Figure 2. Correlation of 31 environmental variables.
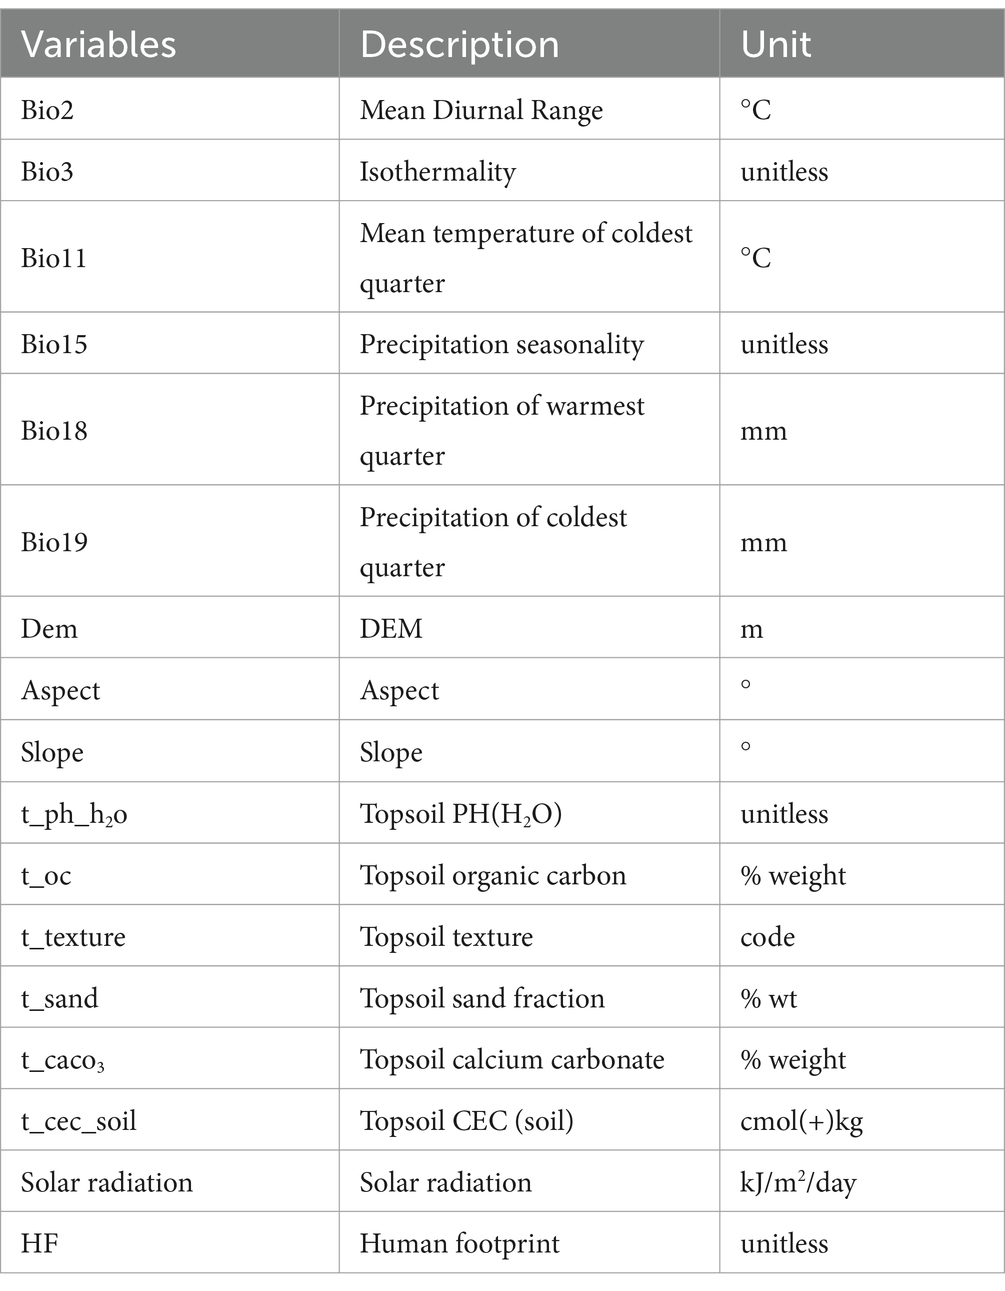
Table 2. Modeling variables.
2.3 Principle of the MaxEnt Model
The MaxEnt model is a machine learning technique grounded in the principle of maximum entropy, widely used for species distribution modeling (SDM) (Elith et al., 2011). The fundamental concept is to identify a probability distribution that maximizes entropy, meaning it is the least biased and most uniform given partial environmental data. According to the principle of maximum entropy, when no additional information is available, the most uniform distribution should be chosen (Guiasu and Shenitzer, 1985; Brummer and Newman, 2019). In the MaxEnt framework, a species’ potential habitat distribution is represented by a probability distribution, where various environmental variables are introduced as feature functions (e.g., linear, quadratic, hinge features) to capture the relationship between environmental conditions and species distribution. The objective of the MaxEnt model is to find the optimal predictive model by maximizing the entropy of this distribution. The model’s optimization goal is expressed as follows:
Where p (x) is the probability of the species occurring at location x. fi(x) is the feature function for the environmental variable at location x, which describes the relationship between environmental factors and species distribution. λi is the weight associated with each feature function, representing the impact of various environmental variables on species distribution.
Through adjusting these weights λi, the MaxEnt model maximizes the entropy of the species distribution to predict the most suitable habitats for the species under different environmental conditions.
2.4 Model analysis
The environmental dataset was processed through bilinear-based interpolation and harmonized to a consistent 250 × 250-meter grid resolution (Xu et al., 2024). To evaluate the combined effects of environmental changes and human activities on the cotton cultivation potential in Xinjiang, three predictive models were developed: Model A: Simulates the potential distribution of cotton under natural conditions using environmental variables representing the current climate, including bioclimatic, soil, topographic, and solar radiation data. Model B: Expands upon Model A by incorporating human footprint data to evaluate the role of human activities in shaping cotton habitat suitability. Model C: Evaluates how climate change may affect cotton distribution by utilizing environmental variables under future climate scenarios, including bioclimatic, soil, topographic, and solar radiation data.
To optimize model parameters and mitigate overfitting, 75% of the data were used for training and 25% for testing. The ENMeval package was employed to optimize the regularization multiplier (RM, ranging from 0.5 to 4 in increments of 0.5) and feature combinations (FC, consisting of six types: L, LQ, H, LQH, LQHP, and LQHPT) in the MaxEnt model. A total of 48 parameter combinations (8 regularization multipliers × 6 feature combinations) were systematically evaluated, and model complexity was assessed (Kass et al., 2021; Huang et al., 2024). The final selection of parameter combinations, based on a balance between model complexity and predictive performance, prioritized lower complexity and stronger ecological interpretability, thus ensuring a balance between predictive accuracy and the risk of overfitting.
The influence of each environmental factor on model predictions was evaluated through the jackknife method, with response curves visualized to demonstrate their impact on cotton suitability. The suitability threshold was determined based on expert knowledge and the Maximum Training Sensitivity plus Specificity (MTSS) criterion within the MaxEnt model. Suitability levels were classified into four categories: unsuitable (<MTSS), low suitability (MTSS–0.3), moderate suitability (0.3–0.4), and high suitability (0.4–0.8) (Shabani et al., 2018; Wang et al., 2019). To ensure comparability across different models and climate scenarios, all predictions were based on the same threshold classification. Comparing Model A and Model B reveals the impact of human activities on cotton suitability, whereas comparing Model A and Model C highlights the potential effects of climate change on cotton distribution and agricultural potential, thus guiding the development of adaptive agricultural management strategies.
2.5 Model evaluation and validation
This study utilized ROC curves and the Area Under the Curve (AUC) metric to evaluate model performance, where AUC values range from 0 to 1. AUC values closer to 1 indicate higher predictive accuracy. According to AUC grading standards, model performance ranges from poor (0 < AUC ≤ 0.6) to excellent (0.9 < AUC ≤ 1) (Zhao et al., 2021). The True Skill Statistic (TSS) was introduced as a supplementary evaluation metric. TSS is calculated by summing sensitivity and specificity and subtracting 1, with values ranging from −1 to 1 (Allouche et al., 2006). Based on evaluation standards, TSS scores are categorized as poor (−1 to −0.4), fair (0.4–0.7), very good (0.7–0.85), and perfect (0.9–1) (Préau et al., 2018). By integrating AUC and TSS, the models’ performance in predicting suitable cotton habitats in Xinjiang was assessed comprehensively. AUC emphasizes overall predictive capacity, whereas TSS refines the accuracy in distinguishing species presence and absence. Together, these two metrics offer a more comprehensive framework for model evaluation (Kabir et al., 2017).
3 Results
3.1 Model parameter optimization results
In this study, simulation prediction results were evaluated using a combination of AUC and TSS metrics. Under the MaxEnt model, the average training AUC was 0.947, the average testing AUC was 0.941, and the average TSS was 0.840, indicating a high level of predictive accuracy and model reliability (Table 3). When the regularization multiplier (RM) was set to 1 and the feature combination (FC) to LQHPT, the MaxEnt model achieved optimal performance. In this configuration, the training AUC reached 0.946, the testing AUC reached 0.943, and the TSS was 0.837 (Table 3). Under environmental conditions (Model A), the variables influencing cotton distribution were: slope (36.2%), DEM (15.5%), bio2 (13.5%), bio11 (7.4%), solar radiation (6.2%), t_CaCO3 (5.1%), and t_sand (4.5%), with a cumulative contribution rate of 88.4%. Under human activity influences (Model B), the variables influencing cotton distribution were: HF (43.7%), slope (27.5%), DEM (9.8%), bio2 (3.7%), and bio19 (3.3%), with a cumulative contribution rate of 88%. As the human footprint increased, environmental variables such as slope, DEM, and bio2, each initially contributing more than 6%, exhibited decreases compared to Model A (with reductions of 8.7, 5.7, 9.8, and 4.7%, respectively). Conversely, in Model B, the contribution rate of bio19 increased by 0.7% (Figure 3).
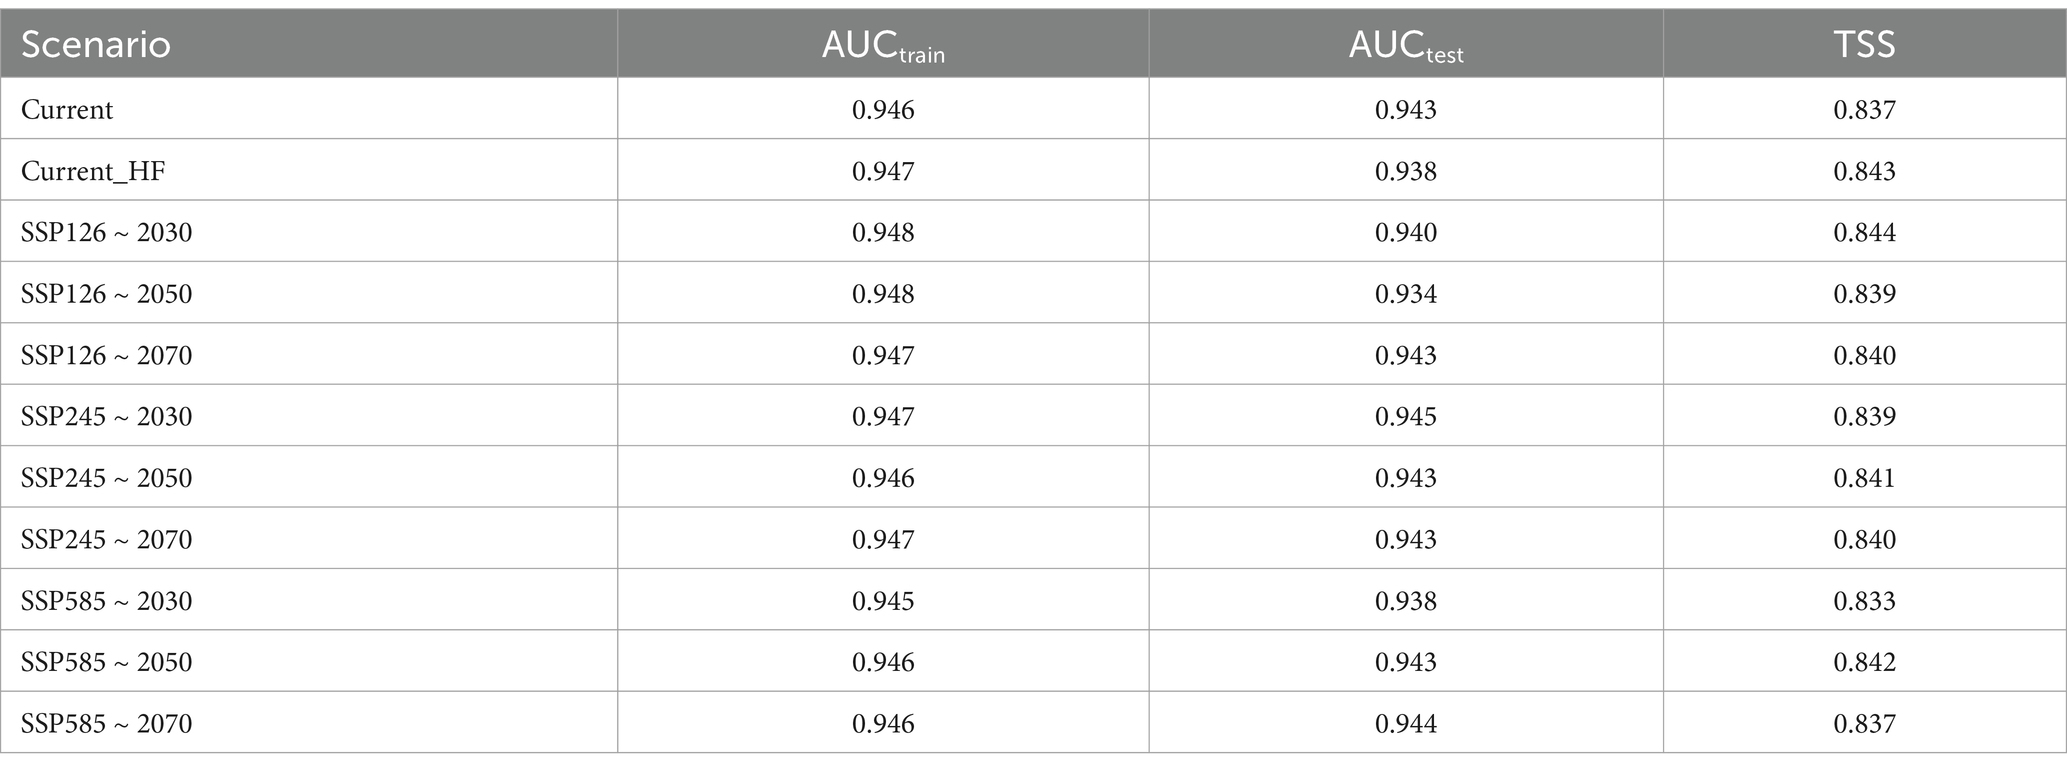
Table 3. Model accuracy evaluation.
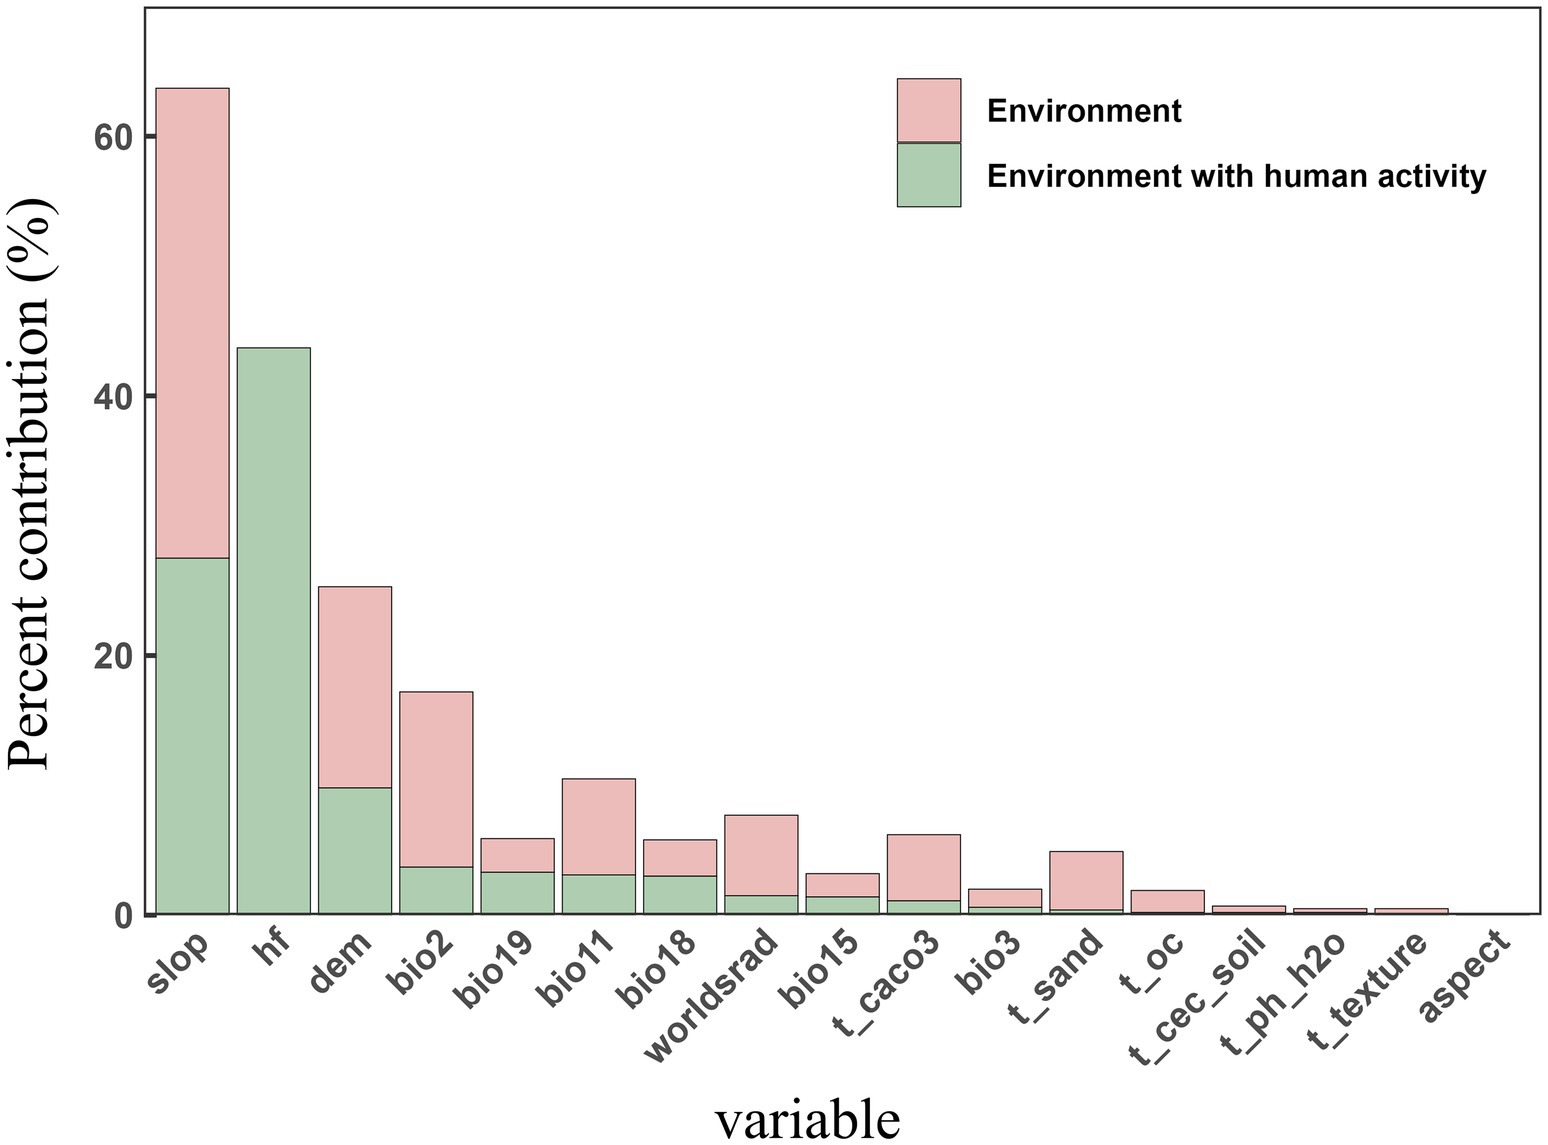
Figure 3. Contribution rates of environmental variables in the MaxEnt Model.
3.2 Distribution of cotton planting areas under current climate and human interference
The MaxEnt model was used to simulate cotton suitability habitats under scenarios both with and without human activity interference, followed by classification analysis and area calculations for each suitability level (Table 4). Under the current climate model, when only environmental variables were considered, the total suitable habitat area for cotton in Xinjiang was 7.97 × 10⁴ km2. Of this, 4.56 × 10⁴ km2 was classified as highly suitable, 1.84 × 10⁴ km2 as moderately suitable, and 1.57 × 10⁴ km2 as poorly suitable. The suitable habitats were primarily distributed in regions such as Aksu, Kashgar, Tacheng, Bayingolin Mongol Autonomous Prefecture, and Changji (Figure 4A). When human activity interference was considered, the total suitable habitat area expanded to 9.50 × 10⁴ km2, representing a 19% increase compared to the scenario based solely on environmental variables. The area corresponding to each suitability category also increased (Figure 4B). Specifically, the highly suitable habitat area expanded by 0.26 × 10⁴ km2, with new regions primarily located in northern Kashgar, northern Bayingolin Mongol Autonomous Prefecture, southern Tacheng, and eastern and western Aksu. The moderately suitable habitat area increased by 0.64 × 10⁴ km2, with new regions mainly in southern Tacheng, eastern and western Aksu, northern Kashgar, and northern Bayingolin Mongol Autonomous Prefecture. The poorly suitable habitat area increased by 0.63 × 10⁴ km2, primarily concentrated in northern Bayingolin Mongol Autonomous Prefecture, with scattered patches in Changji.
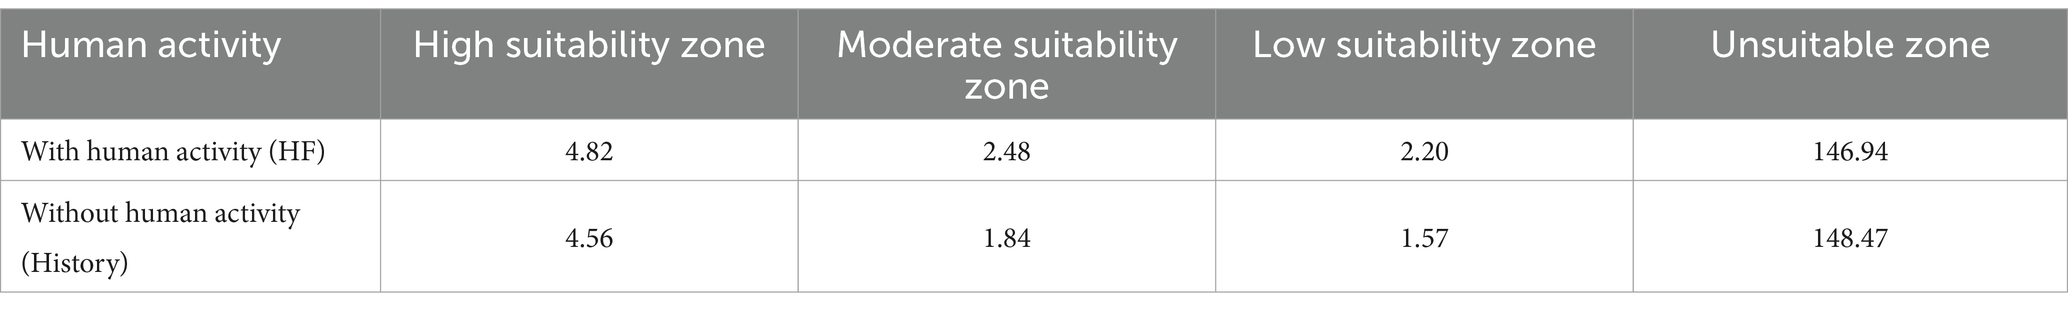
Table 4. The area of suitable habitat of a cotton with and without human activity interference (×104km2).
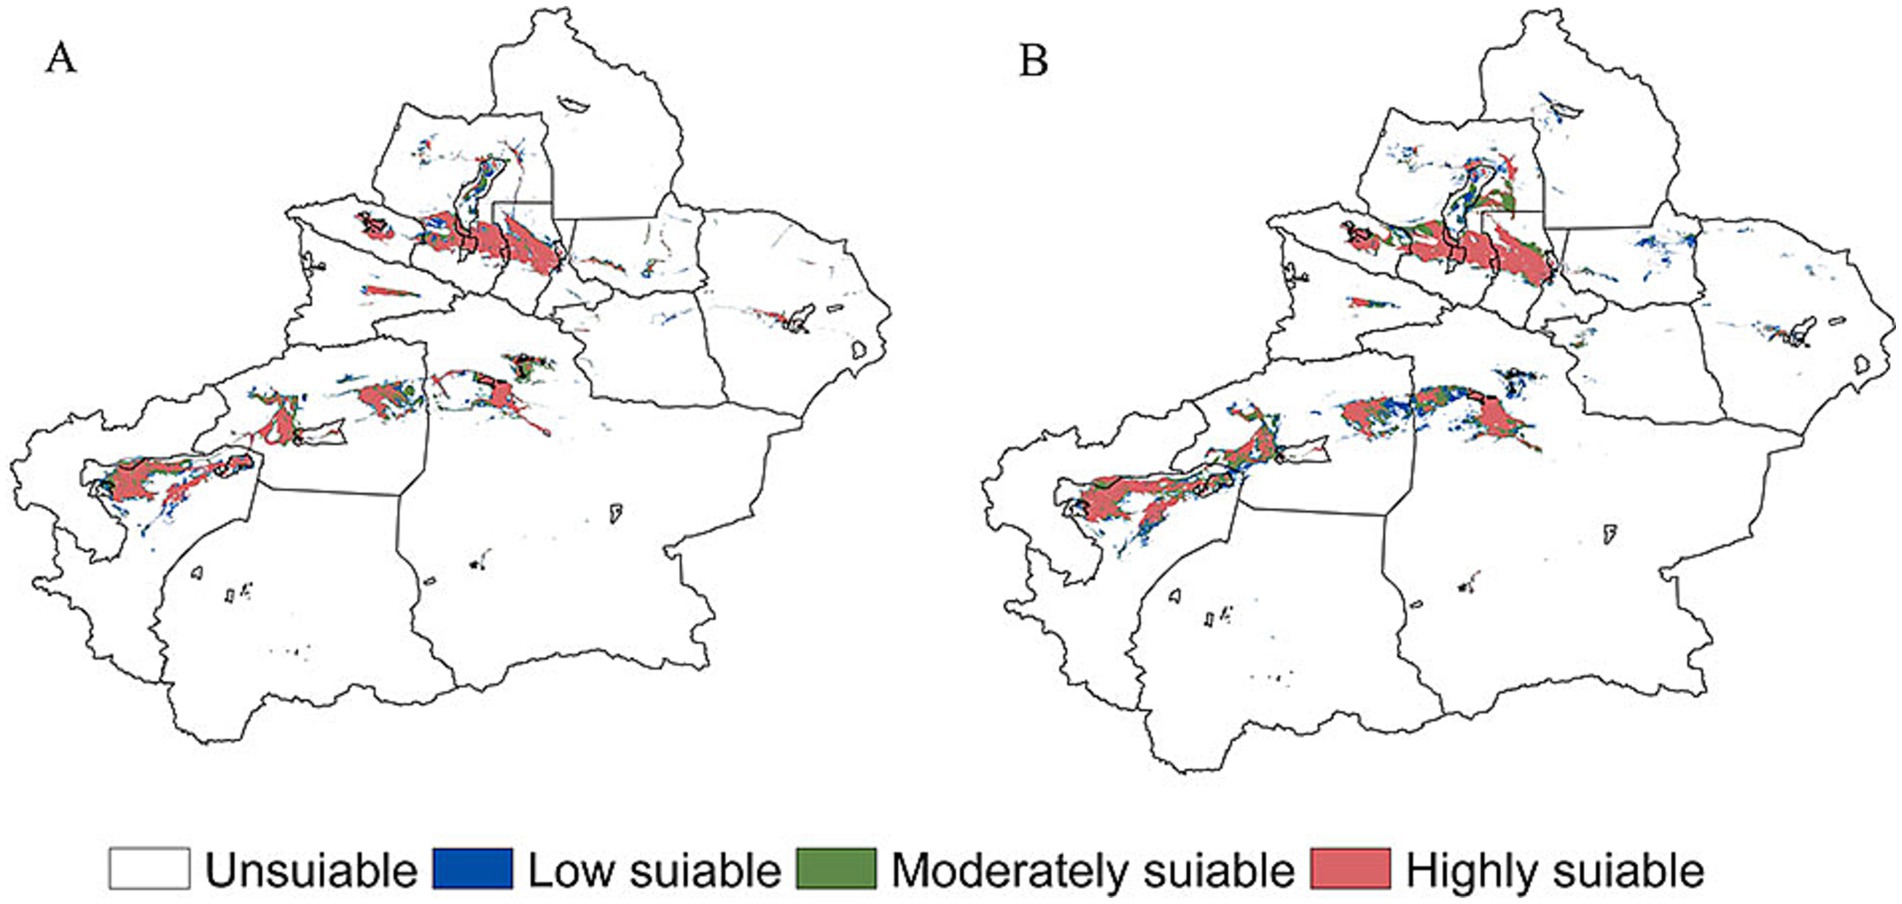
Figure 4. The suitable habitats of cotton under the current climate pattern (A) and under the interference of human activities (B).
3.3 Changes in cotton spatial distribution under different climate change scenarios
Predicted suitable habitat ranges for cotton show significant variation across different future climate scenarios (Figure 5). Under the SSP126 scenario, suitable cotton habitats are predominantly concentrated in the southern part of Tacheng, northern Kashgar, central and western Shihezi, Kuitun, and northern Bayingolin Mongol Autonomous Prefecture. Cotton habitats are projected to contract primarily in Bayingolin Mongol Autonomous Prefecture and Aksu (Figure 6). Under the SSP245 scenario, the contraction trend is most pronounced during the 2030s. Suitable habitats are concentrated in the southern part of Tacheng, central and western Shihezi, Kuitun, and northern Bayingolin Mongol Autonomous Prefecture. By the 2050s, the cotton distribution pattern remains largely stable, with suitable habitats primarily located in the northern part of Kashgar, southern Tacheng, northern Bayingolin Mongol Autonomous Prefecture, western Shihezi, and Kuitun, with minor contraction observed. Under the SSP585 scenario, distribution patterns in the 2050s and 2070s remain similar to current patterns, whereas the 2030s exhibit a notably greater contraction trend. Suitable habitats are projected to be predominantly located in northern Kashgar, central and western Shihezi, northern Bayingolin Mongol Autonomous Prefecture, southern Tacheng, and Kuitun.
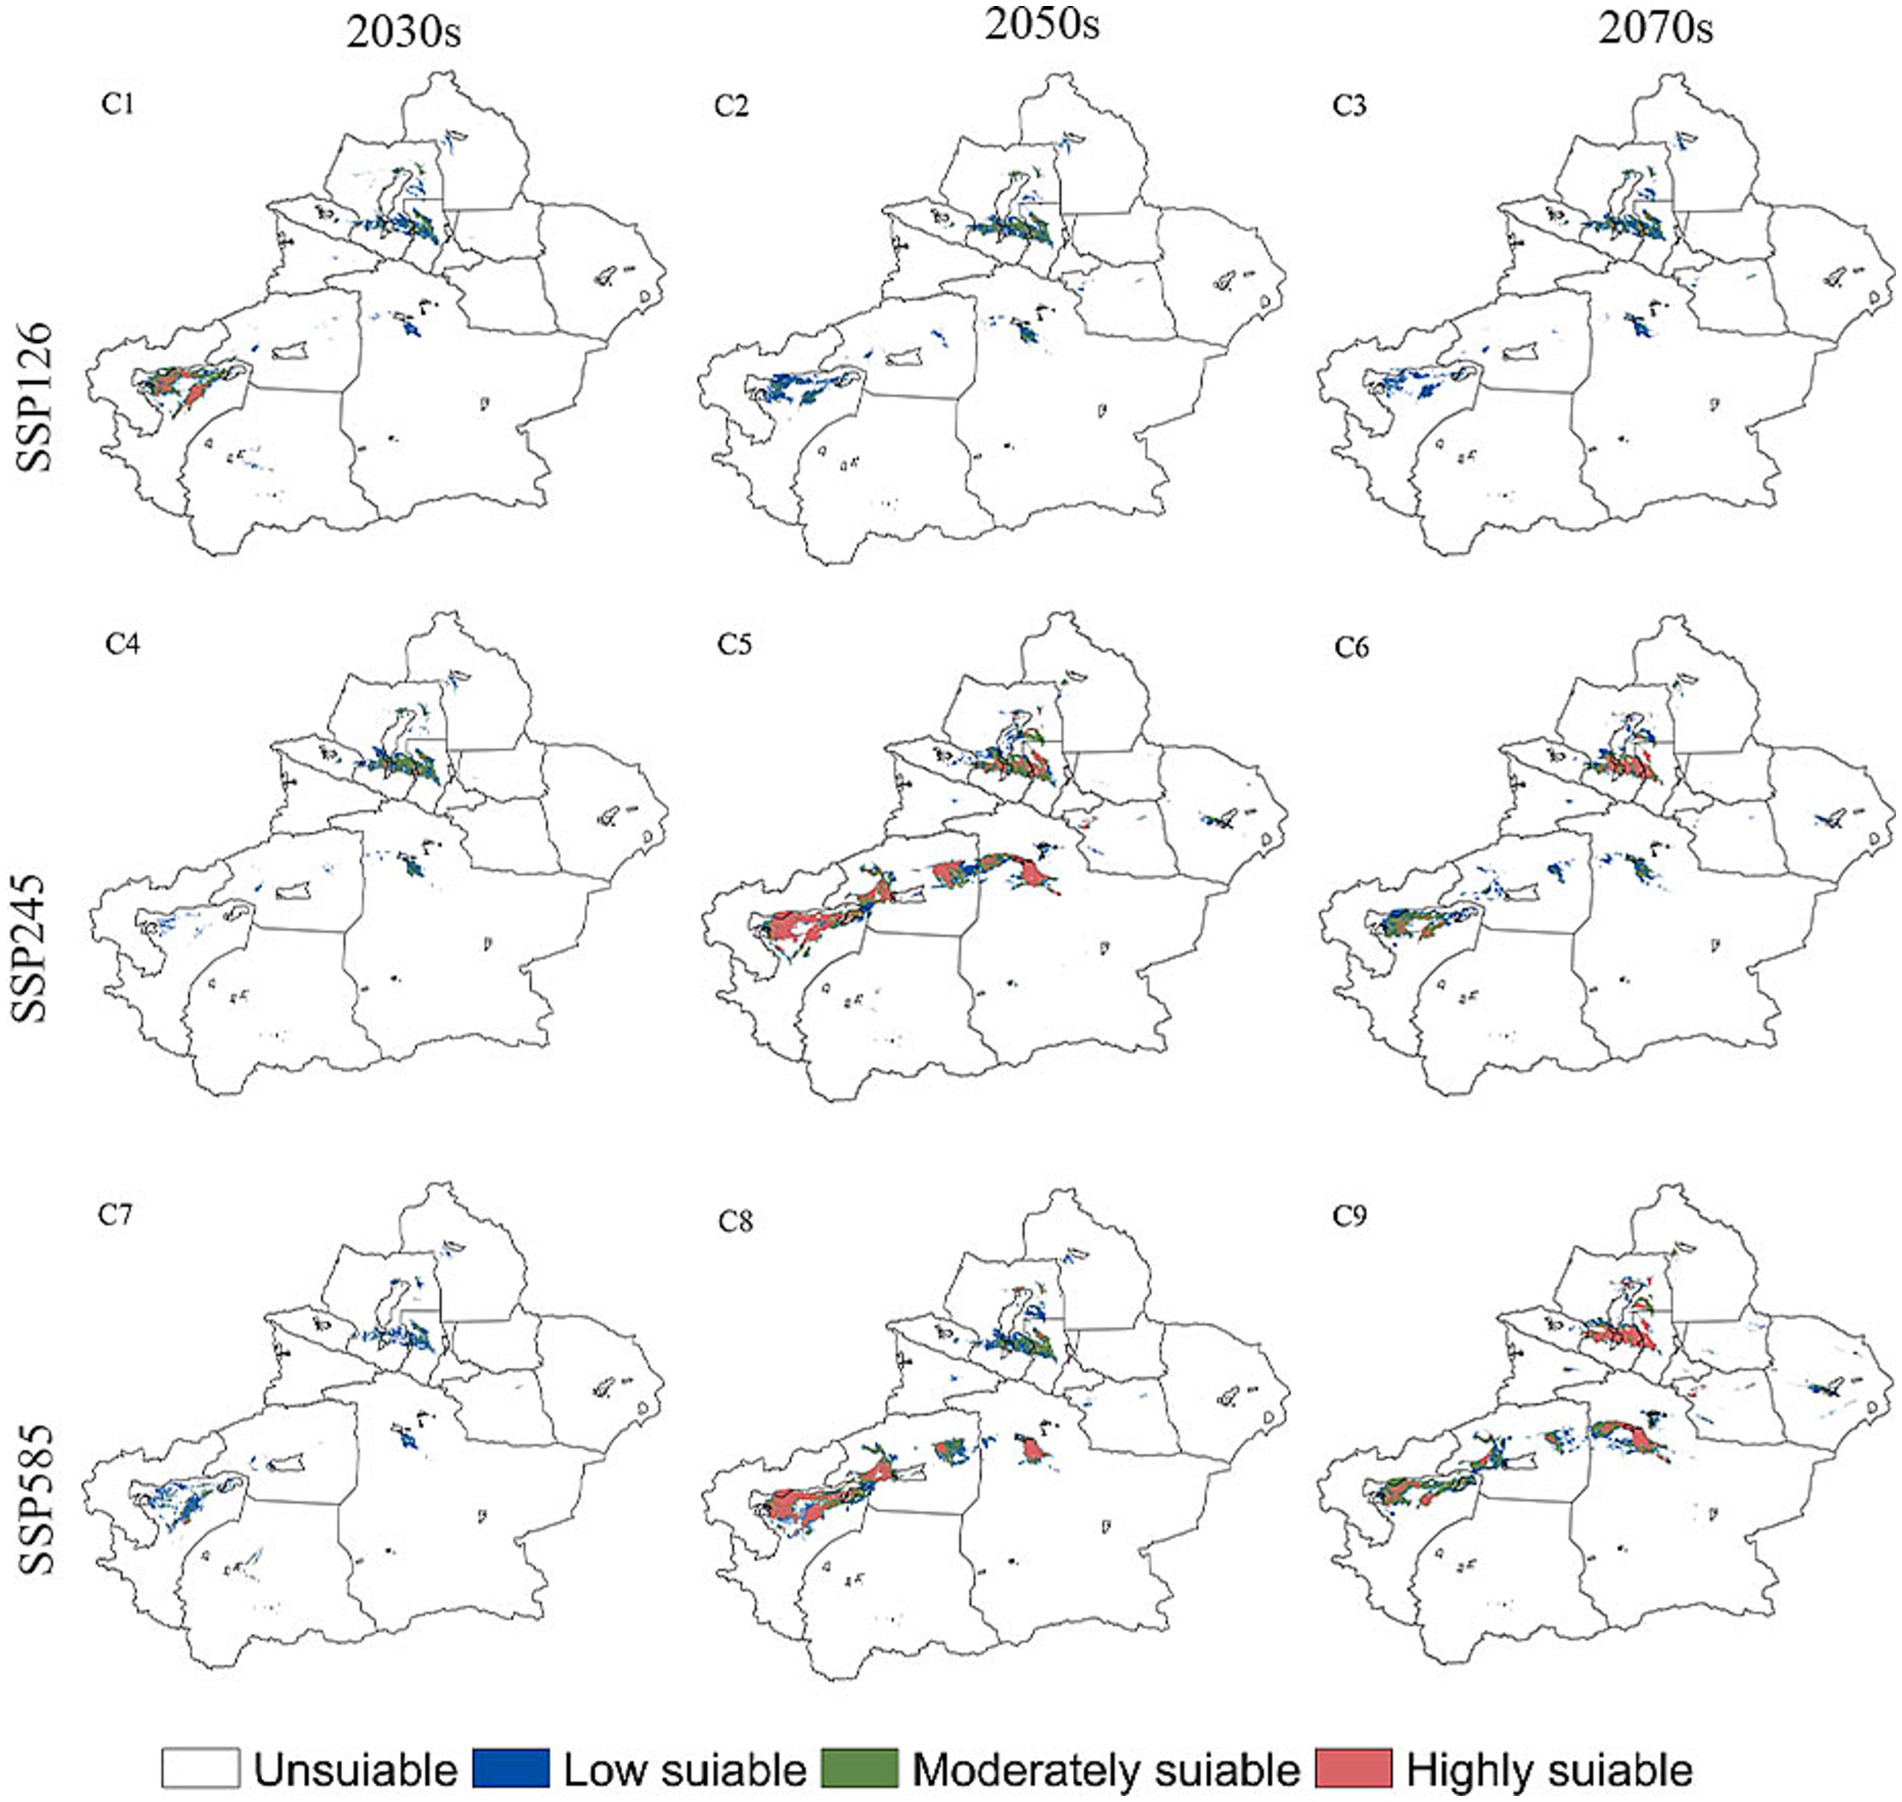
Figure 5. Habitat potential prediction of cotton under the SSP126, SSP245, and SSP585 climate scenarios for the 2030s(C1,C4,C7), 2050s(C2,C5,C8) and 2070s(C3,C6,C9).
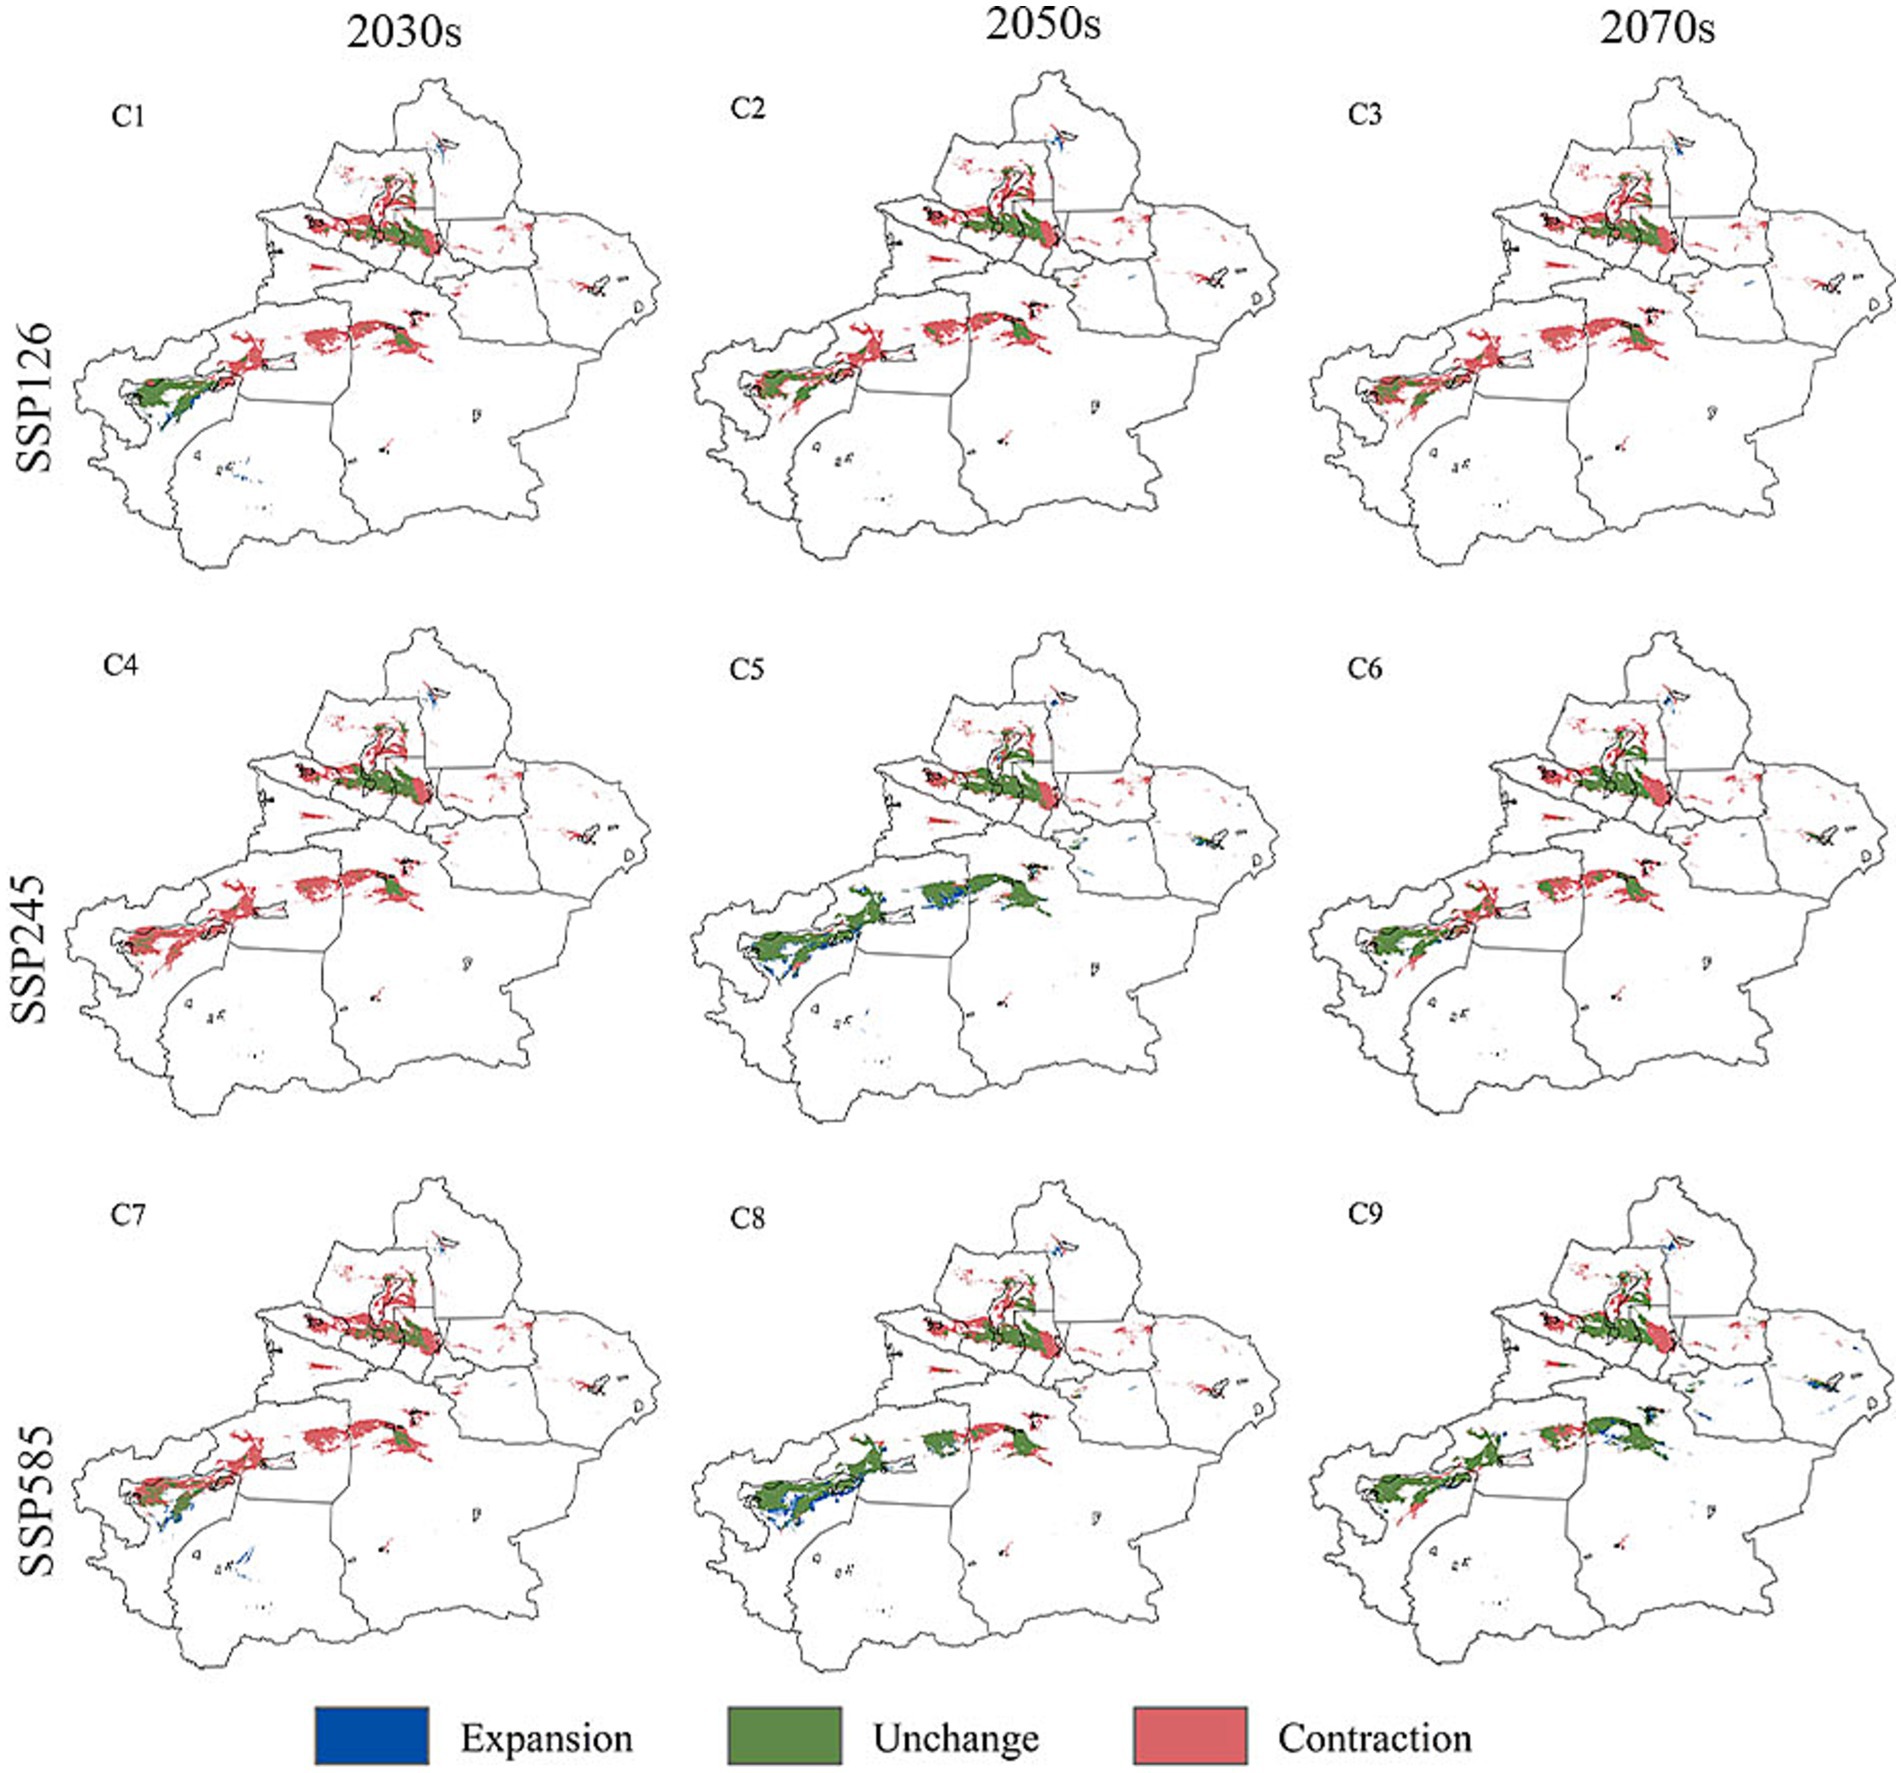
Figure 6. Changes in the potential cotton habitats under the SSP126, SSP245, and SSP585 climate scenarios for the 2030s(C1,C4,C7), 2050s(C2,C5,C8) and 2070s(C3,C6,C9).
The predicted suitable habitat area for cotton shows substantial differences compared to the current climate scenario (Figure 7). Under the current climate scenario, the total suitable habitat area for cotton is 7.97 × 10⁴ km2, accounting for 5.1% of Xinjiang’s total area. Under the SSP126 scenario, the suitable habitat area is projected to range between 2.37 × 10⁴ km2 and 3.37 × 10⁴ km2, representing 1.52 to 2.15% of Xinjiang’s area, with the highly suitable habitat area peaking at 0.57 × 10⁴ km2 in the 2030s, accounting for 17% of the total suitable area. In the SSP245 scenario, the suitable habitat area is projected to range between 2.06 × 10⁴ km2 and 8.09 × 10⁴ km2, corresponding to 1.32 to 5.17% of the total area. By the 2050s, the suitable habitat area is expected to exceed the current extent, with highly suitable habitats reaching a maximum of 3.35 × 10⁴ km2, representing 41% of the total. Under the SSP585 scenario, suitable habitat areas are expected to range between 2.12 × 10⁴ km2 and 6.96 × 10⁴ km2, accounting for 1.36 to 4.45% of Xinjiang’s total area, with the highly suitable habitat area peaking at 2.23 × 10⁴ km2, or 32% of the total, in the 2070s. Area percentage analysis indicates that under the SSP126 scenario, cotton’s suitable habitat continuously contracts over time (Figure 8), while under the SSP245 scenario, the habitat follows a contraction–expansion–contraction pattern. In contrast, under the SSP585 scenario, an initial contraction is followed by expansion. Overall, changes are most pronounced under the SSP245 scenario, followed by SSP585, with relatively stable conditions observed under SSP126.
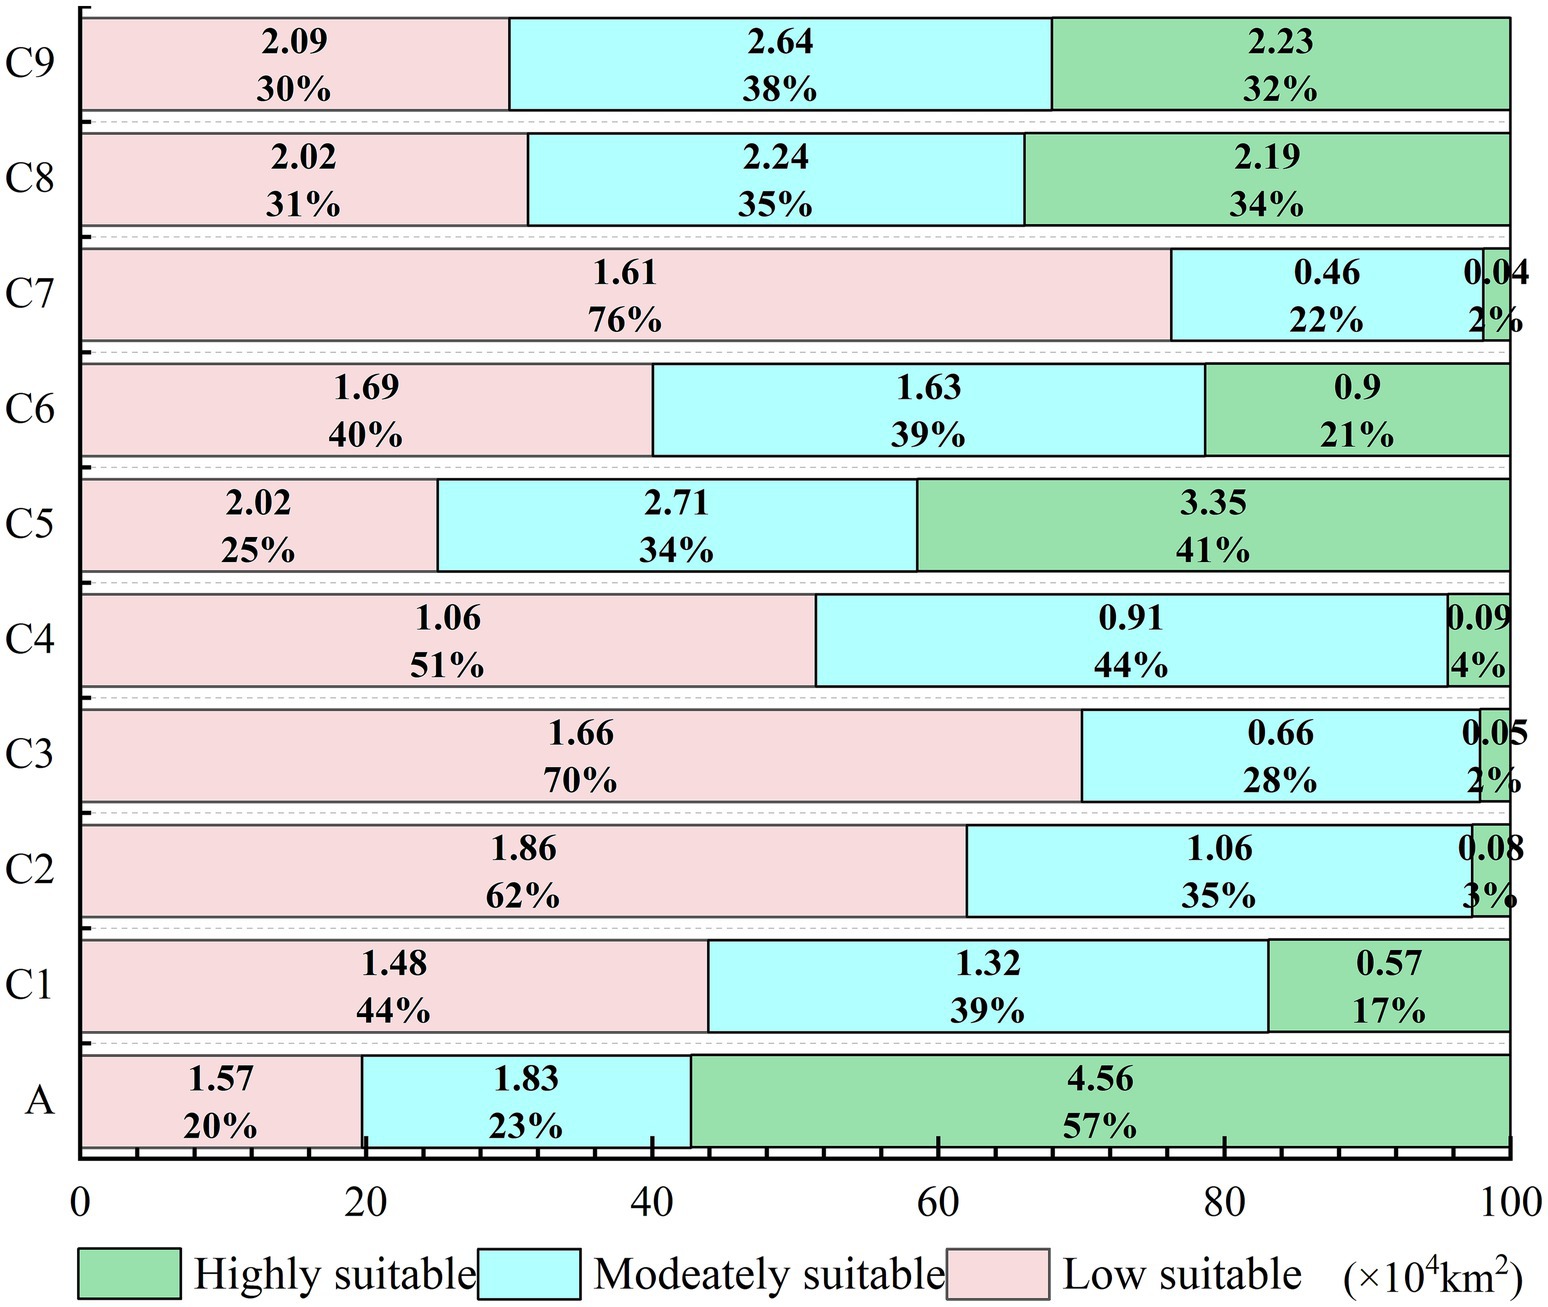
Figure 7. Percentage and area of each suitable habitat for cotton under different climate change scenarios.
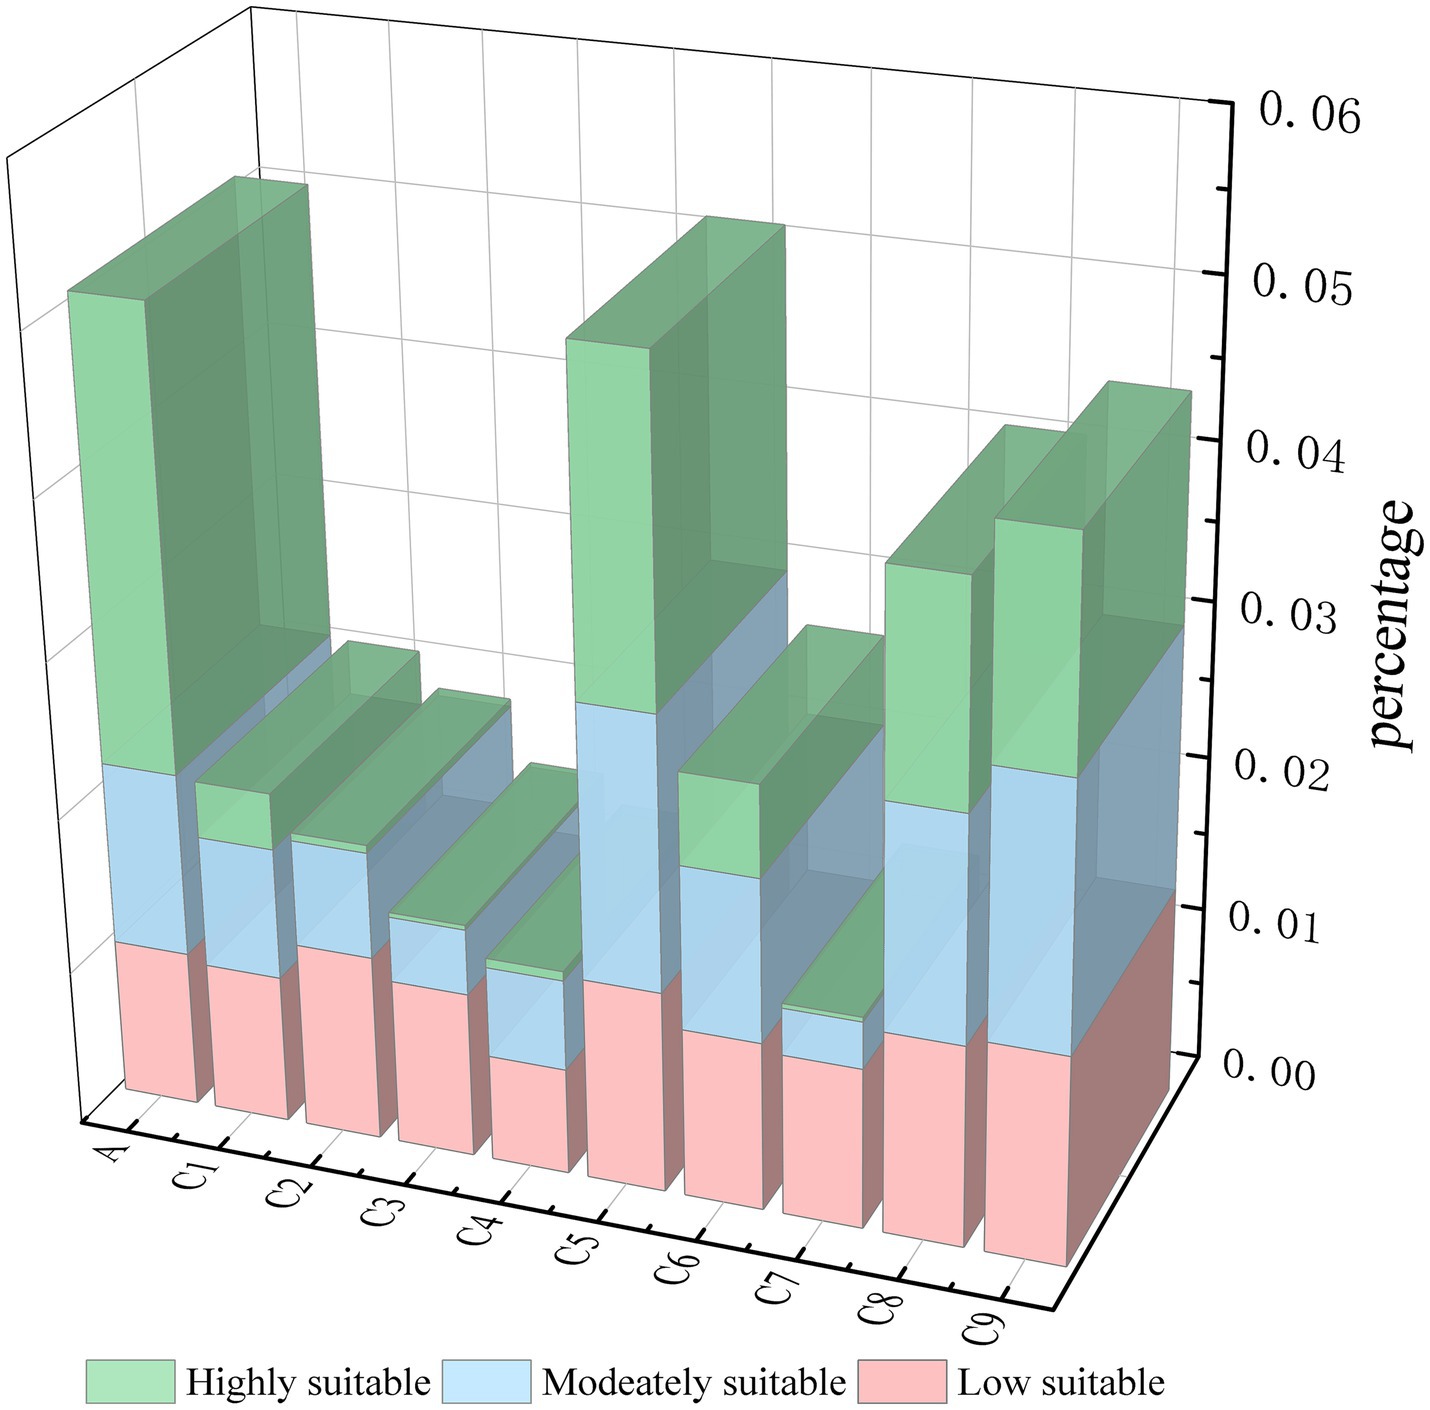
Figure 8. 3D histogram of the percentage of suitable habitat for cotton under different climate scenarios.
3.4 Potential shift of cotton distribution center in Xinjiang
The “Centroid Shift (Line)” tool in SDMToolbox was employed to analyze the changes in the centroid of suitable cotton habitats under three Shared Socioeconomic Pathways (SSP126, SSP245, and SSP585) for the 2030s, 2050s, and 2070s, relative to the current centroid. These changes include shifts in latitude, longitude, and elevation (Figure 9). The current centroid of suitable cotton habitats in Xinjiang is situated in the northwest of Bayingolin Mongol Autonomous Prefecture (42.57°N, 83.86°E), at an elevation of 4,082 m. In the SSP126 scenario, the centroid of cotton distribution shifts northeastward along a horizontal gradient. In the SSP245 and SSP585 scenarios, the centroid shifts southwestward along a horizontal gradient, with a vertical shift toward lower altitudes.

Figure 9. Shift of the center point between the current climate scenario and the 2030s, 2050s and 2070s climate scenarios. (a) Cotton Distribution Center Migration in Xinjiang. (b) Shift of the centre point in SSP126 scenario. (c) Shift of the centre point in SSP245 scenario. (d) Shift of the centre point in SSP585 scenario.
The centroid shifts under different climate scenarios are summarized as follows: Under the SSP126 scenario, the centroid in the 2030s is located at 41.69°N latitude, 81.26°E longitude, and 1,518 meters elevation; by the 2050s, it shifts to 42.58°N latitude, 82.75°E longitude, and 3,087 meters elevation; and by the 2070s, it moves to 43.05°N latitude, 83.48°E longitude, and 3,451 meters elevation. Under the SSP245 scenario, the centroid in the 2030s is located at 43.89°N latitude, 84.89°E longitude, and 3,060 meters elevation; by the 2050s, it shifts to 41.84°N latitude, 82.60°E longitude, and 1,520 meters elevation; and by the 2070s, it moves to 42.29°N latitude, 82.40°E longitude, and 2,306 meters elevation. Under the SSP585 scenario, the centroid in the 2030s is located at 41.79°N latitude, 81.98°E longitude, and 1,231 meters elevation; by the 2050s, it moves to 41.51°N latitude, 81.53°E longitude, and 1,379 meters elevation; and by the 2070s, the centroid is located at 42.10°N latitude, 83.13°E longitude, and 1,620 meters elevation.
4 Discussion
4.1 Analysis of major impact factors
Optimal MaxEnt model predictions reveal that, under the combined influences of climate change and human activities, the primary factors influencing cotton growth in Xinjiang are the Human Footprint (HF), solar radiation, the mean diurnal range (bio2), the mean temperature of the coldest quarter (bio11), and the precipitation of the coldest quarter (bio19). The response curves for each environmental variable demonstrate the range of cotton’s adaptability to these factors. At the Maximum Training Sensitivity Specificity (MTSS) threshold, the probability response curves reveal the relationship between cotton occurrence probability and the environmental variables. Specifically, the suitable range for human footprint is between 5.82 and 41.80, solar radiation ranges from 14,866.70 to 16,138.84 KJ, the optimal range for bio2 is from 8.68 to 11.99°C and 12.77 to 15.29°C, for bio11, it is from −13.59 to −9.66°C and −5.46 to 0.45°C, and for bio19, it is from 2.41 to 23.98 mm (Figure 10).
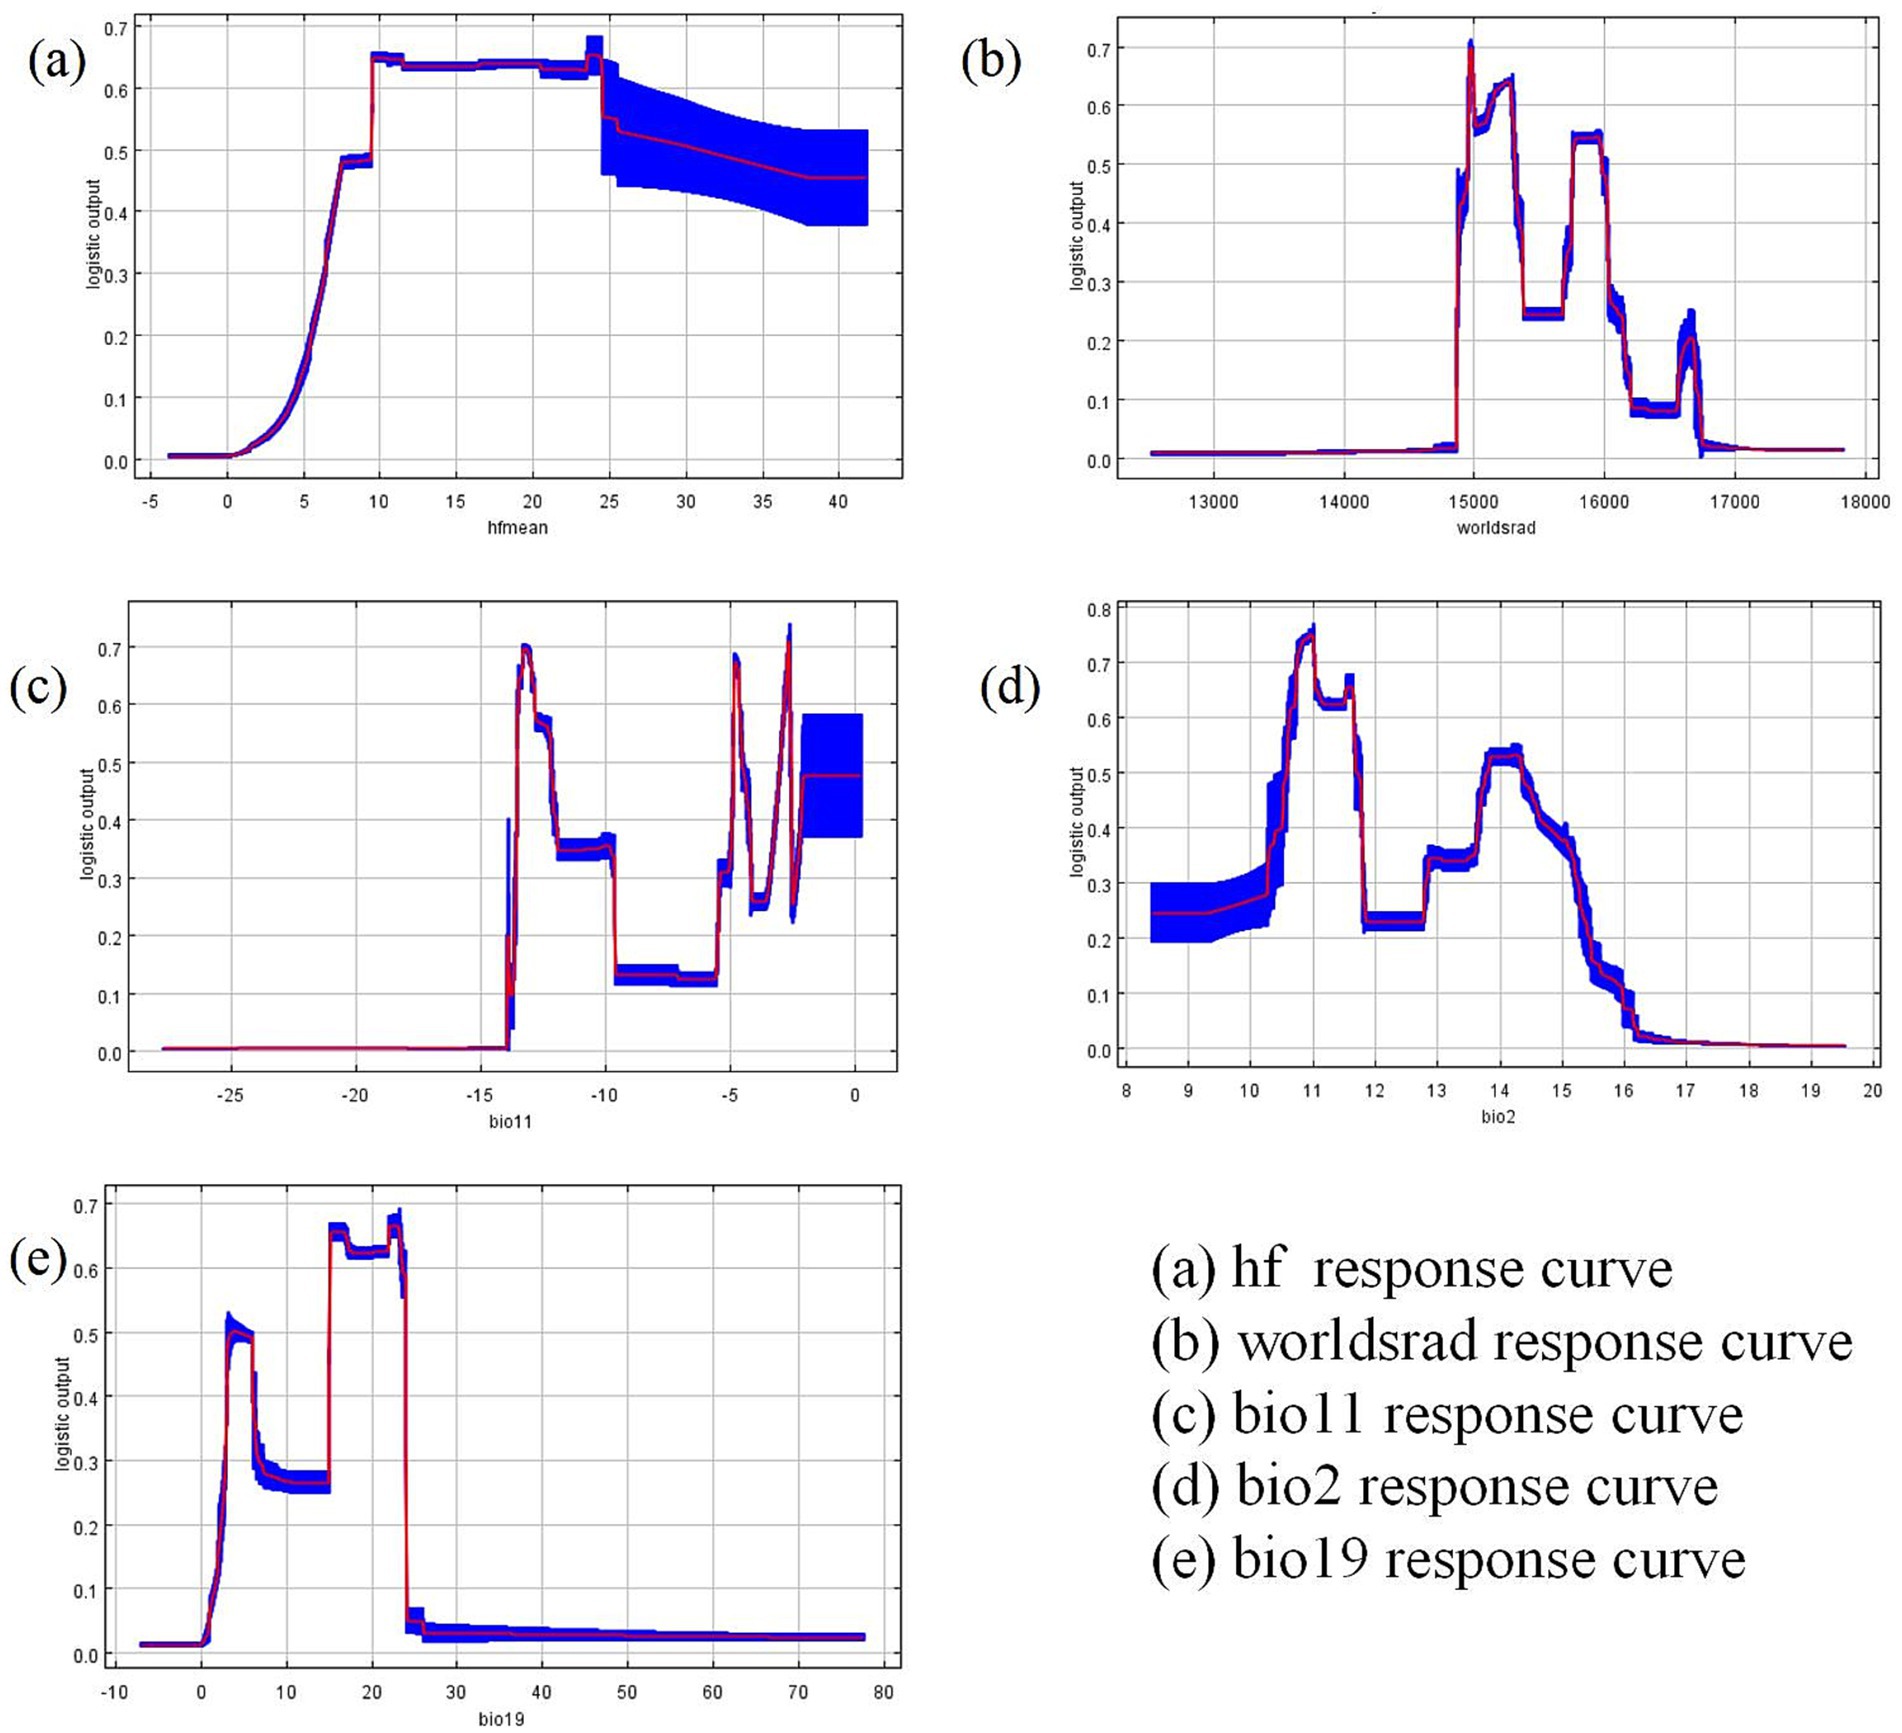
Figure 10. Response curves for dominant environmental variables.
Cotton cultivation in Xinjiang is predominantly concentrated in oasis plain regions, characterized by flat terrain and controllable water resources, making them typical artificial agricultural ecosystems. The simulation results of this study indicate that the inclusion of the human footprint (HF) variable significantly increased the area of suitable cotton habitat, with an approximate 19% expansion compared to the no-disturbance scenario. This finding quantitatively highlights the positive influence of human activities on shaping the spatial distribution of cotton, particularly in regions where natural climatic resources are limited. Through the construction of irrigation systems, improvements in farmland infrastructure, soil preparation, and fertilizer management, human interventions have effectively enhanced the ecological suitability for cotton cultivation (Duan et al., 2021; Onuegbu et al., 2024; Zhang et al., 2024). For example, certain areas in the lower reaches of the Tarim River were not suitable for cotton cultivation under natural climatic conditions; however, following the establishment of canal irrigation systems, habitat suitability for cotton significantly improved. These findings align with previous research highlighting the reliance of agricultural expansion in arid regions on artificial irrigation (Abou Zaki et al., 2022; Ahmed et al., 2023).
Previous studies have highlighted the crucial role of solar radiation in the growth and development of cotton (Pinnamaneni et al., 2022). While various experimental methods have explored its relationship with cotton growth, a systematic quantitative analysis of the role of solar radiation in regional suitability assessments remains lacking (Lin et al., 2023). This study utilizes the MaxEnt model to quantitatively characterize the impact of solar radiation on the distribution of suitable areas for cotton. Furthermore, adequate precipitation contributes to increased soil moisture, thereby providing a favorable growth environment for cotton. However, excessive precipitation may impair cotton’s photosynthetic capacity, hinder growth, and ultimately affect its final yield (Jans et al., 2021). In this study, we found that the suitable range for cotton in relation to bio2 is between 8.68°C and 15.29°C, effectively supporting its growth. Additionally, cotton is particularly sensitive to low temperatures, and the suitable range for bio11 is from −13.59°C to −9.66°C and from −5.46°C to 0.45°C, which helps prevent frost damage and supports regenerative growth. Similarly, bio19, with a range of 2.41 mm to 23.98 mm, ensures the accumulation of soil moisture, satisfying cotton’s drought tolerance requirements. These findings are consistent with previous research, where temperature and precipitation are key drivers of cotton growth, with similar trends in suitable ranges and influence mechanisms observed across different regions (Chen et al., 2019; Sun et al., 2024; Khan et al., 2025).
4.2 Geographical distribution of suitable habitats for cotton in Xinjiang under future climate scenarios
Future climate change scenarios suggest substantial uncertainty regarding the trends in suitable habitats for cotton cultivation in Xinjiang. Compared to the current distribution, the total area of suitable habitats is projected to decline under both the SSP126 and SSP585 scenarios. Rising temperatures, changes in precipitation patterns, and an increased frequency of drought events are expected to reduce suitable planting areas under both low-emission (SSP126) and high-emission (SSP585) scenarios, consistent with previous studies on the negative impacts of climate change on crop production in arid regions (Feng et al., 2024; Nazarova et al., 2025). Temperature plays a crucial role in cotton growth, and yields decline significantly when temperatures exceed 32°C. If global temperatures rise by 1.5–2.0°C, cotton yields could decrease by up to 40% by 2,100 (Schlenker and Roberts, 2009). Historical evidence also indicates that cotton yields in the southwestern United States have declined by approximately 26% due to heat stress (Elias et al., 2018). In the low desert region of Arizona, cotton seed yields are projected to decrease by 40% by mid-century (2036–2065) and by 51% by the end of the century (2066–2095), compared to the baseline period of 1980–2005 (Ayankojo et al., 2020). These findings are broadly consistent with the trends of habitat suitability changes for cotton cultivation identified in this study.
In contrast, under the SSP245 scenario, predictions for the 2050s indicate an expansion trend, whereas the 2030s and 2070s are projected to experience continued contraction. Under the moderate emission scenario (SSP245), moderate warming, combined with improved precipitation patterns and optimized irrigation systems, is likely to provide relatively favorable growing conditions for cotton. This result further emphasizes the key role of human activity management in shaping cotton suitability. Additionally, advancements in cotton adaptive breeding technologies, such as the promotion of drought-resistant varieties, could further facilitate the expansion of suitable habitats (Wang et al., 2023). Relevant studies suggest that with appropriate climate adaptation strategies, crops like cotton can adjust to environmental changes induced by climate change, expanding their suitable habitats even under rising temperatures and shifting precipitation patterns (Li et al., 2021).
4.3 Migration of the cotton centroid in Xinjiang
This study shows that under the SSP126, SSP245, and SSP585 climate scenarios, the center of suitable cotton habitats in Xinjiang generally migrates from higher to lower altitudes. This shift is mainly driven by a combination of rising temperatures, changing precipitation patterns, and human water resource management (Wang et al., 2021; Zhou et al., 2022). As temperatures rise and precipitation patterns shift, droughts intensify, and water shortages become more severe in high-altitude regions, thus restricting cotton growth. In contrast, low-altitude areas, with richer water resources and well-developed irrigation infrastructure, are becoming increasingly suitable for cotton cultivation (Li et al., 2020a). Recently, Xinjiang has strengthened water security for agriculture in low-altitude regions by promoting efficient water-saving irrigation technologies and implementing integrated regional water resource management strategies (Liang et al., 2019). Therefore, future efforts to address the spatial reorganization of cotton cultivation areas under climate change should integrate water resource management with agricultural adaptation strategies.
4.4 Limitations and future research
This study utilized the MaxEnt model to assess the impacts of climate change and human activities on the suitability of cotton habitats in Xinjiang. However, several limitations should be acknowledged. First, the temporal and spatial scales considered in this study were relatively limited; future research should consider incorporating longer temporal spans and a broader range of climate scenarios to enhance the robustness and comprehensiveness of projections. Second, although the Human Footprint (HF) index was used to represent human activities, it primarily reflects pressures such as population density and infrastructure development and does not directly account for agricultural irrigation systems or water resource availability. Given the significant reliance of cotton cultivation in Xinjiang on irrigation, future studies should consider integrating irrigation-related datasets or conducting sensitivity analyses to more accurately assess potential impacts. Furthermore, this study did not fully consider factors such as pest and disease outbreaks, genetic modification, and policy interventions. Future research should aim to include a broader set of driving forces, thus enabling the development of more targeted adaptation and management strategies to support the sustainable development of the cotton industry in Xinjiang (Khan et al., 2023; Farooq et al., 2024; Zafar et al., 2024).
5 Conclusion
This study employed the ecological niche model (MaxEnt) to establish a comprehensive analytical framework integrating multi-source data—including bioclimatic variables, soil properties, topographic conditions, solar radiation, and human activity footprints—to systematically assess the impacts of climate change and human activities on the spatiotemporal distribution of cotton in Xinjiang. The findings indicate that the human footprint, bio2, bio11, bio19, and solar radiation intensity are key factors influencing cotton distribution. Human activities have considerably expanded the suitable habitat for cotton, especially in northern Bayingolin Mongol Autonomous Prefecture, underscoring their positive role in optimizing cotton cultivation areas. However, climate change has led to an overall decline in suitable habitats, especially in eastern and western Aksu, northern Kashgar, and northern Bayingolin Mongol Autonomous Prefecture, which should be prioritized as vulnerable regions. Future increases in temperature and shifts in precipitation are projected to drive the migration of the centroid of suitable cotton habitats toward lower-altitude areas, resulting in substantial changes in its distribution dynamics. Therefore, future efforts should focus on improving mechanization, irrigation infrastructure, and agricultural coverage in low-altitude areas, as well as strengthening agricultural technology training for farmers. This study deepens the understanding of the dynamic nature of cotton’s suitable habitats in Xinjiang and provides scientific guidance for climate adaptation strategies and regional cultivation optimization.
Data availability statement
The data analyzed in this study is subject to the following licenses/restrictions: data classified as confidential. Requests to access these datasets should be directed to Shanshan Wang, MzIwMjIzNjM5QHhqYXUuZWR1LmNu.
Author contributions
SW: Conceptualization, Data curation, Formal analysis, Methodology, Supervision, Writing – original draft, Writing – review & editing. MS: Supervision, Writing – review & editing. YF: Data curation, Funding acquisition, Resources, Supervision, Writing – review & editing. PJ: Conceptualization, Project administration, Supervision, Writing – review & editing. SC: Writing – review & editing. YL: Supervision, Writing – review & editing. LH: Validation, Writing – review & editing. JZ: Supervision, Writing – review & editing.
Funding
The author(s) declare that financial support was received for the research and/or publication of this article. This research was supported by the earmarked fund for XJARS (XJARS-03).
Acknowledgments
We also like to thank the reviewers for their constructive comments on the manuscript.
Conflict of interest
The authors declare that the research was conducted in the absence of any commercial or financial relationships that could be construed as a potential conflict of interest.
Generative AI statement
The authors declare that no Gen AI was used in the creation of this manuscript.
Publisher’s note
All claims expressed in this article are solely those of the authors and do not necessarily represent those of their affiliated organizations, or those of the publisher, the editors and the reviewers. Any product that may be evaluated in this article, or claim that may be made by its manufacturer, is not guaranteed or endorsed by the publisher.
References
Abou Zaki, N., Kløve, B., and Torabi Haghighi, A. (2022). Expanding the irrigated areas in the MENA and Central Asia: challenges or opportunities? Water 14:2560. doi: 10.3390/w14162560
Ahmed, Z., Gui, D., Murtaza, G., Yunfei, L., and Ali, S. (2023). An overview of smart irrigation management for improving water productivity under climate change in drylands. Agronomy 13:2113. doi: 10.3390/agronomy13082113
Allouche, O., Tsoar, A., and Kadmon, R. (2006). Assessing the accuracy of species distribution models: prevalence, kappa and the true skill statistic (TSS). J. Appl. Ecol. 43, 1223–1232. doi: 10.1111/j.1365-2664.2006.01214.x
Ayankojo, I. T., Thorp, K. R., Morgan, K., Kothari, K., and Ale, S. (2020). Assessing the impacts of future climate on cotton production in the Arizona low desert. Trans. ASABE 63, 1087–1098. doi: 10.13031/trans.13731
Benito Garzón, M., Robson, T. M., and Hampe, A. (2019). ΔTrait SDMs: species distribution models that account for local adaptation and phenotypic plasticity. New Phytol. 222, 1757–1765. doi: 10.1111/nph.15716
Brummer, A. B., and Newman, E. A. (2019). Derivations of the core functions of the maximum entropy theory of ecology. Entropy 21, 712. doi: 10.3390/e21070712
Chen, B., Jing, X., Liu, S., Jiang, J., and Wang, Y. (2022). Intermediate human activities maximize dryland ecosystem services in the long-term land-use change: Evidence from the Sangong River watershed, northwest China. Journal of Environmental Management 319, 115708. doi: 10.1016/j.jenvman.2022.115708
Chen, X., Qi, Z., Gui, D., Gu, Z., Ma, L., Zeng, F., et al. (2019). Simulating impacts of climate change on cotton yield and water requirement using RZWQM2. Agricultural Water Management 222, 231–241. doi: 10.1016/j.agwat.2019.05.030
Duan, J., Ren, C., Wang, S., Zhang, X., Reis, S., Xu, J., et al. (2021). Consolidation of agricultural land can contribute to agricultural sustainability in China. Nature Food 2, 1014–1022. doi: 10.1038/s43016-021-00415-5
Egli, M., Hunt, A. G., Dahms, D., Raab, G., Derungs, C., Raimondi, S., et al. (2018). Prediction of soil formation as a function of age using the percolation theory approach. Front. Environ. Sci. 6:108. doi: 10.3389/fenvs.2018.00108
Elias, E., Marklein, A., Abatzoglou, J. T., Dialesandro, J., Brown, J., Steele, C., et al. (2018). Vulnerability of field crops to midcentury temperature changes and yield effects in the southwestern USA. Clim. Chang. 148, 403–417. doi: 10.1007/s10584-017-2108-8
Elith, J., Phillips, S. J., Hastie, T., Dudík, M., Chee, Y. E., and Yates, C. J. (2011). A statistical explanation of MaxEnt for ecologists. Divers. Distrib. 17, 43–57. doi: 10.1111/j.1472-4642.2010.00725.x
Farooq, T., Zain-ul-Hudda, Q. F., Fatima, R., Muneer, R., Ali, A., Shehzad, S., et al. (2024). Overexpression of gene ΔGH_A07G1537 associated with fiber quality in upland cotton (Gossypium hirsutum l.) through pollen tube transformation method. Agrobiol. Rec. 17, 129–137. doi: 10.47278/journal.abr/2024.031
Feng, L., Wan, S., Zhang, Y., and Dong, H. (2024). Xinjiang cotton: achieving super-high yield through efficient utilization of light, heat, water, and fertilizer by three generations of cultivation technology systems. Field Crop Res. 312:109401. doi: 10.1016/j.fcr.2024.109401
Fu, Z., Ciais, P., Wigneron, J.-P., Gentine, P., Feldman, A. F., Makowski, D., et al. (2024). Global critical soil moisture thresholds of plant water stress. Nat. Commun. 15:4826. doi: 10.1038/s41467-024-49244-7
Gérardeaux, E., Loison, R., Palaï, O., and Sultan, B. (2018). Adaptation strategies to climate change using cotton (Gossypium hirsutum L.) ideotypes in rainfed tropical cropping systems in sub-Saharan Africa. A modeling approach. Field Crops Res. 226, 38–47. doi: 10.1016/j.fcr.2018.07.007
Grill, G., Lehner, B., Thieme, M., Geenen, B., Tickner, D., Antonelli, F., et al. (2019). Mapping the world’s free-flowing rivers. Nature 569, 215–221. doi: 10.1038/s41586-019-1111-9
Guiasu, S., and Shenitzer, A. (1985). The principle of maximum entropy. The mathematical intelligencer 7, 42–48.
Hasegawa, T., Nishi, K., Matsumoto, S., Yamashita, Y., Moriuchi, T., and Higashi, T. (2024). Relationship between preoperative and discharge evaluations in patients receiving around-the-knee osteotomy. J. Phys. Ther. Sci. 36, 717–720. doi: 10.1589/jpts.36.717
He, Y., Ma, J., and Chen, G. (2023). Potential geographical distribution and its multi-factor analysis of Pinus massoniana in China based on the maxent model. Ecol. Indic. 154:110790. doi: 10.1016/j.ecolind.2023.110790
Hebbar, K., Venugopalan, M., Prakash, A., and Aggarwal, P. K. (2013). Simulating the impacts of climate change on cotton production in India. Clim. Chang. 118, 701–713. doi: 10.1007/s10584-012-0673-4
Huang, R., Wu, C., Lu, H., Wu, X., and Zhao, B. (2024). Predicted distribution of locoweed Oxytropis glabra in China under climate change. Agriculture 14:850. doi: 10.3390/agriculture14060850
Jaramillo, F., and Destouni, G. (2015). Local flow regulation and irrigation raise global human water consumption and footprint. Science 350, 1248–1251. doi: 10.1126/science.aad1010
Jiang, Y., Li, R., Shi, Y., and Guo, L. (2021). Natural and political determinants of ecological vulnerability in the Qinghai–Tibet plateau: a case study of Shannan, China. ISPRS Int. J. Geo Inform. 10:327. doi: 10.3390/ijgi10050327
Jans, Y., von Bloh, W., Schaphoff, S., and Müller, C. (2021). Global cotton production under climate change–Implications for yield and water consumption. Hydrology and earth system sciences 25, 2027–2044. doi: 10.5194/hess-25-2027-2021
Kabir, M., Hameed, S., Ali, H., Bosso, L., Din, J. U., Bischof, R., et al. (2017). Habitat suitability and movement corridors of grey wolf (Canis lupus) in northern Pakistan. PLoS One 12:e0187027. doi: 10.1371/journal.pone.0187027
Kass, J. M., Muscarella, R., Galante, P. J., Bohl, C. L., Pinilla‐Buitrago, G. E., Boria, R. A., et al. (2021). ENMeval 2.0: Redesigned for customizable and reproducible modeling of species’ niches and distributions. Methods in Ecology and Evolution 12, 1602–1608. doi: 10.1111/2041-210X.13628
Khan, R. A., Ghayas, M., Khalid, M. N., and Amjad, I. (2023). Transgenic strategies for enhancing cotton disease resistance: current status and future directions. Agrobiol. Rec. 13, 82–91. doi: 10.47278/journal.abr/2023.028
Kuang, N., Hao, C., Liu, D., Maimaitiming, M., Xiaokaitijiang, K., Zhou, Y., et al. (2024). Modeling of cotton yield responses to different irrigation strategies in southern Xinjiang region. China. Agric. Water Manag. 303:109018. doi: 10.1016/j.agwat.2024.109018
Khan, H., Khan, N., Khan, Z., Yingchun, H., Beifang, Y., Yaping, L., et al. (2025). Water and heat resource utilization influence cotton yield through sowing date optimization under varied climate. Agricultural Water Management 313, 109491. doi: 10.1016/j.agwat.2025.109491
Lang, P., Zhang, L., Huang, C., Chen, J., Kang, X., Zhang, Z., et al. (2023). Integrating environmental and satellite data to estimate county-level cotton yield in Xinjiang Province. Front. Plant Sci. 13:1048479. doi: 10.3389/fpls.2022.1048479
Li, N., Lin, H., Wang, T., Li, Y., Liu, Y., Chen, X., et al. (2020b). Impact of climate change on cotton growth and yields in Xinjiang. China. Field Crops Research 247:107590. doi: 10.1016/j.fcr.2019.107590
Li, J., Liu, G., Kwak, J.-H., Chang, S. X., Gao, H., Wu, Q., et al. (2020a). Reclamation of desert land to continuous cotton cropping affects soil properties and microbial communities in the desert-oasis ecotone of Xinjiang, China. J. Soils Sediments 20, 862–873. doi: 10.1007/s11368-019-02469-2
Li, P., Wang, M., Zhou, Y., Wu, Q., Shen, Y., Cui, Z., et al. (2023b). Freezing transcriptome analysis showed that GhZAT10 regulates freezing tolerance through a partially CBF-dependent pathway in upland cotton (Gossypium hirsutum L.). Environ. Exp. Bot. 208:105263. doi: 10.1016/j.envexpbot.2023.105263
Li, L., Wu, H., Gao, Y., and Zhang, S. (2023a). Predicting ecologically suitable areas of cotton cultivation using the MaxEnt model in Xinjiang. China. Ecol. 4, 654–670. doi: 10.3390/ecologies4040043
Li, N., Yao, N., Li, Y., Chen, J., Liu, D., Biswas, A., et al. (2021). A meta-analysis of the possible impact of climate change on global cotton yield based on crop simulation approaches. Agric. Syst. 193:103221. doi: 10.1016/j.agsy.2021.103221
Li, Y., Zhu, J., Xu, J., Zhang, X., Xie, Z., and Li, Z. (2024). Effect of cold stress on photosynthetic physiological characteristics and molecular mechanism analysis in cold-resistant cotton (ZM36) seedlings. Front. Plant Sci. 15:1396666. doi: 10.3389/fpls.2024.1396666
Liang, J., Shi, W., He, Z., Pang, L., and Zhang, Y. (2019). Effects of poly-γ-glutamic acid on water use efficiency, cotton yield, and fiber quality in the sandy soil of southern Xinjiang, China. Agric. Water Manag. 218, 48–59. doi: 10.1016/j.agwat.2019.03.009
Lin, S., Deng, M., Wei, K., Wang, Q., and Su, L. (2023). A new regional cotton growth model based on reference crop evapotranspiration for predicting growth processes. Scientific Reports 13, 7368. doi: 10.1038/s41598-023-34552-7
Lines, R., Bormpoudakis, D., Xofis, P., MacMillan, D. C., Pieterse, L., and Tzanopoulos, J. (2021). Utility of human footprint pressure mapping for large carnivore conservation: the Kafue-Zambezi interface. Sustain. For. 14:116. doi: 10.3390/su14010116
Mai, J., and Liu, G. (2023). Modeling and predicting the effects of climate change on cotton-suitable habitats in the central Asian arid zone. Ind. Crop. Prod. 191:115838. doi: 10.1016/j.indcrop.2022.115838
Malode, K., Akansha, S., and Sharma, C. (2021). Soil-site suitability and evaluation for soybean crop on some Vertisols of marathwada region of Maharashtra state. Plant Archives (9725210), 21. doi: 10.51470/PLANTARCHIVES.2021.v21.no1.247
Merow, C., Smith, M. J., and Silander, J. A. Jr. (2013). A practical guide to MaxEnt for modeling species’ distributions: what it does, and why inputs and settings matter. Ecography 36, 1058–1069. doi: 10.1111/j.1600-0587.2013.07872.x
Meshram, J. H., Singh, S. B., Raghavendra, K., and Waghmare, V. (2022). Drought stress tolerance in cotton: Progress and perspectives. Climate Change Crop Stress 2022, 135–169. doi: 10.1016/B978-0-12-816091-6.00005-5
Nazarova, P., Nazdrachev, Y., Zabolotskich, V., and Mamykin, E. (2025). Efficiency of cultivation of spring Triticale in traditional and organic farming in the arid climate of northern Kazakhstan. Int. J. Agric. Biosci. 14, 11–21. doi: 10.47278/journal.ijab/2024.186
Nouri, A., Yoder, D. C., Raji, M., Ceylan, S., Jagadamma, S., Lee, J., et al. (2021). Conservation agriculture increases the soil resilience and cotton yield stability in climate extremes of the southeast US. Communic. Earth Environ. 2:155. doi: 10.1038/s43247-021-00223-6
Onuegbu, O. C., Wogu, J. O., Okaiyeto, S. A., and Wilson, A. O. (2024). Media practitioners’ knowledge and coverage of climate change and rural farmers adoption in Nigeria. Int. J. Agric. and Biosci. 13, 390–396.
Pinnamaneni, S. R., Anapalli, S. S., and Reddy, K. N. (2022). Photosynthetic response of soybean and cotton to different irrigation regimes and planting geometries. Front. Plant Sci. 13:894706. doi: 10.3389/fpls.2022.894706
Préau, C., Trochet, A., Bertrand, R., and Isselin-Nondedeu, F. (2018). Modeling potential distributions of three European amphibian species comparing ENFA and Maxent. Herpetol. Conserv. Biol. 13, 91–104.
Rodriguez-Caballero, E., Belnap, J., Büdel, B., Crutzen, P. J., Andreae, M. O., Pöschl, U., et al. (2018). Dryland photoautotrophic soil surface communities endangered by global change. Nat. Geosci. 11, 185–189. doi: 10.1038/s41561-018-0072-1
Roy, S., Suman, A., Ray, S., and Saikia, S. K. (2022). Use of species distribution models to study habitat suitability for sustainable management and conservation in the Indian subcontinent: a decade’s retrospective. Front. Sustain. Resour. Manag. 1:1031646. doi: 10.3389/fsrma.2022.1031646
Saini, D. K., Impa, S., McCallister, D., Patil, G. B., Abidi, N., Ritchie, G., et al. (2023). High day and night temperatures impact on cotton yield and quality—current status and future research direction. J. Cotton Res. 6:16. doi: 10.1186/s42397-023-00154-x
Schlenker, W., and Roberts, M. J. (2009). Nonlinear temperature effects indicate severe damages to US crop yields under climate change. Proc. Natl. Acad. Sci. 106, 15594–15598. doi: 10.1073/pnas.0906865106
Shabani, F., Kumar, L., and Ahmadi, M. (2018). Assessing accuracy methods of species distribution models: AUC, specificity, sensitivity and the true skill statistic. Glob. J. Hum. Soc. Sci. 18.
Shi, X., Wang, C., Zhao, J., Wang, K., Chen, F., and Chu, Q. (2021). Increasing inconsistency between climate suitability and production of cotton (Gossypium hirsutum L.) in China. Ind. Crop. Prod. 171:113959. doi: 10.1016/j.indcrop.2021.113959
Shi, M., Wu, H., Jiang, P., Zheng, K., Liu, Z., Dong, T., et al. (2023). Food-water-land-ecosystem nexus in typical Chinese dryland under different future scenarios. Sci. Total Environ. 880:163183. doi: 10.1016/j.scitotenv.2023.163183
Sun, H., Wang, X., Fan, Y., Liu, C., Wu, P., Li, Q., et al. (2017). Effects of biophysical constraints, climate and phylogeny on forest shrub allometries along an altitudinal gradient in Northeast China. Sci. Rep. 7:43769. doi: 10.1038/srep43769
Sun, Z.-X., Zhang, C.-C., Dong, J.-L., et al. (2024). Climate Change and Agriculture—Sustainable Plant Production. Agronomy, 14, 1236. doi: 10.3390/agronomy14061236
Ullah, A., Shakeel, A., Ahmed, H. G. M.-D., Naeem, M., Ali, M., Shah, A. N., et al. (2022). Genetic basis and principal component analysis in cotton (Gossypium hirsutum L.) grown under water deficit condition. Frontiers. Plant Sci. 13:981369. doi: 10.3389/fpls.2022.981369
Venter, O., Sanderson, E. W., Magrach, A., Allan, J. R., Beher, J., Jones, K. R., et al. (2016). Global terrestrial human footprint maps for 1993 and 2009. Sci. Data 3, 160067–160010. doi: 10.1038/sdata.2016.67
Wang, D., Cui, B., Duan, S., Chen, J., Fan, H., Lu, B., et al. (2019). Moving north in China: the habitat of Pedicularis kansuensis in the context of climate change. Sci. Total Environ. 697:133979. doi: 10.1016/j.scitotenv.2019.133979
Wang, K., Su, L., and Wang, Q. (2021). Cotton growth model under drip irrigation with film mulching: a case study of Xinjiang, China. Agron. J. 113, 2417–2436. doi: 10.1002/agj2.20667
Wang, L., Zhao, Y., Long, X., Feng, S., and Guan, X. (2023). A review of molecular regulation studies of low temperature stress in cotton. Crop Design 2:100039. doi: 10.1016/j.cropd.2023.100039
Warren, D. L., Matzke, N. J., Cardillo, M., Baumgartner, J. B., Beaumont, L. J., Turelli, M., et al. (2021). ENMTools 1.0: an R package for comparative ecological biogeography. Ecography 44, 504–511. doi: 10.1111/ecog.05485
Williams, A., White, N., Mushtaq, S., Cockfield, G., Power, B., and Kouadio, L. (2015). Quantifying the response of cotton production in eastern Australia to climate change. Clim. Chang. 129, 183–196. doi: 10.1007/s10584-014-1305-y
Wu, F., Guo, S., Huang, W., Han, Y., Wang, Z., Feng, L., et al. (2024). Soil water movement may regulate soil water consumption and improve cotton yields under different cotton cropping systems. Industrial Crops and Products 211, 118278. doi: 10.1016/j.indcrop.2024.118278
Wu, J., Wang, P., and Ge, X. (2022). Identification and functional dissection of stress-responsive genes in cotton. Front. Media 31, 46–68. doi: 10.1007/s11442-021-1832-1
Xu, L., Fan, Y., Zheng, J., Guan, J., Lin, J., Wu, J., et al. (2024). Impacts of climate change and human activity on the potential distribution of Aconitum leucostomum in China. Sci. Total Environ. 912:168829. doi: 10.1016/j.scitotenv.2023.168829
Xu, D., Zhuo, Z., Wang, R., Ye, M., and Pu, B. (2019). Modeling the distribution of Zanthoxylum armatum in China with MaxEnt modeling. Global Ecol. Conserv. 19:e00691. doi: 10.1016/j.gecco.2019.e00691
Yamamoto, Y., Ichii, K., Ryu, Y., Kang, M., Murayama, S., Kim, S.-J., et al. (2023). Detection of vegetation drying signals using diurnal variation of land surface temperature: application to the 2018 East Asia heatwave. Remote Sens. Environ. 291:113572. doi: 10.1016/j.rse.2023.113572
Yang, Z., He, Y., Aamir, M., Javed, I., Li, G., Zhang, Q., et al. (2022). Weather index insurance for transition to sustainable cotton production under climate change in Xinjiang, China. Front. Environ. Sci. 10:1027260. doi: 10.3389/fenvs.2022.1027260
Yue, Y., Zhang, P., and Shang, Y. (2019). The potential global distribution and dynamics of wheat under multiple climate change scenarios. Sci. Total Environ. 688, 1308–1318. doi: 10.1016/j.scitotenv.2019.06.153
Zafar, M. M., Ijaz, A., Anwar, Z., Shakeel, A., Qadir, F., Kamal, H., et al. (2024). Ancient to modern origins: the evolutionary journey of Gossypium genus and its implications for cotton breeding. Agrobiol. Rec. 17, 13–22. doi: 10.47278/journal.abr/2024.019
Zahra, L. T., Qadir, F., Hafeez, A., Chang, M. S., Khaskheli, M. A., Sarwar, A., et al. (2025). Basic PentaCysteine gene family in cotton: comprehensive genomic characterization and salt stress-responsive gene expression profiling. Int. J. Agric. Biosci. 14, 109–117. doi: 10.47278/journal.ijab/2024.193
Zain-ul-Hudda, T. F., Qadir, F., Alam, R., Shehzad, S., Iqbal, S., Tabbusam, R., et al. (2024). Transformation of Allium sativum leaf agglutinin (ASAL) gene in cotton through pollen tube method to enhance resistance against whitefly. Int. J. Agric. Biosci. 13, 456–462. doi: 10.47278/journal.ijab/2024.152
Zhang, X., Zhang, J., Khan, A., Zhu, D., and Zhang, Z. (2024). Improving the productivity of Xinjiang cotton in heat-limited regions under two life history strategies. J. Environ. Manag. 363:121374. doi: 10.1016/j.jenvman.2024.121374
Zhao, Y., Zhao, M., Zhang, L., Wang, C., and Xu, Y. (2021). Predicting possible distribution of tea (Camellia sinensis L.) under climate change scenarios using MaxEnt model in China. Agriculture 11:1122. doi: 10.3390/agriculture11111122
Keywords: human footprint, climate change, suitable habitat for cotton, MaxEnt model, Xinjiang
Citation: Wang S, Shi M, Fan Y, Jiang P, Chen S, Li Y, Huang L and Zhao J (2025) Assessing the impacts of climate changes and human activities on cotton distribution in Xinjiang. Front. Sustain. Food Syst. 9:1534544. doi: 10.3389/fsufs.2025.1534544
Edited by:
Patricia Abrantes, University of Lisbon, PortugalReviewed by:
Mustafa Tolga Esetlili, Ege University, TürkiyeMuhammad Mubashar Zafar, Hainan University, China
Copyright © 2025 Wang, Shi, Fan, Jiang, Chen, Li, Huang and Zhao. This is an open-access article distributed under the terms of the Creative Commons Attribution License (CC BY). The use, distribution or reproduction in other forums is permitted, provided the original author(s) and the copyright owner(s) are credited and that the original publication in this journal is cited, in accordance with accepted academic practice. No use, distribution or reproduction is permitted which does not comply with these terms.
*Correspondence: Yanmin Fan, ZmFueW1AeGphdS5lZHUuY24=; Pingan Jiang, eGphdWRieGJAeGphdS5lZHUuY24=