 Achmad Kautsar Baharuddin1
 Rusnadi Padjung2
 Kaimuddin Kaimuddin2Yunus Musa2Abd Haris Bahrun2Amir Yassi2
 Madonna Casimero3
 Lizzida Llorca3Iris Bugayong3Benedict Jardinero3
 Hasil Sembiring4Amin Nur5Daniel O. Wasonga6
 Mahmoud F. Seleiman7
 Muhammad Fuad Anshori2*
- 1Agrotechnology Study Program, Hasanuddin University, Makassar, Indonesia
- 2Department of Agronomy, Hasanuddin University, Makassar, Indonesia
- 3International Rice Research Institute, University of the Philippines Los Baños, Los Baños, Philippines
- 4Research Center for Food Crops, Research Organization for Agriculture and Food, National Research and Innovation Agency, Cibinong, Indonesia
- 5Indonesian Cereal Testing Instrument Standard Institute, Maros, Indonesia
- 6Department of Crop Sciences, University of Illinois Urbana Champaign, Urbana, IL, United States
- 7Plant Production Department, College of Food and Agriculture Sciences, King Saud University, Riyadh, Saudi Arabia
Climate-related challenges in rice production in Indonesia underscore the necessity for early-maturing rice varieties. Developing these varieties can enhance productivity by shortening cropping cycles, although the process is often time-consuming, costly, and requires testing across multiple locations. Thus, modeling approaches offer efficient means of simulating the performance of various early maturing rice varieties across many conditions. This study addresses the limited application of the ORYZA (v3) model in tropical settings by calibrating and validating it using field data from two early-maturing rice cultivars: Cakrabuana and Inpari 13. The research used nested split-plots with three replications, two irrigation treatments, continuous flooding (CF) and alternate wetting and drying (AWD), alongside three nitrogen dosage levels: 0 kg ha−1, 90 kg ha−1, and 180 kg ha−1 were implemented. Model calibration was based on observations of phenology and biomass, focusing on parameters such as developmental rates and biomass partitioning. Validation was conducted using independent field data, calibrated Cakrabuana and Inpari 13 crop parameters, and relevant climate and soil information. Cakrabuana met the metric standards, with RMSEn values of 0.11 to 0.17, NSE from 0.68 to 0.93, and MAPE between 0.08 and 0.13%. While, Inpari 13 met the standards for the weight of storage organs. Model tests revealed strong validity for Cakrabuana, while Inpari 13’s lower validity resulted from environmental sensitivity. These findings support the ORYZA (v3) calibrated model as a reliable support planting forecasts for Cakrabuana variety, while further calibration of Inpari 13 is needed.
1 Introduction
Rice (Oryza sativa L.) is the staple food for most people worldwide (Zaghum et al., 2022), particularly in Indonesia, where 95% of the population consumes it regularly, averaging 1.6 kg per week (Sakir et al., 2024; Indonesia Central Bureau of Statistics, 2013). In 2023, Indonesia’s rice production was 53.62 million tons, a 1.12% decrease from 2022, while productivity rose slightly to 52.59 tons per hectare. The country’s population is projected to grow from 238.5 million in 2010 to 305.6 million by 2035 (Indonesia Central Bureau of Statistics, 2013), increasing the demand for rice. To mitigate food shortages, the government has imported 429,207 tons of rice in 2022, up 5.26% from 2021 (Indonesia Central Bureau of Statistics, 2024). Meeting rising consumption needs poses significant challenges, especially related to climate change (Rahim et al., 2024).
Climate change significantly impacts global temperatures, leading to unpredictable weather patterns and extreme events like droughts and floods (Rajakaruna et al., 2024). This disruption in climate negatively affects farming, as irregular rainfall results in reduced crop yields (Raza et al., 2024). In Indonesia, shorter rainy seasons and erratic rainfall have forced farmers to adjust their planting times and methods (Surmaini et al., 2024). Traditional rice varieties typically grown in Indonesia take 125 to 150 days to mature, but these varieties struggle to adapt to the changing climate conditions (Achyadi et al., 2019). To combat these pressing challenges, the introduction of early-maturing rice varieties emerges as a critical and immediate solution, potentially safeguarding food security and supporting farmers in an increasingly unpredictable climate (Dey et al., 2023).
Early maturing rice varieties, such as Cakrabuana and Inpari 13, offer significant advantages through reduced growth cycles that lower planting durations and climate change risks (Yun et al., 2023; Liang et al., 2024). These cultivars can enhance productivity by up to 56% (Musa et al., 2024) and are noted for their high yield potential and adaptability (Anshori et al., 2024). To maximize these benefits, optimizing planting schedules and effective cultivation practices, such as irrigation and fertilization, is essential (Gao et al., 2023; Xiong et al., 2022; Zhang et al., 2020). While complex, crop modeling simplifies this by systematically outlining growth dynamics and enabling virtual experimentation with defined inputs (Jamshidi et al., 2024; Wang et al., 2024). This approach not only improves research efficiency but also enhances plant productivity, resulting in time and cost savings.
Several models have been developed for rice cultivation, including CERES-Rice (Ansari et al., 2021), DNDC-Rice (Sun et al., 2023; Katayanagi et al., 2016), RiceGrow (Tang et al., 2018), APSIM-ORYZA (Amarasingha et al., 2015; Hosseinpour et al., 2025; Liu et al., 2019), and ORYZA-2000 (Majumder and Das, 2018). The most recent and advanced iteration of the ORYZA model series is ORYZA (v3) (Li et al., 2017), which offers improved capabilities for simulating rice responses to irrigation, nitrogen management, and environmental conditions. Effective plant growth simulation depends on multiple parameters, including management parameters, soil properties, climatic factors, and cultivar-specific characteristics (Nurulhuda et al., 2022).
Comprehensive assessments of rice crop models, including CERES-Rice, ORYZA2000, and ORYZA (v3), have been conducted for various rice varieties across several countries, particularly in tropical regions. Significant studies have taken place in the Philippines (Li et al., 2016; Li et al., 2017; Radanielson et al., 2018), Thailand (Hasegawa et al., 2008; Wikarmpapraharn and Kositsakulchai, 2010) and Malaysia (Nurulhuda et al., 2022; Faiz et al., 2019). However, research on rice crop models is less frequent in other tropical countries, such as Indonesia. Previous research by Agustiani et al. (2018), Hayashi et al. (2018), and Hayashi et al. (2021), focused on older rice varieties in Indonesia that were not well-adapted to climate change. To date, there has been a noticeable absence of case studies investigating the application of ORYZA (v3) with early-maturing rice cultivars in Indonesia. Therefore, this development is vital for maintaining the model’s relevance with the most recent data and adapting to the prevailing climate conditions, especially in Indonesia.
The ORYZA (v3) model is a process-based simulation tool developed to model the growth, development, and yield of rice (Oryza sativa L.) under various environmental conditions and agronomic practices. It simulates the physiological and phenological processes from planting to harvest, covering both vegetative and generative phases (Honorio Filho et al., 2024). ORYZA (v3) calculates biomass growth through canopy photosynthesis, influenced by solar radiation, air temperature, and Leaf Area Index (LAI). It allocates biomass to plant organs—roots, stems, leaves, and grains—using evolving organ division ratios (Yu Q. et al., 2023; Yu J. et al., 2023) The model also incorporates water uptake and usage, making it sensitive to conditions like limited irrigation or flooding, and includes nitrogen nutrition components, addressing nitrogen uptake, allocation, and its impact on growth and photosynthesis (Li et al., 2017).
The ORYZA (v3) model requires three main input groups: daily climate data (solar radiation, maximum and minimum temperatures, and rainfall), soil characteristics (texture, field capacity, and soil moisture content), and management parameters (planting dates, fertilizer dosages, and irrigation schedules). It is essential to calibrate the genetic parameters of rice varieties like Cakrabuana and Inpari 13 to accurately simulate their developmental phases, including tillering initiation, panicle primordia, and flowering. Calibration involves aligning model outputs—such as flowering dates, maximum Leaf Area Index (LAI), and yield—with field observations, while validation tests the model’s performance under varied conditions without changing calibrated parameters (IRRI, 2014). The latest version has improved capabilities, including simulations for flooded land and nitrogen deficiency effects. Many reports have shown the effectiveness of ORYZA (v3) for assessing crop management strategies and varietal adaptation in the face of climate variability and resource constraints, particularly in tropical (Hayashi et al., 2018; Hayashi et al., 2021; Nurulhuda et al., 2022; Agustiani et al., 2018) and subtropical (Hameed et al., 2019; Jun-wei et al., 2022; Yuan et al., 2017) rice production systems.
Irrigation methods, such as continuous flooding (CF) and alternate wetting and drying (AWD), along with effective nitrogen management, play significant roles in optimizing water and nutrient use efficiency (Bo et al., 2024; Soliman et al., 2024). These factors are crucial for early-maturing rice varieties with shorter growth cycles (Mu’min et al., 2024; Gao et al., 2024). Therefore, the current development is vital for ensuring the model’s relevance with the latest data and current climate conditions, especially in Indonesia. The calibrated and validated ORYZA (v3) model, which utilizes early-maturing rice varieties like Cakrabuana and Inpari 13, enhances the model’s accuracy. Calibration has been done under different irrigation and nitrogen fertilizer dosages during the wet season; thus, validation is needed to improve the model’s accuracy under various nitrogen dosages and irrigations.
Thus, this study aims to assess the performance of the ORYZA (v3) model for early-maturing rice varieties, specifically Cakrabuana and Inpari 13. This assessment will focus on the effects of varying doses of nitrogen fertilizer and different irrigation schemes, as well as the response of paddy biomass to these treatments.
2 Materials and methods
2.1 Experimental design
This research took place in Maradekayya Village, Bajeng Subdistrict, Gowa Regency, South Sulawesi, at coordinates 5°16′31.8” S, 119°26′25.5″E, from April to August 2024. It utilized a nested split-plot randomized complete block design with three replications, featuring two irrigation treatments: continuous flooding (CF) (i0) and alternate wetting and drying (AWD) (i1), as per the International Rice Research Institute (IRRI). Main plots were based on three nitrogen (N) dosage levels: no nitrogen (n0), 90 kg ha-1 (n1), and 180 kg ha-1 (n2). The subplots included early maturing rice varieties, Cakrabuana (v1) and Inpari 13 (v2), leading to 36 observed plots. The experimental layout is shown in Figure 1.
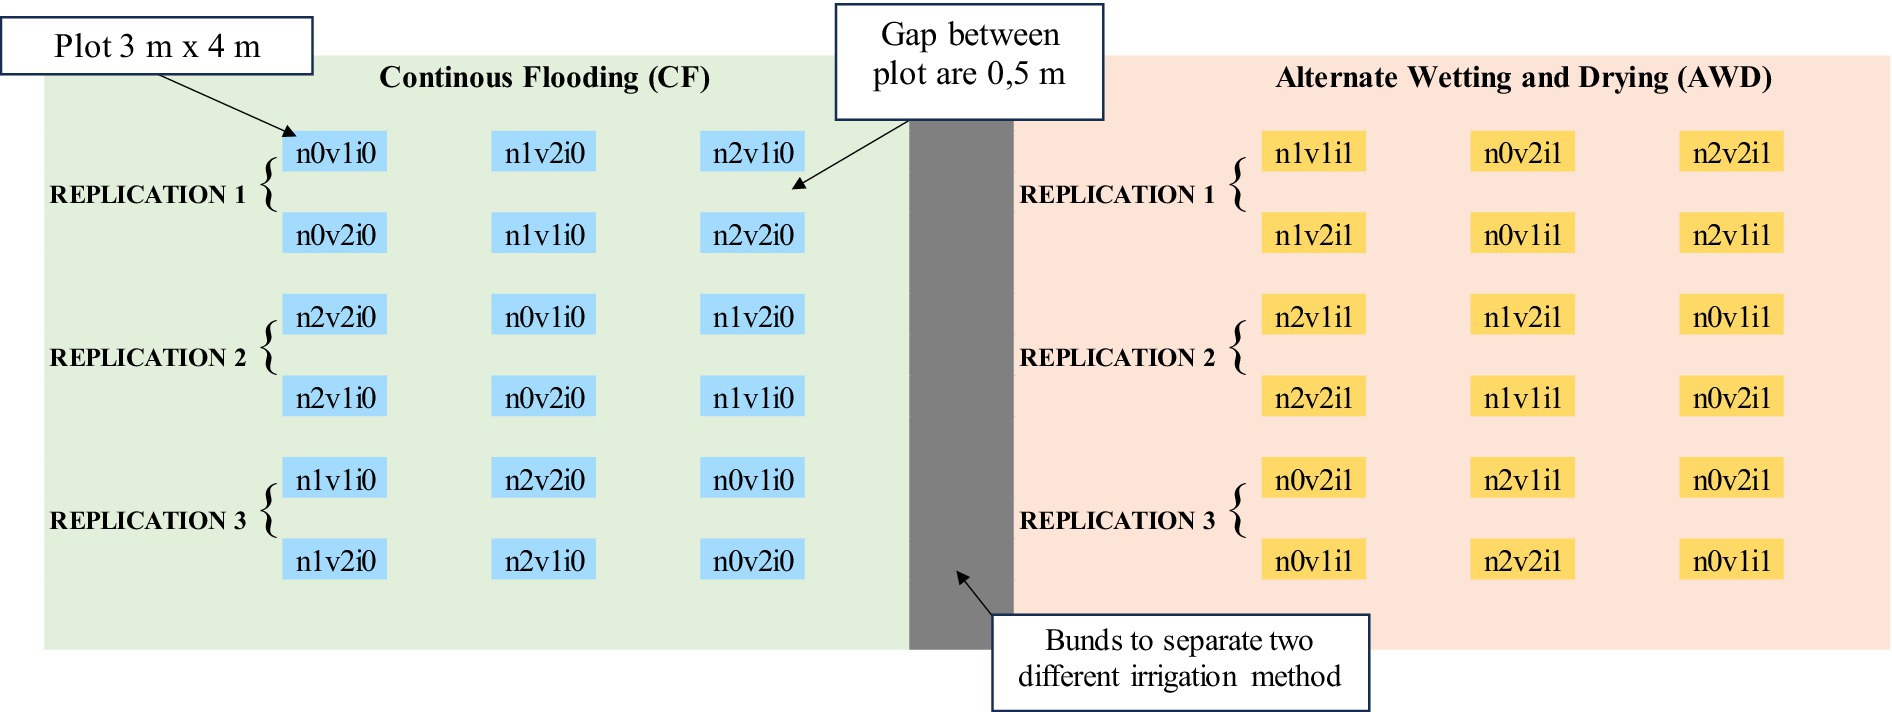
Figure 1. Experimental layout in dry and wet season.
2.2 Research procedure
The research began with plowing and tilling the soil, creating a muddy environment. The land was organized into 3 m x 4 m plots, with a 0,5 m gap between them. Seeds were soaked for 24 h and placed in a nursery bed until they were 15 days old, after which they were transplanted into the field in a 20 cm grid. Seedlings were maintained through various agronomic practices, including manual and chemical weeding, regular watering, fertilization, and pest control. Weeding was crucial in the early growth stages, conducted around 30 days after planting to reduce competition from weeds. Other agronomic standard protocols are based on Musa et al. (2024) and Anshori et al. (2024). For irrigation, Continuous Flooding (CF) provides a constant water supply throughout the growing season. In the Alternate Wetting and Drying (AWD) method, fields are flooded with 3 to 5 cm of water until the water table drops to 15 cm below the surface before re-irrigating. Irrigation stops 1 to 2 weeks before harvesting (IRRI, 2016).
Validating the ORYZA Model (v3) requires gathering three prerequisite types of input data: climate data, soil data, and experimental data. Climate data should include measurements such as rainfall (mm/day−1), solar radiation (MJ/m2), maximum and minimum temperatures (°C), and wind speed (m/s−1). Soil sampling was performed at the research site by collecting four samples from different points at depths of 0–10 cm, 10–20 cm, 20–40 cm, and 40–60 cm. The essential focus was on the physical properties of the soil, particularly carbon, nitrogen content, and hydraulic properties.
Soilhydrau.exe, developed by the International Rice Research Institute (IRRI), was used to estimate soil hydraulic properties. This tool is part of the ORYZA crop growth modeling framework and helps simulate water dynamics in the soil profile. Soilhydrau.exe requires basic input data, including soil texture (sand, silt, and clay percentages), bulk density, and optional organic matter content. It uses pedotransfer functions (PTFs) to derive hydraulic properties from these data points. The results are then formatted in ORYZA simulation files, enabling accurate modeling of soil water retention, infiltration, drainage, and plant water uptake (Hayashi et al., 2021; Bouman et al., 2001). By including these hydraulic properties, SoilHydrau.exe improves the accuracy of water balance and crop growth simulations in rice production systems. While the design of each experimental plot followed the IRRI protocol (IRRI, 2014; Li et al., 2017), which requires biomass sampling at key growth stages: 17 DAT, panicle initiation, flowering, grain filling, and physiological maturity. Additionally, experimental data should include details on phenological phases, biomass, leaf area index, and fertilizer application. For more information, please refer to Supplementary Files 1–3.
Cakrabuana is a superior type of rice developed from the Inpari 13 variety. It is created through a special technique involving irradiation with gamma rays, which enhances its desirable traits. Cakrabuana rice has a relatively short growth cycle of 104 days from planting to harvest, although it can sometimes be harvested in under 100 days in tropical conditions. This variety grows upright and reaches an average height of 105 cm, with a typical yield of 7.5 ton ha−1. Inpari 13 is a superior rice variety developed from a blend of OM606 and IR18348-36-3-3. This rice variety has a short growth cycle, taking about 103 days from planting to harvest. Under high-temperature conditions, it can be harvested in less than 100 days. The plants are strong and upright, featuring mildly rough leaves that grow upright. Inpari 13 is known for its relatively high yield, averaging 6.59 ton ha−1, and it can produce even more under very favorable environmental conditions, with a maximum potential yield of up to 8 ton ha−1 (Balitbangtan, 2021).
2.3 ORYZA (v3) model calibration
The ORYZA (v3) model was initially calibrated using treatment-specific data collected from December 2023 to March 2024. This calibration was validated with data from the same treatments gathered between April and August 2025. The calibration parameters were selected based on the ORYZA (v3) manual and existing literature (IRRI, 2014; Li et al., 2017). Calibration of crop parameters in ORYZA defines the characteristics of the varieties used in simulations. This involves adjusting specific parameter values to accurately represent the test varieties used available experimental data. The primary objective is to minimize the discrepancies between the model’s simulated outputs and the observed experimental values. Calibration of crop parameters in ORYZA involves defining the variety’s characteristics by adjusting parameter values based on experimental data. The parameterization focused on observed phenological stages, particularly the timing of critical growth events such as panicle initiation, flowering, and maturity. To modify the development rates across four distinct phases, the DRATE (v2) file was utilized. These phases include the juvenile phase (DVRJ, °C day−1), the photoperiod-sensitive phase (DVRI, °C day−1), the panicle development phase (DVRP, °C day−1), and the reproductive phase (DVRR, °C day−1). Additionally, the PARAM (v2) file was used to estimate key parameters such as specific leaf area (SLA, ha kg−1), the proportion of shoot dry matter allocated to leaves (FLV), stems (FST), and panicles (FSO), the fraction of carbohydrates directed to stems (FSTR), and the leaf death rate coefficient (DRLV, day−1). Observations of various variables contributed to these estimations, including the leaf area index (LAI) and measurements of dry biomass for weight storage organ (WSO), weight of stems (WST), weight of green leaves (WLVG), weight of dead leaves (WLVD), and aboveground total biomass (WAGT). The calibration scheme flow for ORYZA (v3) in the Cakrabuana and Inpari 13 varieties is shown in Figure 2.
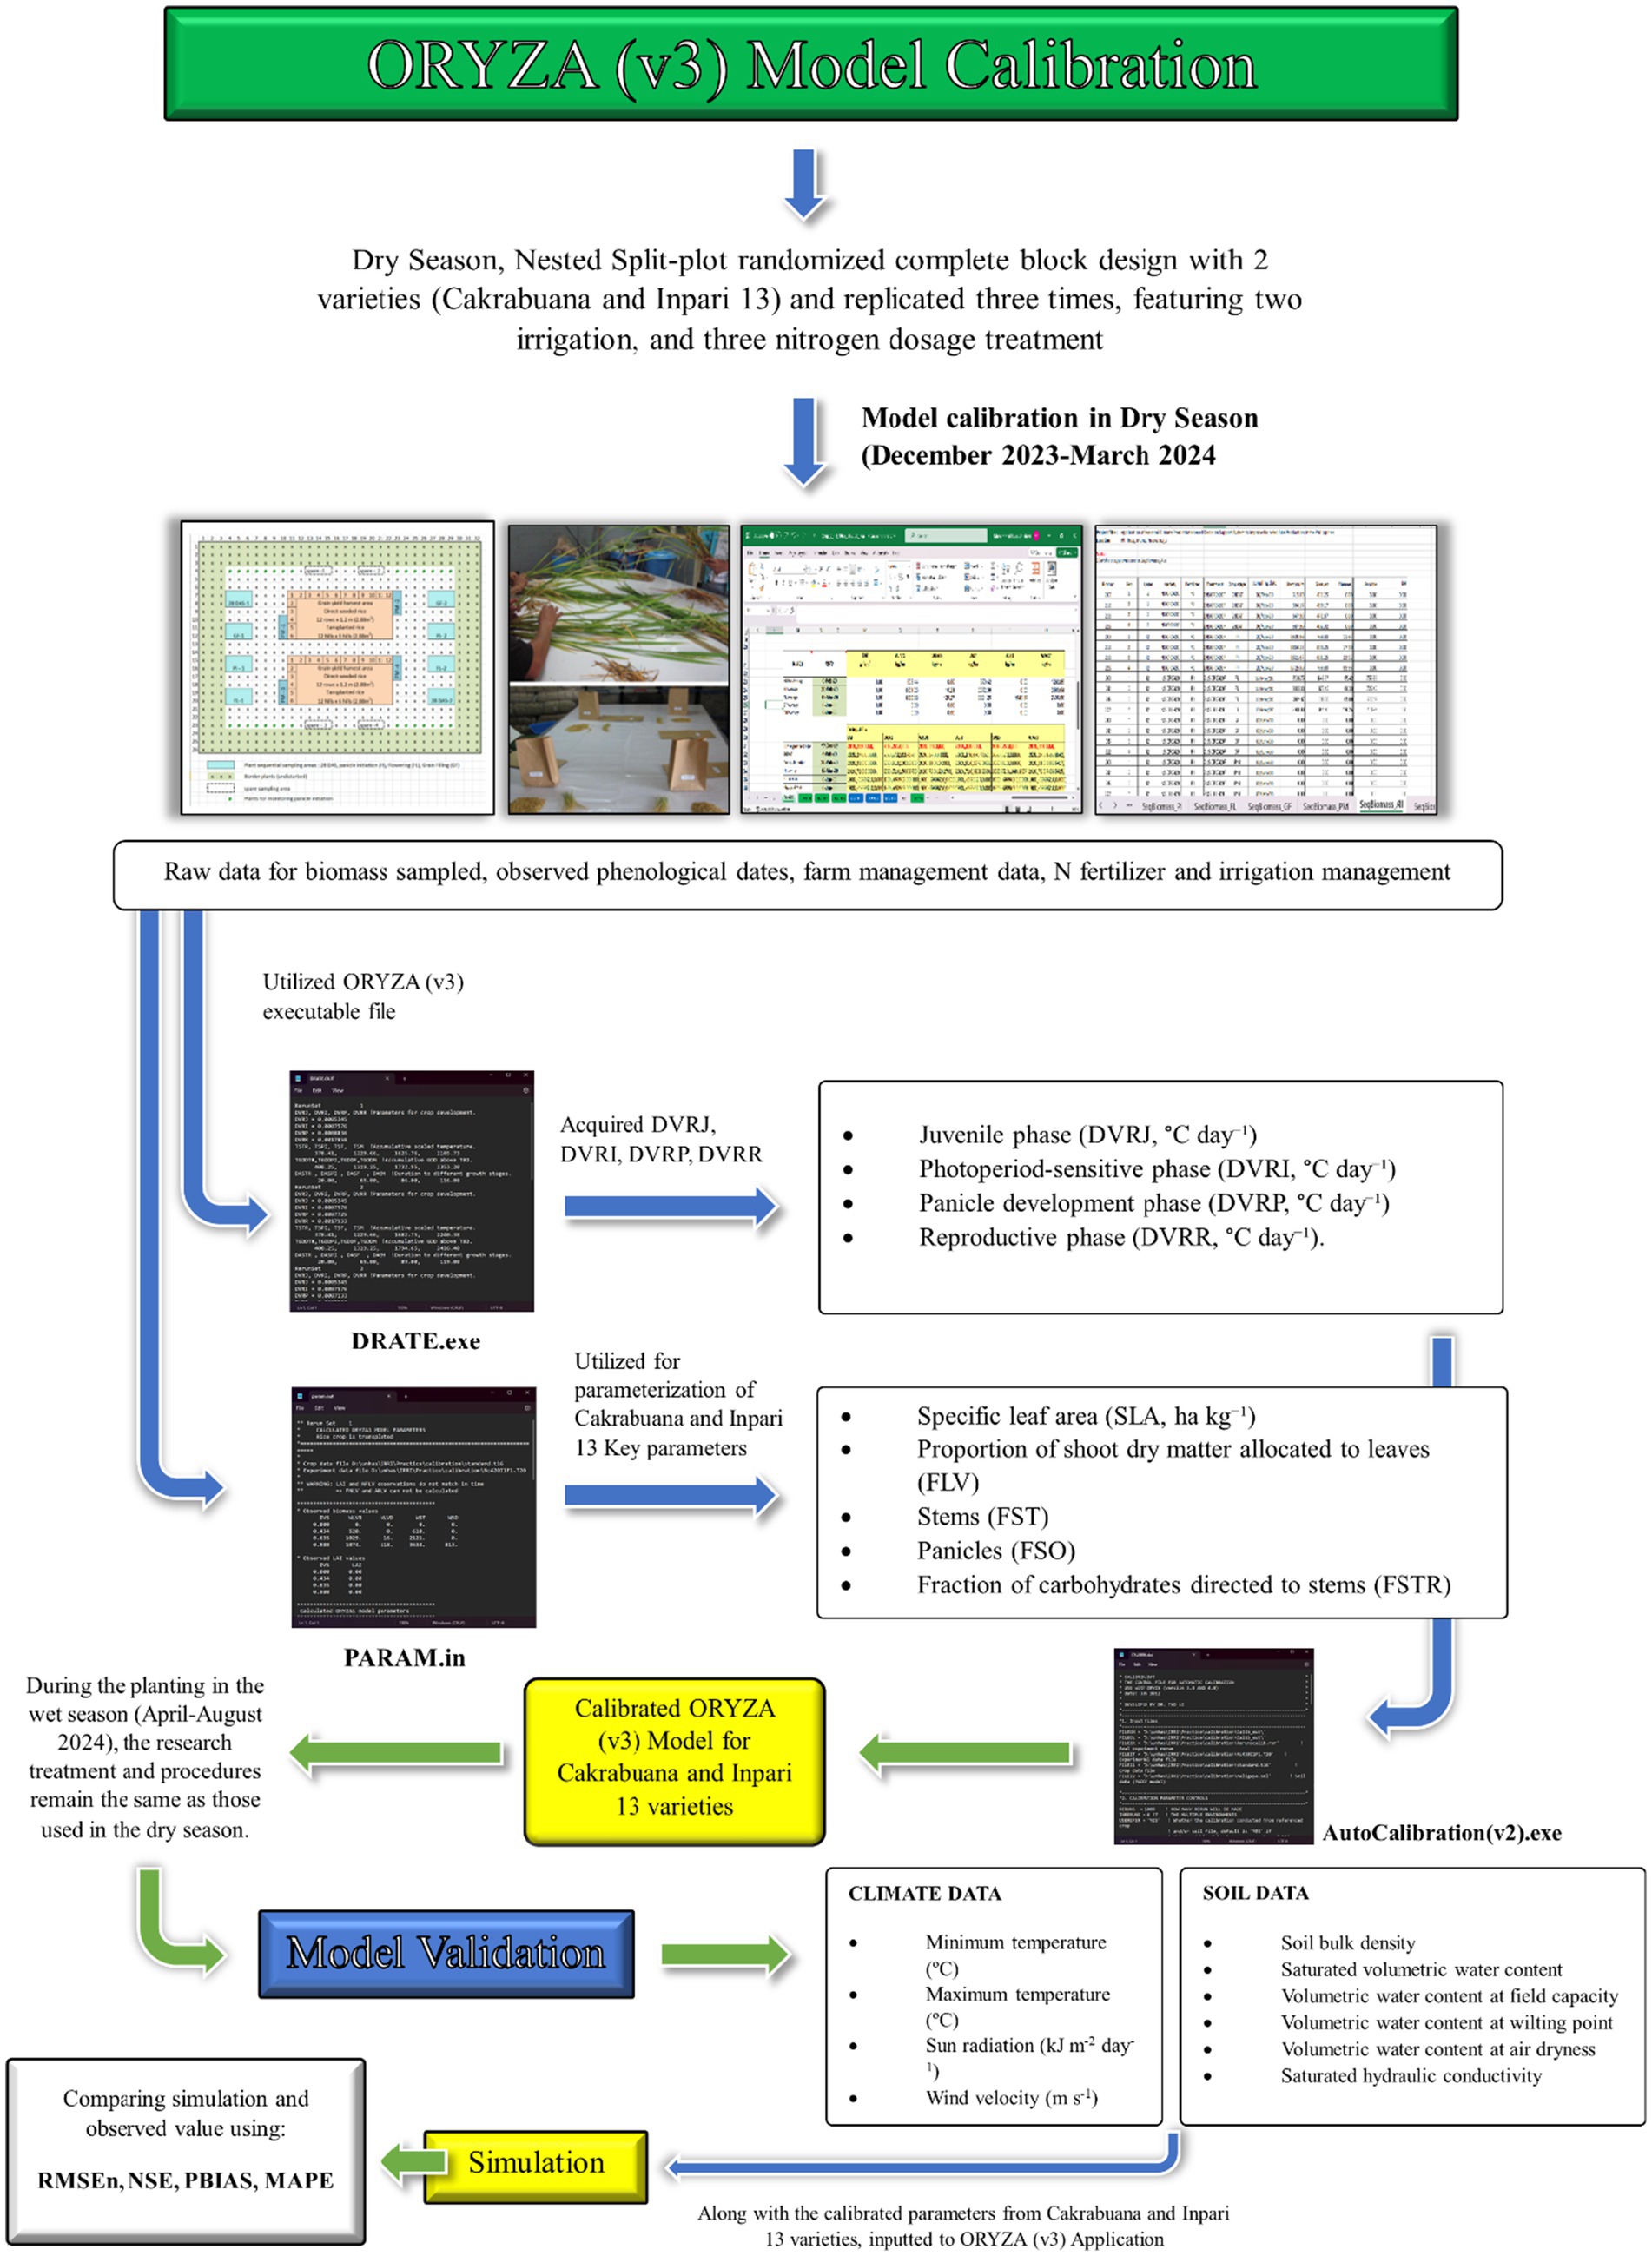
Figure 2. Calibration and validation scheme of ORYZA (v3) model for Cakrabuana and Inpari 13.
2.4 Observation parameters and data analysis
Observations to analyze the phenological phases of rice were conducted by monitoring key stages: 17 DAT, panicle initiation, flowering, grain filling, and physiological maturity. Dates for these phases were recorded for the ORYZA model. Biomass samples were collected at the same stages by cutting the rice stems with a sickle and grouping them by treatment. The biomass was divided into dead leaves, green leaves, stems, and panicles, each representing different physiological roles essential for plant productivity (Yoshida, 1981). Samples were dried at 70°C for 3 days. Drying at this temperature and duration removes moisture content from the samples without causing thermal degradation of plant tissues, proteins, or other organic compounds, ensuring accurate dry weight measurements (Houghton et al., 2009; Peng et al., 2004).
Validation involves assessing how accurately the calibrated model predicts actual field data collected from Maradekayya Village in the Bajeng District of Gowa Regency, South Sulawesi. This assessment compared the observed data with the simulations generated using ORYZA (v3). When the simulated results closely align with the observed data, it typically indicates that the model or simulation is accurate and reliable in representing real-world behavior. The observed and simulated data undergo evaluation using several metrics, including Root Mean Square Error normalized (RMSEn) (Meus et al., 2022), Nash-Sutcliffe Efficiency (NSE) (Suliansyah et al., 2023), Percent Bias (PBIAS) (Musyoka et al., 2021), and Mean Absolute Percentage Error (MAPE) (Li et al., 2020). Each of these metrics provides insights into the model’s accuracy and performance, allowing for a comprehensive evaluation of its predictive capabilities. The relevant equations are as follows:
The symbol n within the equation represents the number of samples in the dataset. The variable yᵢ denotes the observed values, while ŷt refers to the simulated values generated by the model. Additionally, X̅ signifies the mean (average) of the observed values. According to Moriasi et al. (2007), model performance can be categorized in several ways. For the RMSEn, a value of 0 indicates perfect prediction. Values below 0.2 are considered very good, while those ranging from 0.2 to 0.5 are deemed fair. Values exceeding 0.5 are classified as poor. In terms NSE, a score of 1 represents perfect prediction. Scores above 0.75 are categorized as excellent, and scores between 0.5 and 0.75 are considered fair. Any score below 0.5 is viewed as poor. For PBIAS, a value of 0 signifies no bias. Values within ±10% are rated as excellent, those between ±10 and ±25% are considered fair, and values exceeding ±25% indicate significant bias. While for MAPE, values under 10% indicates excellent, 10–20% are fair, 20–50% less poor and more than 50% are considered poor (Tayman and Swanson, 1999).
3 Results
3.1 Performance of the ORYZA (v3) model on Cakrabuana and Inpari 13
The analysis presents boxplots for RMSEn, NSE, PBias, and MAPE values across different biomass components for two rice varieties, Cakrabuana and Inpari 13 (Figures 3–6). The RMSEn values show more significant variability in the Cakrabuana variety, particularly for WSO, WLVD, WST, and WAGT, while Inpari 13 exhibits lower variability, especially in WLVG. NSE values indicate better performance for Inpari 13 across most components, whereas Cakrabuana has a broader data range for LAI and WSO. The PBias results reveal that Cakrabuana tends to overestimate values, particularly in WST, WAGT, and WSO, while Inpari 13 generally underestimates all components. MAPE values are excellent for both varieties, except for the WSO in Cakrabuana, which shows a similar trend for Inpari 13 with good variability across its components.
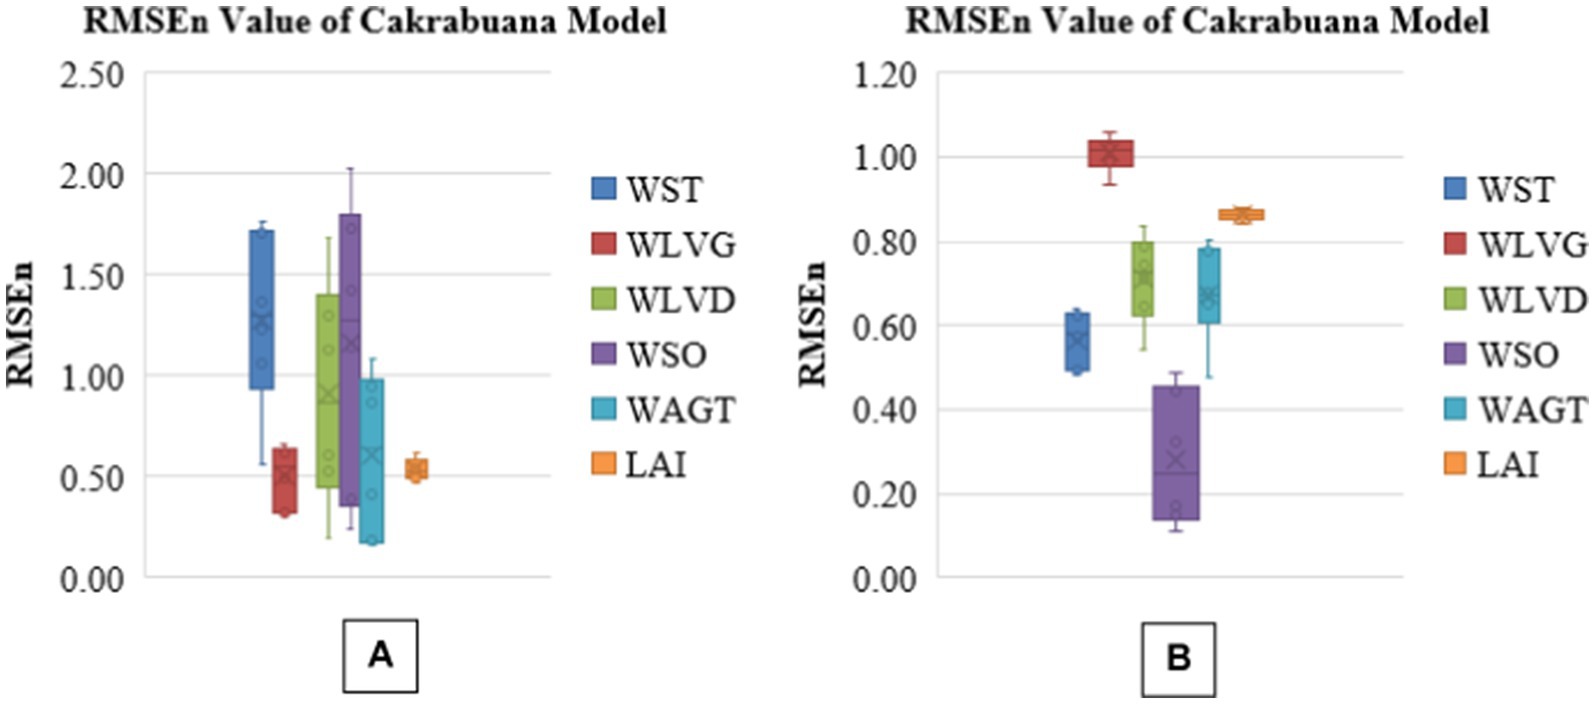
Figure 3. Box plot of RMSEn values for model validation of Cakrabuana (A) and Inpari 13 (B) varieties.
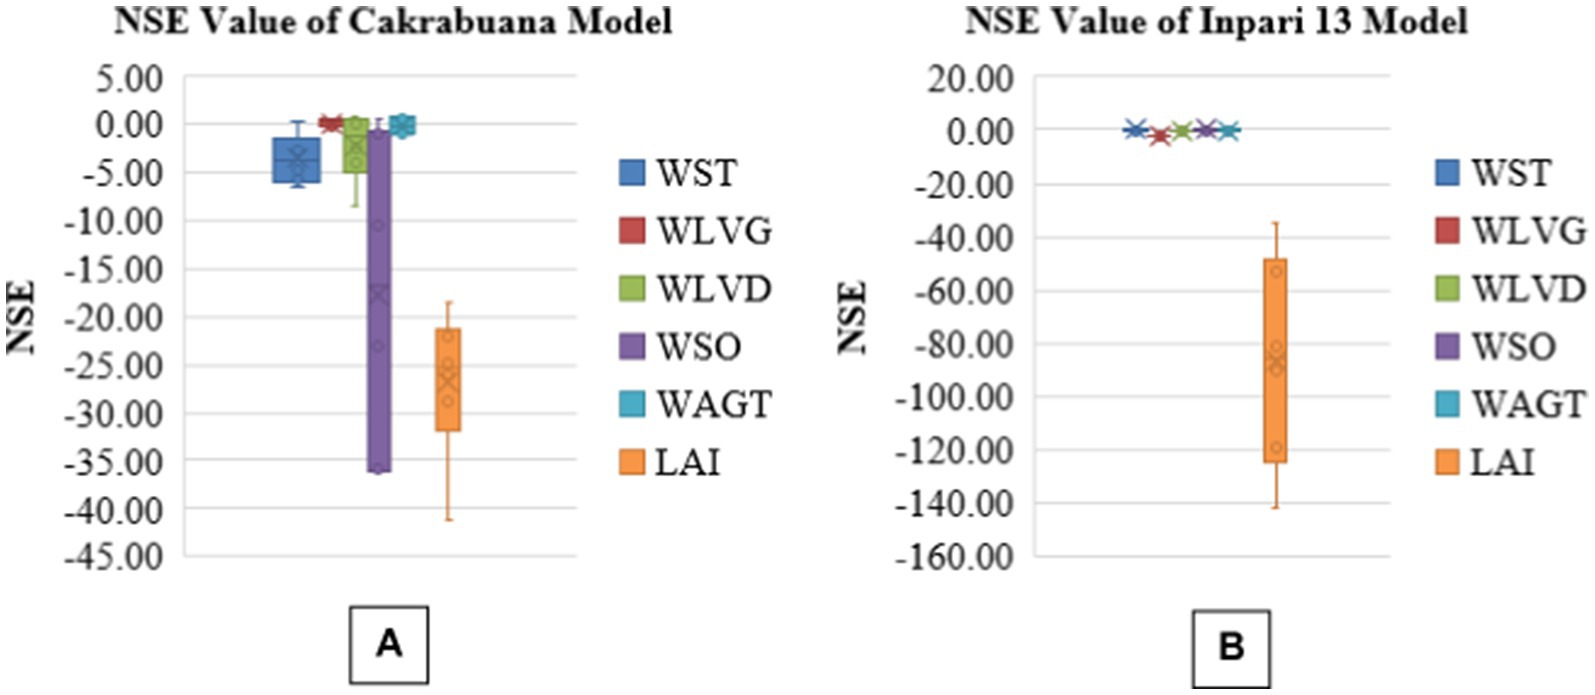
Figure 4. Box plot of NSE values for model validation of Cakrabuana (A) and Inpari 13 (B) varieties.
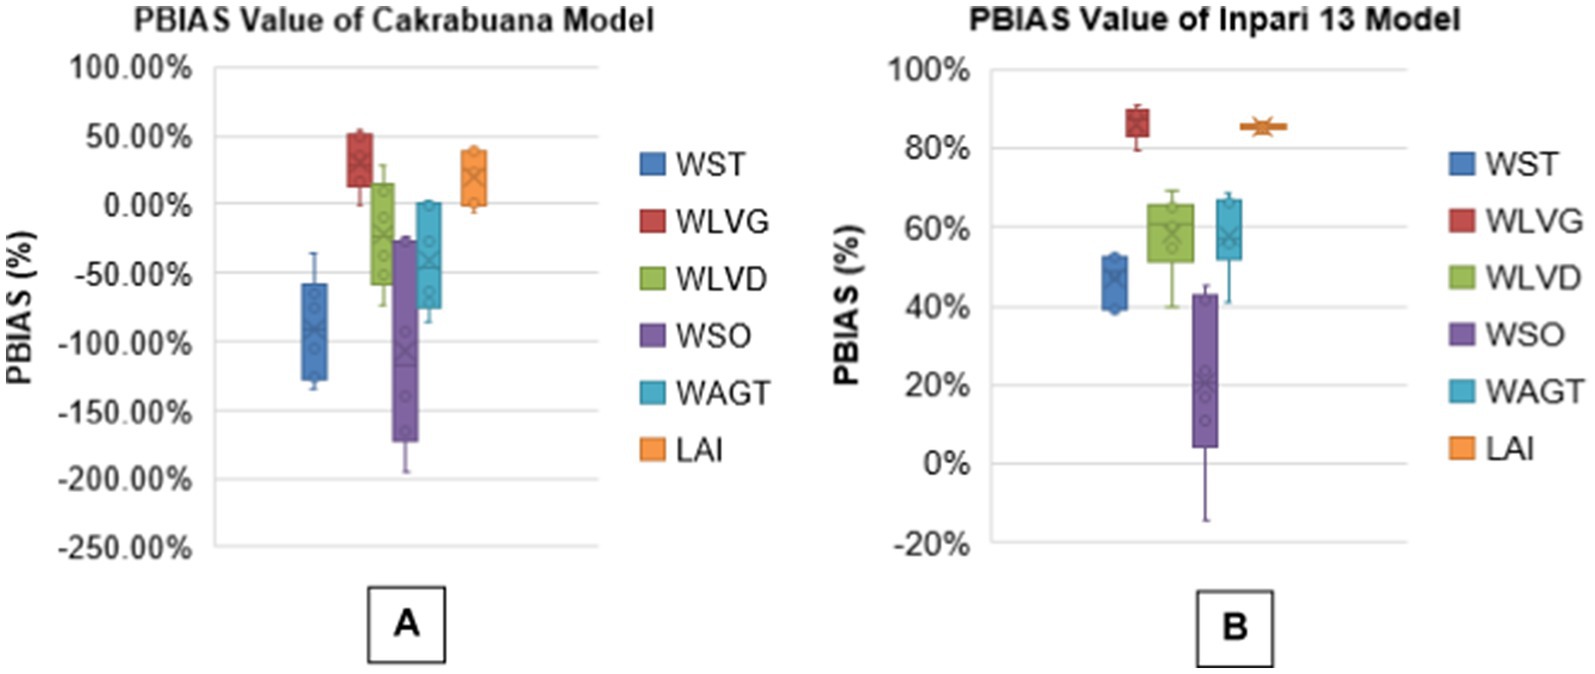
Figure 5. Box plot of PBIAS values for model validation of Cakrabuana (A) and Inpari 13 (B) varieties.
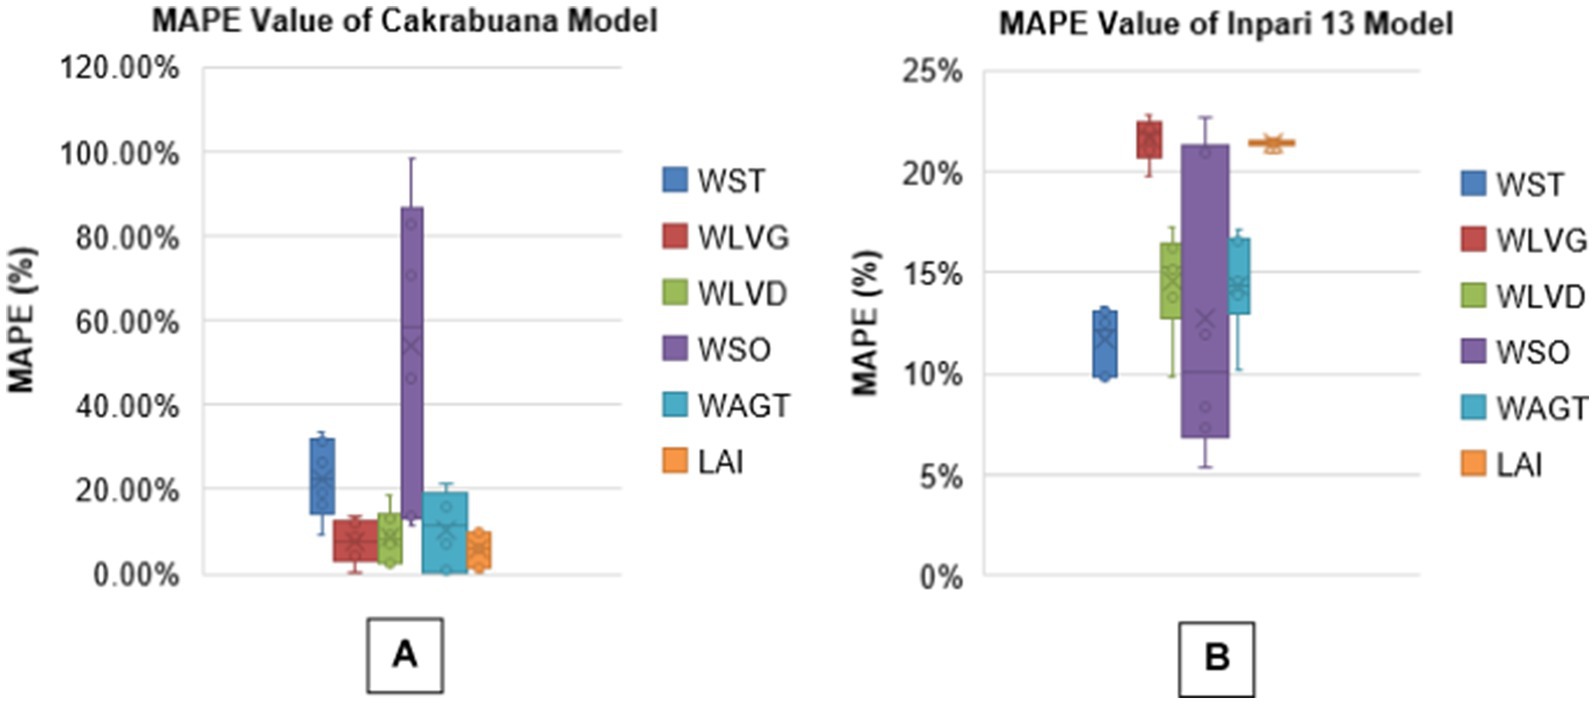
Figure 6. Box plot of MAPE values for model validation of Cakrabuana (A) and Inpari 13 (B) varieties.
The trend for the physiological traits across the different treatments and varieties generally indicates variability in validation results, reflecting differing performance levels. In the WST component (Table 1), the NSE values highlight treatment n1i1 with the Inpari 13 variety as favorably validated. In contrast, the Cakrabuana variety’s treatment n2i0 stands out in the MAPE test despite poor validation in RMSEn and PBias. Moving to the WLVG component (Table 2), treatment n0i1 with the Cakrabuana variety demonstrated excellent performance metrics, indicating strong validation across PBIAS and MAPE. The WLVD component (Table 3) showed consistently satisfactory results for treatment n0i0, suggesting reliable performance with low RMSEn and high NSE values. The WSO component’s (Table 4) results were powerful for treatment n0i1 with Inpari 13, indicating effective performance across all statistical measures. Conversely, the weight of the ground total biomass component (Table 5) demonstrated satisfactory results for treatment n1i0, reflecting reliable validation. In contrast, the LAI component (Table 6) revealed acceptable performance for treatment n1i1 with Cakrabuana, particularly in PBias and MAPE metrics. Overall, while some treatments excelled in specific traits, others showed a need for improvement, highlighting the variability and complexity in the physiological responses of the different varieties and treatments.
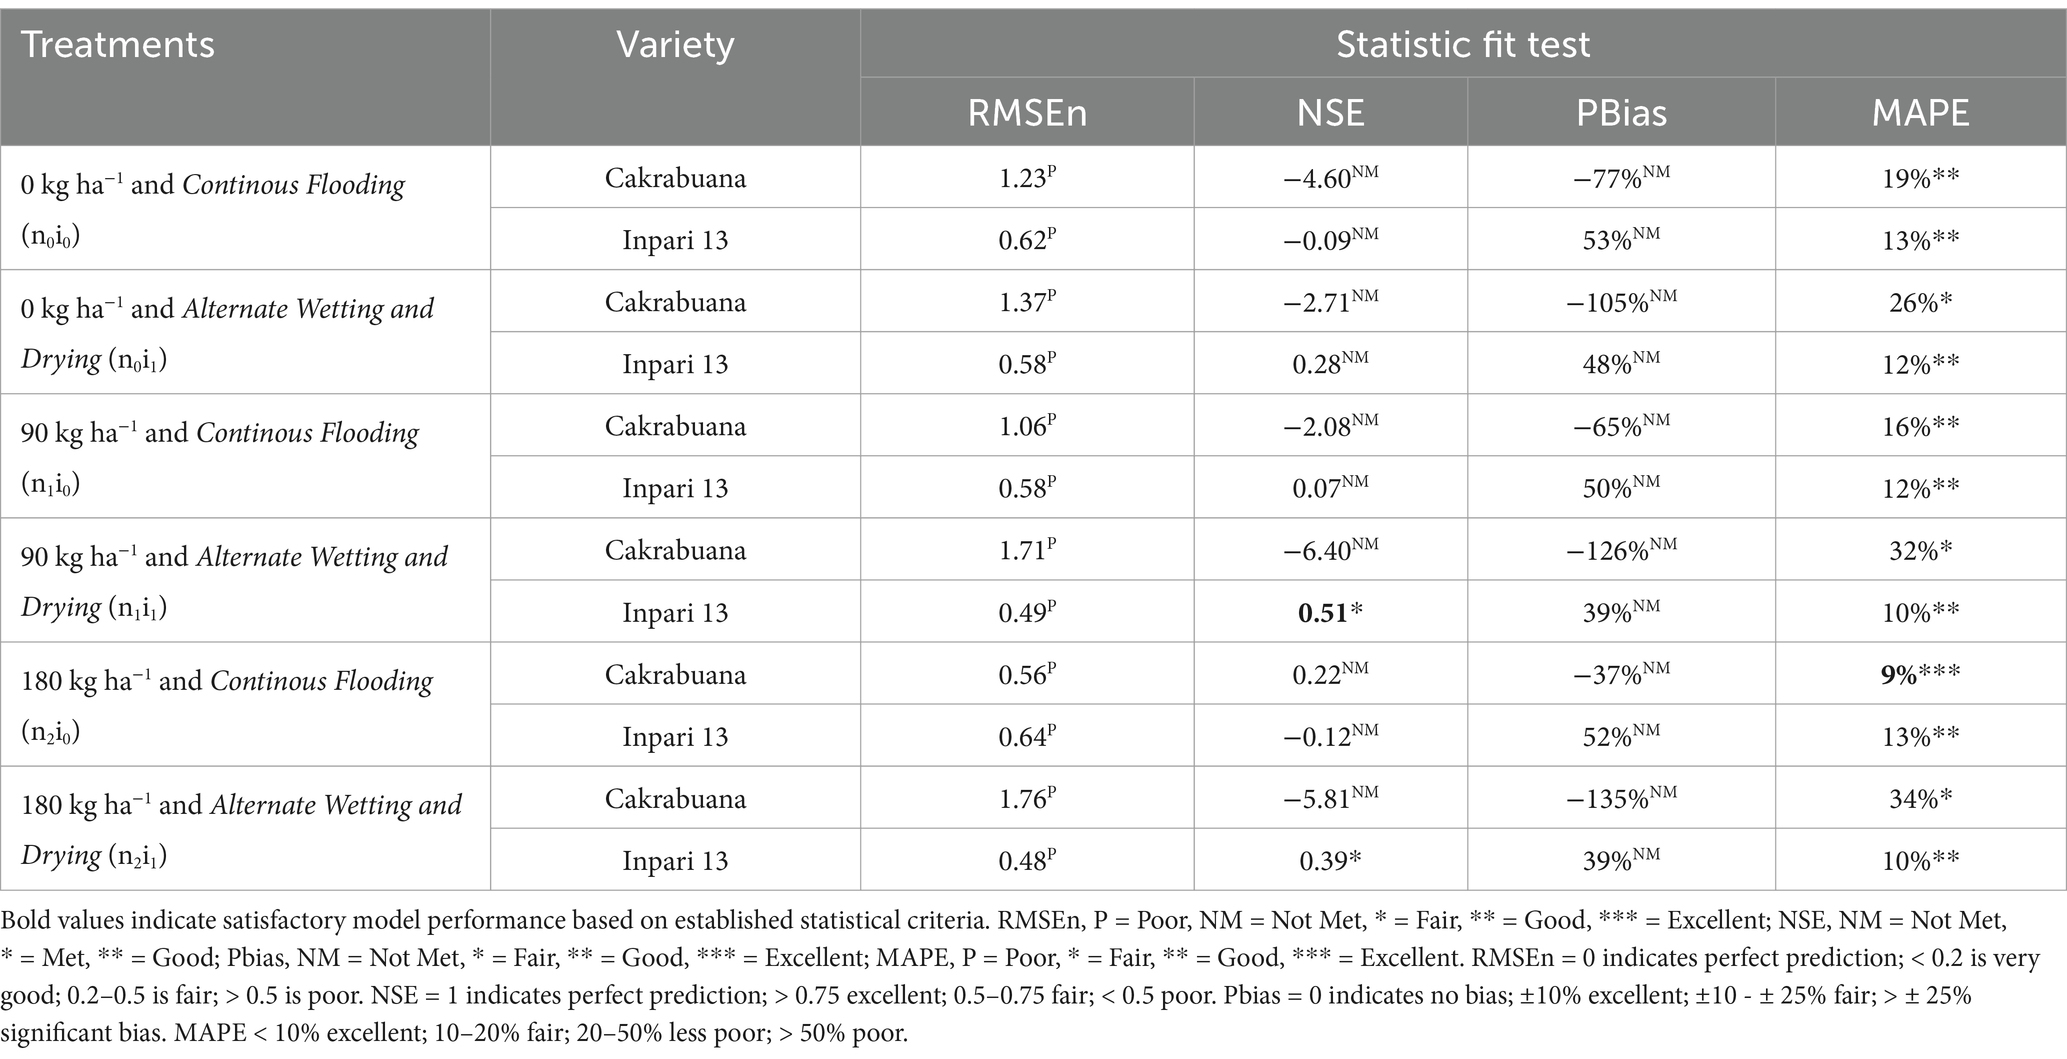
Table 1. Indicators of relative fit tests for model validation of the weight of stem total (WST) component in Cakrabuana and Inpari 13 varieties.
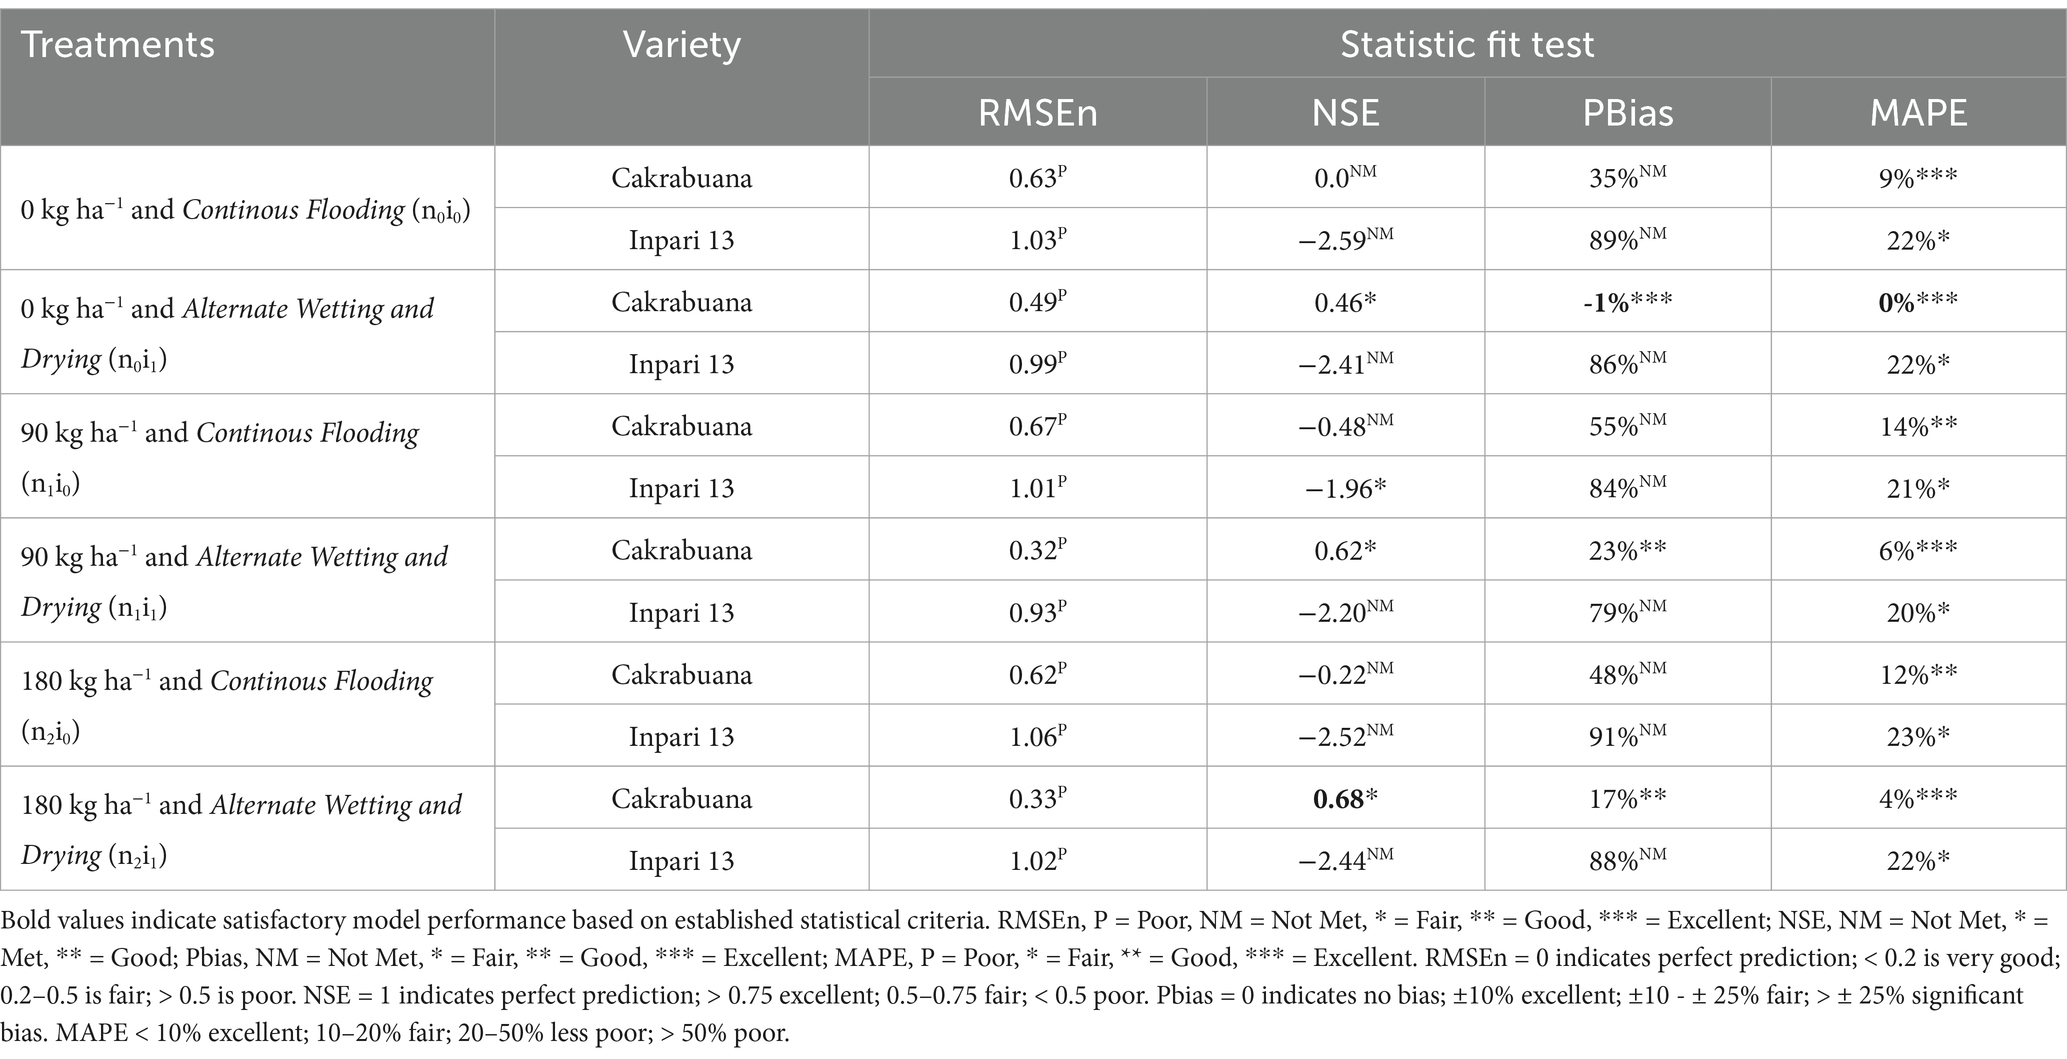
Table 2. Indicators of relative fit tests for model validation of the weight of green leaves (WLVG) component in Cakrabuana and Inpari 13 varieties.
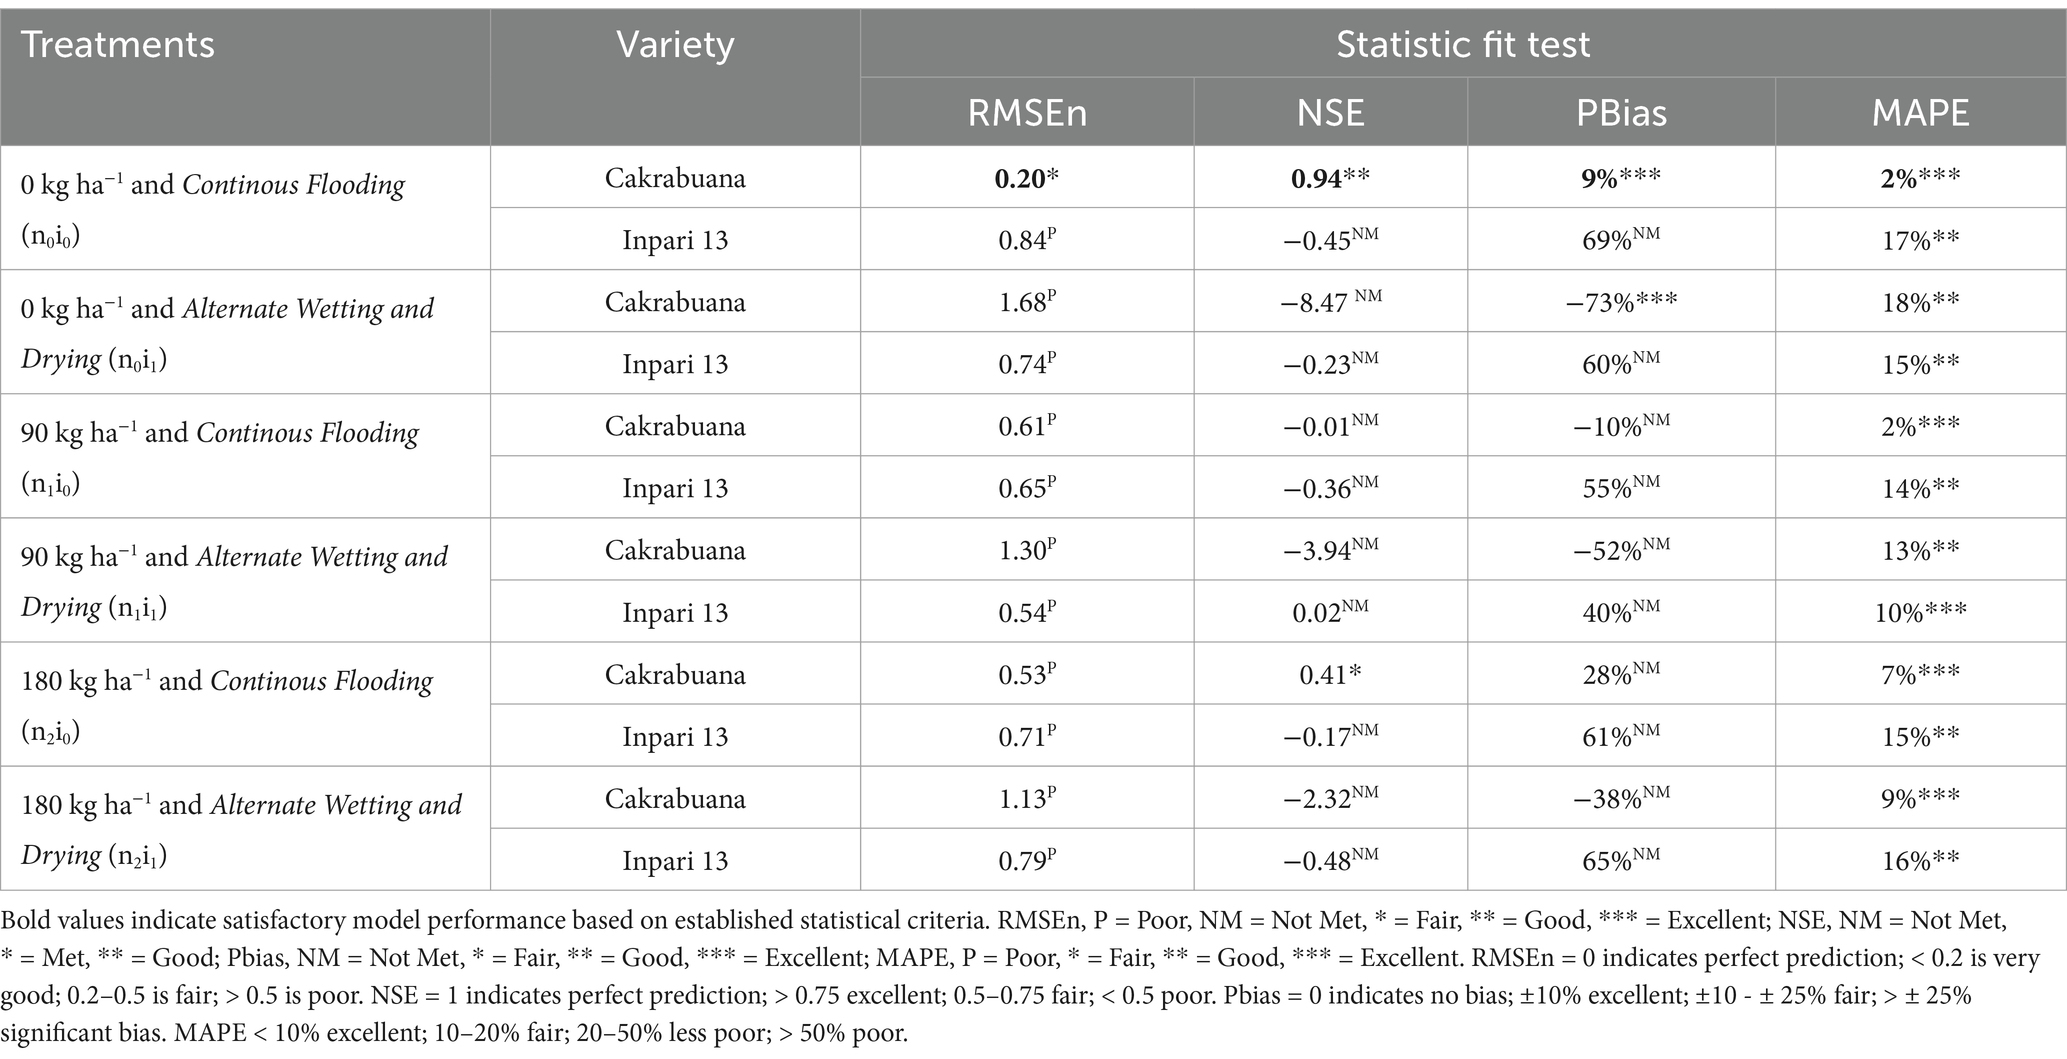
Table 3. Indicators of relative fit tests for model validation of the weight of dead leaves (WLVD) component in Cakrabuana and Inpari 13 varieties.
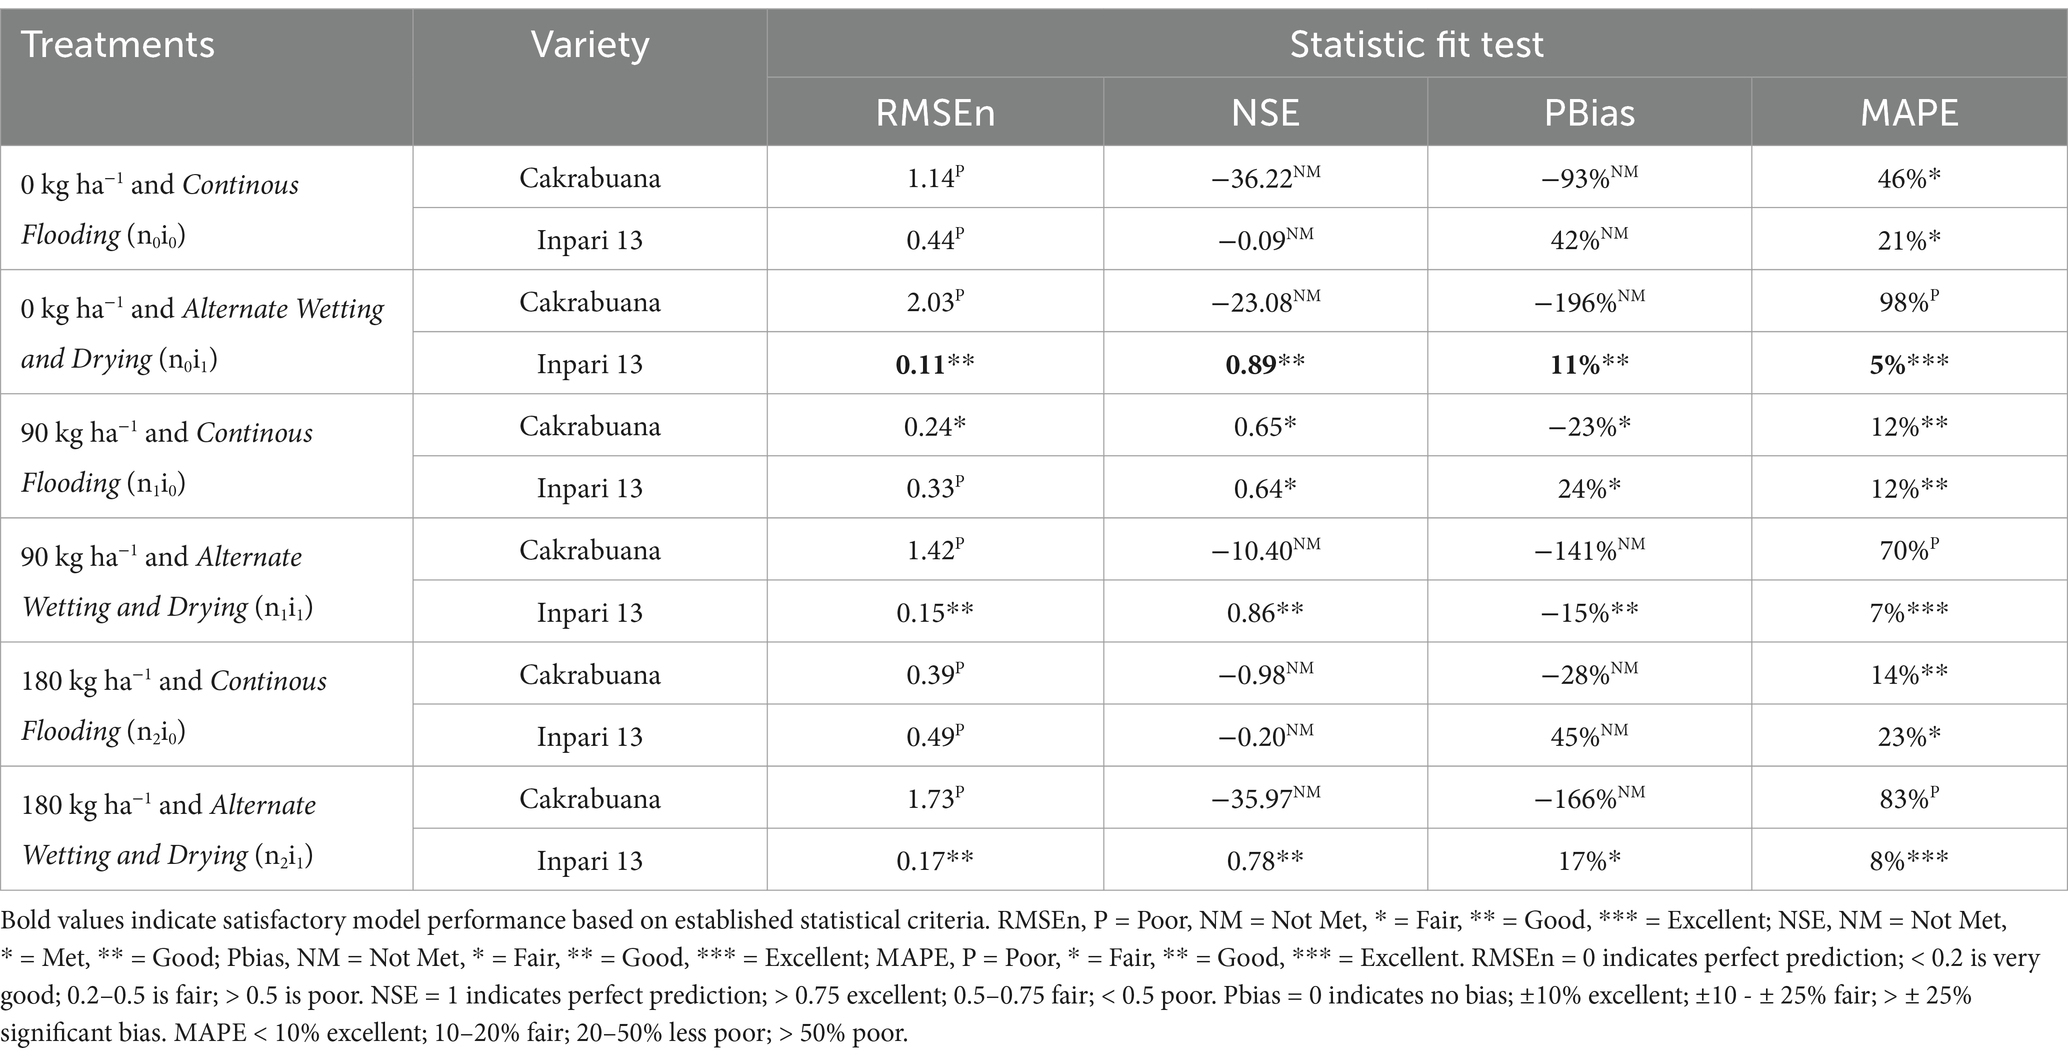
Table 4. Indicators of relative fit tests for model validation of the weight of storage organ (WSO) component in Cakrabuana and Inpari 13 varieties.
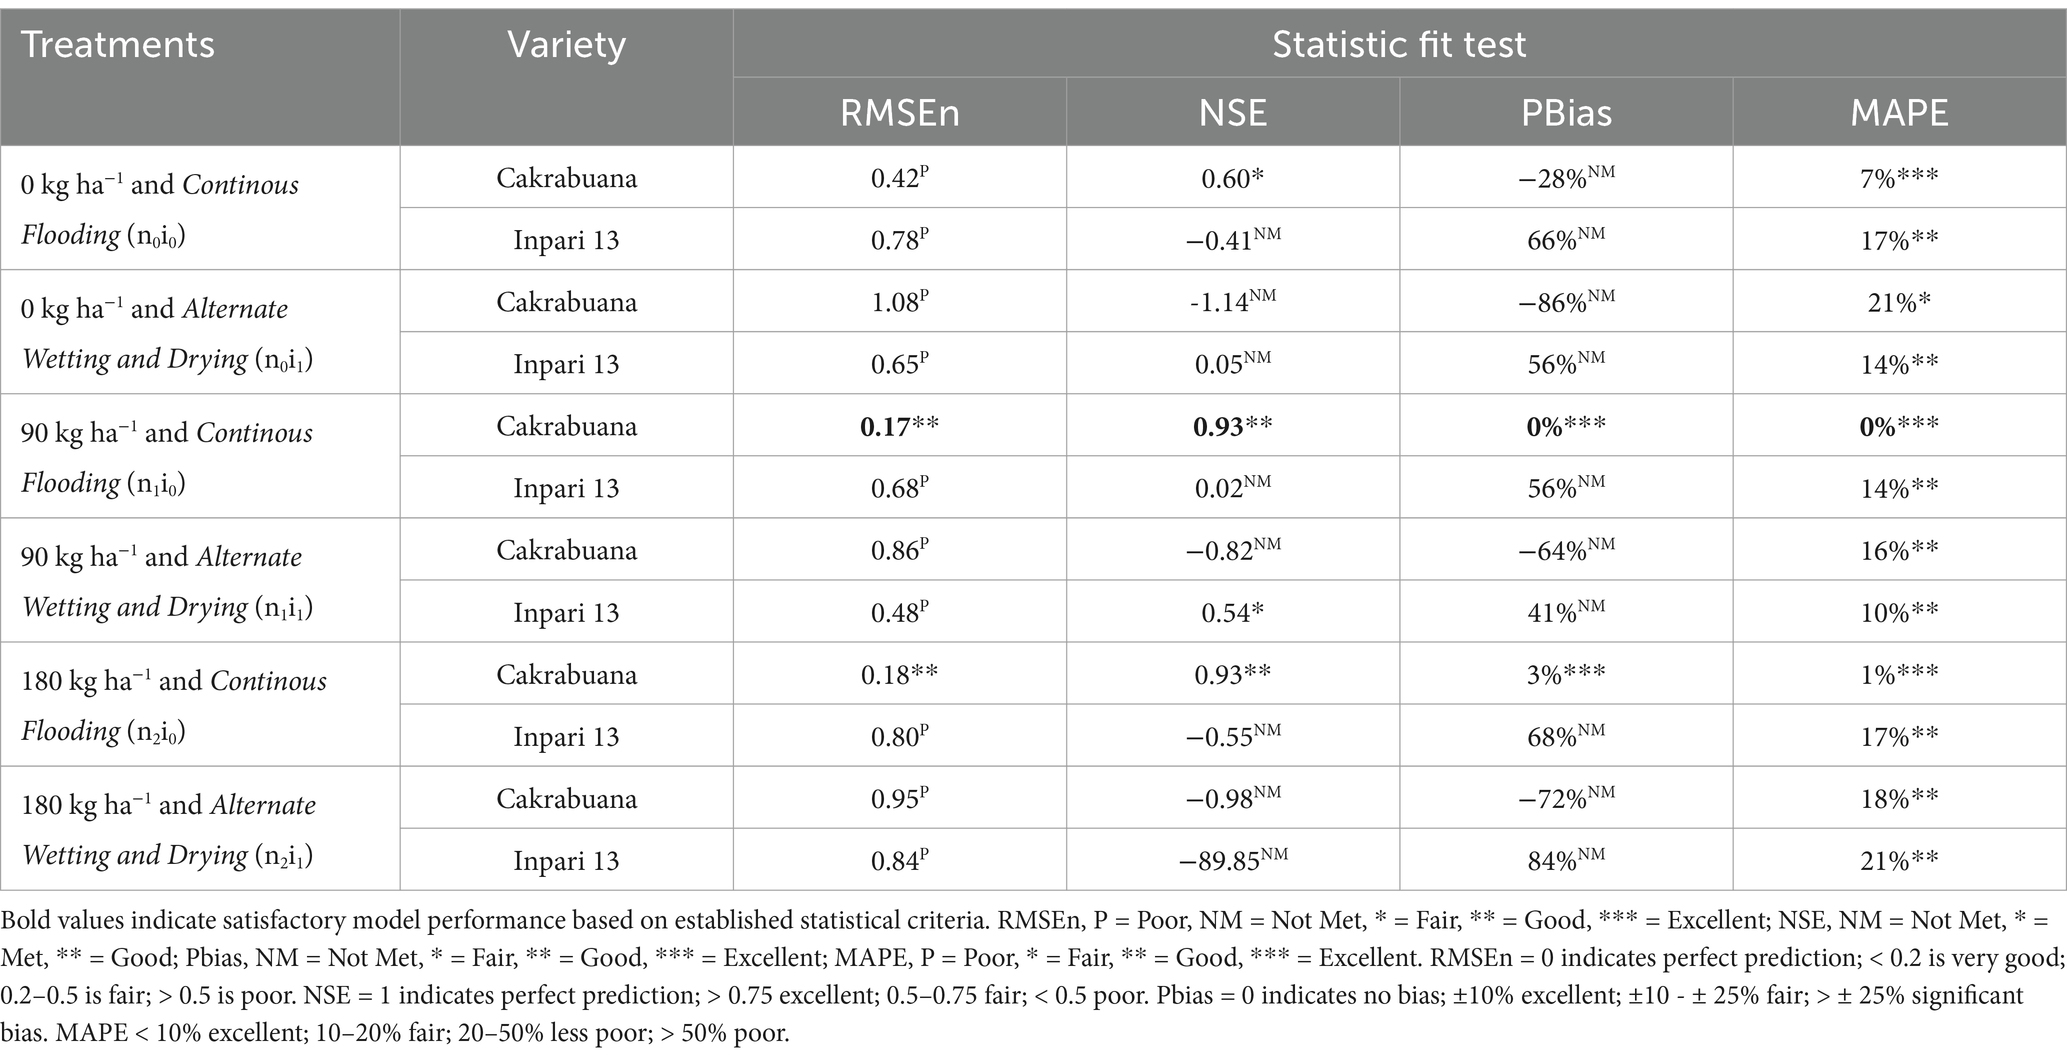
Table 5. Indicators of relative fit tests for model validation of the weight above ground total biomass (WAGT) component in Cakrabuana and Inpari 13 varieties.
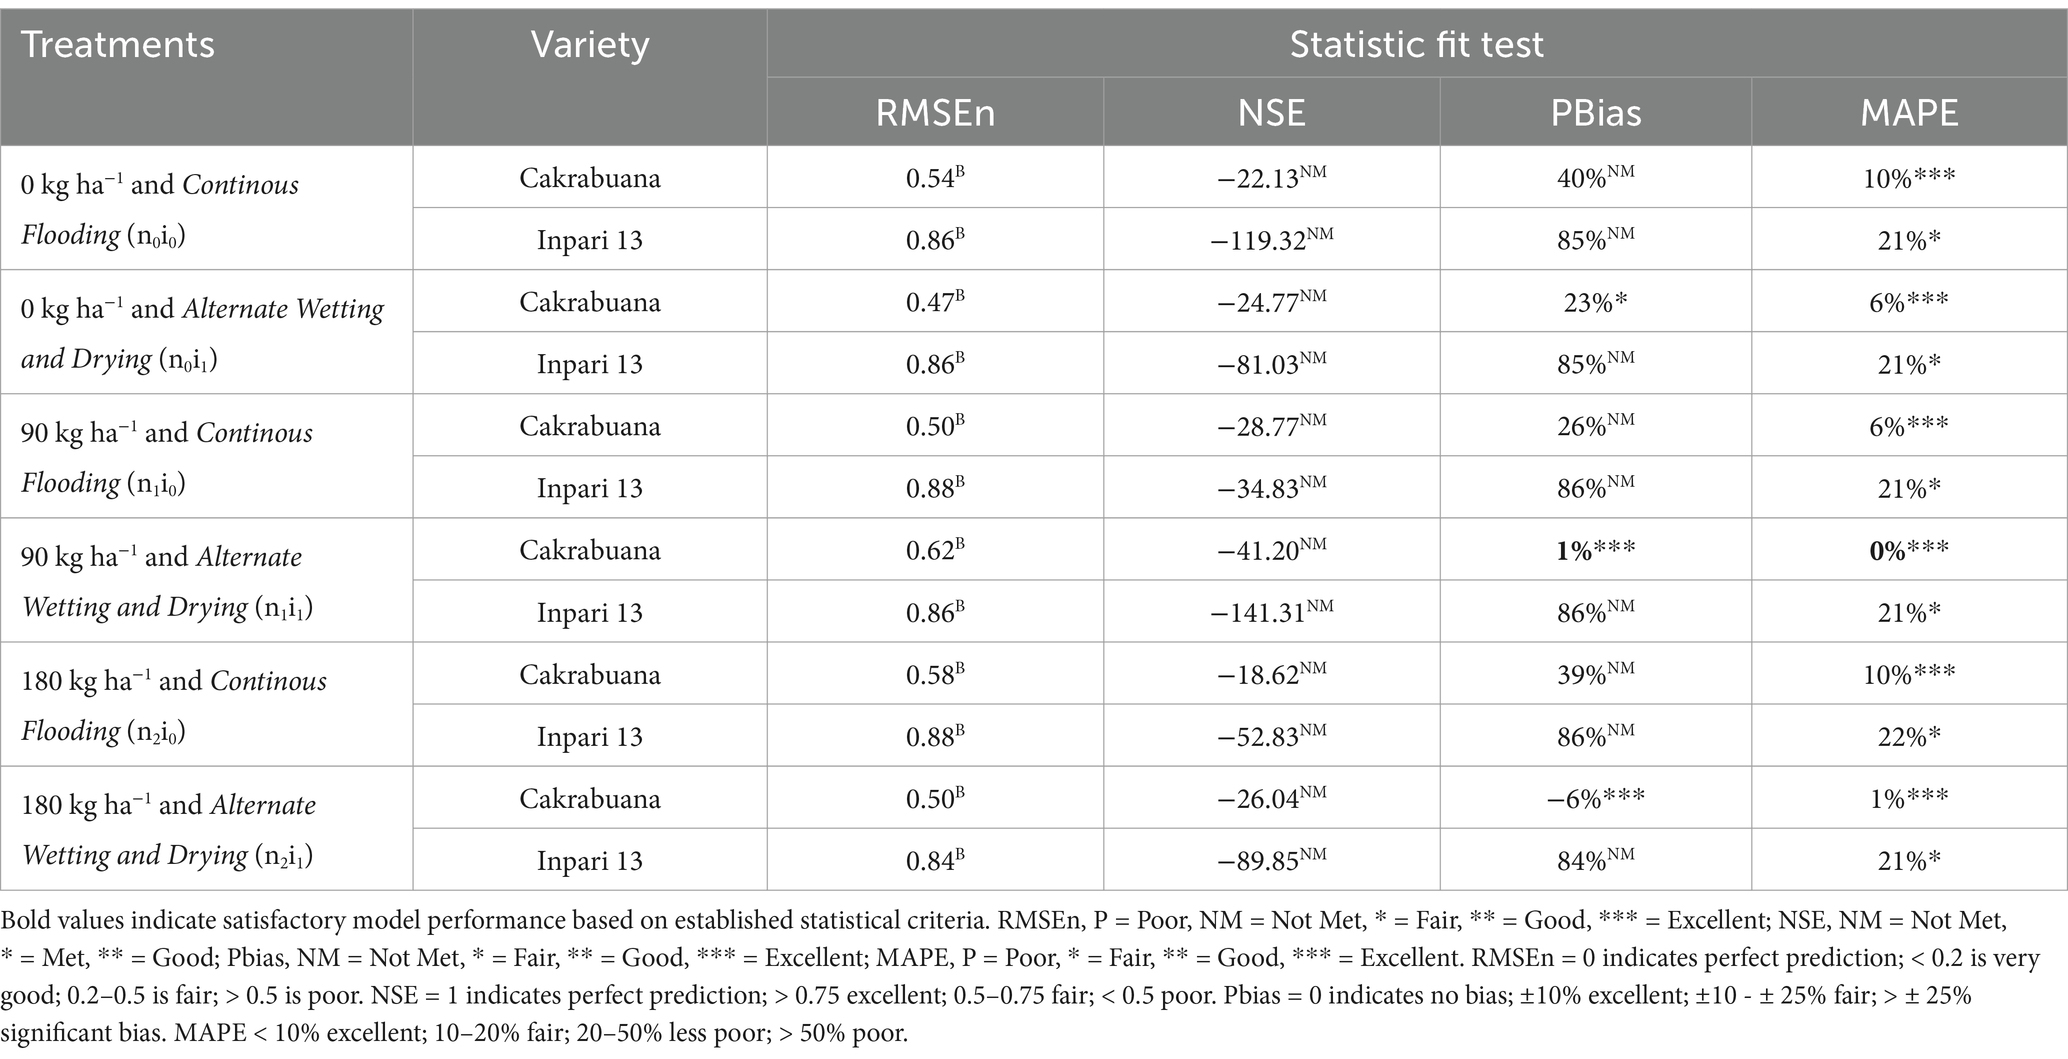
Table 6. Indicators of relative fit tests for model validation of the Leaf Area Index (LAI) component in Cakrabuana and Inpari 13 varieties.
The model validation results for the Cakrabuana and Inpari 13 varieties have been analyzed. For the Cakrabuana variety under the Controlled Flood (CF) irrigation treatment (i0), there was a strong agreement between the observed and simulated values for most biomass components as shown in Figures 7, 8. However, under the Alternate Wetting and Drying (AWD) irrigation treatment (i1), significant discrepancies were observed between the actual and simulated values for particular wet component (WSO) measures. In the case of the Inpari 13 variety, the validation results for both CF (i0) and AWD (i1) treatments demonstrated a good fit for the WSO component. Nevertheless, significant differences were noted in the other components such as WST, WLVG, WLVD, and Wet WAGT under the AWD irrigation (i1) treatment, indicating substantial fluctuations in the values. Additionally, the Leaf Area Index (LAI) from the model validation results tends to either underestimate or overestimate the observed values. Conversely, for all treatments of the Inpari 13 variety, the estimated values consistently fall below the observed LAI values, exhibiting a different trend than the Cakrabuana variety.
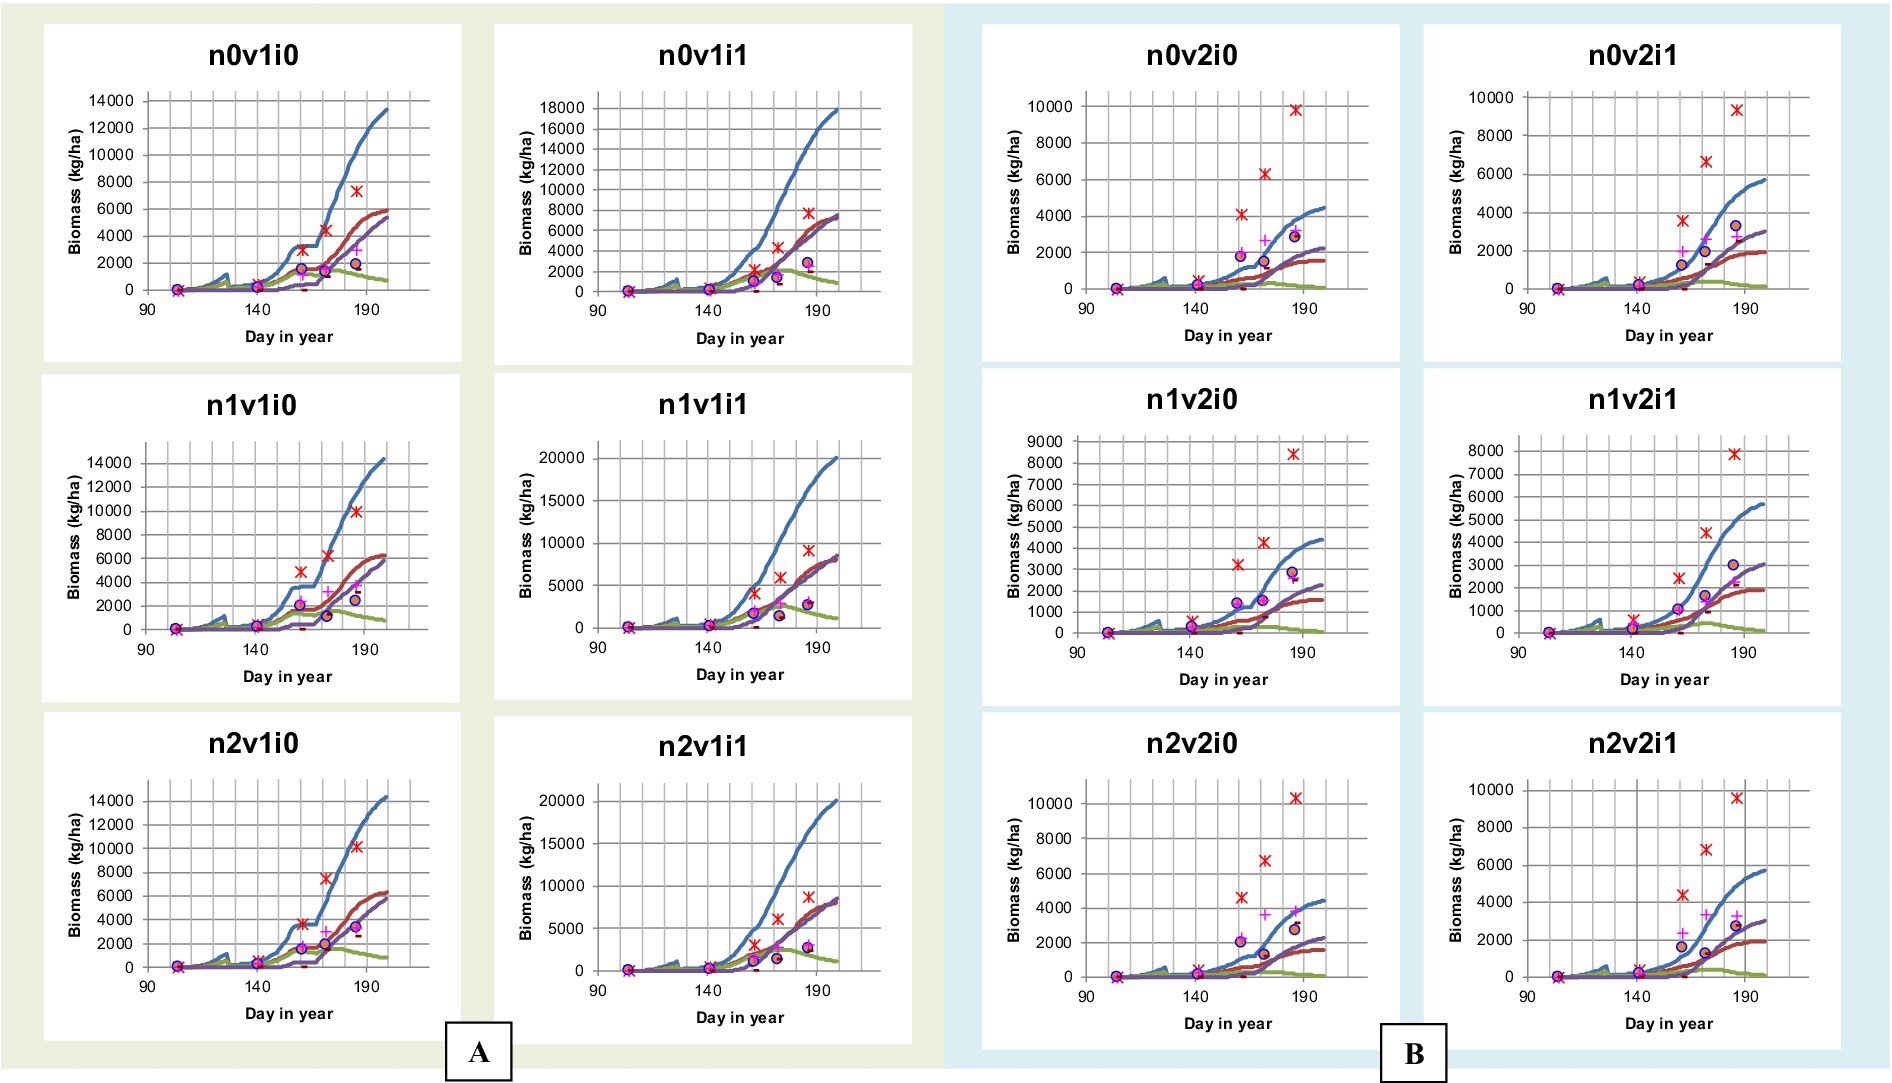
Figure 7. Comparison graph of simulation and observation results of biomass (kg ha−1) of Cakrabuana (A) and Inpari 13 (B) Varieties at different doses of nitrogen fertilizer and irrigation.
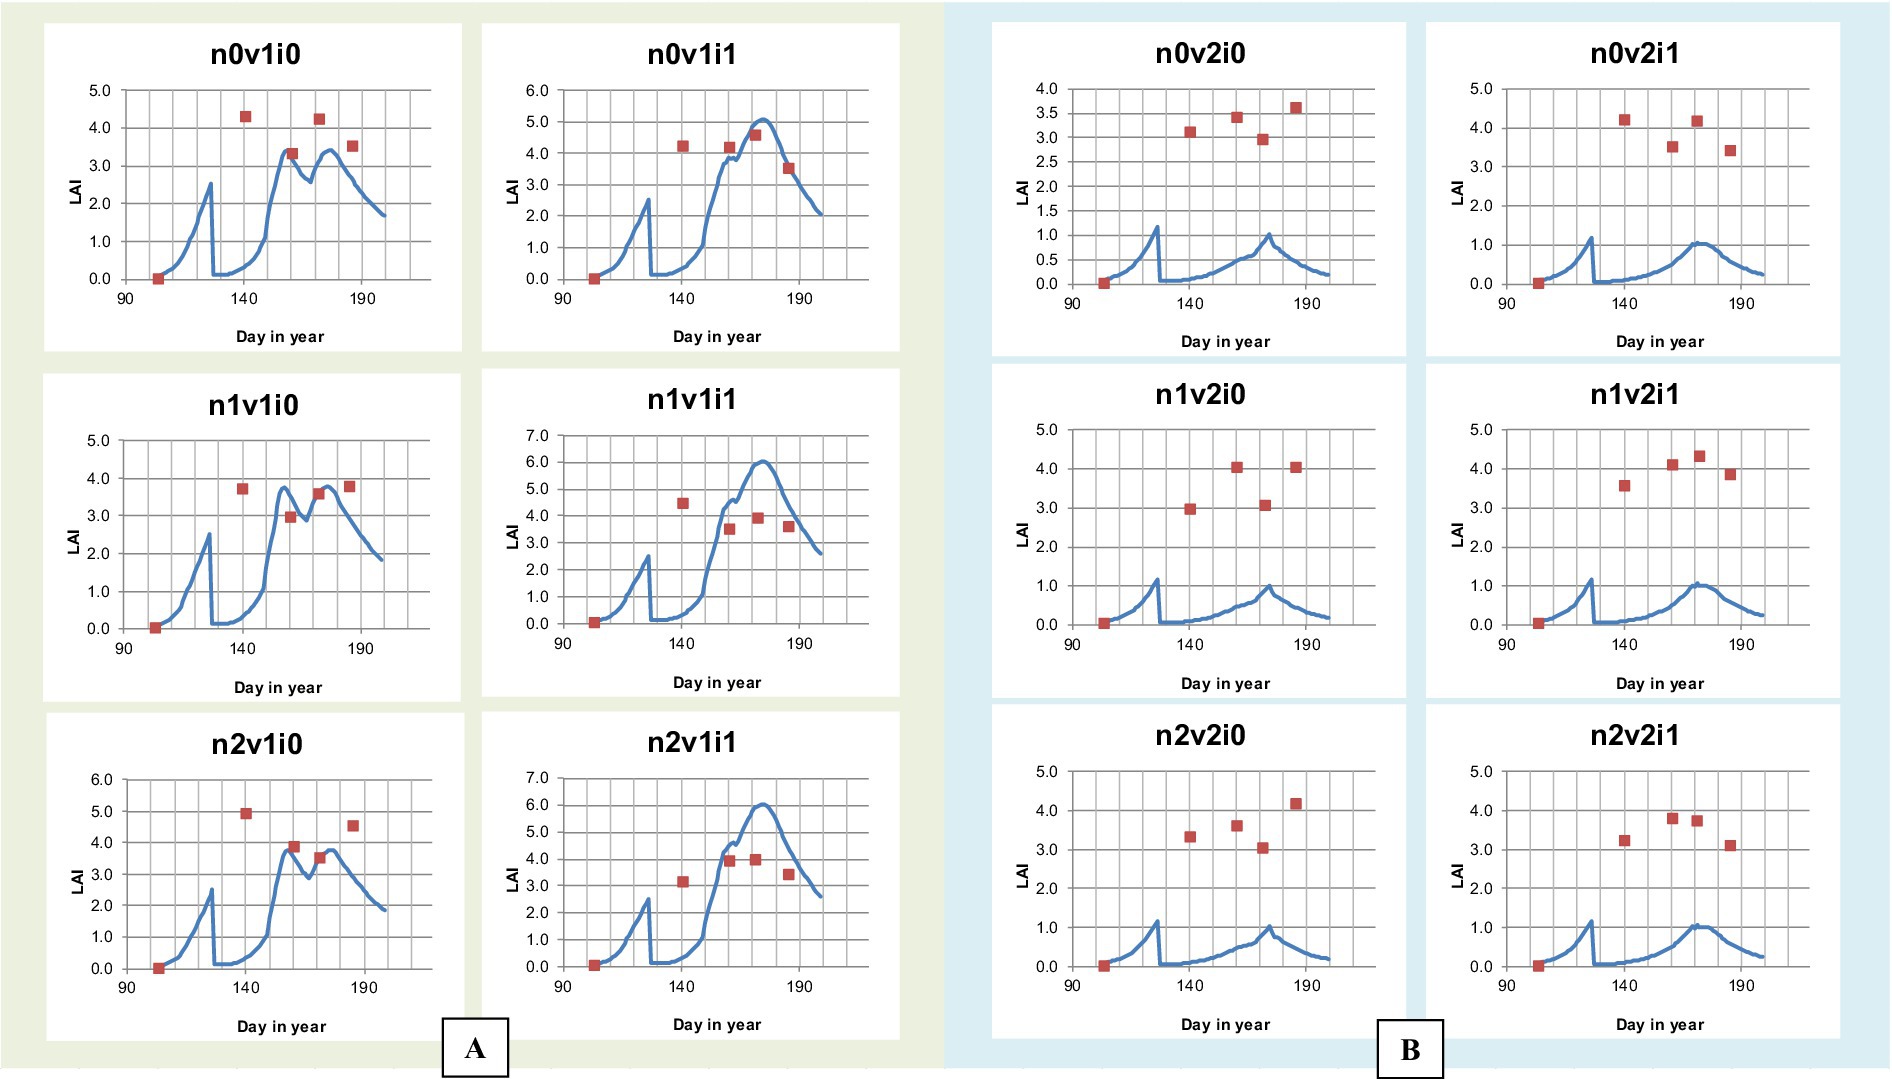
Figure 8. Comparison graph of simulation and observation results of leaf area index (LAI) of Cakrabuana (A) and Inpari 13 (B) Varieties at different doses of nitrogen fertilizer and irrigation.
3.2 Effects of irrigation and nitrogen on model accuracy
The model validation results for the Cakrabuana and Inpari 13 rice varieties reveal distinct performance under different irrigation treatments. For Cakrabuana under CF, there is a strong correlation between observed and simulated biomass values. However, under AWD, discrepancies in the WSO were significant across fertilizer treatments. Inpari 13 showed a good fit for WSO under CF and AWD but exhibited notable differences in stem weight, vegetative leaf weight, and grain weight under AWD compared to simulated values. Additionally, the LAI from the model often underestimated or overestimated actual observations, with Inpari 13 consistently showing lower LAI values than observed, contrasting with Cakrabuana’s trend.
Figure 7 illustrate the biomass simulation results across various nitrogen levels (0 kg.ha−1, 90 kg.ha−1, and 180 kg.ha−1), highlighting how growth responses are influenced by nitrogen availability, irrigation, and variety treatments. At 0 kg.ha−1, the model shows consistently low biomass accumulation across all varieties and irrigation methods, indicating that nitrogen is a critical limiting factor during early and peak growth stages. The gap between simulated and observed biomass is most pronounced in these treatments, revealing underperformance due to nutrient limitations. With 90 kg.ha−1, biomass production improves significantly, and simulated values align more closely with observations, particularly under Alternate Wetting and Drying (AWD) irrigation. This level is better suited for mid-season growth, especially for the Cakrabuana variety, although some peak value deviations occur. At 180 kg.ha-1, the model captures the strongest correlation between simulated and observed biomass, particularly late in the season under AWD irrigation, reflecting the benefits of high nitrogen and effective irrigation. However, for the Inpari 13 variety, the model slightly underestimates late-season growth, suggesting sensitivity to variety-specific traits.
The model validation results for Leaf Area Index (LAI) across different nitrogen levels highlight distinct patterns in canopy development under various treatments. In the 0 kg.ha−1 treatments, the model consistently underestimates LAI, particularly under continuous flooding, indicating sensitivity to nitrogen stress that limits leaf expansion. For the 90 kg.ha−1 treatments, agreement between observed and simulated values improves, especially in AWD irrigation, where the model captures timing and magnitude of peak LAI more accurately in the Cakrabuana variety under 90 kg.ha−1 and AWD treatment. However, observed LAI for Inpari 13 variety remains higher for longer than predicted. In the 180 kg.ha−1 treatments, the model performs best in Cakrabuana variety, closely aligning with observations. Yet, for the Inpari 13 variety, the model continues to underestimate LAI despite higher nitrogen availability, suggesting a lack of representation of variety-specific traits under high-input conditions (Figure 8). Overall, while the model shows improved accuracy with higher nitrogen levels and irrigation, persistent underestimations in Inpari 13 and under continuous flooding indicate a need for further calibration.
4 Discussions
4.1 Validation of Cakrabuana and Inpari 13
Based on the analysis of the RMSEn values presented in Tables 1-6, it is clear that most values fall within the “good” category for the Cakrabuana rice varieties. The evaluation results demonstrate that ORYZA (v3) effectively predicts the growth and production of Cakrabuana rice, achieving RMSEn values of 11 and 21%. This indicates that Cakrabuana varieties are suitable for further simulations. According to González et al. (2021), a simulation meets very good criteria if it has an RMSEn value of less than 10%. An RMSEn value between 10 and 20% is considered good, while values from 20 to 30% are acceptable. Any RMSEn value exceeding 30% is categorized as poor. The NSE values for the Cakrabuana variety are 0.68, 0.94, and 0.93, indicating that the simulation results are acceptable. These values place the Cakrabuana model within the good and perfect categories. According to Elsadek et al. (2024), an NSE value is categorized as very good if it falls between 0.75 and 1.0, and as good if it is between 0.65 and 0.75. So, based on the evaluation of the NSE model performance, the Cakrabuana model is deemed acceptable. Additionally, the evaluation results showed a PBIAS value close to 0. A PBIAS value near 0 indicates that the discrepancies between the simulation results and the observed data for the Cakrabuana variety are minimal. Elsadek et al. (2024) also noted that a PBIAS value is considered better when it approaches 0.
Figures 3–6 showed the box plots of all relative fit tests for all validations of treatment. The model underestimates the dry biomass of total aboveground components, including stems and green leaves, while overestimating the Leaf Area Index (LAI). Other studies, such as those by Yuan et al. (2017) and Nurulhuda et al. (2022), reported similar discrepancies with LAI measurements. While exhibiting both underestimations and overestimations, the dry biomass of dead leaves and panicles may be better understood using sigmoid curves in crop modeling. Sigmoid curves effectively represent the nonlinear behavior of biomass accumulation and decomposition in crop models (Meade et al., 2013), particularly those fitted with WSO and WLVD. These curves begin with a lag phase, transition into a rapid growth phase, and ultimately plateau as the system reaches saturation. This S-shaped pattern accounts for the initial underestimations of linear models during the slow start of biomass growth. It prevents overestimations that may arise when growth is projected beyond the point of diminishing returns. By reflecting biological processes, sigmoid curves improve the accuracy and reliability of biomass estimates related to dead leaves and panicles.
The validation results of the model performance for the Inpari 13 variety are unacceptable, as they only meet the criteria for the WSO component. The incompatibility between the varieties and the model may arise from treatment variations and the adaptability of the varieties to the environment. These factors can lead to significant discrepancies between the simulation results and the actual observations. This idea is supported by Xu et al. (2013), who noted that in a changing environment, even minor mismatches between simulated phenology and observational data can result in substantial errors in the model’s yield predictions. The validation conducted using RMSE, PBIAS, and MAPE approaches to evaluate the agreement between observed and simulated values indicates that the Cakrabuana simulation model is viable for further use, as it meets the established standards.
The Inpari 13 variety has not met the predetermined criteria and is therefore unsuitable for further simulation. This may be due to the specific interaction that Inpari 13 has with the irrigation system, which was not considered during calibration. The calibration process in this model was conducted during the rainy season, which does not affect the irrigation system. Irrigation management parameters in ORYZA v3 are assumed to be static during calibration due to excess water caused by rainfall. This makes water content dependent on available rainfall data, so this approach does not dynamically reduce or cancel irrigation applications in response to natural rainfall during the simulation. As a result, the actual field water status during periods of high rainfall can be wetter than predicted by the model, especially for varieties such as Inpari 13. These varieties are expected to have high sensitivity to slight differences in waterlogging or drainage conditions. This may explain why the model does not fully capture the actual response of Inpari 13 in wet season irrigation dynamics. Therefore, recalibration for crop key parameters is needed to improve the Inpari 13 validation result.
Once validated, the model provides reliable yield predictions customized for specific locations and rice varieties. For actual farmers, the outcomes from the assessed ORYZA model offer practical benefits, including more accurate yield forecasts, guidance on optimal planting dates, improved fertilizer and irrigation management, and strategies for managing climate risks. By simulating different scenarios, the model assists farmers and agricultural advisors in making informed decisions that can increase productivity and reduce losses. In real-world applications, using ORYZA (v3) has resulted in significant yield improvements and enhanced resilience to climate variability.
4.2 Interaction of nitrogen dosage and irrigation
Irrigation management can enhance nitrogen use efficiency in plants by maintaining a proper balance between aerobic and anaerobic conditions. This balance helps reduce nitrogen losses through leaching, which affects nitrogen availability differently. Studies have shown that rice grown under continuous flooding often produces lower biomass than rice managed with alternate wetting and drying (AWD). One possible reason is that anaerobic conditions in flooded soils promote denitrification, where nitrate is lost as gas to the atmosphere. In contrast, AWD reduces anaerobic periods, limiting denitrification and helping retain more nitrogen in the soil for plant uptake. According to Soliman et al. (2024), nitrogen leaching is particularly prevalent in rice fields submerged in water, especially during the early growth phase. As a result, plants struggle to achieve optimal growth during this critical period. In contrast, AWD irrigation has been shown to enhance nutrient absorption efficiency and promote more vigorous root development. Fu et al. (2021) reported that soil conditions experiencing more frequent dry phases reduce the risk of diseases associated with excess moisture, thereby optimizing crop production. The trend in Figures 7, 8 indicates that biomass accumulation in rice plants increases with nitrogen availability during the seed ripening period. Higher nitrogen doses (90 kg ha−1 and 180 kg ha−1) increase biomass, while a deficiency (0 kg ha−1) results in low biomass content. Although Leaf Area Index (LAI) values remain similar across different nitrogen treatments and irrigation management, a similar result was shown in Shao et al. (2024) and Hashimoto et al., 2023.
4.3 Application of sigmoid curves in crop growth modeling
Sigmoid curves are essential for predicting biomass, as they effectively illustrate the growth patterns of plant organs across different developmental stages. In the results, the sigmoid curve demonstrates a rapid increase in growth during the initial phase, followed by a gradual slowdown and eventually a plateau. This pattern helps ensure that inputs are synchronized with the crop’s growth requirements, ultimately enhancing biomass accumulation and yield production. This observation is consistent with the findings of Radanielson et al. (2018) and Hsieh et al. (2021), who noted that these curves effectively capture growth dynamics across different phases, emphasizing the relationship between time and biomass accumulation. Initially, the growth rate is slow, followed by a rapid increase, and concludes with a decline in the final phase. Thus, the sigmoid curve is an appropriate model for describing biomass rates throughout the different stages of rice phenology.
The trend in Tables 3–6 and Figures 7, 8 shows that the Cakrabuana variety’s simulation values closely match observed results, indicating a more responsive model than the Inpari 13 variety, demonstrating significant discrepancies and poor model performance. Additionally, the sigmoid curves for both varieties show a similar trend across various irrigation treatments, with the Continuous Flooding (CF) treatment exhibiting a more pronounced curve than the Alternate Wetting and Drying (AWD) treatment. This difference is attributed to validation during the rainy season, which affected the effectiveness of AWD compared to CF. Li J. et al. (2024) and Li N. et al. (2024) noted that seasonal conditions can influence weather patterns, ultimately impacting model performance and plant phenology. At the same time, biomass value indicates differences in nitrogen management and irrigation.
5 Conclusion
Model tests simulating genotypic variability in rice plants demonstrated acceptable performance levels. The Cakrabuana variety exhibited strong results across all biomass parameters, particularly in WAGT and WST. It displayed a consistent sigmoid curve pattern, providing a valuable reference for modeling optimal planting times. RMSEn values for total aboveground biomass and panicle biomass ranged from 0.11 to 0.17. The NSE scores were 0.68 for the WST component and 0.93 for the WAGT component, indicating reliable model accuracy. The MAPE values were also low, recording 0.13% for WST and 0.08% for WAGT. The modeling concept for the Cakrabuana variety is particularly relevant under continuous flooding conditions. In contrast, model validation for the Inpari 13 variety was less effective in explaining the calibration process, although it did perform well in simulating the weight of the storage organ. This may be caused by the high sensitivity of several calibrated crop parameters to the environment. Overall, the Inpari 13 calibrated model has limited potential as a reliable model for predicting planting times. As a practical application, the Cakrabuana variety model may be a useful decision-support tool for planning rice cultivation under continuous flooding scenarios. One limitation of this study is using rice varieties with similar maturity durations for calibration and validation. Future research should consider utilizing varieties with different growth durations to provide additional insights for modeling with ORYZA (v3). It is also recommended that the Inpari 13 variety be re-parameterized to enhance its simulation accuracy and model relevance. Consequently, Cakrabuana’s calibrated model is highly recommended for forecasting planting times, especially during continuous flooding. However, the potential for developing the Cakrabuana model also needs to be explored, such as spacing patterns and their integration with organic fertilizers. This aims to generate model-based agronomic recommendations specific to the Cakrabuana variety. This approach will increase the translational impact of this research, allowing farmers to adopt more efficient and science-based management strategies.
Data availability statement
The datasets presented in this study can be found in online repositories. The names of the repository/repositories and accession number(s) can be found in the article/Supplementary material.
Author contributions
AKB: Conceptualization, Formal analysis, Investigation, Methodology, Software, Visualization, Writing – review & editing. RP: Conceptualization, Investigation, Supervision, Validation, Visualization, Writing – review & editing. KK: Data curation, Visualization, Writing – review & editing. YM: Conceptualization, Data curation, Supervision, Validation, Writing – review & editing. AHB: Data curation, Writing – review & editing. AY: Data curation, Writing – review & editing. MC: Conceptualization, Funding acquisition, Supervision, Writing – review & editing. LL: Conceptualization, Methodology, Software, Writing – review & editing. IB: Resources, Validation, Writing – review & editing. BJ: Data curation, Software, Validation, Writing – review & editing. HS: Validation, Writing – review & editing. AN: Resources, Validation, Writing – review & editing. DW: Funding acquisition, Validation, Writing – review & editing. MS: Funding acquisition, Project administration, Supervision, Validation, Writing – review & editing. MA: Conceptualization, Funding acquisition, Investigation, Methodology, Software, Validation, Writing – original draft.
Funding
The author(s) declare that financial support was received for the research and/or publication of this article. This research was supported by Researchers Supporting Project number (RSPD2025R751), King Saud University, Riyadh, Saudi Arabia, is acknowledged. We would also like to thank Hasanuddin University for providing funding for this research through the thematic research group grant batch 2 with number 00773/UN4.22/PT.01.03/2025.
Conflict of interest
The authors declare that the research was conducted in the absence of any commercial or financial relationships that could be construed as a potential conflict of interest.
Generative AI statement
The authors declare that no Gen AI was used in the creation of this manuscript.
Publisher’s note
All claims expressed in this article are solely those of the authors and do not necessarily represent those of their affiliated organizations, or those of the publisher, the editors and the reviewers. Any product that may be evaluated in this article, or claim that may be made by its manufacturer, is not guaranteed or endorsed by the publisher.
Supplementary material
The Supplementary material for this article can be found online at: https://www.frontiersin.org/articles/10.3389/fsufs.2025.1541691/full#supplementary-material
References
Achyadi, M. A., Ohgushi, K., and Morita, T. (2019). Impacts of climate change on agriculture for local paddy water requirement irrigation Barito Kuala, South Kalimantan, Indonesia. J. Wetlands Environ. Manag. 7, 140–150. doi: 10.20527/jwem.v7i2.210
Agustiani, N., Deng, N., Edreira, J. I. R., Girsang, S. S., Sitaresmi, T., Pasuquin, J. M., et al. (2018). Simulating rice and maize yield potential in the humid tropical environment of Indonesia. Eur. J. Agron. 101, 10–19. doi: 10.1016/j.eja.2018.08.002
Amarasingha, R. P. R. K., Suriyagoda, L. D. B., Marambe, B., Gaydon, D. S., Galagedara, L. W., Punyawardena, R., et al. (2015). Simulation of crop and water productivity for rice (Oryza sativa L.) using APSIM under diverse agro-climatic conditions and water management techniques in Sri Lanka. Agric. Water Manag. 160, 132–143. doi: 10.1016/j.agwat.2015.07.001
Ansari, A., Lin, Y. P., and Lur, H. S. (2021). Evaluating and adapting climate change impacts on rice production in Indonesia: a case study of the Keduang subwatershed, Central Java. Environment 8:117. doi: 10.3390/environments8110117
Anshori, M. F., Musa, Y., Farid, M., Jayadi, M., Padjung, R., Kaimuddin, K., et al. (2024). A comprehensive multivariate approach for GxE interaction analysis in early maturing rice varieties. Front. Plant Sci. 15:1462981. doi: 10.3389/fpls.2024.1462981
Balitbangtan, (2021). Laporan Tahunan 2021. Badan Penelitian dan Pengembangan Pertanian, Jakarta. Available online at: https://bbpadi-litbangppid.pertanian.go.id (Accessed April 1, 2025).
Bo, Y., Wang, X., van Groenigen, K. J., Linquist, B. A., Müller, C., Li, T., et al. (2024). Improved alternate wetting and drying irrigation increases global water productivity. Nat. Food. 5, 1005–1013. doi: 10.1038/s43016-024-01081-z
Bouman, B. A. M., Kropff, M. J., Tuong, T. P., Wopereis, M. C. S., ten Berge, H. F. M., and van Laar, H. H. (2001). ORYZA2000: modeling lowland Rice. Los Banos: International Rice Research Institute and Wageningen University and Research Centre, 235.
Dey, S., Singh, P. K., Abbhishek, K., Singh, A., and Chander, G. (2023). Climate-resilient agricultural ploys can improve livelihood and food security in eastern India. Environ. Dev. Sustain. 26, 13979–14002. doi: 10.1007/s10668-023-03176-2
Elsadek, E. A., Zhang, K., Hamoud, Y. A., Mousa, A., Awad, A., Abdallah, M., et al. (2024). Impacts of climate change on rice yields in the Nile River Delta of Egypt: a large-scale projection analysis based on CMIP6. Agric. Water Manag. 292:108673. doi: 10.1016/j.agwat.2024.108673
Faiz, M. C. H., Liyana, N. Y., Nurulhuda, K., Muharam, F. M., Zulkafli, Z., Zulkarami, B., et al. (2019). Preliminary evaluation of ORYZA (v3) crop growth model for mr269 rice variety, vol. 2019. Putrajaya, Malaysia: Konvensyen Kebangsaan Kejuruteraan Pertanian dan Makanan, 306–309.
Fu, H., Cui, D., and Shen, H. (2021). Effects of nitrogen forms and application rates on nitrogen uptake, photosynthetic characteristics, and yield of double-cropping rice in South China. Agronomy 11:158. doi: 10.3390/agronomy11010158
Gao, C., Lin, M., He, L., Tang, M., Ma, J., and Sun, W. (2024). The impact of water-saving irrigation on rice growth and comprehensive evaluation of irrigation strategies. Agronomy 14:1363. doi: 10.3390/agronomy14071363
Gao, Y., Sun, C., Ramos, T. B., Huo, Z., Huang, G., and Xu, X. (2023). Modeling nitrogen dynamics and biomass production in rice paddy fields of cold regions with the ORYZA-N model. Ecol. Model. 475:110184. doi: 10.1016/j.ecolmodel.2022.110184
González, O. R., Bacallao, R. F., Córdova, N. H., Carreño, F. S., Mompié, E. J., Viera, D. G., et al. (2021). Simulation of management strategies from the DSSAT model to increase the yields of a corn cultivar. Cuban J. Agric. Sci. 55, 1–8.
Hameed, F., Xu, J., Rahim, S. F., Wei, Q., Liao, Q., and Ahmed, S. (2019). Rice growth and nitrogen uptake simulation by using ORYZA (v3) model considering variability in parameters. Pak. J. Agric. Sci. 56, 245–259. doi: 10.21162/PAKJAS/19.8155
Hasegawa, T., Sawano, S., Goto, S., Konghakote, P., Polthanee, A., Ishigooka, Y., et al. (2008). A model driven by crop water use and nitrogen supply for simulating changes in the regional yield of rain-fed lowland rice in Northeast Thailand. Pad. Wat. Environ. 6, 73–82. doi: 10.1007/s10333-007-0099-1
Hashimoto, N., Saito, Y., Yamamoto, S., Ishibashi, T., Ito, R., Maki, M., et al. (2023). Relationship between leaf area index and yield components in farmers’ paddy fields. AgriEngineering 5, 1754–1765. doi: 10.3390/agriengineering5040108
Hayashi, K., Llorca, L. P., Bugayong, I. D., Agustiani, N., and Capistrano, A. O. V. (2021). Evaluating the predictive accuracy of the weather-rice-nutrient integrated decision support system (WeRise) to improve rainfed rice productivity in Southeast Asia. Agriculture 11:346. doi: 10.3390/agriculture11040346
Hayashi, K., Llorca, L., Rustini, S., Setyanto, P., and Zaini, Z. (2018). Reducing vulnerability of rainfed agriculture through seasonal climate predictions: a case study on the rainfed rice production in Southeast Asia. Agric. Syst. 162, 66–76. doi: 10.1016/j.agsy.2018.01.007
Honorio Filho, G. R., Heinemann, A. B., Matta, D. H. D., Stone, L. F., Cuadra, S. V., and Steinmetz, S. (2024). Phenological restriction of the Oryza (v3) model. Rev. Bras. Meteorol. 39:e39240040. doi: 10.1590/0102-77863910040
Hosseinpour, S., Pirdashti, H., Kaveh, M., Dokoohaki, H., and Mousavi, H. (2025). Determination of a sustainable management for rice production through a modeling approach. Int.J. Plant Prod. 19, 47–64. doi: 10.1007/s42106-024-00319-x
Houghton, T. P., Stevens, D. M., Pryfogle, P. A., Wright, C. T., and Radtke, C. W. (2009). The effect of drying temperature on the composition of biomass. Appl. Biochem. Biotechnol. 153, 4–10. doi: 10.1007/s12010-008-8406-x
Hsieh, C. Y., Fang, S. L., Wu, Y. F., Chu, Y. C., and Kuo, B. J. (2021). Using sigmoid growth curves to establish growth models of tomato and eggplant stems suitable for grafting in subtropical countries. Horticulture 7:537. doi: 10.3390/horticulturae7120537
Indonesia Central Bureau of Statistics. (2013). Indonesia population projections 2010–2035. Available online at: https://www.bps.go.id/id/publication/2013/10/07/053d25bed2e4d62aab3346ec/proyeksi-penduduk-indonesia-2010-2035.html (Accessed September 27, 2024).
Indonesia Central Bureau of Statistics. (2024). Average weekly per capita consumption by grain group by district/city. Available online at: https://www.bps.go.id/id/statistics-table/2/MjA5NCMy/rata-rata-konsumsi-perkapita-seminggu-menurut-kelompok-padi-padian-per-kabupaten-kota.html (Accessed October 1, 2024).
IRRI (2014). ORYZA (v3) user manual for basic application version 3. Los Banos: International Rice Research Institute.
IRRI, (2016). Overview of AWD. http://books.irri.org/AWD_brochure.pdf (Accessed November 30, 2024).
Jamshidi, S., Murgia, T., Morales-Ona, A. G., Cerioli, T., Famoso, A. N., Cammarano, D., et al. (2024). Modeling interactions of planting date and phenology in Louisiana rice under current and future climate conditions. Crop Sci. 64, 2274–2287. doi: 10.1002/csc2.21036
Jun-wei, T. A. N., Qing-yun, D. U. A. N., Wei, G. O. N. G., and Zhen-hua, D. I. (2022). Differences in parameter estimates derived from various methods for the ORYZA (v3) model. J. Integr. Agric. 21, 375–388. doi: 10.1016/S2095-3119(20)63437-2
Katayanagi, N., Fumoto, T., Hayano, M., Takata, Y., Kuwagata, T., Shirato, Y., et al. (2016). Development of a method for estimating total CH4 emission from rice paddies in Japan using the DNDC-Rice model. Sci. Total Environ. 547, 429–440. doi: 10.1016/j.scitotenv.2015.12.149
Li, T., Ali, J., Marcaida, M. III, Angeles, O., Franje, N. J., Revilleza, J. E., et al. (2016). Combining limited multiple environment trials data with crop modeling to identify widely adaptable rice varieties. PLoS One 11:e0164456. doi: 10.1371/journal.pone.0164456
Li, T., Angeles, O., Marcaida, M. III, Manalo, E., Manalili, M. P., Radanielson, A., et al. (2017). From ORYZA2000 to ORYZA (v3): an improved simulation model for rice in drought and nitrogen-deficient environments. Agric. For. Meteorol. 237-238, 246–256. doi: 10.1016/j.agrformet.2017.02.025
Li, S., Fleisher, D., Timlin, D., Reddy, V. R., Wang, Z., and McClung, A. (2020). Evaluation of different crop models for simulating rice development and yield in the US Mississippi Delta. Agroromy 10:1905. doi: 10.3390/agronomy10121905
Li, J., Shi, L., Han, J., Hu, X., Su, C., and Li, S. (2024). Improving simulations of rice growth and nitrogen dynamics by assimilating multivariable observations into ORYZA2000 model. Agronomy 14:2402. doi: 10.3390/agronomy14102402
Li, N., Zhao, Y., Han, J., Yang, Q., Liang, J., Liu, X., et al. (2024). Impacts of future climate change on rice yield based on crop model simulation—a meta-analysis. Sci. Total Environ. 949:175038. doi: 10.1016/j.scitotenv.2024.175038
Liang, Z., Ruiz-Menjivar, J., Zhang, L., Zhang, J., and Shen, X. (2024). Examining the effects of adopting early maturing crop varieties on agricultural productivity, climate change adaptation, and mitigation. Int. J. Low-Carbon Technol. 19, 1256–1274. doi: 10.1093/ijlct/ctad150
Liu, J., Liu, Z., Zhu, A. X., Shen, F., Lei, Q., and Duan, Z. (2019). Global sensitivity analysis of the APSIM-Oryza rice growth model under different environmental conditions. Sci. Total Environ. 651, 953–968. doi: 10.1016/j.scitotenv.2018.09.254
Majumder, D., and Das, L. (2018). Simulating the yield attributes of Boro rice under nitrogen and irrigation management at Mohanpur, West Bengal using ORYZA2000. J. Agrometeorol. 20, 72–74. doi: 10.54386/jam.v20i1.511
Meade, K. A., Cooper, M., and Beavis, W. D. (2013). Modeling biomass accumulation in maize kernels. Field Crop Res. 151, 92–100. doi: 10.1016/j.fcr.2013.07.014
Meus, L. D., Quintero, C. E., Ribas, G. G., da Silva, M. R., Streck, N. A., Alberto, C. M., et al. (2022). Evaluating crop models to assess rice yield potential in Argentina. Crop Environ. 1, 182–188. doi: 10.1016/j.crope.2022.08.002
Moriasi, D. N., Arnold, J. G., Van Liew, M. W., Bingner, R. L., Harmel, R. D., and Veith, T. L. (2007). Model evaluation guidelines for systematic quantification of accuracy in watershed simulations. Trans. ASABE 50, 885–900. doi: 10.13031/2013.23153
Mu’min, M., Riadi, M., and Jayadi, M. (2024). Correlation and path analysis of early-maturing rice (Oryza sativa L.) treated with zinc at various growth phases. SABRAO J. Breed. Genet. 56, 547–556. doi: 10.54910/sabrao2024.56.2.8
Musa, Y., Farid, M., Anshori, M. F., Maricar, M. F., Nasaruddin, N., Adzima, A. F., et al. (2024). Produktivitas beberapa varietas padi umur genjah (Oryza sativa L.) pada beberapa paket pemupukan berbasis IOT (Internet of Thing) di Kabupaten Bone. Perbal J. Pertan. Berkelanjutan 12, 63–76. doi: 10.30605/perbal.v12i1.3174
Musyoka, F. K., Strauss, P., Zhao, G., Srinivasan, R., and Klik, A. (2021). Multi-step calibration approach for SWAT model using soil moisture and crop yields in a small agricultural catchment. Water 13:2238. doi: 10.3390/w13162238
Nurulhuda, K., Muharam, F. M., Shahar, N. A. N., Hashim, M. F. C., Ismail, M. R., Keesman, K. J., et al. (2022). ORYZA (v3) rice crop growth modeling for MR269 under nitrogen treatments: assessment of cross-validation on parameter variability. Comput. Electron. Agric. 195:106809. doi: 10.1016/j.compag.2022.106809
Peng, S., Huang, J., Sheehy, J. E., Laza, R. C., Visperas, R. M., Zhong, X., et al. (2004). Rice yields decline with higher night temperature from global warming. Proc. Nat. Acad. Sci. 101, 9971–9975. doi: 10.1073/pnas.0403720101
Radanielson, A. M., Gaydon, D. S., Khan, M. M. R., Chaki, A. K., Rahman, M. A., Angeles, O., et al. (2018). Varietal improvement options for higher rice productivity in salt affected areas using crop modelling. Field Crop Res. 229, 27–36. doi: 10.1016/j.fcr.2018.08.020
Rahim, R., Utami, N., Nurfalah, R., Anggraeni, Y., Kurnia, R., Dela, A., et al. (2024). Dinamika ketahanan pangan: analisis pengaruh luas panen padi, konsumsi beras, harga beras, dan jumlah penduduk terhadap produksi padi di wilayah sentra padi di Indonesia tahun 2017-2021. Innov. J. Soc. Sci. Res 4, 17083–17093. doi: 10.31004/innovative.v4i3.12524
Rajakaruna, R. M. A. S. D., Sewwandi, B. G. N., and Najim, M. M. M. (2024). Effects of climate change and adaptation strategies on food security in Sri Lanka: YSF Thematic Publication. Battaramulla: National Science and Technology Commission, 3–17.
Raza, A., Safdar, M., Adnan Shahid, M., Shabir, G., Khil, A., Hussain, S., et al. (2024). “Climate change impacts on crop productivity and food security: An overview,” in Transforming agricultural management for a sustainable future. eds. S. Kanga, S. K. Singh, K. Shevkani, V. Pathak, and B. Sajan (World Sustainability Series, Switzerland: Springer, Cham), 163–186.
Sakir, N. A. I., Hwang, S. B., Park, H. J., and Lee, B. H. (2024). Associations between food consumption/dietary habits and the risks of obesity, type 2 diabetes, and hypertension: a cross-sectional study in Jakarta, Indonesia. Nut. Res. Prac. 18:132. doi: 10.4162/nrp.2024.18.1.132
Shao, H., Wu, X., Duan, J., Zhu, F., Chi, H., Liu, J., et al. (2024). How does increasing planting density regulate biomass production, allocation, and remobilization of maize temporally and spatially: a global meta-analysis. Field Crop Res. 315:109430. doi: 10.1016/j.fcr.2024.109430
Soliman, E., Azam, R., Hammad, S. A., Mosa, A. A., and Mansour, M. M. (2024). Impacts of alternate wetting and drying technology on water use and soil nitrogen transformations for sustainable rice production: a review. J. Soil Sci. Agric. Eng. 15, 151–163. doi: 10.21608/jssae.2024.291648.1228
Suliansyah, I., Arlius, F., Chaniago, I., Xuan, N. T. T., and Van Quang, P. (2023). Literature review crop modeling and introduction a simple crop model. J. Appl. Agric. Sci. Tech. 7, 197–216. doi: 10.55043/jaast.v7i3.123
Sun, X., Yang, X., Hou, J., Wang, B., and Fang, Q. (2023). Modeling the effects of rice-vegetable cropping system conversion and fertilization on GHG emissions using the DNDC model. Agronomy 13:379. doi: 10.3390/agronomy13020379
Surmaini, E., Sarvina, Y., Susanti, E., Widiarta, I. N., Misnawati, M., Suciantini, S., et al. (2024). Climate change and the future distribution of Brown Planthopper in Indonesia: a projection study. J. Saudi Soc. Agric. Sci. 23, 130–141. doi: 10.1016/j.jssas.2023.10.002
Tang, L., Chang, R. J., Basso, B., Li, T., Zhen, F. X., Liu, L. L., et al. (2018). Improving the estimation and partitioning of plant nitrogen in the RiceGrow model. J. Agric. Sci. 156, 959–970. doi: 10.1017/S0021859618001004
Tayman, J., and Swanson, D. A. (1999). On the validity of MAPE as a measure of population forecast accuracy. Popul. Res. Policy Rev. 18, 299–322. doi: 10.1023/A:1006166418051
Wang, J., Wang, Y., and Qi, Z. (2024). Remote sensing data assimilation in crop growth modeling from an agricultural perspective: new insights on challenges and prospects. Agronomy 14:1920. doi: 10.3390/agronomy14091920
Wikarmpapraharn, C., and Kositsakulchai, E. (2010). Evaluation of ORYZA2000 and CERES-rice models under potential growth condition in the central plain of Thailand. Thai J. Agric. Sci. 43, 17–29.
Xiong, W., Reynolds, M., and Xu, Y. (2022). Climate change challenges plant breeding. Curr. Opin. Plant Biol. 70:102308. doi: 10.1016/j.pbi.2022.102308
Xu, X., Huang, G., Sun, C., Pereira, L. S., Ramos, T. B., Huang, Q., et al. (2013). Assessing the effects of water table depth on water use, soil salinity and wheat yield: searching for a target depth for irrigated areas in the upper Yellow River basin. Agric. Water Manag. 125, 46–60. doi: 10.1016/j.agwat.2013.04.004
Yoshida, S. (1981). Fundamentals of Rice crop science. Los Banos: International Rice Research Institute Press.
Yu, Q., Cui, Y., Han, H., and Liao, B. (2023). Modelling water consumption and nitrogen loss in paddy fields with an improved ORYZA model. Field Crop Res. 292:108828. doi: 10.1016/j.fcr.2023.108828
Yu, J., Ren, Z., Li, H., and Tan, N. (2023). Performance evaluation of the ORYZA_V3 model for rice growth and organ nitrogen content. Agron. J. 115, 2938–2949. doi: 10.1002/agj2.21477
Yuan, S., Peng, S., and Li, T. (2017). Evaluation and application of the ORYZA rice model under different crop managements with high-yielding rice cultivars in Central China. Field Crop Res. 212, 115–125. doi: 10.1016/j.fcr.2017.07.010
Yun, Y., Kim, G., Cho, G., Lee, Y., Yun, T., and Kim, H. (2023). Effect of nitrogen application methods on yield and grain quality of an extremely early maturing rice variety. Agriculture 13:832. doi: 10.3390/agriculture13040832
Zaghum, M. J., Ali, K., and Teng, S. (2022). Integrated genetic and omics approaches for the regulation of nutritional activities in rice (Oryza sativa L.). Agriculture 12:1757. doi: 10.3390/agriculture12111757
Keywords: early maturing varieties, modeling, ORYZA (v3), rice, validation
Citation: Baharuddin AK, Padjung R, Kaimuddin K, Musa Y, Bahrun AH, Yassi A, Casimero M, Llorca L, Bugayong I, Jardinero B, Sembiring H, Nur A, Wasonga DO, Seleiman MF and Anshori MF (2025) Validation assessment of nitrogen and irrigation effects on early maturing rice varieties Cakrabuana and Inpari 13 through ORYZA (v3) modeling. Front. Sustain. Food Syst. 9:1541691. doi: 10.3389/fsufs.2025.1541691
Edited by:
Mohamed Ait-El-Mokhtar, University of Hassan II Casablanca, MoroccoReviewed by:
Manojit Chowdhury, Indian Agricultural Research Institute (ICAR), IndiaSiyuan Cai, Institute of Soil Science (CAS), China
Copyright © 2025 Baharuddin, Padjung, Kaimuddin, Musa, Bahrun, Yassi, Casimero, Llorca, Bugayong, Jardinero, Sembiring, Nur, Wasonga, Seleiman and Anshori. This is an open-access article distributed under the terms of the Creative Commons Attribution License (CC BY). The use, distribution or reproduction in other forums is permitted, provided the original author(s) and the copyright owner(s) are credited and that the original publication in this journal is cited, in accordance with accepted academic practice. No use, distribution or reproduction is permitted which does not comply with these terms.
*Correspondence: Muhammad Fuad Anshori, ZnVhZC5hbnNob3JpQHVuaGFzLmFjLmlk