 James M. Muthoka
 Pedram Rowhani
 Edward E. Salakpi
 Heiko Balzter3,4
 Alexander S. Antonarakis
- 1Department of Geography, University of Sussex, Brighton, United Kingdom
- 2Department of Physics and Astronomy, University of Sussex, Brighton, United Kingdom
- 3School of Geography, Geology and the Environment, University of Leicester, Leicester, United Kingdom
- 4National Centre for Earth Observation, Leicester, United Kingdom
Semi-arid grassland ecosystems are crucial for biodiversity, carbon sequestration, and animal fodder; however, they are increasingly threatened by overgrazing degradation and climate variability. Understanding their spatial distribution and palatability is essential for sustainable land management and maintenance of pastoralist livelihoods. This study aimed to map grassland communities and assess their palatability in semi-arid Kenya using Multiple Endmember Spectral Mixture Analysis (MESMA) and Sentinel-2 satellite imagery, integrating species abundance with forage quality metrics. Sentinel-2 imagery was processed using MESMA to classify the fractional cover of four key grass species (Cynodon, Setaria, Themeda, and Kunthii) along with non-grass land cover types (bare ground, forests, shrubs, and water). An iterative endmember selection method optimized the classification, achieving a root mean square error (RMSE) of 23.5% and a 6% improvement in the overall accuracy compared to the unoptimized models. Palatability was assessed based on literature-derived chemical analyses and pastoralists’ perceptions of the forage quality. In the study area, medium and low-palatable species (Setaria and Kunthii) predominated lowland and midland areas, whereas highly palatable Cynodon was found in small, scattered areas across varied elevations. Mixed-grass communities were found in the central areas. The optimized MESMA model effectively identified overgrazed areas and areas vulnerable to degradation by observing grass palatability with grazing pressure from wildlife and livestock. The MESMA model utilized Sentinel-2 imagery and successfully characterized grassland communities’ spatial distribution and palatability in the study area. These findings provide actionable insights for sustainable grazing management and land protection, assisting pastoralists in identifying optimal grazing areas and enabling land managers to implement targeted restoration measures.
1 Introduction
Grasslands cover over one-third of the global land area (FAO, 2005) and play a pivotal role in food production and carbon sequestration (Chen et al., 2023; Yang et al., 2019). These ecosystems, which are distributed across most continents, are fundamental in providing primary livestock feed, thus producing milk and meat, which are essential for pastoralist livelihoods (Caroline King-Okumu et al., 2015; Catley et al., 2016). Despite their importance, grasslands face numerous challenges threatening their ability to support pastoralist livelihoods and sustain ecological functions.
Inadequate pasture management and intensified grazing have resulted in widespread grassland degradation (Lyu et al., 2020), while the proliferation of invasive plant species (Githae, 2018; Muthoka et al., 2021; Strum et al., 2015; Vujanović et al., 2022) has diminished native plant diversity. Moreover, the loss of grazing land due to hard borders and fences (Evans and Adams, 2016) further constrains available forage, and climate change (Liu et al., 2021; Yang et al., 2019) exacerbates these challenges, leading to decreased grassland plant diversity (Jawuoro et al., 2017; Wachendorf et al., 2018). Consequently, food insecurity and poor livestock production have emerged, posing significant risks to the pastoralist communities.
Approximately 80% of Kenya’s land comprises arid and semi-arid lands (ASALs), which support millions of pastoralists who depend on these areas for their livelihoods (Amwata et al., 2016). Savannah grasslands host a rich diversity of plant species (Mganga et al., 2021, 2015; Muthoka et al., 2022) but are characterized by high rainfall variability (Cheng et al., 2020), which influences forage availability.
In grassland management, the palatability of feed is a crucial consideration, influenced by the nutritional content, digestibility, and texture of the plants, which affect an animal’s preference for specific feeds (Hou et al., 2023; Watuwaya et al., 2022). These factors drive livestock migratory patterns, particularly during dry seasons when high-quality feed is scarce (Turner and Schlecht, 2019). Pastoral communities adapt their grazing strategies based on their knowledge of palatable feed locations and species compositions (Tilahun et al., 2017). However, such dynamics can lead to pasture degradation due to prolonged animal movement and intensive feeding habits (Euclides et al., 2019; Negrón et al., 2019). Therefore, understanding the spatial distribution of palatable feed locally and considering broader animal movement patterns are essential. Consequently, characterizing different grassland communities and assessing their palatability are crucial for sustainable grassland management, pastoralist movement, and livestock wellbeing.
Field-based surveys and aerial photography can accurately quantify grass community abundance; however, these methods are time-consuming, labor-intensive, and have limited geographical and temporal coverage (Dabasso et al., 2012; Dalle, 2020; Weiss and Hall, 2020). Space-based remote sensing technologies offer the potential for large-scale continuous monitoring of grassland community abundance (Fauvel et al., 2020; Reinermann et al., 2020; Wachendorf et al., 2018). Most efforts to map grassland communities and pasture-palatable factors have used remote sensing methods that rely on hard classifiers and multivariate statistical analyses (Chabalala et al., 2020; Ferner et al., 2021) to assign a single variable to each pixel. Savannah grasslands are spatially heterogeneous, characterized by highly mixed compositions that represent multiple grassland communities within a single pixel.
Quantifying grassland community abundance provides insights into ecosystem diversity and heterogeneity (Hill and Guerschman, 2020) and has implications for biodiversity and palatable pastures (Faghihinia et al., 2021; Jawuoro et al., 2017). In this context, abundance refers to the proportion or fraction of each grass species within a given pixel or location. Recent remote sensing studies have focused on determining pasture quality indices and biomass (Chen et al., 2021; Li et al., 2020) or vegetation indices related to forage quality (Zwick et al., 2024). Existing studies on grassland palatability often rely on remote sensing indices or focus on individual grass species, overlooking the complex interactions within grassland communities. This creates a critical gap, as understanding grass community composition and its spatial heterogeneity is essential for addressing challenges, such as overgrazing, degradation, and drought resilience. While pastoralists utilize traditional knowledge to identify forage quality (Dalle, 2020; Keba et al., 2013), these methods are limited in spatial scope and consistency, highlighting the need for scalable, data-driven approaches, such as Multiple Endmember Spectral Mixture Analysis (MESMA).
Recently, advanced classification methodologies, including Spectral Mixing Analysis (SMA) and Multiple Endmember Spectral Mixture Analysis (MESMA), have emerged (Quintano et al., 2012; Roberts et al., 2012, 1993). These approaches utilize spectral unmixing techniques to determine the abundance of various spectral members within individual pixels (Roberts et al., 1993). In comparison to alternative classification methods, such as Maximum Likelihood or Random Forest, which assigns a single land cover type per pixel, SMA and MESMA have demonstrated superior performance in the spatial identification of palatable grass species within heterogeneous natural grasslands. Investigations employing MESMA have successfully identified fractional cover in various plant communities, including forests, shrubs, and grasses in Californian semi-arid regions (Hamada et al., 2011; Roberts et al., 1998), and more recently derived abundances of forest and shrub species (Bogan et al., 2019). Notwithstanding advancements in remote sensing technology, few studies have utilized MESMA to classify diverse grass communities or established correlations between these classifications and forage palatability. To the best of our knowledge, no previous research has employed MESMA to map the spatial distribution of palatable grasses at a community level. Considering the necessity for precise large-scale insights into grassland composition for sustainable grazing management, this represents a significant limitation.
The primary objective of this study was to map the spatial distribution of grass communities in semi-arid Kenyan savannahs using Multiple Endmember Spectral Mixture Analysis (MESMA) and Sentinel 2 imagery. A secondary objective is to derive palatability maps to support sustainable grazing management. To address this gap, our study aimed to:
1) Multiple Endmember Spectral Mixture Analysis (MESMA) was employed on Sentinel-2 imagery to classify the fractional cover of four key grassland community types (Cynodon, Setaria, Themeda, and Kunthii) in semi-arid Kenyan savannahs.
2) The spatial distribution of palatable grasses was mapped by integrating MESMA-derived classifications with literature-based forage-quality metrics and pastoralist knowledge to provide actionable insights for sustainable grazing and land management.
2 Materials and methods
2.1 Description of the study area
This study focuses on the semi-arid savannah grasslands of the Kapiti Research Station, Machakos County, Kenya, a region critical for understanding grassland dynamics because of its high biodiversity and vulnerability to grazing pressure, drought, and degradation. The station, covering 128 km2 at elevations ranging from 1,615 to 1,920 m, and is centered around Latitude 1.630S, Longitude 37.140E, represents typical conditions of Kenyan ASALs (Arid and Semi-Arid Lands), which sustain millions of pastoralists. These factors make Kapiti an ideal site for testing the applicability of MESMA in grassland community classification and palatability mapping. The Kapiti Research Station has a warm tropical climate and experiences a bimodal rainfall pattern, with the short rains occurring from October to December. October marks the onset of the short rainy season, characterized by the initial growth phase of herbaceous vegetation. The average annual precipitation is 550 mm, with high interannual variability. Herbaceous plant species and patchy savanna woody species characterize the Savannah grassland at the Kapiti Research Station. Acacia species dominate woody species, whereas the plant species are a mix of perennial grasses (Setaria trinervia, Themeda triandra, Cynodon dactylon, Digitaria macroblephara, Microchloa kunthii), annuals (Eragrostis tenuifolia and Aristida keniensis), and forbs (Blepharis hildebrandtii, Sida ovata, Schkuhria). Furthermore, the broad savannah plains and hills distinguish the topography; the primary soil is red and black cotton.
2.2 Data
2.2.1 Grassland community ground inventories
In 2019, we conducted a field campaign to survey grassland communities across two three km-long transects oriented East–West and North–South (Figure 1). Eight grassland sites were identified to collect the grassland diversity data. Within each 30 m × 30 m (900 m2) sample plot, we examined four 0.5 m × 0.5 m quadrants in detail. Initially, the cover was estimated, and then each species’ herbaceous composition and abundance within each quadrant was recorded using the Braun-Blanquet cover-abundance index (Braun-Blanquet, 1932; Werger, 1974). Subsequently, we tabulated the related plots and defined groups of similar plots as communities based on their consistent composition.
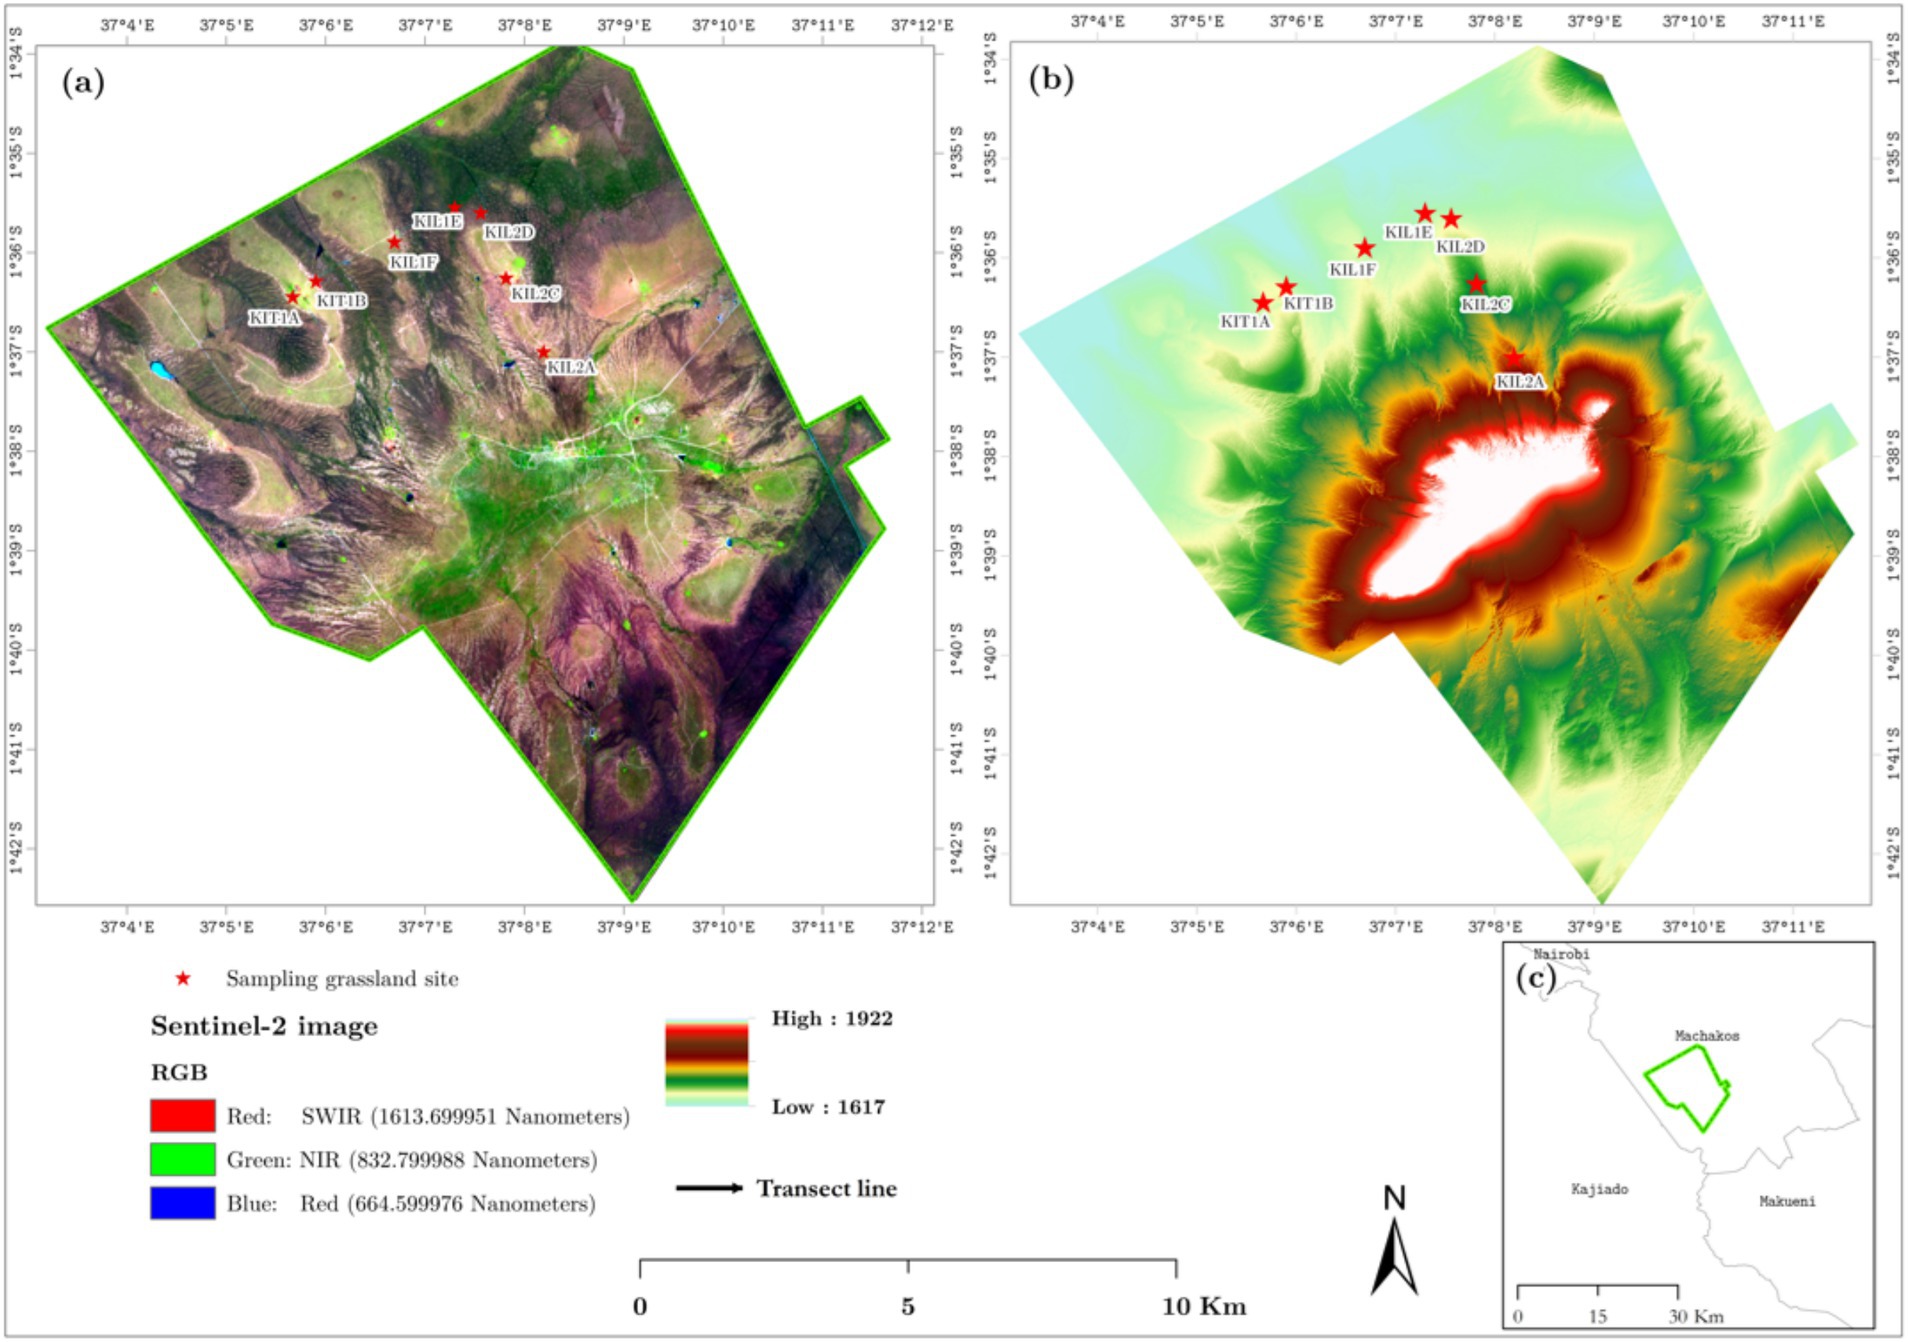
Figure 1. Map of the study area showing the sample vegetation unit overlaid on a Sentinel-2 false-color composite image. Panel (b) shows the 5-m resolution digital terrain model of the study area, which was created using data collected by a Leica ALS60 aerial LiDAR. Panel (c) shows the location of the study area within Machakos County.
The semi-arid grasslands of Kapiti Research Station are heterogeneous and consist of herbaceous and woody vegetation communities. Table 1 outlines the grassland communities associated with the eight studied grassland sites. Grasslands were initially categorized into community types according to their dominant cover (Boonman, 1993) and further enhanced field-based observations and analyses (Muthoka et al., 2022). Specifically, we delineated Cynodon, Setaria, Kunthii, and Themeda grassland communities based on each site’s ecological predominance of the principal grass species. Furthermore, four non-grass land-cover types (trees, shrubs, water, and bare ground) were incorporated into the classification to reflect the diverse patterns of the area. There were no croplands or significant built-up areas in the study area; therefore, these areas were excluded from the analysis (Figure 2).
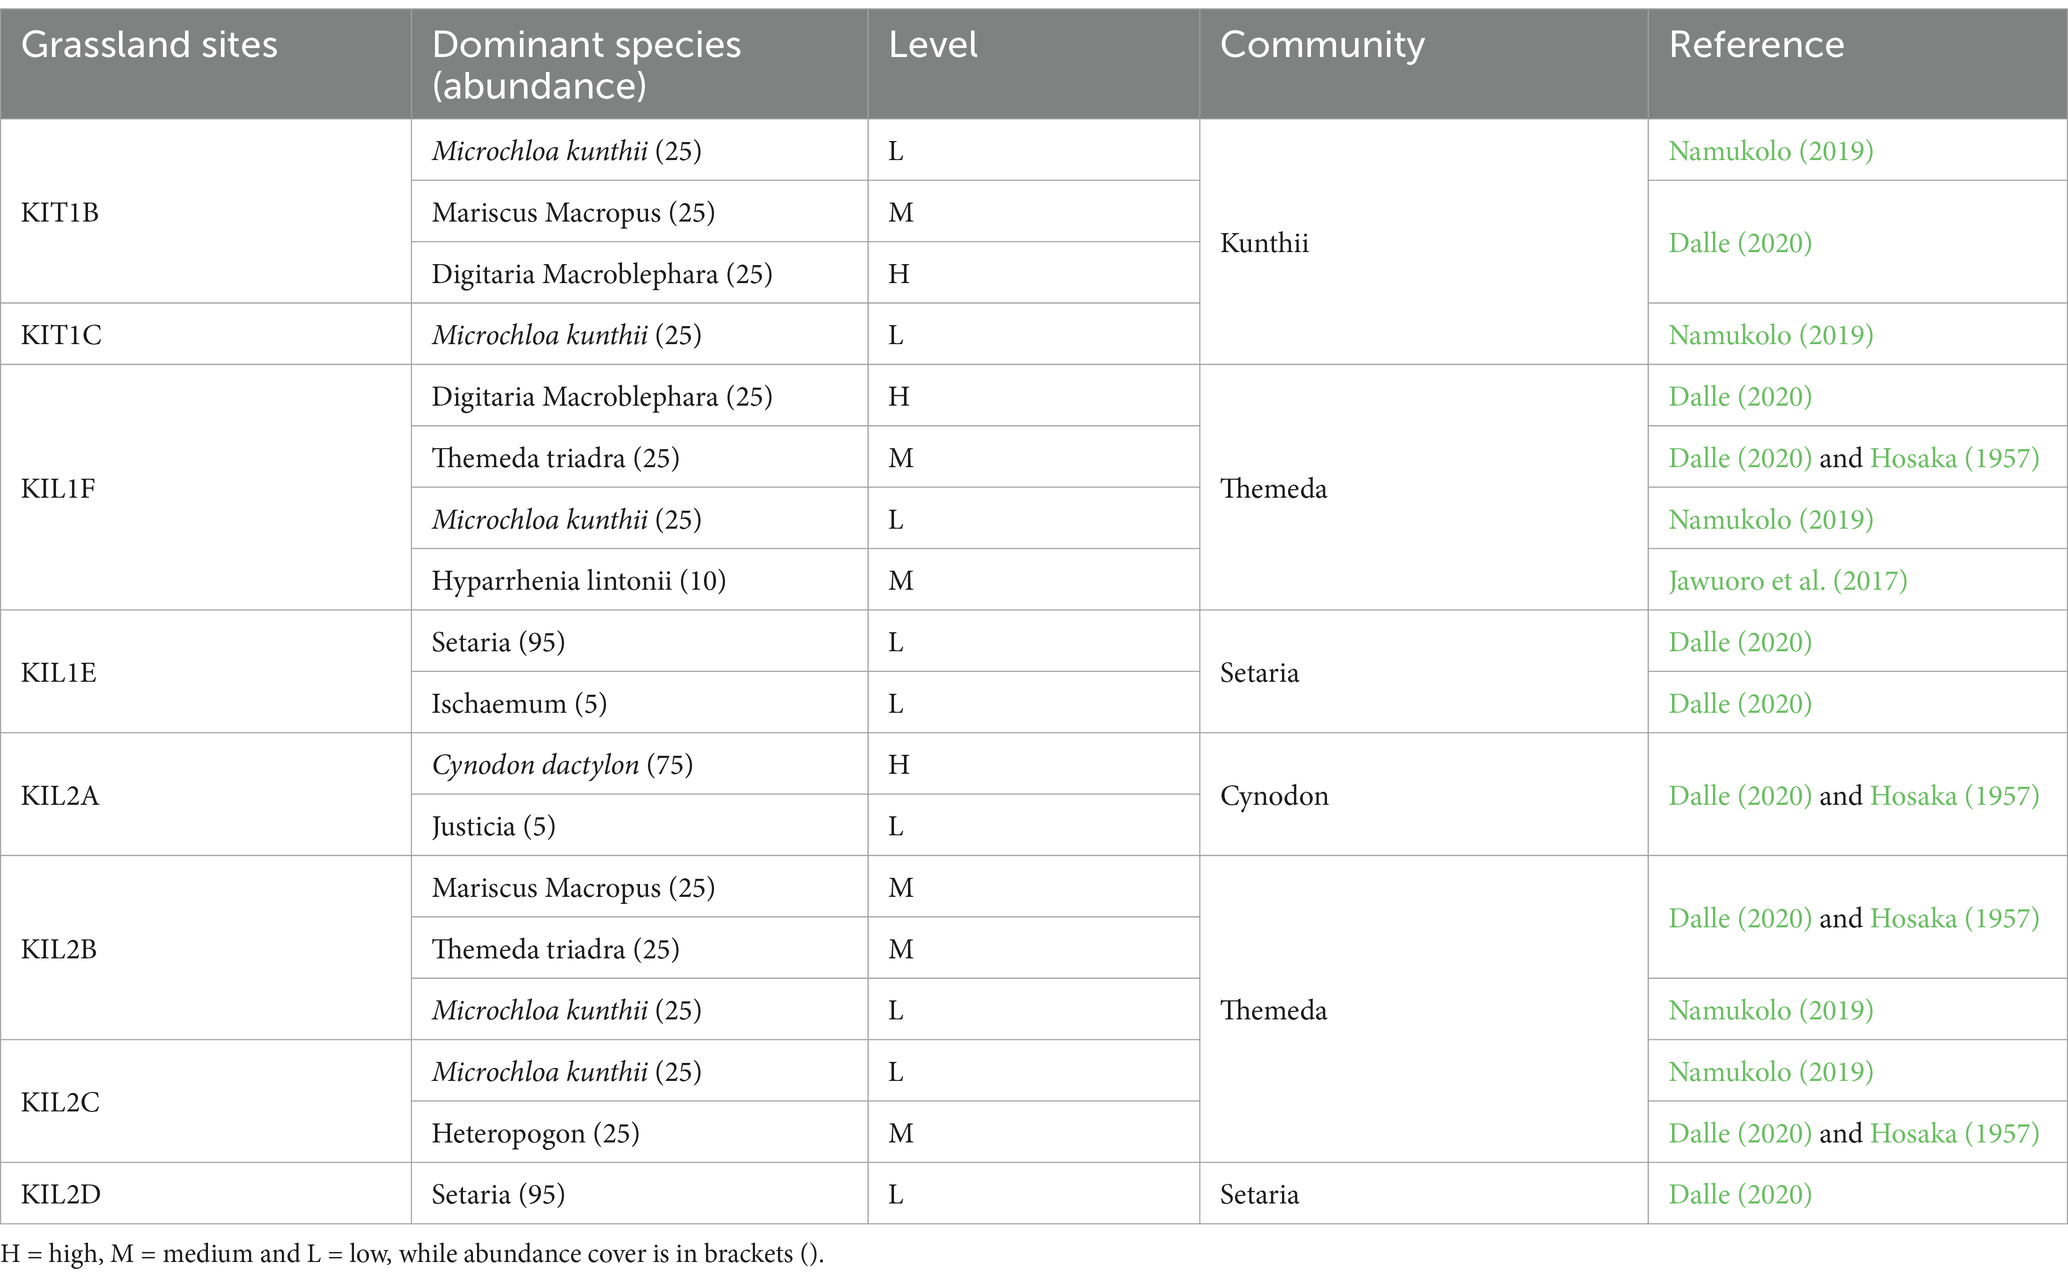
Table 1. Descriptions of grassland site herbaceous communities and palatability levels based on the existing literature.
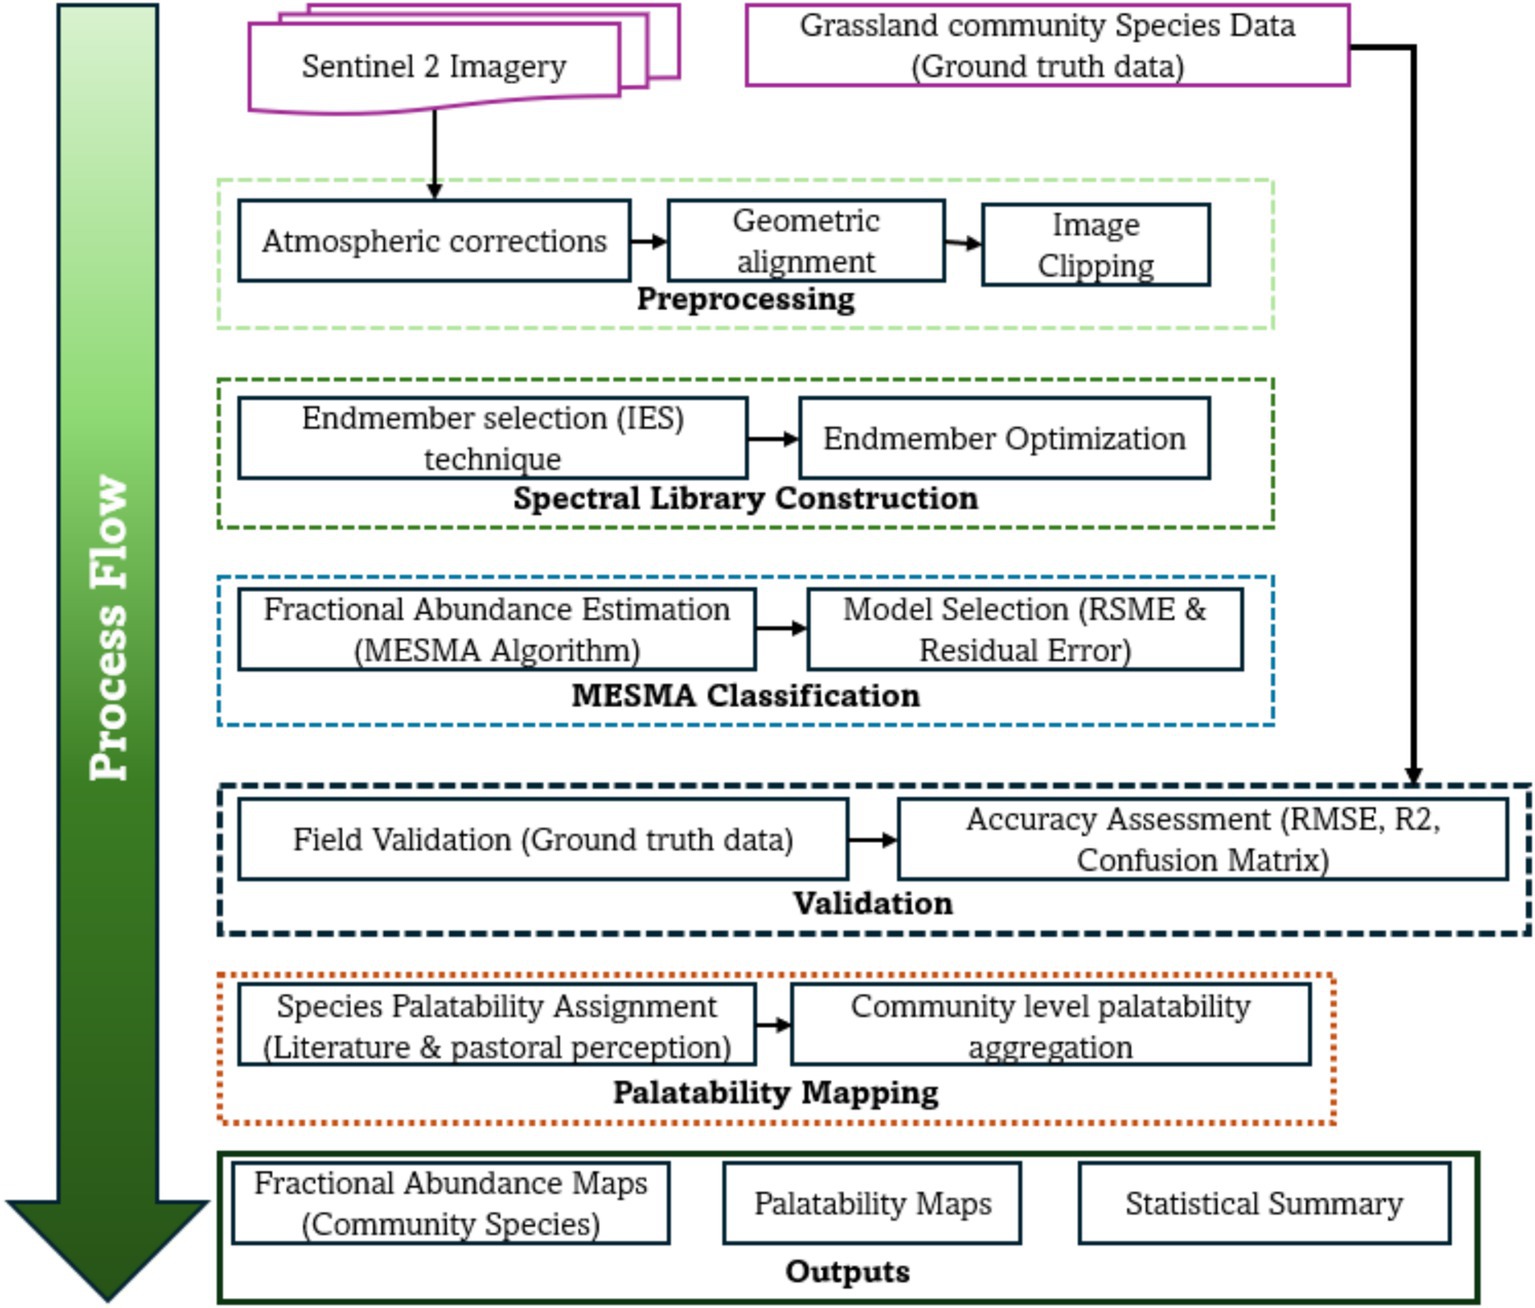
Figure 2. A process flow for classification of grassland community types and palatable pasture.
This classification considers the ecological interactions and adaptation strategies of coexisting species in grassland communities. Microchloa Kunthii is prevalent in arid locations owing to its remarkable drought resistance, enabling it to flourish under adverse climatic conditions (Smrithy et al., 2023). Similarly, Digitaria Macroblephara and Themeda triandra are prevalent species in herbaceous strata, demonstrating adaptability to diverse soil textures and disturbance patterns (Anderson et al., 2007). Setaria is a resilient grass species adept at thriving in tropical pastures, where its effective utilization of sunshine and water allows it to surpass other grasses, particularly in lowland regions (Knuesting et al., 2018). Cynodon Dactylon exhibits vigorous growth, environmental versatility, and allelopathic characteristics, allowing it to inhibit adjacent species and prevail in diverse environments (Ziech et al., 2016).
Considering the rarity of homogeneous species locations and the ecological coexistence of these species, identifying grassland community types instead of concentrating exclusively on individual species offers a holistic framework for ecological evaluation. This method enabled us to incorporate the contributions of dominant species to fodder quality, environmental adaptation, and grazing dynamics, thereby enhancing the classification of Kapiti grassland ecosystems.
The Kunthii community was assigned medium palatability because of the significant contribution of associated species, such as Mariscus macropus (medium) and Digitaria macroblephara (high), across the sites, improving the overall forage quality. This classification encompasses ecological interactions and the cumulative grazing value offered by the species assemblage rather than relying exclusively on the dominant species.
2.2.2 Satellite-based earth observation data
The Copernicus Sentinel-2 satellite imagery utilized in this study comprises a twin polar-orbiting constellation equipped with a Multispectral Instrument (MSI) (Phiri et al., 2020). This MSI is capable of acquiring optical imagery with spatial resolutions of 10, 20, and 60 m across 13 spectral channels, from which we extracted only 10 spectral bands that are essential for vegetation analysis.
We selected a Level 1C Sentinel-2 image, acquired on 16th October 2019, with no cloud cover over the study area, taking into consideration the region’s persistent cloud cover and the timing of the vegetation community presence. Fieldwork was conducted concurrently with the acquisition of the Sentinel-2 image on 16th October 2019, ensuring precise ground validation. The timing of the image acquisition coincided with the early growth stage of the vegetation, influenced by the onset of the short rainy season.
Sen2CorV2.8 was employed to perform atmospheric correction, retrieving surface reflectance devoid of atmospheric effects and geometric distortions (Main-Knorn et al., 2017). Subsequently, we clipped the image corresponding to the study area by applying a study area mask to the 10 visible, near-infrared, and shortwave-infrared spectral bands. Data processing was conducted using SNAP (Sentinel Application Platform) version 7.0 (SNAP, 2020), an open-source tool developed by the European Space Agency and optimized for Sentinel-2 imagery. SNAP was utilized for atmospheric correction (Sen2CorV2.8) and geometric alignment to ensure the high-quality surface reflectance data were free of atmospheric distortions. This tool was selected due to its compatibility with multispectral analysis.
2.3 Methods
2.3.1 Multiple endmember spectral mixture analysis (MESMA)
We applied the MESMA algorithm (Roberts et al., 1998) to Sentinel-2 images and translated them into maps showing the relative abundance of fractional cover in community grasslands. MESMA allows multiple endmembers to differ within each pixel, resulting in a relative abundance of land-cover classes of interest in every pixel (Roberts et al., 1998). The MESMA Equation 1 is as follows:
where the spectral mixture of pixel at wavelength , which is represented as an aggregate of the reflectance endmember series, ( ) for pixel , and is the number of endmember classes. is the residual describing the unspecified variation in the reflectance wavelength of the pixel and is the fractional abundance of endmember class j in pixel .
Furthermore, when the endmember fractions add up to 100% during the analysis, they are typically constrained by their sum being equal to 1.0 (Roberts et al., 1998). We then used the root mean square error (RMSE) (Equation 2) and the residual error of the model to determine how well it fits the data (ε_λ):
where M denotes the total number of the image bands. Finally, MESMA selects the best-fit model for each pixel, ensuring that more materials are mapped across the image, while minimizing the fraction errors at the pixel scale. All analyses were performed using the ENVI (Harris Geospatial/solutions) extension of VIPER Tools V2.0.
2.3.2 Endmember selection
The endmembers were extracted for each target class from the Sentinel-2 surface reflectance image for all land-cover types, including the four grassland communities described in Table 1 (Setaria, Themeda, Kunthi, and Cynodon), shrubs, forests, water, and bare ground (Table 2). The target class samples were selected based on grass inventories from the dominant grassland community analysis (i.e., within the eight field plots shown in the figure and defined in Table 1). The target class samples were selected based on grass inventories from the dominant grassland community analysis (i.e., within the eight field plots shown in the figure and defined in Table 1). Additionally, on-ground knowledge of non-herbaceous land cover classes was incorporated. Endmembers for non-herbaceous land cover types (trees, shrubs, water, and bare ground) were extracted from high-resolution Google Earth images. A total of 439 endmembers were collected (Table 2), comprising 135 from grasslands and 304 from non-grassland land-cover types.
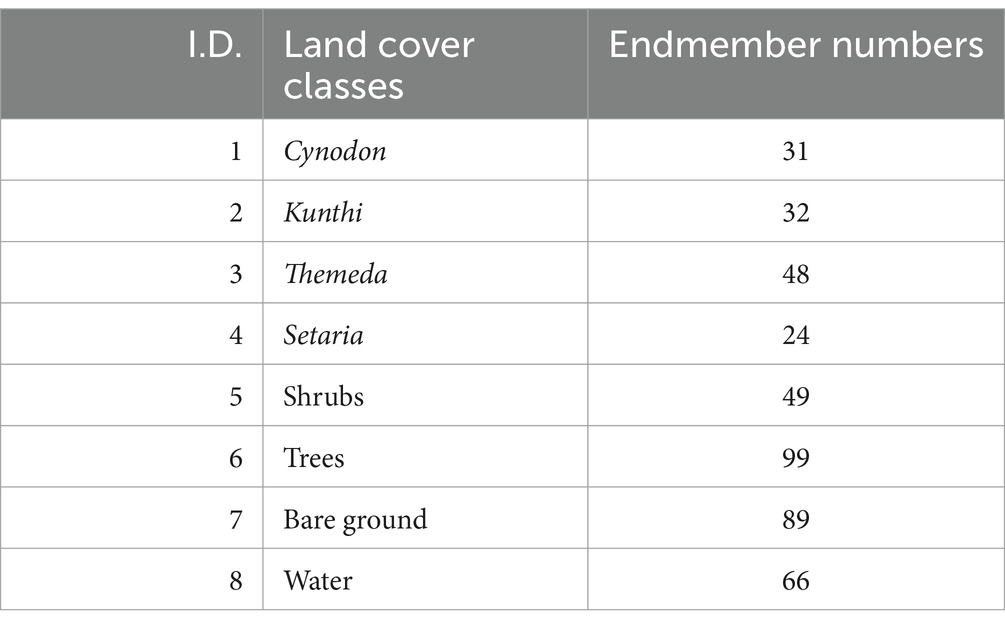
Table 2. Number of endmembers chosen for each land cover class, which included four grass communities (Cynodon, Kunthi, Themeda, and Setaria) and non-grassland cover types (shrubs, trees, water, and bare ground).
This study examined two methodologies for selecting the optimal classification model to delineate grassland communities. The first approach, termed the unoptimized endmember model, utilized all selected endmembers for grass and non-grass cover types. The second approach, designated as the optimized endmember model, employed only the optimized endmembers derived from the IES technique.
Accuracy assessment and validation are crucial for classifying land cover products, primarily based on remote sensing data (Dube et al., 2019). Consequently, our validation data were collected from 27 subplots, each centered within a 30 m × 30 m grassland site. Subplot locations were stratified to capture variability across grassland communities and land cover types, ensuring representative sampling. We employed random sampling within predefined strata to address potential biases and compared the validation plots against independent ground measurements. This approach minimizes spatial autocorrelation and provides robust accuracy assessments for the MESMA classification. of MESMA fraction outputs for each of the target grassland communities (Cynodon, Setaria, Kunthi, and Themeda) and 30 for each of the control classes (shrubs, trees, water, and bare ground). Various metrics were utilized to assess the accuracy and uncertainty of the products. Initially, we employed the coefficient of determination (R2) and RMSE to evaluate the fractional accuracy of the MESMA product, as previous research has demonstrated that these metrics are adequate for assessing the accuracy of the MESMA approach (Bogan et al., 2019). Subsequently, based on the best-performing model, we utilized an error matrix to determine the overall accuracy of the covers and ascertain uncertainty. Finally, we computed the Transformed Divergence separability index to examine whether the best model exhibited spectral separability between grassland communities and cover.
2.3.3 Derivation of the grassland cover and palatability
Dominant species and their palatability across the study sites were systematically classified to ensure their ecological relevance. We identified the predominant grass species at each location based on their ecological prevalence and quantified their percentage cover. We incorporated only species with substantial cover values (≥5%) in the analysis to emphasize the ecologically significant contributors to grassland structure and grazing dynamics.
We utilized data from relevant literature (e.g., Dalle, 2020; Hosaka, 1957; Jawuoro et al., 2017) to determine the palatability of each identified species, categorizing them into three levels: high (H), medium (M), or poor (L) according to their forage quality. Due to their superior nutritional content and digestibility, livestock exhibit a preference for high-palatability species, such as Digitaria macroblephara and Cynodon dactylon. Species with medium palatability, such as Themeda triandra and Mariscus macropus, were moderately consumed without being highly palatable. Species with low palatability, such as Microchloa kunthii and Setaria, are generally grazed during periods of scarcity or are considered less desirable due to their low nutritional value or presence of secondary metabolites.
Grassland communities were classified into six types based on the predominance of specific species or the ecological associations among coexisting species. Community-level palatability was assessed by aggregating the palatability ratings of all dominant species at each site. Communities characterized by highly palatable species (e.g., Cynodon dactylon) were designated as “High,” while those containing both medium and low-palatable species were categorized as “Medium” (e.g., Kunthii Community). Communities comprising low-palatable species were designated as “Low” (e.g., Setaria Community). In cases where discrepancies in palatability levels were encountered, community categories were derived from field observations and ecological interpretations of the literature.
Fractional cover values were converted into palatability classes based on the dominant species’ ecological prevalence and nutritional quality. Species were categorized into three palatability levels: high, medium, and low, using information from literature and field observations. For instance, high palatability comprised of pixels dominated by species like Cynodon dactylon and Digitaria macroblephara, with fractional cover ≥20%. Similarly, medium palatability comprised pixels with mixed dominance of medium-palatability species (e.g., Themeda triandra) and low-palatability species, with fractional cover between 10 and 20%. Finally, low palatability consisted of pixels dominated by low-palatability species like Setaria spp., with fractional cover ≥10%. These thresholds were applied consistently across the study area, ensuring standardized classification of palatability levels.
The transformation of fractional maps into classified thematic maps constitutes a critical step in remote sensing land cover analysis. This process entails aggregating fractional estimates to assign a dominant land-cover class to each pixel, which is essential for ecological applications. Fractional maps represent the proportion of various land-cover types within individual pixels, with values ranging from 0 to 1, reflecting a particular class’s relative probability or magnitude (Li et al., 2010; Ling et al., 2013). In generating a classified map, researchers typically determine the maximum fractional value for each pixel, thereby ensuring that each pixel is assigned to a single distinct land cover class (Ling et al., 2014). This methodology is particularly advantageous for landscapes with standard mixed pixels, facilitating a more coherent representation of land cover types. Researchers may apply additional criteria, such as proximity to similar classes or expert-defined thresholds, to resolve ambiguities and inform categorization (Chen et al., 2018; Ge et al., 2016). The establishment of consistent classification criteria is of particular importance in heterogeneous landscapes, where the spatial distribution of land cover classes can significantly influence classification outcomes (Ling et al., 2013).
A comprehensive literature review was conducted to provide information on the palatability of target grassland communities in Kenya’s semi-arid environments. The palatability classification methodology relies on chemical analyses of grass and pastoralists’ perceptions of forage value. Dalle (2020) conducted eight group discussions with 108 pastoralists from various regions in Ethiopia to assess forage quality in the semi-arid Borana lowlands of Southern Oromia. Keba et al. (2013) employed grass chemical analysis (i.e., ash, nitrogen, crude protein, acid detergent fiber, and acid detergent lignin content) in a laboratory and perception analysis by holding seven group discussions with key local informants to establish palatability levels in the Ethiopian semi-arid rangeland. These studies categorized palatability as highly desirable, intermediate, or least desirable. Based on these and similar studies, grassland communities and their corresponding palatability categorization were identified in the literature (Jawuoro et al., 2017). To derive a palatability map from the classified map, the grass communities detected in the MESMA model output were further classified into four unique palatability levels (high, medium, and low). The categories were then spatially displayed to create a palatability map, facilitating targeted evaluation of fodder availability throughout the study area.
3 Results
3.1 Endmember spectral library and models
Figure 3 presents the spectral profiles of the average endmembers within each of the eight classes. Figure 3a depicts the average spectral profile of each category based on all the endmembers collected, specifically the unoptimized endmembers. The final unoptimized endmember spectral library yielded 439 two-endmember models (one cover class + shade), 81,589 three-endmember models (two cover classes + shade), and 8,381,761 four-endmember models (three cover classes + shade).
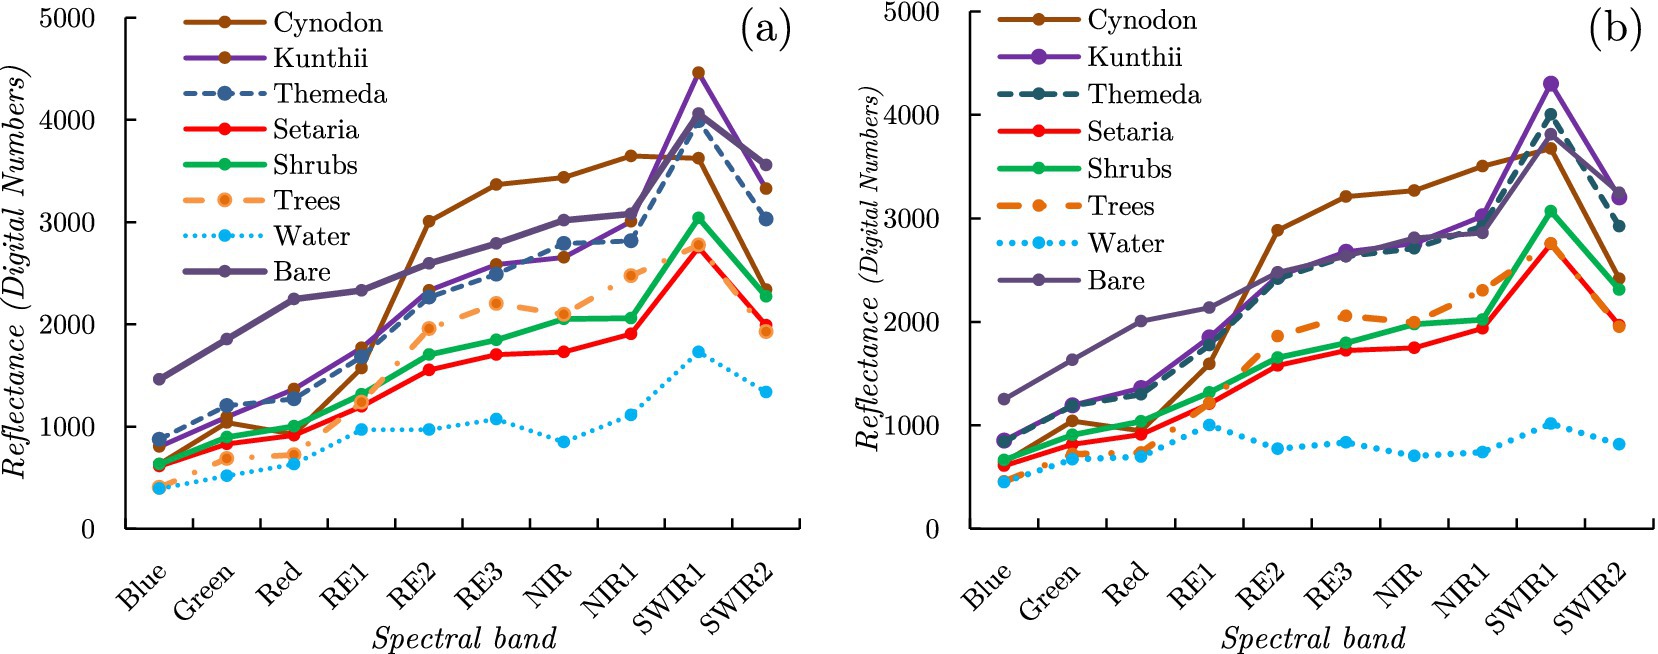
Figure 3. Spectra in the final endmember library for the target grass communities (Cynodon, Kunthii, Themeda, and Setaria) and non-grassland cover type classes (shrubs, trees, bare ground, and water) for the unoptimized endmember model (a) and the optimized endmember model (b).
Figure 3b illustrates the spectral profile of the average endmembers within each land cover class following the application of the IES optimization technique. The final IES spectral library model provided possible combinations for each Sentinel-2 pixel probability-class model. Utilizing the optimized endmember spectral library, we obtained 31 two-endmember models (one cover class + shade), 402 three-endmember models (two cover classes + shade), and 2,838 four-endmember models (three cover classes + shade).
3.2 MESMA classification and accuracy assessment
3.2.1 Unoptimized endmember MESMA
Figure 4 presents the results of the unoptimized Endmember MESMA classification for all eight land cover classes, including the four community grassland types. The unoptimized Endmember MESMA classification exhibited a high abundance of Kunthii, Themeda communities, and shrubs, and a low abundance of Cynodon, Setaria communities, and tree cover. Additionally, abundant bare ground was observed across most locations in the study area. Comparing the spatial abundance patterns, the Sentinel-2 image (Figure 1a) and elevation map (Figure 1b) demonstrated similarities in spatial form changes. The Cynodon grassland community was identified at various elevations and patches across the study area. Kunthii and Themeda grassland community types were observed mixed with shrubs at all elevations, and it was noted that these grassland communities preferred areas with good drainage. Furthermore, a high shrub fractional abundance was detected in the southern part of the study area. A high Setaria fractional abundance was identified in the northeast of the study area, particularly in low-elevation areas. Tree fractional abundance estimates were observed in high-elevation areas along ephemeral channels and the central part of the study area. Finally, water fractions with low abundance were identified in specific areas ranging from mid to low elevations.
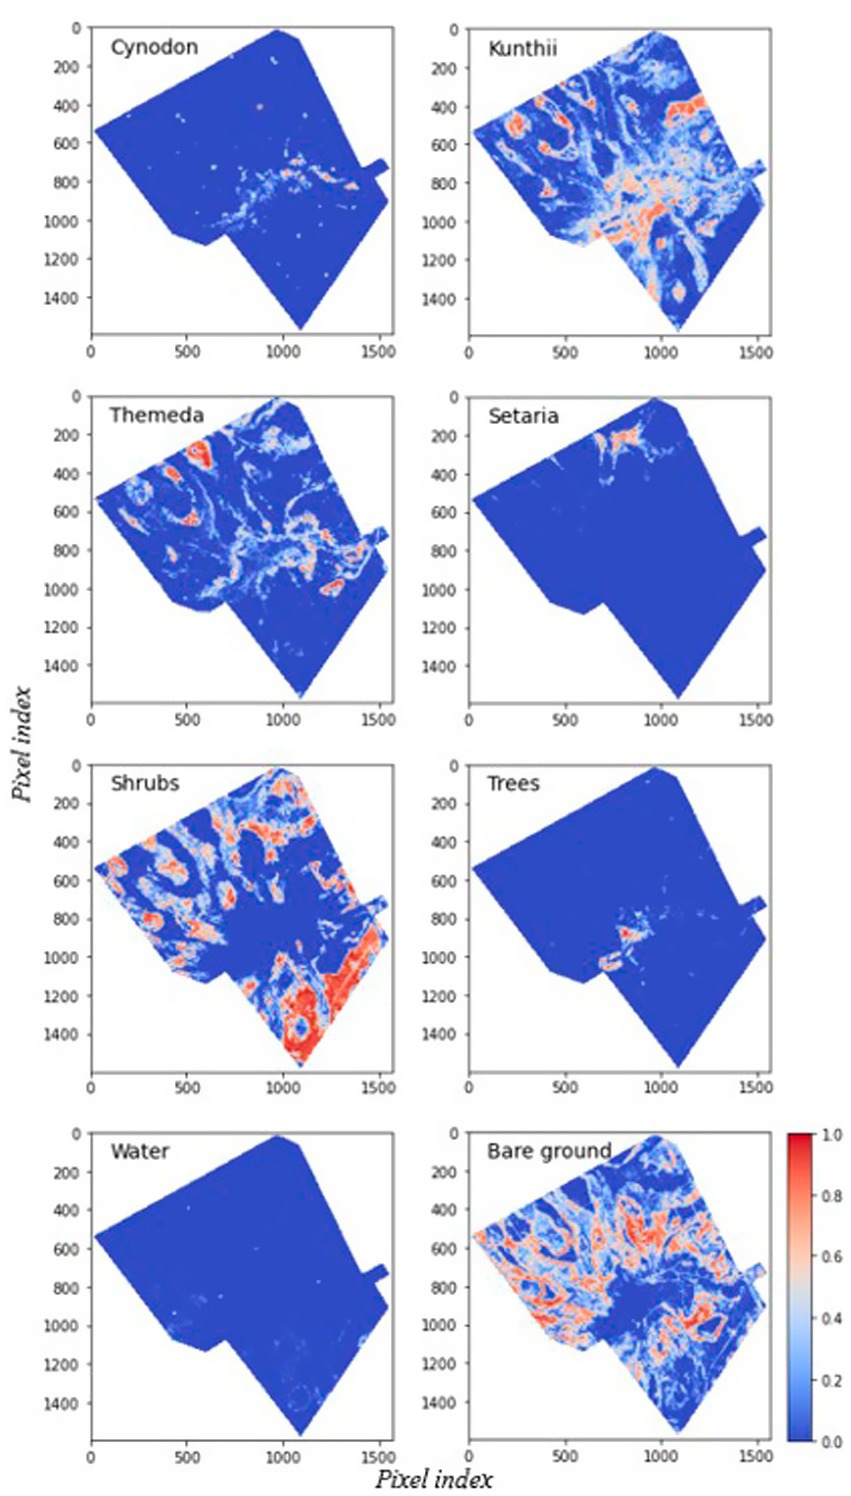
Figure 4. Fractional cover maps from the unoptimized endmember MESMA, showing fractional cover values ranging from 0 (cool colors) to 1 (warm colors). Major land cover classes are annotated, and key regions of interest are highlighted to illustrate patterns of fractional abundance.
Figure 5 illustrates the evaluation of the unoptimized Endmember MESMA classification in comparison to ground observations. The unoptimized MESMA model attained an overall RMSE of 23.5%, resulting in a 6% improvement in classification accuracy. Significantly, the RMSEs for principal grassland classes, such as Cynodon and Setaria, were below 25%, facilitating more accurate spatial mapping of palatable grasses. The model yielded RMSEs of 25 and 29% for bare ground, Cynodon community, and tree cover, respectively, while shrubs, Kunthii, and Setaria communities demonstrated higher RMSE values of 32, 33, and 34%, respectively. Notably, some points in Figure 4 are observed at zero, indicating discrepancies between predicted and observed cover percentages. This could be as a result of species present but not predicted due to spectral similarity or species predicted but not present due to noise, or limitations in the endmember library.
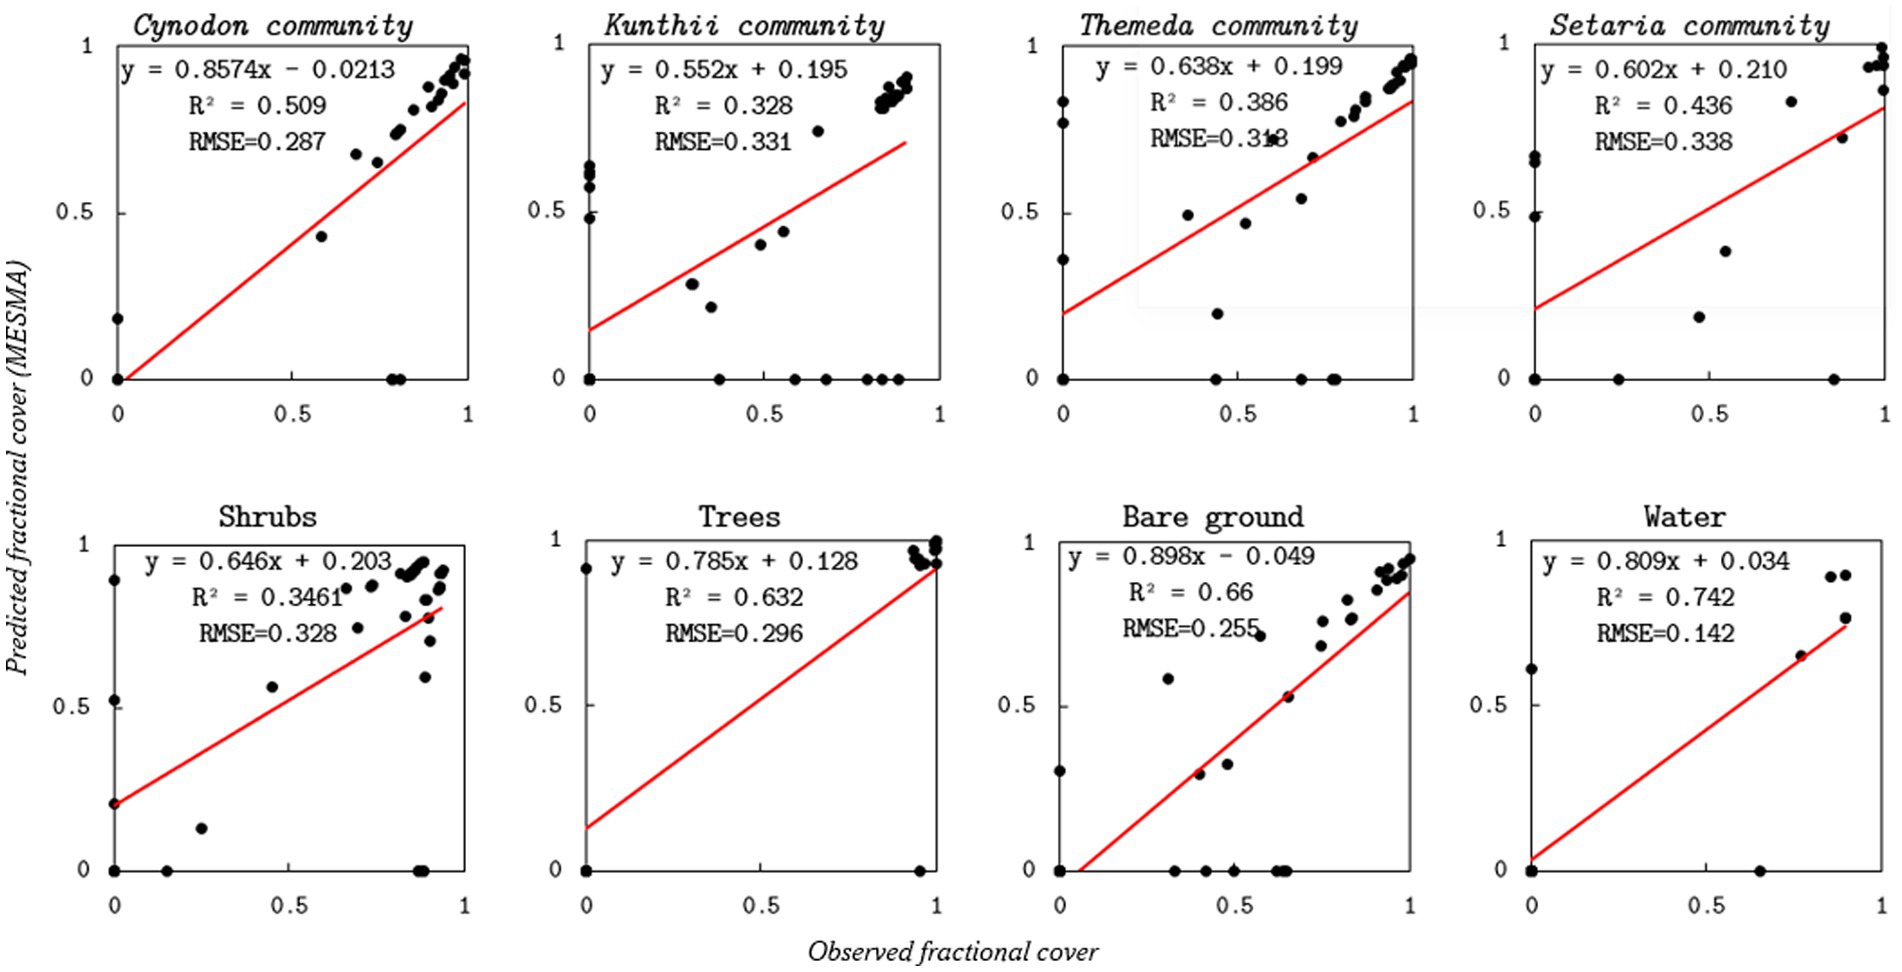
Figure 5. Scatterplots comparing unoptimized endmember MESMA-estimated grassland community and non-grassland community type cover against field-based validation data. On each panel, fitted regression lines (solid red) are displayed.
3.2.2 Optimized endmember MESMA
The Transformed Divergence (TD) values for the optimized endmember selection method demonstrated significant spectral separability among the majority of land cover classes, particularly for grassland communities such as Cynodon and Setaria. The results, presented in Supplementary Table 1, illustrate the efficacy of the optimized endmember library in distinguishing various grassland types from non-grassland cover categories.
Figure 6 illustrates the results of the optimized endmember MESMA classification. Firstly, Cynodon fractional abundance was observed in patches across various elevations and locations within the study area. Secondly, high-to-moderate fractional abundances were identified in the Kunthii and Themeda communities. Grassland communities were located in well-drained areas. Thirdly, Setaria fractional abundances were detected in the northern part of the study area; however, a significant increase in these abundances was also observed in the southwestern and eastern regions. Consistent with the unoptimized results, a high abundance of fractional shrub cover was identified toward the north of the study area. A significant decrease in the fractional abundance of shrubs was noted toward the south of the study area. Fourthly, bare ground was present throughout the study area at various elevations, across vegetation communities, and near edges at low heights. Lastly, a comparison of the fractional abundances of trees and water between the two models revealed no significant differences in the model spatial pattern outputs.
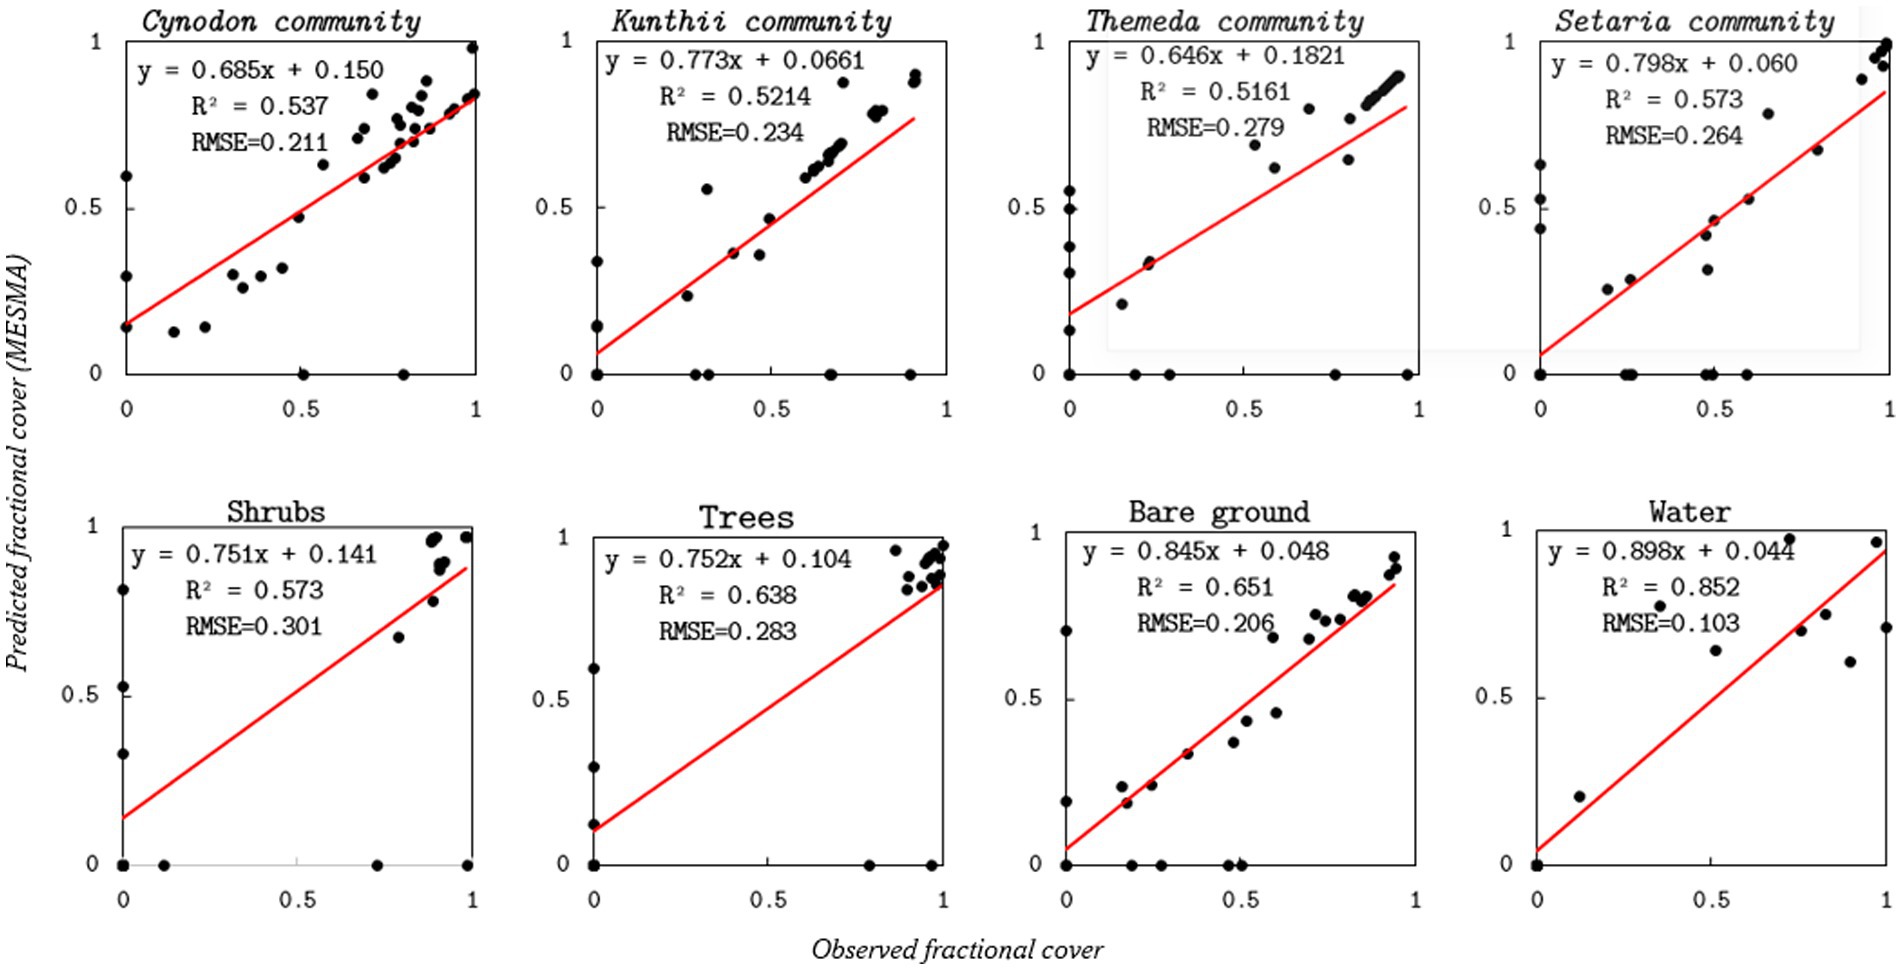
Figure 6. Scatterplots comparing optimized-endmember MESMA-estimated grassland community and control cover against field-based validation data. On each panel, fitted regression lines (solid red) are displayed.
Figure 7 illustrates the evaluation of the optimized Endmember MESMA classification in comparison to ground observations. The MESMA model significantly reduced the Root Mean Square Errors (RMSEs) across all classes, thereby enhancing the accuracy for Kunthii (10%), Cynodon (8%), Setaria (8%), and Themeda (4%). These reductions demonstrate the model’s capacity to more accurately capture fractional abundance, particularly for grassland communities with high spatial heterogeneity. Similarly, among the non-grass land-cover types, improvements in RMSEs were observed for bare ground (5%), water (4%), shrubs (3%), and trees (2%). Furthermore, a comparison of the coefficients of determination for the two models indicates that the optimized endmember MESMA also exhibited improvement for the non-grassland land cover types (R2 > 0.57) and the target grassland cover types at (R2 > 0.52). However, some points in Figure 6 are observed at zero, indicating discrepancies between predicted and observed percentages, which could be a result of spectral overlap between predicted and species present.
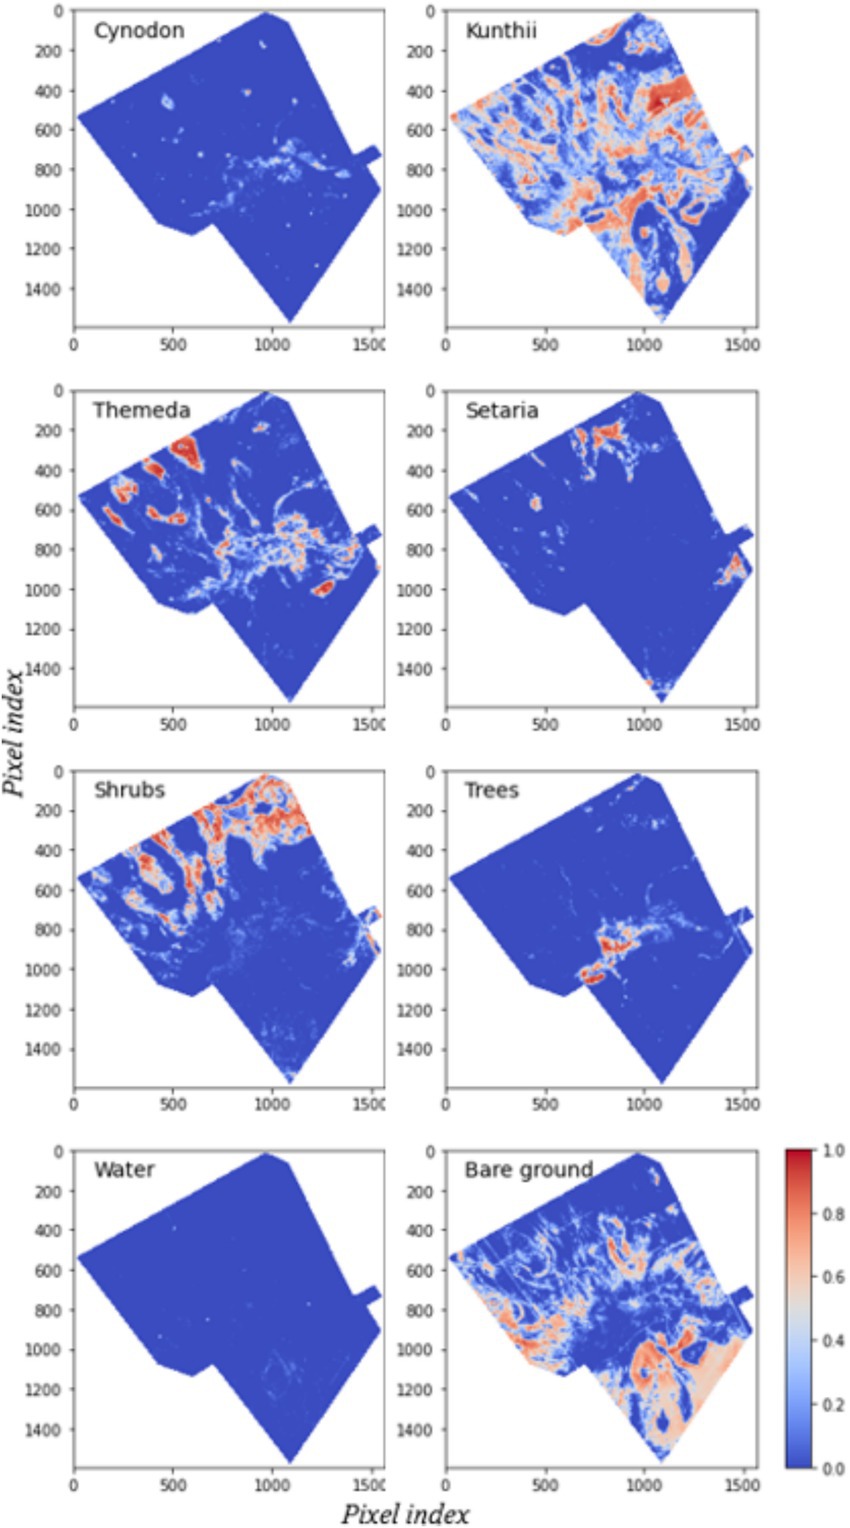
Figure 7. Fractional cover maps are generated from optimized endmember showing fractional cover values ranging from 0 (cool colors) to 1 (warm colors). Major land cover classes are annotated, and key regions of interest are highlighted to illustrate patterns of fractional abundance.
The optimized endmember MESMA model produced lower RMSE results for all the eight cover types. Thus, the optimized endmember MESMA model was used to derive the spatial palatability of the selected region.
Figure 8a illustrates the spatial distribution of the grass community and non-grassland land-cover types, while Figure 8b depicts the derived grass palatability of the Kapiti area. A palatability map was generated from the reclassified grassland community-type outputs. The map indicates fractional cover values exceeding 20%, suggesting moderate to high grass abundance. Moreover, areas with mixed grass communities and fractions surpassing 20% were deemed significant. The analysis revealed that the Kapiti area is predominantly characterized by medium-and low-palatable grass, with limited regions of highly palatable grasses. Additionally, mixed communities were identified in the central portions of the study area, and low-palatable grass (i.e., Setaria community) was observed in lowland regions.
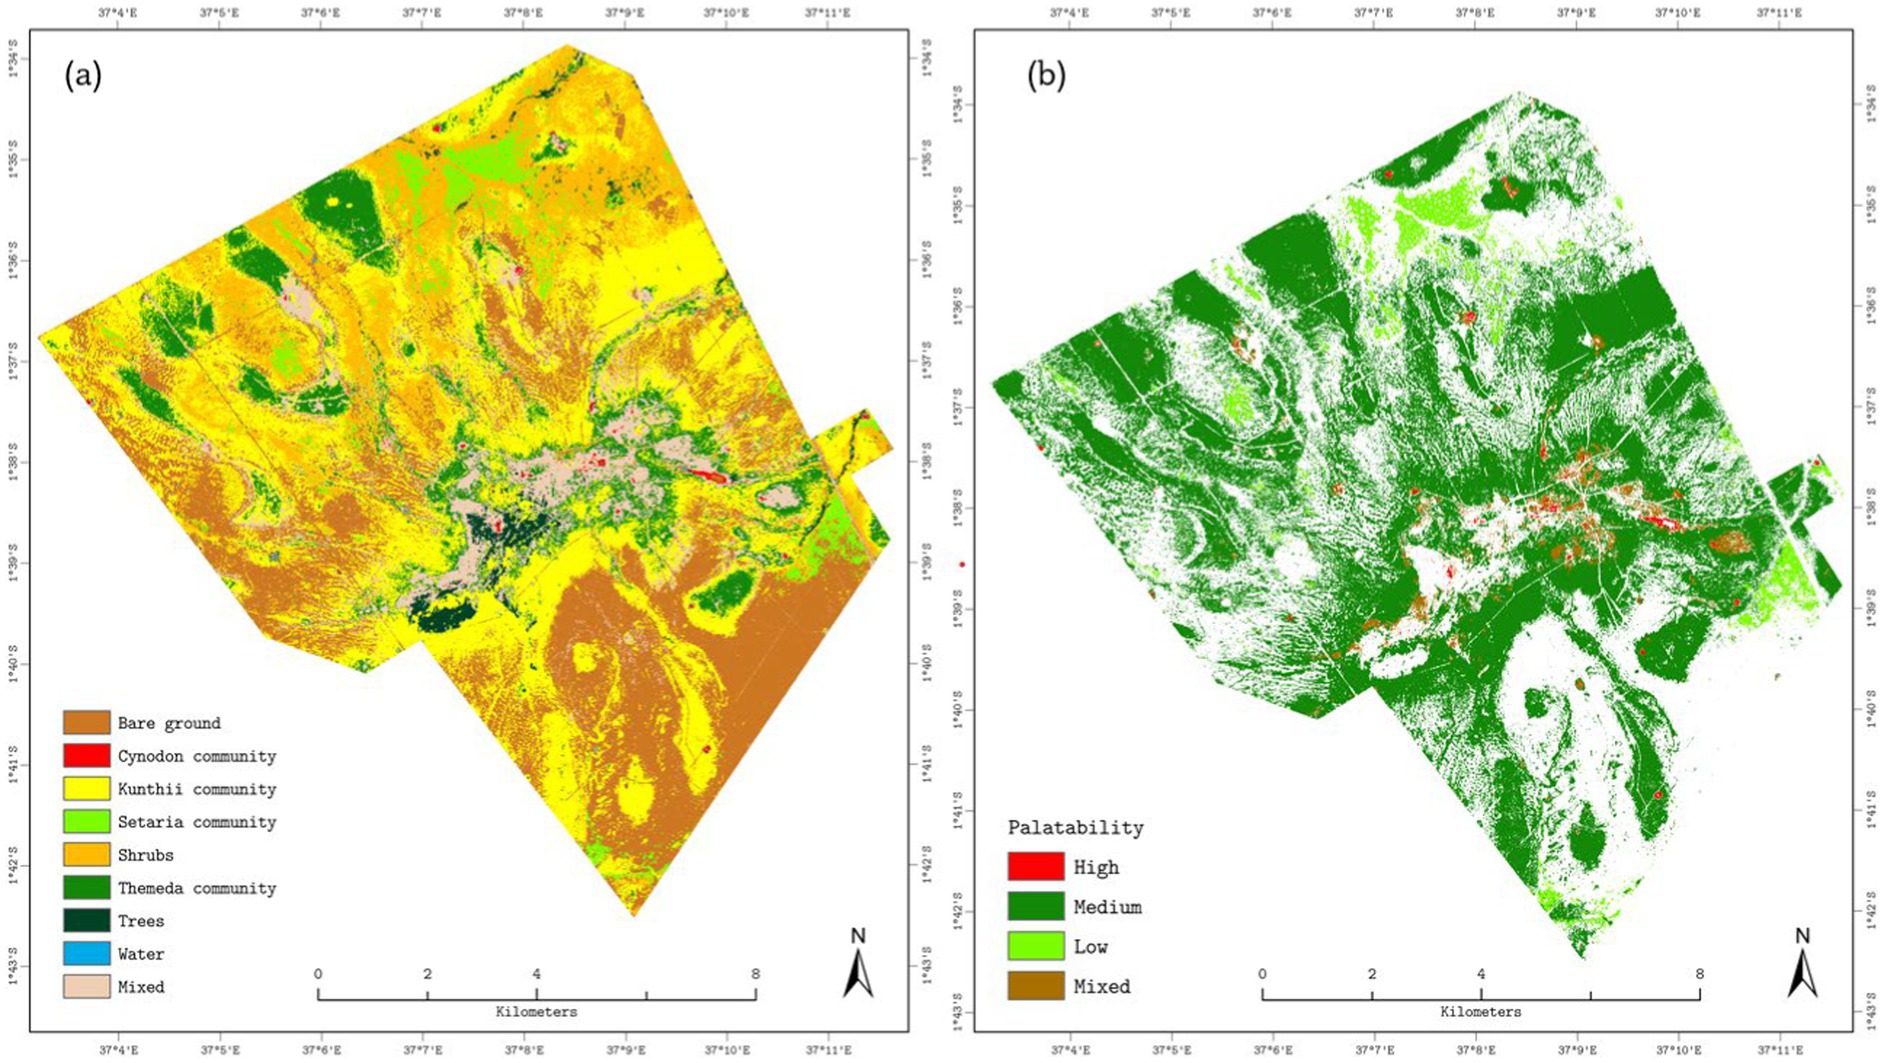
Figure 8. Vegetation composition and forage palatability at Kapiti Research Station derived from optimized endmember MESMA. (a) Dominant land-cover and plant communities: Bare ground (brown), Cynodon spp. community (red), Kunthii spp. community (yellow), Setaria spp. community (light green), Shrubs (orange), Themeda spp. community (dark green), Trees (forest green), Water (blue) and Mixed cover (beige). (b) Grassland palatability classes: High (red), Medium (dark green), Low (light green) and Mixed (brown).
Table 3 presents the performance of the classification process applied to grassland cover and community type. User accuracy (UA) reflects the precision of each class prediction. Water emerged as the most accurately predicted class, with a UA of 86.67%, whereas Themeda exhibited the lowest UA at 48.15%. Among the classes, Cynodon exhibited a UA of 70.37%, Kunthii registered 51.85%, and Setaria recorded 66.67%. Producer accuracy (PA) reveals the model’s ability to classify instances for each class correctly. Water demonstrated the highest performance in this category, with a PA of 100.00%, whereas Kunthii recorded the lowest at 51.35%. Specifically, Cynodon had a PA of 73.08%, Setaria of 60.00%, and Themeda of 72.22%. The Overall Accuracy (OA) of the model, representing the proportion of the total number of correct predictions, was 67.45%. The Kappa statistic, which accounts for chance agreement, was calculated to be 0.6338, indicating substantial agreement beyond what would be expected by chance. The classification process demonstrated varying degrees of success in correctly classifying different grassland covers and community types, with Cynodon, Kunthii, Setaria, and Themeda displaying diverse accuracies. The variances in UA and PA also provided insight into the reliability of these accuracy measurements.
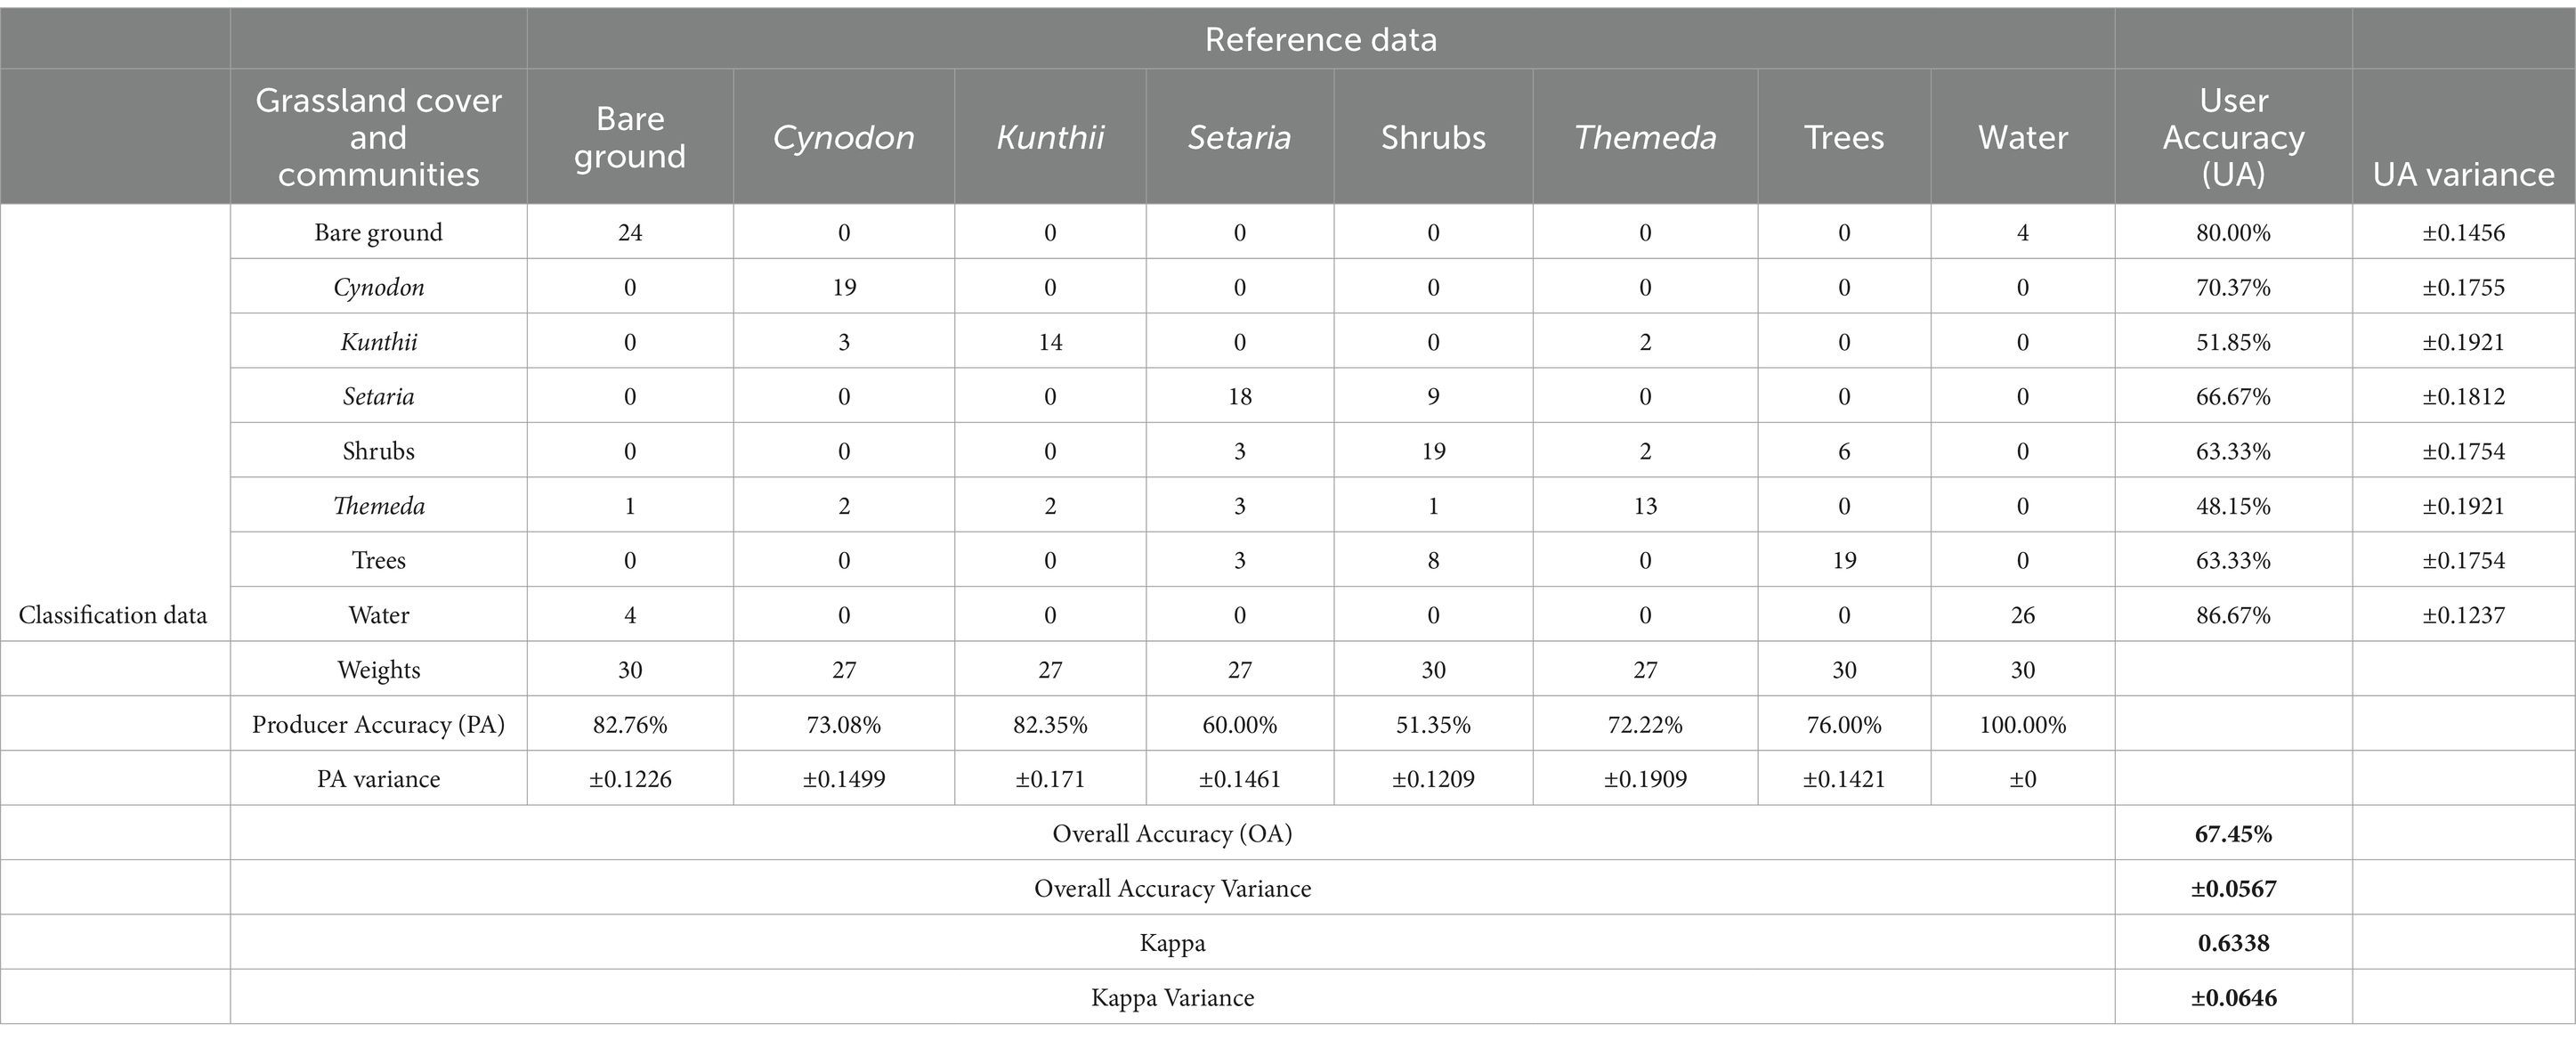
Table 3. Confusion matrix and estimation uncertainties for grassland community palatability classification at Kapiti research station.
Table 4 presents the palatability levels of the grassland community and the associated uncertainties. The analysis revealed that the grassland area with high palatability measured 24.52 hectares, with an uncertainty of ±4.303 ha. Simultaneously, grasslands categorized as medium palatability encompassed an area of 5,893.07 hectares with an estimation uncertainty of ±1,698.088 ha. Moreover, the area with low palatability measured 376.44 hectares, with an associated uncertainty of ±68.211 ha. Finally, the mixed palatability level accounted for an area of 226.72 hectares, with an estimation uncertainty of ±38.18 hectares.
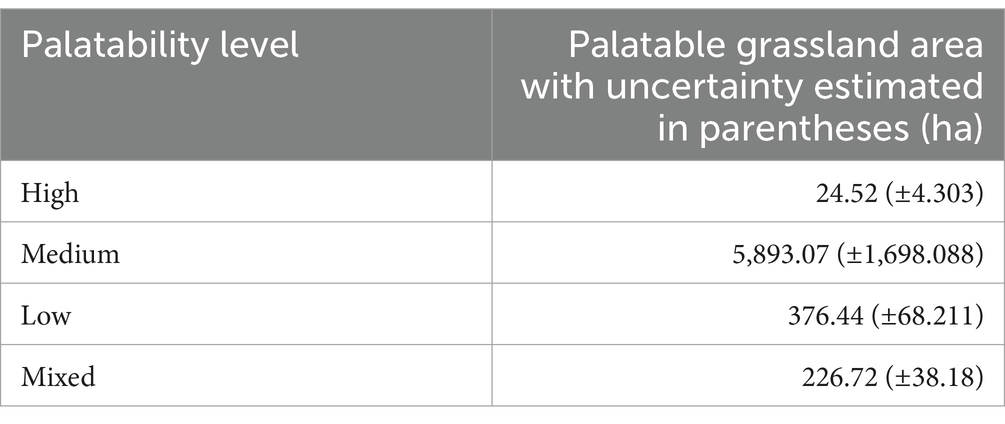
Table 4. Estimated grassland areas and associated uncertainties by palatability level at Kapiti research station.
4 Discussion
Mapping grassland communities provides a comprehensive understanding the ecosystem’s structure and function, which is important sustainable land management. Detailed spatial information on grass palatability enables pastoralists to make informed decisions about grazing patterns and optimize herd nutrition while preventing overgrazing and land degradation. This study addresses this need by employing Multiple Endmember Spectral Mixture Analysis (MESMA) of Sentinel-2 satellite imagery to distinguish grass species and communities based on their unique spectral signatures. By mapping the distribution of palatable grass communities across the semi-arid savannahs of Kenya, our optimized MESMA model significantly improved classification accuracy, achieving a root mean square error (RMSE) of 23.5%, with individual classes ranging from 10 to 30%. These results demonstrate MESMA’s effectiveness in capturing grassland heterogeneity and provide valuable insights into sustainable grassland management and livestock grazing strategies that support ecological balance and pastoral livelihoods.
4.1 Optimisation endmember spectral library
Our efforts to enhance the endmember spectral library through the Iterative Endmember Selection (IES) methodology yielded successful outcomes by considerably diminishing the number of necessary models while increasing the accuracy of each predicted land cover category. This progression is paramount for tackling computational obstacles associated with extensive spectral libraries. The substantial decrease from 81,589 three-endmember models to 402 and from 8,381,761 four-endmember models to 2,838 exemplifies the enhanced efficiency achieved through this procedure. These findings align with recent studies (Bogan et al., 2019; Fernández-García et al., 2021) that reported a decrease in computational time and resources when utilizing a limited number of MESMA endmember models in comparison to models featuring a multitude of endmembers and an increase in classification accuracy. The decrease in model quantity amplifies computational effectiveness, a critical aspect of large-scale remote sensing applications where computational capabilities are frequently constrained.
4.2 MESMA classification and accuracy assessment
Utilizing MESMA, incorporating both unoptimized and optimized endmember libraries, offered a comprehensive depiction of the spatial arrangement of diverse land cover categories and their corresponding fractional proportions. The unoptimized MESMA categorization revealed substantial fractional proportions of Kunthii spp. and Themeda spp. assemblages alongside shrubs, with noticeable inconsistencies in depicting Cynodon spp. and Setaria spp. assemblages. These inaccuracies were particularly pronounced for Kunthii and Setaria, where higher RMSE values were observed, likely because of spectral overlap caused by their similar biophysical traits, such as conopy structure. Spectral separability analysis using the Transformed Divergence (TD) metric confirmed moderate separability between these classes, highlighting the challenges in distinguishing them based solely on Sentinel-2 spectral bands. Conversely, the optimized MESMA categorization notably enhanced the precision of these fractional abundance estimations, particularly for grassland assemblage types. These results are consistent with prior research indicating enhancements in classification precision with optimized endmember libraries (Tane et al., 2018; Xu et al., 2015). In particular, the accuracy levels for the Kunthii, Cynodon, Setaria, and Themeda communities were enhanced by 10, 8, 8, and 4%, respectively. We also detected improvements in non-grass categories such as barren land, water bodies, shrubs, and forests. The overall accuracy (OA) of the optimized MESMA model (Figure 7) was 67.45%, with a kappa coefficient of 0.6338, implying considerable concurrence beyond random chance.
4.3 Spatial distribution of grass communities
Our findings support theoretical frameworks like niche differentiation and disturbance ecology. For example, Cynodon’s presence in upland areas under moderate grazing aligns with niche theory, while Setaria’s dominance in lowland areas underscores the role of soil moisture in plant community assembly, reinforcing trait-based ecology principles. These results enhance our understanding of how environmental gradients and disturbances drive species coexistence and grassland heterogeneity, crucial for predicting ecosystem responses to climate change and land-use pressures. Diverse grass communities follow distinct landscape partitions based on their ecological adaptations, reflecting broader concepts of niche differentiation, trait-based assembly, and ecological disturbances. The Setaria community thrives in low-lying, moisture-rich soils, illustrating hydric conditions’ competitive advantage, allowing these grasses to outcompete less tolerant species (Prakash et al., 2021; Rafique et al., 2021). Conversely, the Kunthii community, mainly Microchloa kunthii, occupies arid uplands, preferring coarse-textured, well-drained soils, highlighting soil characteristics’ role in species filtration and spatial variations (Ward et al., 2017).
In addition, the Cynodon community, mainly consisting of Cynodon dactylon, is situated in the central hill region, where topographical elevation generates specific microclimatic and edaphic conditions conducive to this species. The adaptive capacity of Cynodon dactylon for well-drained soils and its favorable growth response to moderate grazing disturbances illustrate the complex function of herbivory in shaping grasslands (Morgan and Salmon, 2020). The fragmentation of Cynodon patches indicates that heavy grazing diminishes vegetative biomass and affects competitive dynamics and successional pathways among desirable and resilient species (Muthoka et al., 2022; Smit et al., 2023).
The Themeda community, characterized by Themeda triandra, demonstrates the influence of intermediate environmental conditions on vegetation patterns. This community, situated on moderate slopes and in mid-elevation regions, reflects a balance between soil moisture retention and disturbance levels favorable to Themeda’s ecological strategies (Moore et al., 2019). Areas with pronounced slopes and degraded soils, characterized by shrubs and exposed Earth, signify a transition in competitive interactions, favoring species more adapted to severe environments, consequently diminishing grass prevalence (Liu et al., 2023).
These trends collectively underscore that no single factor determines community distribution. The integration of climate, terrain, soil characteristics, and grazing regimes has shaped semi-arid grasslands. Incorporating these findings with ecological theories, such as niche theory and disturbance ecology, enhances our comprehension of species coexistence, resilience, and ecosystem functionality (Carroll et al., 2023). By understanding this complex interaction, we can ultimately inform more comprehensive and adaptable management strategies, ensuring that interventions consider multiple interacting gradients and their effects on conserving biodiversity and ecosystem services in semi-arid regions (Titcomb et al., 2021).
4.4 Palatability zones
The palatability map generated provides significant insights into the regional distribution of fodder quality at the Kapiti Research Station. As depicted on the map, areas indicating a moderate to high prevalence of palatable grasses correlated closely with field observations and other regional grassland distribution studies. The diversity of grass types, comprising medium-and low-palatability species with areas of highly palatable grasses, enhances our comprehension of feed supply. These findings corroborate the current study, including Dalle (2020) and Havemann et al. (2022), who observed similar palatability trends on a larger scale. Our detailed study identified specific areas where clusters of highly palatable grasses were predominant. Such spatial differentiation demonstrates how ecological gradients, including soil drainage and topographic variations, underpin the observed variations in grass community composition.
In this study area, wildlife and livestock frequently traverse the Kapiti region in search of optimal grazing locations. These animals navigate areas along established migratory routes determined by water accessibility, topography, and food resources. The map generated in this study can serve as a crucial decision-making tool for pastoralists, who rely on visual and experiential indicators to guide their herds. By overlaying traditional movement patterns with geographical data on grass palatability, herders can strategically focus grazing in locations with elevated terrain and superior forage quality, thereby optimizing cattle nutrition. Conversely, they may avoid sections characterized by low palatability grasses typically associated with poorly drained soils and lower altitudes, thus minimizing the time and energy expended in less productive areas. This evidence-based approach may enhance cattle health, improve productivity, and reduce overgrazing stress in sensitive areas, fostering sustainable pastoral livelihoods.
4.5 Implications and future directions
4.5.1 Practical implications for sustainable grassland management
The findings of this study offer actionable insights into sustainable grazing management and land protection in semi-arid savanna grasslands. The palatability maps generated in this study provide valuable insights for pastoralists and land managers to optimize livestock grazing routes and enhance nutrition while mitigating overgrazing. Similarly, land managers, can use these maps to targeted restoration, such as reseeding in low-palatability zones and promoting ecological resilience.
These outputs align with the needs of policymakers at both county and national levels. At the county level, governments can leverage the spatial distribution of palatable grasses to design rotational grazing plans that align with seasonal forage availability and reduce the pressure on degraded areas. At the national level, the findings contribute to evidence-based recommendations for rangeland management policies, support biodiversity conservation, and combat land degradation across semi-arid regions. Furthermore, integrating these insights into climate adaptation frameworks can enhance ecosystem resilience and ensure food security in pastoral communities. By mapping optimal grazing zones and identifying high-risk areas for degradation, policymakers can develop adaptive strategies to address the dual challenges of climate variability and increased grazing pressure.
This study emphasizes the scalability of the MESMA framework. This approach is transferable to other semi-arid regions in Kenya and East Africa, including Laikipia, Narok, Kajiado, and parts of Tanzania and Ethiopia. While the Kapiti Research Station provides a robust dataset for validating the MESMA model, it is important to note that the findings may vary in other Kenyan or East Africa savannas owing to differences in environmental conditions, grazing pressures, and species compositions. For example, regions with higher rainfall or different soil types may exhibit distinct vegetation patterns. We recommend conducting additional validation studies in diverse ecosystems, such as the Laikipia Plateau and Serengeti Plains, to assess the model’s generalizability and refine its application across various landscapes. These regions share ecological similarities with the Kapiti Research Station, such as rainfall variability, soil type, and dominant grass species, making them suitable candidates for model application. To ensure successful scalability, we recommend site-specific calibration using ground-truth data to refine spectral libraries and validate models, accounting for local variations in vegetation composition and environmental conditions.
However, the implementation of these strategies faces obstacles, including pastoralists’ limited access to geospatial tools and resource constraints for large-scale land management. Addressing these challenges requires capacity-building initiatives, such as training pastoralists to interpret palatability maps, and policy interventions to fund restoration programs.
4.5.2 Future research
Despite these contributions, this study highlights several avenues for future research. A key limitation is the reliance on single-season Sentinel-2 imagery, which may not adequately capture the seasonal variations in grassland composition and palatability. Future studies should integrate multi-seasonal or multi-year datasets to assess the temporal dynamics better and improve the accuracy of palatability assessments.
Additionally, incorporating hyperspectral imaging could enhance spectral differentiation among closely related grass species, enabling a more precise evaluation of fodder quality based on plant chemical properties such as protein and fiber content. Hyperspectral data could also resolve the classification ambiguities observed in this study, particularly for medium-palatability species such as Setaria and Kunthii, where spectral overlap may lead to misclassification.
Systematic field sampling can quantify plant biomass, nutritional composition, and digestibility across various locations and seasons, providing a comprehensive reference dataset for calibrating and validating remote sensing indices. Field initiatives may include long-term vegetation monitoring plots, soil moisture assessments, and physiological stress indicators in plants, all of which could enhance our understanding of grassland ecology. Expanding validation efforts to encompass more diverse sampling sites would further augment the generalizability of the findings.
Lastly, the integration of livestock movement data, such as GPS tracking, with palatability maps could yield more comprehensive insights into the interplay between grazing patterns and forage availability. This integration would help refine spatial predictions of palatability and address areas where the model underestimates or overestimates species presence, as observed in Figures 4, 6.
5 Conclusion
This research contributes to the field of remote sensing by illustrating the effectiveness of the MESMA algorithm in delineating the spatial distribution and palatability of grassland communities within semi-arid Kenyan savannas. The findings present valuable strategies for optimizing sustainable grazing practices, enhancing livestock productivity, and guiding rangeland management policies through the provision of actionable data on forage availability and grassland heterogeneity. By employing Sentinel-2 multispectral imagery, this study highlights the sensor’s capacity to characterize and map grassland communities at the pixel fraction level, thus yielding crucial information on fine-scale spatial heterogeneity. This detailed data is fundamental for elucidating vegetation dynamics and productivity within these intricate ecosystems.
The optimized MESMA approach significantly enhanced fractional abundance mapping, providing more robust insights into grassland composition and palatability. The integration of literature on the nutritional value of grassland communities as a proxy for palatability further augments the contribution of this study to the nuanced understanding of grassland dynamics.
The findings of this study will provide policymakers and land managers with essential spatial data to develop targeted grazing systems, optimize restoration efforts in degraded areas, and mitigate overgrazing. Through the integration of these insights into rangeland management policies, stakeholders can enhance the resilience of semi-arid ecosystems while safeguarding the livelihoods of pastoral communities. This knowledge is crucial for improving the socioeconomic conditions of pastoral communities and promoting sustainable grassland management practices that are vital in semi-arid savannah ecosystems.
Ultimately, this study underscores the critical importance of advanced remote sensing techniques, specifically those employing Sentinel-2, in enhancing our comprehension of semi-arid grassland ecosystems. By facilitating more accurate mapping and characterization of grassland communities, this research makes a substantial contribution to the development of strategies for improving pasture management, a crucial factor in sustaining the socioeconomic wellbeing of pastoral communities and preserving the ecological integrity of semi-arid savanna grasslands.
Data availability statement
The datasets presented in this study can be found in online repositories. The names of the repository/repositories and accession number(s) can be found at: https://doi.org/10.25377/sussex.28945880.
Author contributions
JM: Conceptualization, Data curation, Formal analysis, Investigation, Methodology, Software, Validation, Visualization, Writing – original draft, Writing – review & editing. PR: Funding acquisition, Supervision, Writing – original draft, Writing – review & editing. ES: Supervision, Writing – original draft, Writing – review & editing. HB: Supervision, Writing – original draft, Writing – review & editing. AA: Supervision, Writing – original draft, Writing – review & editing.
Funding
The author(s) declare that financial support was received for the research and/or publication of this article. This research was supported by the NERC Science for Humanitarian Emergencies and Resilience Studentship Cohort (SHEAR SSC) grant number NE/R007799/1, and the SHEAR ForPAc project grant number NE/P000673/1. HB was supported by NERC through the National Centre for Earth Observation.
Acknowledgments
We want to express our gratitude to the ILRI and its staff for granting access to and using the Kapiti research station for the experimental setup and data collection. Anton Vrieling was supported by the Dutch Research Council (NWO) and the Space for Global Development (WOTRO) program as part of the CGIAR-Netherlands partnership. The use of the DTM (Figure 1) is attributed to the United Kingdom. The Space Agency and King’s College London were purchased for their collaborative PRISE project. We are also grateful to the School of Global Studies for supplying phenocams via the Physical Geography Lab. In addition, we thank Mr. Stephan M. Hennekens for assistance with taxonomy data integration using the TURBOVEG software. Furthermore, we thank Mr. John Musembi and Miss Abby Carol from the University of Nairobi’s Department of Land Resource Management and Agricultural Technology for their help with data collection and laboratory analysis.
Conflict of interest
The authors declare that the research was conducted in the absence of any commercial or financial relationships that could be construed as a potential conflict of interest.
Generative AI statement
The authors declare that Gen AI was used in the creation of this manuscript. This was used in editing and grammar checks (Open Paperpal and Grammarly).
Publisher’s note
All claims expressed in this article are solely those of the authors and do not necessarily represent those of their affiliated organizations, or those of the publisher, the editors and the reviewers. Any product that may be evaluated in this article, or claim that may be made by its manufacturer, is not guaranteed or endorsed by the publisher.
Supplementary material
The Supplementary material for this article can be found online at: https://www.frontiersin.org/articles/10.3389/fsufs.2025.1543491/full#supplementary-material
References
Amwata, D. A., Nyariki, D. M., and Musimba, N. R. K. (2016). Factors influencing pastoral and agropastoral household vulnerability to food insecurity in the drylands of Kenya: a case study of Kajiado and Makueni counties. J. Int. Dev. 28, 771–787. doi: 10.1002/JID.3123
Anderson, T. M., Starmer, W. T., and Thorne, M. (2007). Bimodal root diameter distributions in Serengeti grasses exhibit plasticity in response to defoliation and soil texture: implications for nitrogen uptake. Funct. Ecol. 21, 50–60. doi: 10.1111/j.1365-2435.2006.01192.x
Bogan, S. A., Antonarakis, A. S., and Moorcroft, P. R. (2019). Imaging spectrometry-derived estimates of regional ecosystem composition for the Sierra Nevada, California. Remote Sens. Environ. 228, 14–30. doi: 10.1016/J.RSE.2019.03.031
Boonman, J. G. (1993). East Africa’s grasses and fodders: their ecology and husbandry. Dordrecht: Springer Netherlands.
Braun-Blanquet, J. (1932). Plant sociology: the study of plant communities : McGraw-Hill Book Co. Inc. Available at: https://www.cabidigitallibrary.org/doi/full/10.5555/19331600801
Caroline King-Okumu, B., Caroline King-Okumu, B., and Yimer, E. (2015). Pastoralism pays: new evidence from the Horn of Africa : IIED Publications Library. Avaiulable at: https://dlci-hoa.org
Carroll, T., Cardou, F., Dornelas, M., Thomas, C. D., and Vellend, M. (2023). Biodiversity change under adaptive community dynamics. Glob. Change Biol. 29, 3525–3538. doi: 10.1111/gcb.16680
Catley, A., Lind, J., and Scoones, I. (2016). The futures of pastoralism in the horn of Africa: pathways of growth and change. Rev. Sci. Tech. OIE 35, 389–403. doi: 10.20506/rst.35.2.2524
Chabalala, Y., Adam, E., Oumar, Z., and Ramoelo, A. (2020). Exploiting the capabilities of Sentinel-2 and RapidEye for predicting grass nitrogen across different grass communities in a protected area. Appl. Geomat. 12, 379–395. doi: 10.1007/S12518-020-00305-8
Chen, Y., Ge, Y., Chen, Y., Jin, Y., and An, R. (2018). Subpixel land cover mapping using multiscale spatial dependence. IEEE Trans. Geosci. Remote Sens. 56, 5097–5106. doi: 10.1109/TGRS.2018.2808410
Chen, Y., Guerschman, J., Shendryk, Y., Henry, D., and Harrison, M. T. (2021). Estimating pasture biomass using Sentinel-2 imagery and machine learning. Remote Sens. 13:603. doi: 10.3390/rs13040603
Chen, L., Sofia, G., Qiu, J., Wang, J., and Tarolli, P. (2023). Grassland ecosystems resilience to drought: the role of surface water ponds. Land Degrad. Dev. 34, 1960–1972. doi: 10.1002/ldr.4581
Cheng, Y., Vrieling, A., Fava, F., Meroni, M., Marshall, M., and Gachoki, S. (2020). Phenology of short vegetation cycles in a Kenyan rangeland from PlanetScope and Sentinel-2. Remote Sens. Environ. 248:112004. doi: 10.1016/J.RSE.2020.112004
Dabasso, B. H., Oba, G., and Roba, H. G. (2012). Livestock-based knowledge of rangeland quality assessment and monitoring at landscape level among borana herders of northern Kenya. Pastoralism 2, 1–13. doi: 10.1186/2041-7136-2-2/FIGURES/2
Dalle, G. (2020). Evaluation of forage quantity and quality in the semi-arid Borana lowlands, southern Oromia, Ethiopia. Trop. Grassl.-Forrajes Trop. 8, 72–85. doi: 10.17138/TGFT(8)72-85
Dube, T., Pandit, S., Shoko, C., Ramoelo, A., Mazvimavi, D., and Dalu, T. (2019). Numerical assessments of leaf area index in tropical savanna rangelands, South Africa using Landsat 8 OLI derived metrics and in-situ measurements. Remote Sens. 11:829. doi: 10.3390/RS11070829
Euclides, V. P., Montagner, D. B., Macedo, M. C. M., de Araújo, A. R., Difante, G. S., and Barbosa, R. A. (2019). Grazing intensity affects forage accumulation and persistence of Marandu palisadegrass in the Brazilian savannah. Grass Forage Sci. 74, 450–462. doi: 10.1111/gfs.12422
Evans, L. A., and Adams, W. M. (2016). Fencing elephants: the hidden politics of wildlife fencing in Laikipia, Kenya. Land Use Policy 51, 215–228. doi: 10.1016/J.LANDUSEPOL.2015.11.008
Faghihinia, M., Zou, Y., Bai, Y., Dudáš, M., Marrs, R., and Staddon, P. L. (2021). Grazing intensity rather than host plant’s palatability shapes the community of arbuscular mycorrhizal fungi in a steppe grassland. Microb. Ecol. 84, 1–10. doi: 10.1007/s00248-021-01920-7
FAO (2005). Grasslands of the world : Food & Agriculture Organisation. Available at: https://www.fao.org/4/y8344e/y8344e05.htm
Fauvel, M., Lopes, M., Dubo, T., Rivers-Moore, J., Frison, P. L., Gross, N., et al. (2020). Prediction of plant diversity in grasslands using Sentinel-1 and -2 satellite image time series. Remote Sens. Environ. 237:111536. doi: 10.1016/J.RSE.2019.111536
Fernández-García, V., Marcos, E., Fernández-Guisuraga, J. M., Fernández-Manso, A., Quintano, C., Suárez-Seoane, S., et al. (2021). Multiple endmember spectral mixture analysis (MESMA) applied to the study of habitat diversity in the fine-grained landscapes of the Cantabrian Mountains. Remote Sens. 13:979. doi: 10.3390/RS13050979
Ferner, J., Linstädter, A., Rogass, C., Südekum, K. H., and Schmidtlein, S. (2021). Towards forage resource monitoring in subtropical savanna grasslands: going multispectral or hyperspectral? Eur. J. Remote Sens. 54, 364–384. doi: 10.1080/22797254.2021.1934556
Ge, Y., Chen, Y., Stein, A., Li, S., and Hu, J. (2016). Enhanced subpixel mapping with spatial distribution patterns of geographical objects. IEEE Trans. Geosci. Remote Sens. 54, 2356–2370. doi: 10.1109/TGRS.2015.2499790
Githae, E. W. (2018). Status of Opuntia invasions in the arid and semi-arid lands of Kenya. CAB Rev. Perspect. Agric. Vet. Sci. Nutr. Nat. Resour. 13, 1–9. doi: 10.1079/PAVSNNR201813003
Hamada, Y., Stow, D. A., and Roberts, D. A. (2011). Estimating life-form cover fractions in California sage scrub communities using multispectral remote sensing. Remote Sens. Environ. 115, 3056–3068. doi: 10.1016/j.rse.2011.06.008
Havemann, C. P., Retief, T. A., Collins, K., Fynn, R. W. S., Tosh, C. A., and de Bruyn, P. J. N. (2022). Home range and habitat use of roan antelope Hippotragus equinus in northern Botswana. J. Arid Environ. 196:104648. doi: 10.1016/j.jaridenv.2021.104648
Hill, M. J., and Guerschman, J. P. (2020). The MODIS global vegetation fractional cover product 2001–2018: characteristics of vegetation fractional cover in grasslands and savanna woodlands. Remote Sens. 12:406. doi: 10.3390/rs12030406
Hosaka, E. (1957). Palatability and nutritive value of forages. Available at: https://core.ac.uk/download/pdf/211321808.pdf
Hou, L., Xin, X., Shen, B., Qin, Q., Altome, A. I. A., Hamed, Y. M. Z., et al. (2023). Effects of long-term grazing on feed intake and digestibility of cattle in meadow steppe. Agronomy 13:1760. doi: 10.3390/agronomy13071760
Jawuoro, S. O., Koech, O. K., Karuku, G. N., and Mbau, J. S. (2017). Plant species composition and diversity depending on piospheres and seasonality in the southern rangelands of Kenya. Ecol. Process. 6, 1–9. doi: 10.1186/S13717-017-0083-7
Keba, H. T., Madakadze, I. C., Angassa, A., and Hassen, A. (2013). Nutritive value of grasses in semi-arid rangelands of Ethiopia: local experience based herbage preference evaluation versus laboratory analysis. Asian Australas. J. Anim. Sci. 26, 366–377. doi: 10.5713/AJAS.2012.12551
Knuesting, J., Brinkmann, M. C., Silva, B., Schorsch, M., Bendix, J., Beck, E., et al. (2018). Who will win where and why? An ecophysiological dissection of the competition between a tropical pasture grass and the invasive weed bracken over an elevation range of 1000 m in the tropical Andes. PLoS One 13:e0202255. doi: 10.1371/journal.pone.0202255
Li, X., Ling, F., and Du, Y.. (2010). Characterizing sub-pixel landscape patterns from remotely sensed imagery with sub-pixel mapping methods. in: Presented at the 2010 18th international conference on Geoinformatics, pp. 1–5.
Li, J., Pei, Y., Zhao, S., Xiao, R., Sang, X., and Zhang, C. (2020). A review of remote sensing for environmental monitoring in China. Remote Sens. 12:1130. doi: 10.3390/rs12071130
Ling, F., Du, Y., Li, X., Zhang, Y., Xiao, F., Fang, S., et al. (2014). Superresolution land cover mapping with multiscale information by fusing local smoothness prior and downscaled coarse fractions. IEEE Trans. Geosci. Remote Sens. 52, 5677–5692. doi: 10.1109/TGRS.2013.2291902
Ling, F., Li, X., Du, Y., and Xiao, F. (2013). Sub-pixel mapping of remotely sensed imagery with hybrid intra-and inter-pixel dependence. Int. J. Remote Sens. 34, 341–357. doi: 10.1080/01431161.2012.705441
Liu, Y., Yang, P., Zhang, Z., Zhang, W., Wang, Z., Zhang, Z., et al. (2021). Diverse responses of grassland dynamics to climatic and anthropogenic factors across the different time scale in China. Ecol. Indic. 132:108341. doi: 10.1016/j.ecolind.2021.108341
Liu, X., Zhou, W., Li, X., Zhang, Y., and Dong, W. (2023). Secondary succession of shrub-herb communities in the hilly area of Taihang Mountain. Front. Plant Sci. 14:1194083. doi: 10.3389/fpls.2023.1194083
Lyu, X., Li, X., Gong, J., Wang, H., Dang, D., Dou, H., et al. (2020). Comprehensive grassland degradation monitoring by remote sensing in Xilinhot, Inner Mongolia, China. Sustainability 12:3682. doi: 10.3390/su12093682
Main-Knorn, M., Pflug, B., Louis, J., Debaecker, V., Müller-Wilm, U., and Gascon, F. (2017). “Sen2Cor for Sentinel-2” in Image and signal processing for remote sensing XXIII, vol. 10427 (SPIE), 37–48. Available at: https://www.spiedigitallibrary.org/conference-proceedings-of-spie/10427/2278218/Sen2Cor-for-Sentinel-2/10.1117/12.2278218.short
Mganga, K. Z., Kaindi, E., Ndathi, A. J., Bosma, L., Kioko, T., Kadenyi, N., et al. (2021). Plant morphoecological traits, grass-weed interactions and water use efficiencies of grasses used for restoration of African rangelands. Front. Ecol. Evol. 8:613835. doi: 10.3389/fevo.2020.613835
Mganga, K. Z., Musimba, N., Nyariki, D., Nyangito, M., and Mwang’ombe, A. W. (2015). The choice of grass species to combat desertification in semi-arid Kenyan rangelands is greatly influenced by their forage value for livestock. Grass Forage Sci. 70, 161–167. doi: 10.1111/gfs.12089
Moore, N. A., Camac, J. S., and Morgan, J. W. (2019). Effects of drought and fire on resprouting capacity of 52 temperate Australian perennial native grasses. New Phytol. 221, 1424–1433. doi: 10.1111/nph.15480
Morgan, J. W., and Salmon, K. L. (2020). Dominant C3 tussock grasses are resilient to the re-introduction of fire in long-unburned temperate grasslands. Appl. Veg. Sci. 23, 149–158. doi: 10.1111/avsc.12476
Muthoka, J. M., Antonarakis, A. S., Vrieling, A., Fava, F., Salakpi, E. E., and Rowhani, P. (2022). Assessing drivers of intra-seasonal grassland dynamics in a Kenyan savannah using digital repeat photography. Ecol. Indic. 142:109223. doi: 10.1016/j.ecolind.2022.109223
Muthoka, J. M., Salakpi, E. E., Ouko, E., Yi, Z.-F., Antonarakis, A. S., and Rowhani, P. (2021). Mapping Opuntia stricta in the arid and semi-arid environment of Kenya using Sentinel-2 imagery and ensemble machine learning classifiers. Remote Sens. 13:1494. doi: 10.3390/rs13081494
Negrón, M., López, I., and Dörner, J. (2019). Consequences of intensive grazing by dairy cows of contrasting live weights on volcanic ash topsoil structure and pasture dynamics. Soil Tillage Res. 189, 88–97. doi: 10.1016/j.still.2018.12.025
Phiri, D., Simwanda, M., Salekin, S., Nyirenda, V. R., Murayama, Y., and Ranagalage, M. (2020). Sentinel-2 data for land cover/use mapping: a review. Remote Sens. 12:2291. doi: 10.3390/rs12142291
Prakash, P. T., Banan, D., Paul, R. E., Feldman, M. J., Xie, D., Freyfogle, L., et al. (2021). Correlation and co-localization of QTL for stomatal density, canopy temperature, and productivity with and without drought stress in Setaria. J. Exp. Bot. 72, 5024–5037. doi: 10.1093/jxb/erab166
Quintano, C., Fernández-Manso, A., Shimabukuro, Y. E., and Pereira, G. (2012). Spectral unmixing. Int. J. Remote Sens. 33, 5307–5340. doi: 10.1080/01431161.2012.661095
Rafique, T., Hameed, M., Naseer, M., Rafique, R., Sadiq, R., Zikreae, A., et al. (2021). Comparative leaf anatomy of grasses (Poaceae) in Faisalabad region of Pakistan. Polish J. Environ. Stud. 30, 5701–5709. doi: 10.15244/pjoes/136043
Reinermann, S., Asam, S., and Kuenzer, C. (2020). Remote sensing of grassland production and management—a review. Remote Sens. 12:1949. doi: 10.3390/rs12121949
Roberts, D. A., Gardner, M., Church, R., Ustin, S., Scheer, G., and Green, R. O. (1998). Mapping chaparral in the Santa Monica Mountains using multiple endmember spectral mixture models. Remote Sens. Environ. 65, 267–279. doi: 10.1016/S0034-4257(98)00037-6
Roberts, D. A., Quattrochi, D. A., Hulley, G. C., Hook, S. J., and Green, R. O. (2012). Synergies between VSWIR and TIR data for the urban environment: an evaluation of the potential for the hyperspectral infrared imager (HyspIRI) decadal survey mission. Remote Sens. Environ 117, 83–101. doi: 10.1016/j.rse.2011.07.021
Roberts, D. A., Smith, M. O., and Adams, J. B. (1993). Green vegetation, nonphotosynthetic vegetation, and soils in AVIRIS data. Remote Sens. Environ. 44, 255–269. doi: 10.1016/0034-4257(93)90020-X
Smit, C., Buyens, I. P., and le Roux, P. C. (2023). Vegetation patch dynamics in rangelands: How feedbacks between large herbivores, vegetation and soil fauna alter patches over space and through time. Appl. Veg. Sci. 26:e12747.
Smrithy, V., Kulkarni, A., Shigwan, B. K., Porembski, S., and Datar, M. N. (2023). Desiccation-tolerant vascular plants from Western Ghats, India: review, updated checklist, future prospects and new insights. Nord. J. Bot. 2023:e03939. doi: 10.1111/njb.03939
Strum, S. C., Stirling, G., and Mutunga, S. K. (2015). The perfect storm: land use change promotes Opuntia stricta’s invasion of pastoral rangelands in Kenya. J. Arid Environ. 118, 37–47. doi: 10.1016/j.jaridenv.2015.02.015
Tane, Z., Roberts, D., Veraverbeke, S., Casas, Á., Ramirez, C., and Ustin, S. (2018). Evaluating endmember and band selection techniques for multiple endmember spectral mixture analysis using post-fire imaging spectroscopy. Remote Sens. 10:389. doi: 10.3390/rs10030389
Tilahun, M., Angassa, A., and Abebe, A. (2017). Community-based knowledge towards rangeland condition, climate change, and adaptation strategies: the case of Afar pastoralists. Ecol. Process. 6, 1–13. doi: 10.1186/s13717-017-0094-4
Titcomb, G. C., Amooni, G., Mantas, J. N., and Young, H. S. (2021). The effects of herbivore aggregations at water sources on savanna plants differ across soil and climate gradients. Ecol. Appl. 31:e02422. doi: 10.1002/eap.2422
Turner, M. D., and Schlecht, E. (2019). Livestock mobility in sub-Saharan Africa: a critical review. Pastoralism 9, 1–15. doi: 10.1186/s13570-019-0150-z
Vujanović, D., Losapio, G., Milić, S., and Milić, D. (2022). The impact of multiple species invasion on soil and plant communities increases with invasive species co-occurrence. Front. Plant Sci. 13:875824. doi: 10.3389/fpls.2022.875824
Wachendorf, M., Fricke, T., and Möckel, T. (2018). Remote sensing as a tool to assess botanical composition, structure, quantity and quality of temperate grasslands. Grass Forage Sci. 73, 1–14. doi: 10.1111/gfs.12312
Ward, D., Kirkman, K., and Tsvuura, Z. (2017). An African grassland responds similarly to long-term fertilization to the park grass experiment. PLoS One 12:e0177208. doi: 10.1371/journal.pone.0177208
Watuwaya, B. K., Syamsu, J. A., Budiman, B., and Useng, D. (2022). Forage productivity in native grasslands of Haharu sub-district, east Sumba District, Indonesia. Biodiversitas J. Biol. Divers. 23:3. doi: 10.13057/biodiv/d230321
Weiss, W. P., and Hall, M. B. (2020). Laboratory methods for evaluating forage quality. Forages Sci. Grassl. Agric. 2, 659–672. doi: 10.1002/9781119436669.ch36
Werger, M. J. A. (1974). On concepts and techniques applied in the Ziirich-Montpellier method of vegetation survey. Bothalia 11, 309–323. doi: 10.4102/abc.v11i3.1477
Xu, Y., Shi, J., and Du, J. (2015). An improved endmember selection method based on vector length for MODIS reflectance channels. Remote Sens. 7, 6280–6295. doi: 10.3390/rs70506280
Yang, Y., Tilman, D., Furey, G., and Lehman, C. (2019). Soil carbon sequestration accelerated by restoration of grassland biodiversity. Nat. Commun. 10, 1–7. doi: 10.1038/s41467-019-08636-w
Ziech, M. F., Olivo, C. J., Ziech, A. R. D., Meinerz, G. R., Gagstetter, A. L., and Cullmann, J. R. (2016). Responses of Cynodon pastures mixed with forage peanut in southwestern Paraná, Brazil. Semina Ciênc. Agrár. 37, 4193–4202. doi: 10.5433/1679-0359.2016v37n6p4193
Zwick, M., Cardoso, J. A., Gutiérrez-Zapata, D. M., Cerón-Muñoz, M., Gutiérrez, J. F., Raab, C., et al. (2024). Pixels to pasture: using machine learning and multispectral remote sensing to predict biomass and nutrient quality in tropical grasslands. Remote Sens. Appl. Soc. Environ. 36:101282. doi: 10.1016/j.rsase.2024.101282
Keywords: MESMA, rangeland, pasture, remote sensing, grassland, Kenya
Citation: Muthoka JM, Rowhani P, Salakpi EE, Balzter H and Antonarakis AS (2025) Classification of grassland community types and palatable pastures in semi-arid savannah grasslands of Kenya using multispectral Sentinel-2 imagery. Front. Sustain. Food Syst. 9:1543491. doi: 10.3389/fsufs.2025.1543491
Edited by:
Víctor Fernández García, Université de Lausanne, SwitzerlandReviewed by:
Simon Taugourdeau, Centre de Coopération Internationale en Recherche Agronomique pour le Développement (CIRAD), FranceRobai Liambila, Jomo Kenyatta University of Agriculture and Technology, Kenya
Copyright © 2025 Muthoka, Rowhani, Salakpi, Balzter and Antonarakis. This is an open-access article distributed under the terms of the Creative Commons Attribution License (CC BY). The use, distribution or reproduction in other forums is permitted, provided the original author(s) and the copyright owner(s) are credited and that the original publication in this journal is cited, in accordance with accepted academic practice. No use, distribution or reproduction is permitted which does not comply with these terms.
*Correspondence: James M. Muthoka, ai5tdXRob2thQHN1c3NleC5hYy51aw==