 Tianyang Chen1
 Zheng Guo
 Giri Raj Kattel
- 1School of Geographical Sciences, Nanjing University of Information Science & Technology, Nanjing, China
- 2Key Laboratory of Watershed Geographic Sciences, Nanjing Institute of Geography and Limnology, Chinese Academy of Sciences, Nanjing, China
- 3Department of Infrastructure Engineering, The University of Melbourne, Melbourne, VIC, Australia
- 4Department of Hydraulic Engineering, Tsinghua University, Beijing, China
The diversity of urban residents’ dietary in China has increased with socioeconomic development. However, still there is a prominent problem of unbalanced and inadequate regional development of diet. Exploring the characteristics of the dietary structure of urban residents in China as expressed by Dietary Structure Index (DSI) holds greater significance for healthier China. This paper analyzes the spatiotemporal differentiation and influencing factors of the DSI of Chinese urban residents, and concludes that from 2015 to 2022, the average values of DSI of Chinese urban residents showed a significant upward trend. Specifically, the comprehensive DSI and animal-based DSI still have a significant gap with the scientifically recommended balanced dietary pattern, while the plant-based DSI is generally higher. There is a clear regional pattern in the spatial distribution of the DSI of urban residents in China, which generally shows a decreasing trend from northeast to southwest. The spatial agglomeration of the comprehensive DSI and the animal-based DSI are significantly higher than the plant-based DSI. In general, the DSI of Chinese urban residents is positively correlated with the level of consumption, urbanization, and education, while negatively correlated with the consumer price index. We propose promoting plant-based diets and reducing excessive meat consumption in high-DSI regions, while leveraging urban infrastructure to deliver nutrition education and providing subsidies for healthier food options in markets. In low-DSI regions, interventions should focus on incentivizing local production of vegetables and legumes through agricultural subsidies, expanding cold-chain logistics to enhance the distribution of perishable foods, and establishing community-based nutrition programs to improve residents’ food literacy, and argue that these are the potential measures to optimize the dietary structure of Chinese urban residents.
1 Introduction
Dietary structure, a strong measure of the state of national nutrition and health, is described as the variety, quantity, and proportion of foods in the human diet (Yu et al., 2024). Dietary structure of a nation holds greater significance in developing food consumption strategies and policies (Nurhasan et al., 2024). Since the reform and opening-up during the 1980s, China’s economy has developed rapidly, and the dietary structure of urban residents has continuously transformed. Especially after crossing the stage of basic needs of food among Chinese populations, the types of food consumption have shown a diversified developmental trend (Shi et al., 2022). However, unprecedented dietary structure change can lead to malnutrition causing cardiovascular disease, and obesity (Li S. et al., 2024; Li Y. et al., 2024). According to the United Nations’ 2030 Agenda for Sustainable Development and the Decade of Action on Nutrition (2016 ~ 2025), hunger must be eliminated, and all forms of malnutrition should be prevented by 2030 (UN, 2015; WHO, 2017). However, based on the three dietary standards defined by the UN-Food and Agriculture Organization, approximately 141 million people in China were unable to achieve a healthy (high) dietary level by 2022 with increased rate of malnutrition cardiovascular related mortality (FAO, 2023). The obesity rate among residents aged 18 and above in China is as high as 34.35% (Pan et al., 2021). Exploring the dietary structure has become an important filed of research today to address both malnutrition and excessive nutrition among residents of highly urbanized China.
The research on dietary structure in developed countries initially emerged from disease treatment, demonstrating that optimizing plant-based diets can positively prevent and manage conditions like overweight, obesity, and hypertension (Ha et al., 2022; Nunes et al., 2020; Padwal et al., 2016). Subsequent studies on national dietary patterns revealed distinct models: Western model, dominated by high-protein animal products (e.g., meat, dairy) and characterized by high calories, fat, and protein (Ax et al., 2015); the Japanese model, emphasizing balanced intake of calories, fats, and proteins amid rising obesity concerns (Imaeda et al., 2015); and Mediterranean model, defined by high fiber, vitamins, and low saturated fats (Shen et al., 2015). These diverse dietary paradigms—rooted in health priorities, economic contexts, and cultural norms—collectively illustrate the food environment theory, where accessibility, affordability, and cultural preferences shape consumption (Turner et al., 2018). In China, rapid urbanization has amplified spatial mismatches: developed coastal regions exhibit animal-based dietary dominance, while remote areas face supply chain barriers to diverse nutrition (Yang and Zhen, 2019). Such disparities align with spatial dependency theory, positing that geographic and economic proximity drives clustered dietary behaviors (Anselin, 1988).
In recent years, with increased concerns to dietary health in China, some relevant studies have analyzed changing trends in the dietary structure of residents. Those studies have found that the diet of Chinese residents has gradually shifted from plant-based foods to animal-based foods, but plant-based foods are still dominant (Wang et al., 2023; Yuan et al., 2019; Li S. et al., 2024; Li Y. et al., 2024). In the context of factors influencing the dietary patterns, some scholars have made qualitatively studies on the impact of level of socio-economic development, and urbanization, on food consumption of urban and rural residents in China, and suggest that changing residents’ unreasonable concepts about food consumption and increasing residents’ income levels to improve dietary nutrition (Wang, 1998; Chen, 2012; Yang and Zhen, 2019). Studies such as the use of conventional econometric models including AIDS, multiple logistic regressions, and grey relational analysis on income, price, and region, have further advanced the understanding of the preferences of residents in food consumption in China (Xiong et al., 2019). Lately, the focus on provincial or regional scale studies such as the Qinghai-Tibet Plateau (Gao et al., 2017; Wang et al., 2021), Northern pastoral areas (Yang and Zhen, 2019), Shandong (Li et al., 2018) and Beijing (Xiong et al., 2019) have significantly improved the condition of dietary structure and nutritional characteristics of residents in China. However, overall, research gaps remain in the following aspects: the unbalanced and inadequate regional development of diet in China remains unclear (Wang, 2012). The conventional regression model fails to include spatial heterogeneity of variables influencing consumptions. Besides, at the macro level, the research on the dietary structure of Chinese urban residents is relatively weak failing to grasp a trend (Zhang et al., 2021). As the China’s urbanization rate has surpassed 65.22% (NBSC, 2022) with differences among cities, requirement of the assessment of spatiotemporal dietary structures across cities has increased substantially.
This study addresses the key research gaps mentioned above through three innovative approaches: First, a Dietary Structure Index (DSI) will be constructed for 31 provincial-level administrative units (2015 ~ 2022) based on the Chinese Dietary Guidelines for Residents (CNS, 2023), aiming to reflect the unbalanced and inadequate regional development of diet in China. Second, spatiotemporal differences in the DSI of urban residents will be mapped to explore the overall dietary nutrition balance and its spatial correlation characteristics. Third, spatial econometric model will be employed to analyze the driving factors of urban residents’ DSI, avoiding regression bias caused by spatially correlated differences. This research will provide valuable insights for improving the dietary nutrition structure of urban residents in China and formulating food safety policies.
2 Materials and methods
2.1 Conceptual framework
The schematic flow chart depicted in Figure 1 illustrates the conceptual framework of this study. First, the Entropy Weight TOPSIS method was employed to construct an evaluation system for the DSI of Chinese urban residents from two dimensions: animal-based diets and plant-based diets. This process generated a comprehensive DSI, an animal-based DSI, and a plant-based DSI. Subsequently, the kernel density estimate method was utilized to analyze the overall evolutionary patterns of Chinese urban residents’ DSI from three aspects: position, kurtosis, and distribution Extensibility. Besides, the exploratory spatial data analysis method was adopted to examine the spatial distribution, spatial correlation, and spatial agglomeration characteristics of the DSI. Next, a spatial econometric model was applied to quantify the influence of socioeconomic factors on the DSI of Chinese urban residents. Finally, based on the research findings, discussions are conducted and research conclusions are summarized.

Figure 1. Flow chart of this study.
2.2 Construction of the indicator system
Consuming diverse foods is not only a critical component of a balanced diet but also a fundamental prerequisite for establishing a reasonable dietary structure. This study builds upon the recommended balanced dietary patterns outlined in the Chinese Dietary Guidelines for Residents (2022). Leveraging the most recent accessible data, we adopted the food classification system in the Chinese Statistical Yearbook and existing food-related research methodologies (Zhang et al., 2021; Wang et al., 2022). Guided by the dietary habits of urban residents across different regions of China, we constructed an evaluation system for the DSI encompassing comprehensive, animal-based, and plant-based food categories for Chinese urban residents. Subsequently, the DSIs for Chinese urban residents were calculated (Table 1).
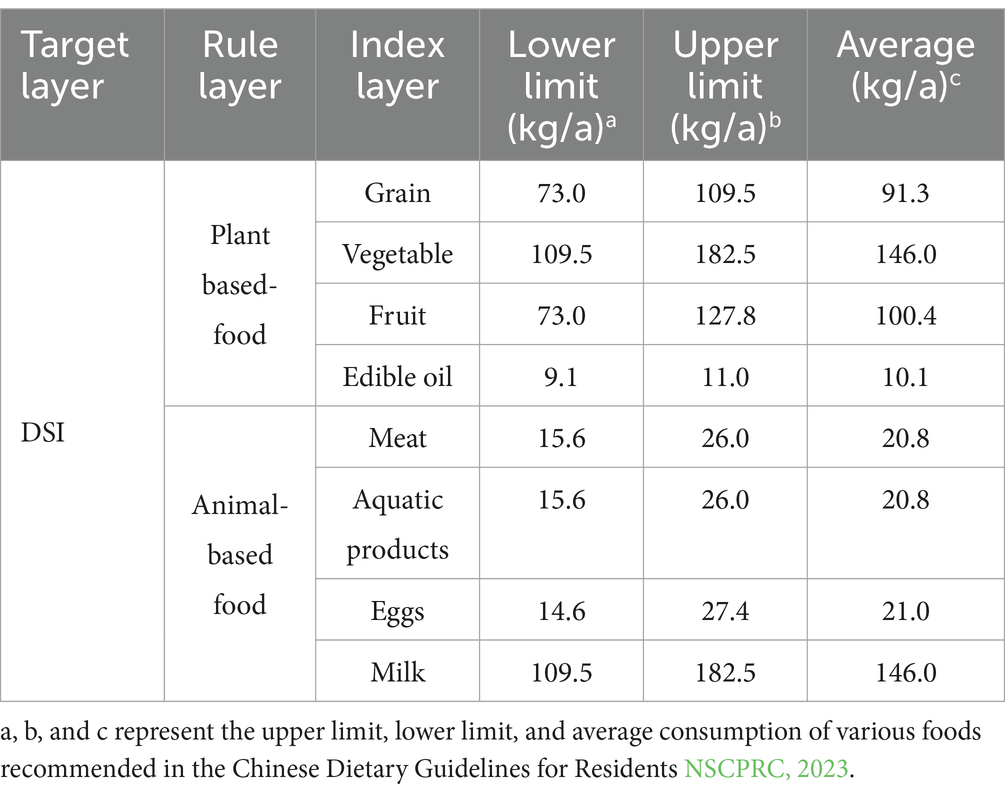
Table 1. Evaluation system for the DSI of urban residents in China.
2.3 Methods
2.3.1 Entropy weight TOPSIS method
Compared with the Analytic Hierarchy Process or Principal Component Analysis method, the Entropy Weight TOPSIS method has the characteristics of avoiding subjective weighting bias and being suitable for dynamic evaluation of multiple indicators (Li S. et al., 2024; Li Y. et al., 2024). The calculation steps are as follows:
Firstly, indicator weighting. The weights obtained by the entropy weight method are assigned to a vector matrix to form a weighted norm matrix , where represents the weighted calculated index value, represents the specific index value after standardization, and is the weight determined by the entropy weight method.
Then, determine the positive ideal solution and the negative ideal solution. The positive ideal solution used in this article is the maximum value among all indicators after the first step of calculation, and the negative ideal solution is the minimum value, that is, the positive ideal solution and the negative ideal solution and j represent the research unit and research indicators, respectively.
Finally, calculate the DSI of Chinese urban residents. After obtaining the positive and negative ideal solutions for each indicator using the above method, the Euclidean distance calculation formulas for Equations 1, 2 are used to calculate the distances and between each scheme and the positive and negative ideal solutions, and then the relative closeness between each scheme and the positive ideal solution is calculated.
Formula for calculating Euclidean distance:
Proximity calculation formula as Equation 3:
2.3.2 Kernel density estimation
Kernel Density Estimation (KDE) was employed to analyze the temporal evolution of DSI distributions, as it provides a non-parametric visualization of data density and polarization trends. Compared to histograms or quantile plots, KDE smooths data noise through bandwidth selection, offering a clearer depiction of distribution shifts over time (Yang et al., 2022). This paper uses Gaussian kernel function to observe the dynamic distribution and polarization phenomenon of the DSI of Chinese urban residents (Yang et al., 2022; Roy and Chowdhury, 2025). This formula is as Equation 4:
Where represents the estimated kernel density of the DSI; represents the distance from the estimated point to the sample point; n is the number of study areas; h is bandwidth; k() represents the weighted kernel function. In this study, a Gaussian kernel function was combined with the Chinese urban residents’ DSI as the sample point to create a fitted cooperative graph. Based on the morphology, peak value, fluctuation, and trend of the obtained graph, a comparative observation was conducted to analyze the overall evolution law of the Chinese urban residents’ DSI.
2.3.3 Exploratory spatial data analysis
This paper uses the Global Moran Index (GMI) to analyze the overall agglomeration of China’s urban residents’ DSI, GMI quantifies overall clustering, critical for validating the hypothesis that dietary patterns exhibit regional dependencies due to shared socioeconomic or environmental factors (Lu et al., 2022; Roy et al., 2023; Roy et al., 2024a), This formula is as Equation 5:
Where GMI represents the global autocorrelation index, n represents the number of research units, and represent the DSI values at spatial positions i and j, and represents the spatial weight matrix.
Global autocorrelation represents the overall agglomeration of the research area, while local autocorrelation represents the correlation of specific spatial ranges (Roy et al., 2024b). This paper uses the Local Indicators of Spatial Association (LISA) to identify local spatial agglomerations, which focuses solely on hotspot detection, LISA provides a dual classification of spatial association, capturing both similarity and dissimilarity (Roy et al., 2022; Majumder et al., 2023a; Majumder et al., 2023b). The formula is as follows:
Where represents the local autocorrelation statistic, and the meanings of , and are as shown in Equation 5. Generally, a value less than 0 indicates the spatial clustering of dissimilar values, otherwise, it’s the opposite.
2.3.4 Spatial econometric model
Spatial econometric models account for spatial dependence and heterogeneity, capturing how observations in nearby locations influence each other, which traditional models often ignore. The Spatial Econometric Model including three types: Spatial Lag Model (SLM), Spatial Error Model (SEM), and Spatial Durbin Model (SDM) (Hou et al., 2024), the formula is as follows:
The SLM is defined as Equation 7:
The SLM is defined as Equation 8:
The SLM is defined as Equation 9:
where i and t represent provinces and research years, respectively; θ represents random disturbance term; ρ represents spatial auto regression coefficient; ξ represents spatial error coefficient; α0,ω, φ, τ and σ represent the spatial regression coefficients of independent variables; and Wij is an element in the adjacency space weight matrix W, representing the spatial correlation between province i and province j.
2.4 Data sources
Considering the continuity and accessibility of food consumption data, the research period selected in this paper was from 2015 to 2022. All data were sourced from the China Statistical Yearbook (NBSC, 2016–2023a), China City Statistical Yearbook (NBSC, 2016–2023b), China Social Development and Statistical Bulletin (NBSC, 2016–2023c). As this study only has missing food consumption data for individual years in Xinjiang and Tibet, and linear imputation is suitable for small-scale missing data with higher computational efficiency compared to kriging or machine learning methods, linear interpolation was used to supplement the data.
3 Results
3.1 Spatiotemporal changes of the DSI in Chinese urban residents
To comprehensively analyze the differences between the food consumption of Chinese urban residents and the recommended balanced dietary pattern in the Chinese Dietary Guidelines for Residents (2022), we explored the spatiotemporal characteristics of the Chinese urban residents’ DSI from three aspects: comprehensive DSI, animal-based DSI, and plant-based DSI.
3.1.1 Temporal evolution characteristics
As shown in Table 2, the average comprehensive DSI, animal-based DSI, and plant-based DSI of Chinese urban residents exhibited a significant upward trend from 2015 to 2022, increasing from 0.586, 0.530, and 0.821 in 2015 to 0.669, 0.610, and 0.852 in 2022, respectively. Notable improvements were observed in provinces such as Gansu, where the comprehensive DSI rose from 0.655 in 2015 to 0.854 in 2022, Shaanxi with an increase from 0.540 in 2015 to 0.792 in 2022, and Xinjiang where the index grew from 0.595 in 2015 to 0.837 in 2022. These advancements can likely be attributed to enhanced agricultural subsidies, the expansion of cold-chain logistics, and the dietary diversification driven by urbanization. In contrast, Beijing and Shandong experienced declines in their comprehensive DSI values, from 0.960 in 2015 to 0.893 in 2022 and from 0.984 in 2015 to 0.855 in 2022, respectively. These decreases may reflect a shift toward plant-based diets in high-income regions or the impact of policy-driven reductions in animal-based in 2022 food consumption. Provinces with historically low indices, including Guizhou and Hainan, showed only marginal progress, with their comprehensive DSI increasing from 0.190 in 2015 to 0.239 in 2022 and from 0.189 in 2015 to 0.244 in 2022, respectively. This suggests the persistence of structural barriers such as limited market access or insufficient nutrition education in these areas.

Table 2. DSI of urban residents in China from 2015 to 2022.
Significant improvements in plant-based DSI were noted in Tibet and Qinghai, rising from 0.000 in 2015 to 0.354 in 2022 and from 0.610 in 2015 to 0.426 in 2022, respectively, which can likely be attributed to targeted agricultural interventions. Conversely, Guangdong and Fujian saw declines in their plant-based DSI, from 0.827 in 2015 to 0.679 in 2022 and from 0.804 in 2015 to 0.601 in 2022, respectively, possibly linked to urbanization-induced dietary transitions that favor animal-based foods. These regional variations underscore the complex interplay of socioeconomic development, infrastructure investments, and localized policy efficacy in shaping dietary patterns. Overall, while the narrowing gap between provincial DSI indicates reduced disparities, challenges remain in aligning food consumption with national dietary guidelines across all regions.
Further we selected data from the first and last years of the research period to draw a kernel density map for the comprehensive DSI, animal-based DSI, and plant-based DSI, and analyzed the evolutionary trend of Chinese urban residents (Figure 2). The density function of the comprehensive DSI, animal-based DSI, and plant-based DSI of Chinese urban residents under positional perspective showed a rightward shift trend (Figures 2a,b), indicating that the dietary consumptions of urban residents have followed the recommended standard of balanced dietary structure pattern in China. The diversity of residents’ dietary has also increased over the study period. Mainly the density function curves of the comprehensive DSI and animal-based DSI have a large rightward shift (Figures 2a,b), indicating their rapid development. The relatively small rightward shift of the density function of the plant-based DSI (Figure 2c) suggests that the plant-based food consumption among urban residents in China is generally high during the study period.
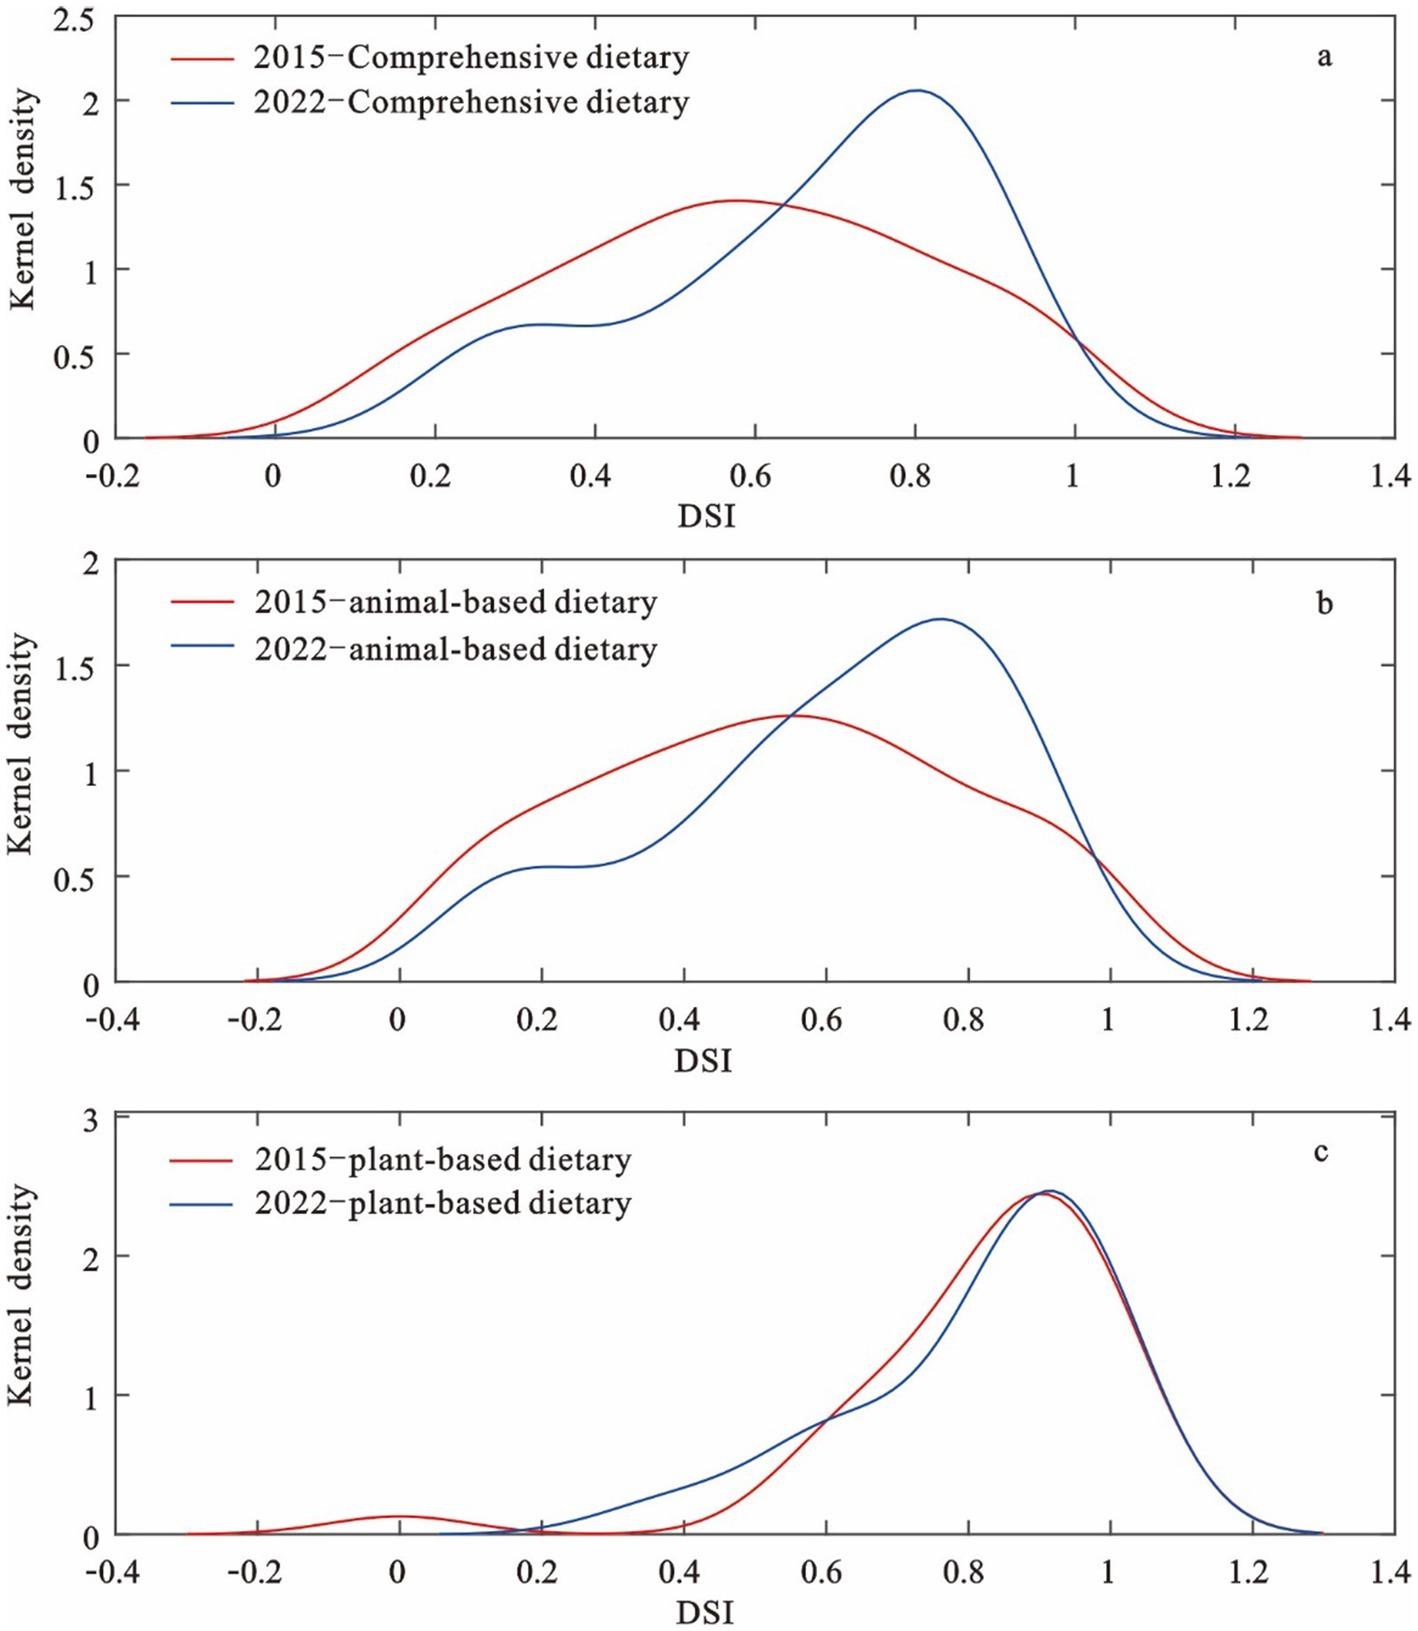
Figure 2. Kernel density plot of DSI for Chinese urban residents in China from 2015 to 2022. a represents the comprehensive DSI kernel density curve; b represents the animal- based DSI kernel density curve, c represents the plant- based DSI kernel density curve.
From the perspective of kurtosis, the peak kernel density values of the density function curve for the comprehensive DSI, animal-based DSI, and plant-based DSI of Chinese urban residents during the study period showed an upward trend with unimodal distribution (Figures 2a,b). Specifically, the kurtosis of the density function curves for the comprehensive DSI and animal-based DSI of Chinese urban residents increased from 1.48 and 1.26 in 2015 to 2.12 and 1.74 in 2022, respectively indicating their low values distribution with the wider gap between them in the recommended balanced dietary pattern. In the meanwhile, the width of the density function curve has narrowed (Figures 2a,b), indicating that the degree of difference in the comprehensive DSI and animal-based DSI between different provinces has decreased. Besides, although the kurtosis of the density function curve of the plant-based DSI for Chinese urban residents has increased, the amplitude is relatively small (Figure 2c), due to the relatively stable consumption of plant-based foods by urban residents.
From the perspective of distribution extensibility as shown by the left and right tails of the density curves, there was a trend of elongation and thinning of the comprehensive DSI and animal-based DSI in the left tail (Figures 2a,b). Such trend reflects the improved comprehensive DSI and animal-based DSI of Chinese urban residents. Meantime, provinces with low level DSI decreased gradually narrowing the gap with balanced dietary structure pattern. The right tail also showed an extended trend and thinning (Figures 2a,b), reflecting a slight decrease in the comprehensive DSI and animal-based DSI. Provinces such as Beijing, Tianjin, Liaoning, and Shandong had a high level of both indices (Table 2) due to the increase in the proportion of plant-based diets in these provinces (NBSC, 2016–2023a). The plant-based DSI showed an upward trend on the left side of the curve (Figure 2c), reflecting the increased consumption structure among urban residents.
3.1.2 Spatial evolution characteristics
We selected the first and last years to draw spatial distribution maps of the comprehensive DSI, animal-based DSI, and plant-based DSI, to intuitively and comprehensively analyze the spatial evolution characteristics of the DSI. Using ArcGIS 10.8 software data visualization, the DSI of urban residents in the study area was divided into five categories: high value (0.86 ~ 1), relative high value (0.66 ~ 0.85), middle value (0.46 ~ 0.65), relative low value (0.26 ~ 0.45), and low value (0 ~ 0.25) using the equal division method (Figure 3).
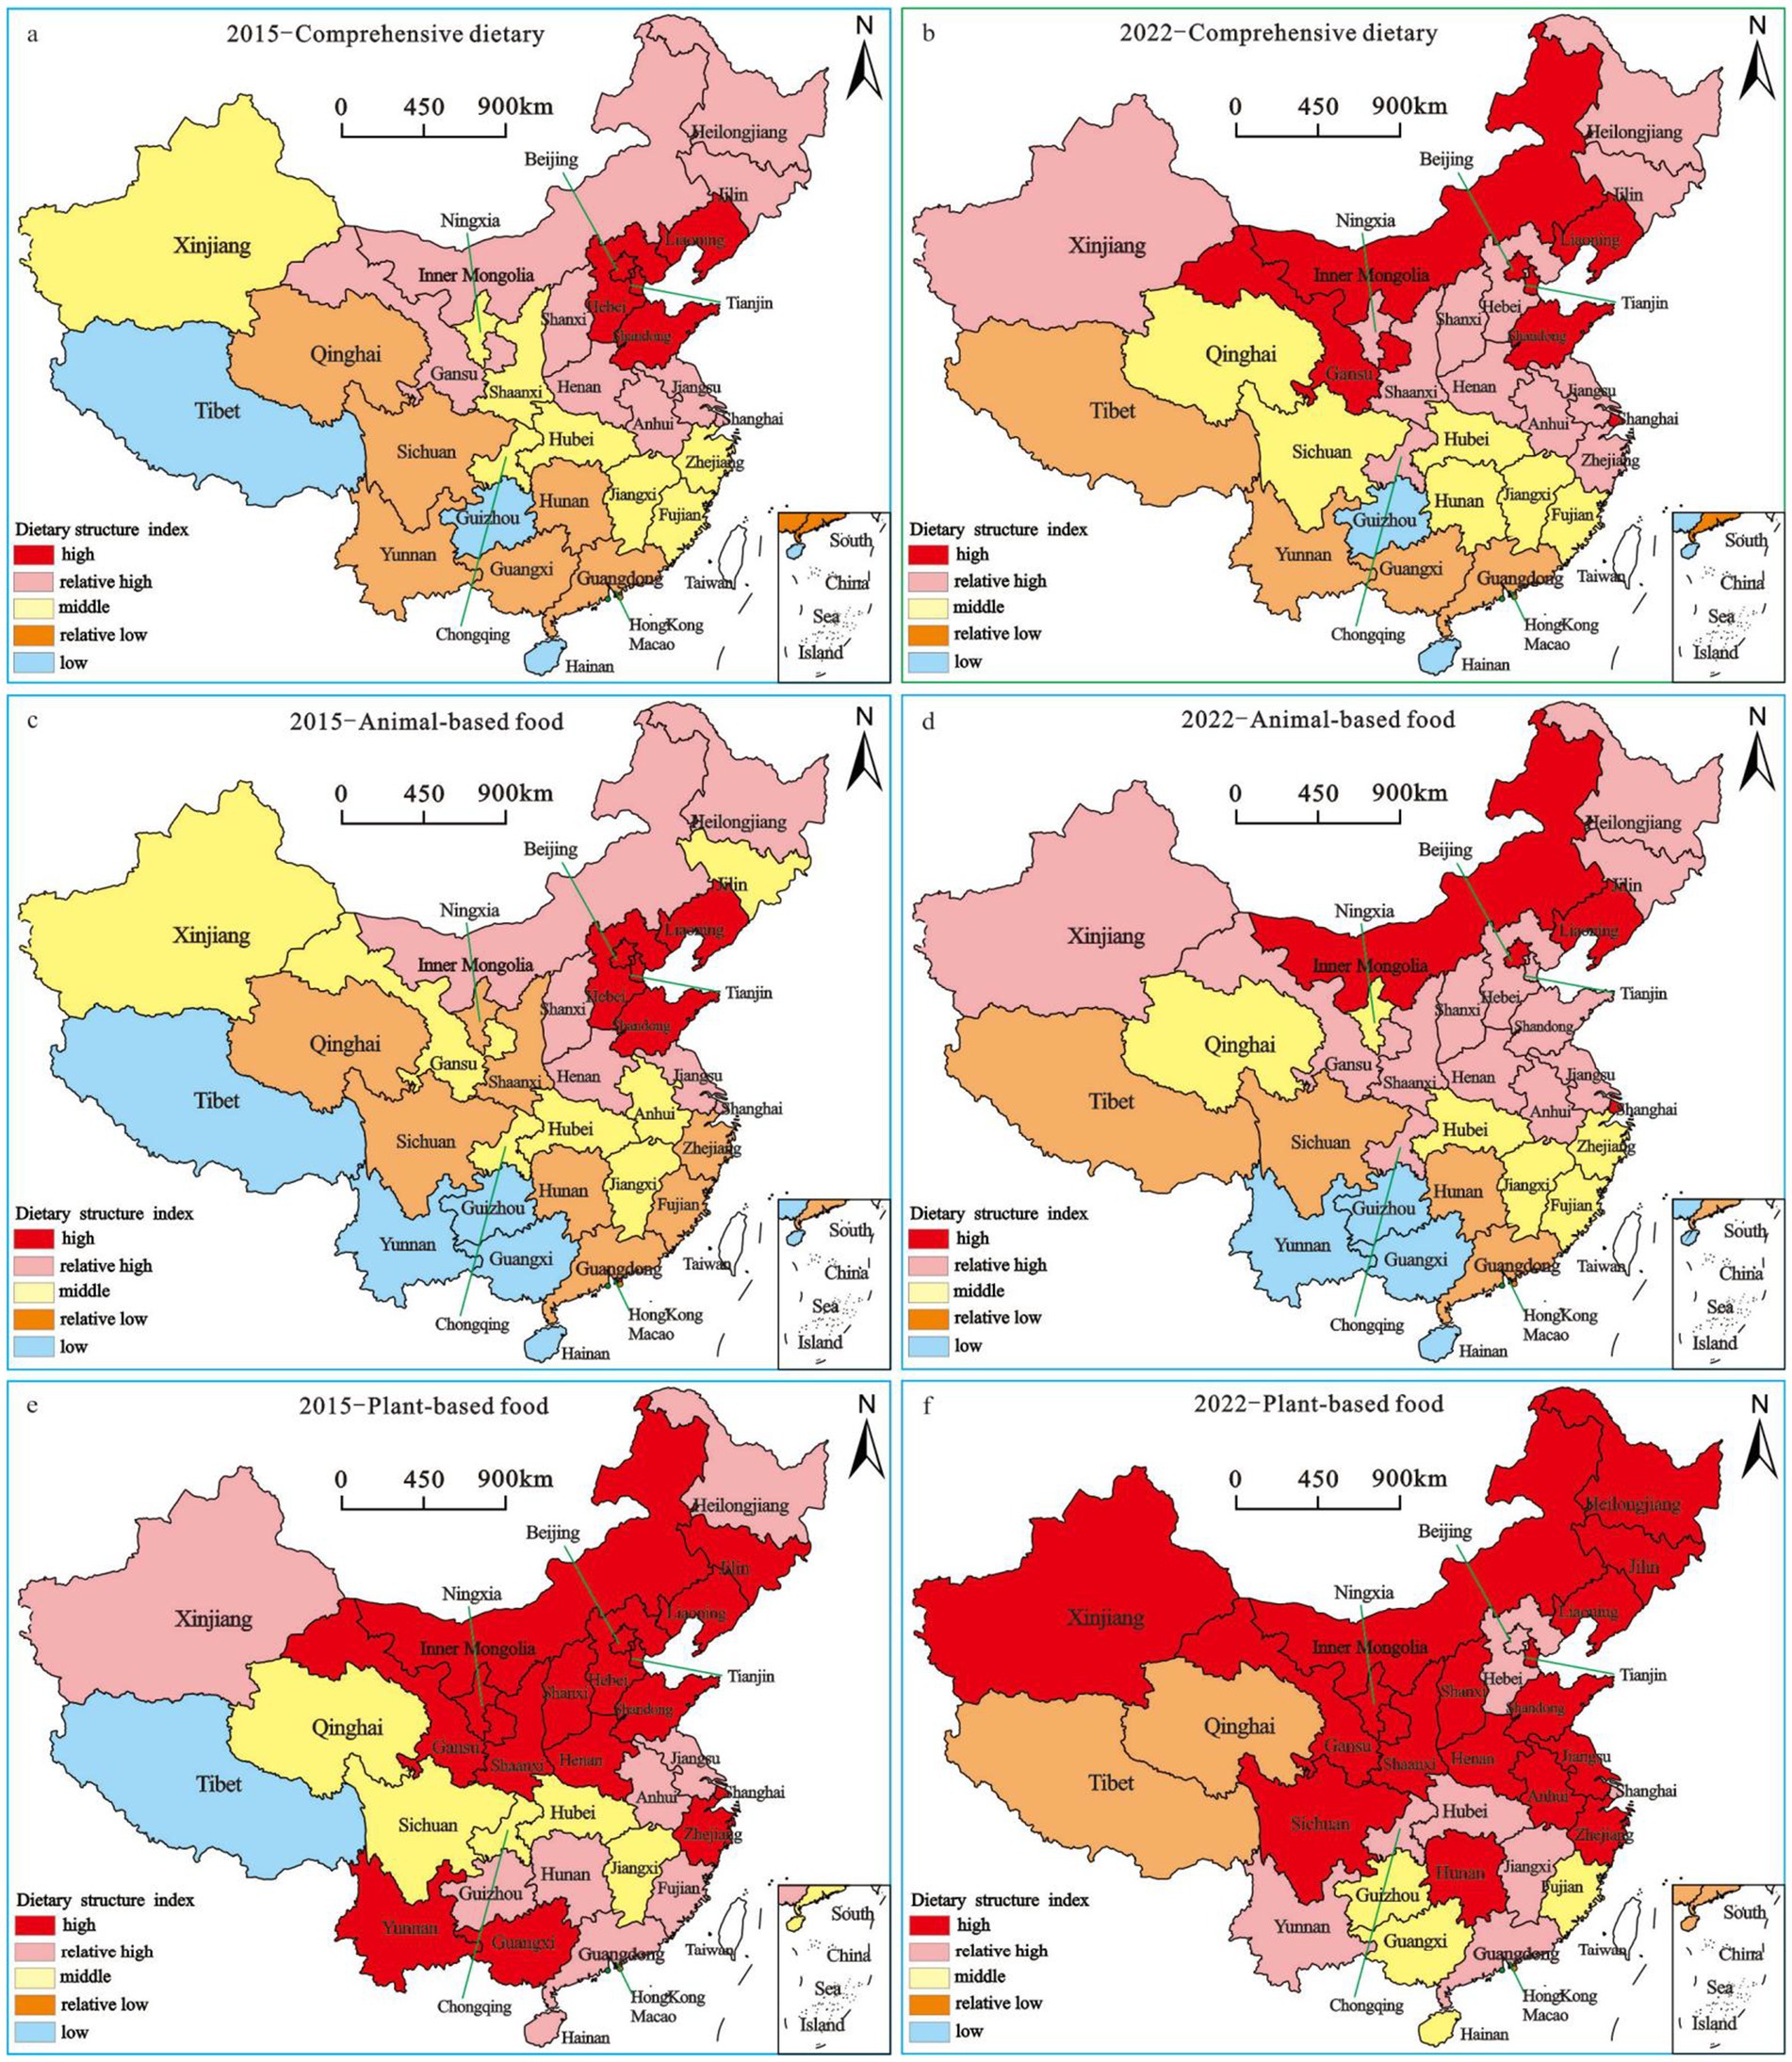
Figure 3. Distribution of DSI of urban residents in China. a represents the comprehensive DSI; b represents the animal- based DSI, c represents the plant- based DSI.
Figures 3a,b show that the number of high-value areas for the comprehensive DSI of urban residents increased from 5 in 2015 to 7 in 2022, expanding spatially to provinces such as Gansu (northwest China) and Inner Mongolia (North China). The distribution pattern shifted from clustered adjacency to discrete distribution, with a significant expansion in range. The number of relative high-value areas rose from 9 in 2015 to 12 in 2022, with their spatial distribution similarly transitioning from clustered to discrete patterns. With large provinces like Xinjiang (northwest China) and Shanxi (North China) transitioning to relative high-value areas, the spatial coverage of such regions expanded significantly. The number of middle-value areas decreased from 8 in 2015 to 6 in 2022, mainly distributed in adjacent clusters across Qinghai (northwest China), Sichuan (southwest China), Hubei and Hunan (Central China), and Jiangxi and Fujian (East China). The counts of relative low-value and low-value areas decreased from 6 and 3 in 2015 to 4 and 2 in 2022, respectively, though their spatial distribution remained relatively stable. Relative low-value areas were primarily concentrated in Tibet and Yunnan (southwest China), as well as Guangxi and Guangdong (southern China), while low-value areas were mainly distributed in Guizhou (southwest China) and Hainan (southern China).
Figures 3c,d show that the number of high-value areas for the animal-based DSI of urban residents decreased from 5 in 2015 to 4 in 2022, with the spatial distribution pattern shifting from clustered adjacency to discrete distribution. These areas included Beijing (North China), Inner Mongolia, Liaoning (Northeast China), and Shanghai (East China). The number of relative high-value areas increased from 6 in 2015 to 13 in 2022, with the spatial distribution forming adjacent clusters and the coverage expanding significantly. This expansion included Xinjiang, Gansu, and Shaanxi (Northwest China), Chongqing (Southwest China), Shandong and Anhui (East China), and Hebei and Tianjin (North China). The number of middle-value areas decreased from 7 in 2015 to 6 in 2022, encompassing Qinghai and Ningxia (Northwest China), Hubei (Central China), and Jiangxi, Fujian, and Zhejiang (East China). The number of relative low-value areas declined from 8 in 2015 to 4 in 2022, with their spatial distribution largely characterized by an east–west pattern across Tibet and Sichuan (Southwest China), Hunan (Central China), and Guangdong (South China). Low-value areas remained relatively stable in distribution, mainly concentrated in Yunnan and Guizhou (Southwest China) and Guangxi and Hainan (South China).
Figures 3e,f show that the number of high-value areas for the plant-based DSI of urban residents in China increased from 16 in 2015 to 18 in 2022, with the distribution expanding to provinces such as Xinjiang (Northwest China), Heilongjiang (Northeast China), and Anhui and Zhejiang (East China). The number of relatively high-value areas decreased from 9 in 2015 to 7 in 2022, primarily distributed in a circular pattern across Yunnan and Chongqing (Southwest China), Hubei (Central China), Jiangxi (East China), and Guangdong (South China). The number of middle-value areas declined from 5 in 2015 to 4 in 2022, with notable spatial distribution shifts, mainly concentrated in Guizhou (Southwest China), Guangxi and Hainan (South China), and Fujian (East China). While no low-value areas were observed in 2015, two relatively low-value areas emerged in 2022, located in Tibet (Southwest China) and Qinghai (Northwest China). Additionally, the low-value areas that existed previously have disappeared.
3.1.3 Spatial differentiation pattern
According to Table 3, from 2015 to 2022, the GMI of the comprehensive DSI and animal-based DSI for urban residents in China were both greater than 0.5 and significant at the 1% level. The GMI of the plant-based DSI was greater than 0.062 and significant at the 10% level, indicating that provinces with high or low values of the comprehensive DSI, animal-based DSI, and plant-based DSI for urban residents tend to agglomeration spatially, especially the spatial agglomeration of the comprehensive DSI and animal-based DSI is more obvious than that of the plant-based DSI.
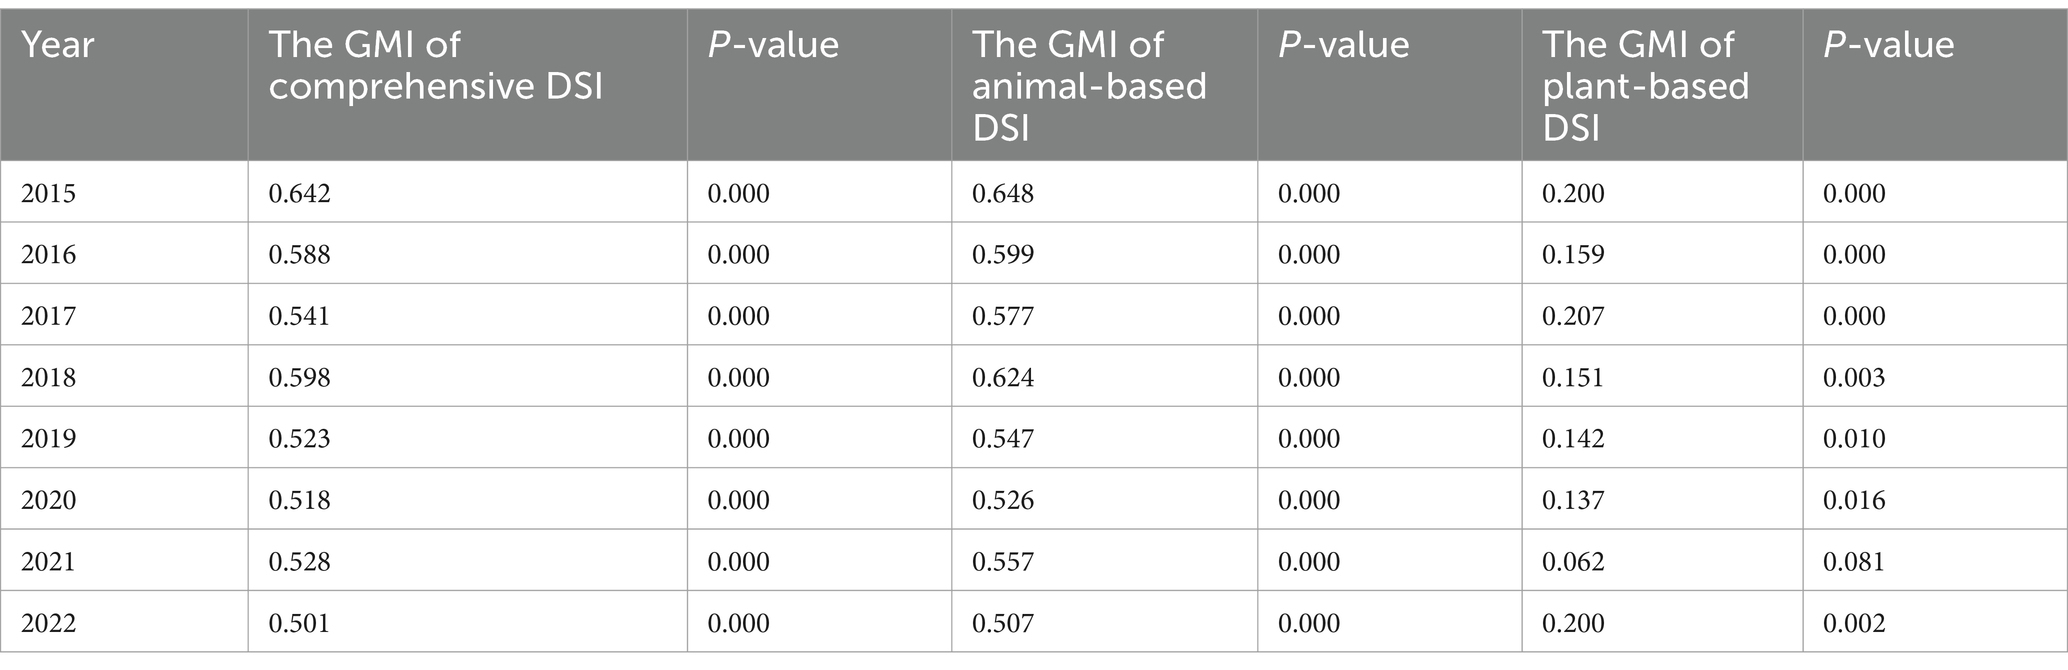
Table 3. GMI values of DSI in China from 2015 to 2022.
Although the GMI indicates significant spatial correlation in the DSI of urban residents across different provinces of China, there is no specific spatial correlation between provinces in distinct regions. Therefore, we used LISA to identify that locally significant spatial correlations exist in the DSI of urban residents across provinces in different regions of China (Figure 4).
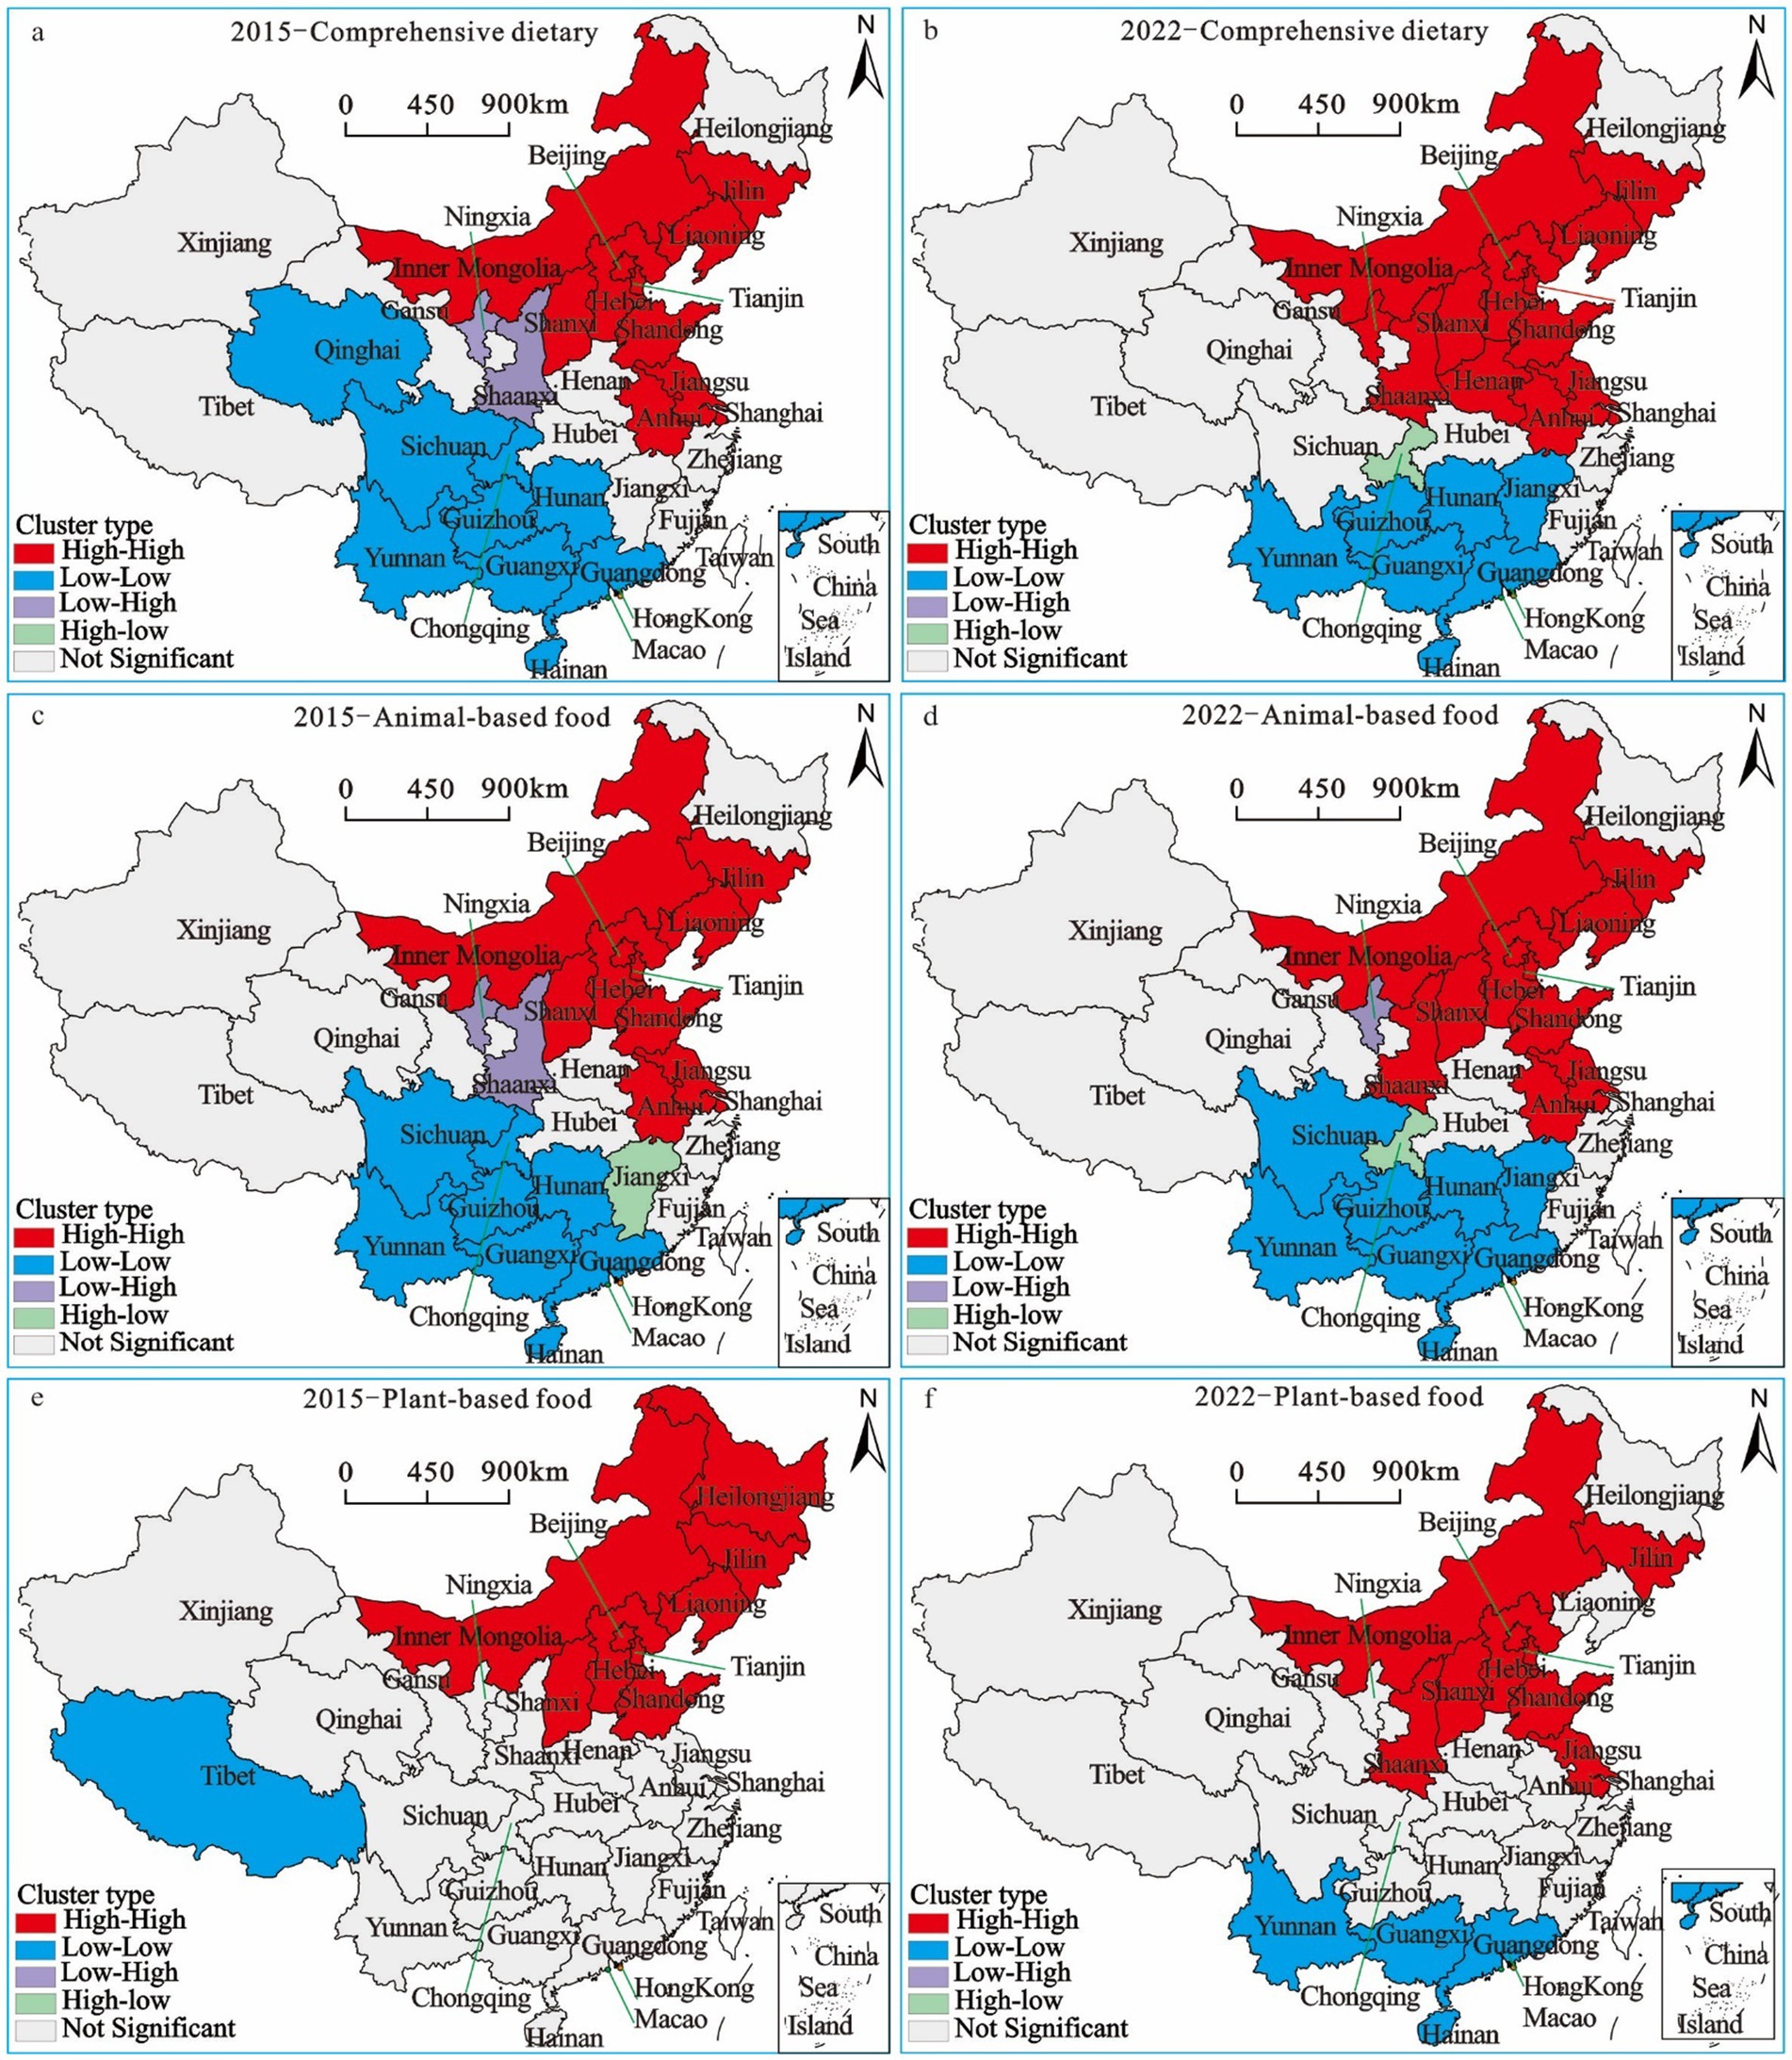
Figure 4. LISA cluster map of DSI of urban residents in China from 2015 to 2022. a represents the comprehensive DSI cluster; b represents the animal- based DSI cluster, c the plant- based DSI cluster.
Figures 4a,b show that Jilin, Liaoning, Inner Mongolia, Beijing, Tianjin, Hebei, Shanxi, Shandong, Jiangsu, and Shanghai were clustered as H-H in both 2015 and 2022, while Ningxia, Shaanxi, and Henan formed H-H clusters in 2022. H-H provinces represent hot-spot areas with higher comprehensive DSI. Qinghai, Sichuan, Chongqing (2015), Jiangxi (2022), Guizhou, Yunnan, Guangxi, Hunan, Guangdong, and Hainan were categorized as L-L clusters in both years, indicating cold-spot areas with lower comprehensive DSI. In 2015, Ningxia and Shaanxi were L-H outliers (low-value regions surrounded by high-value regions), while Chongqing was an H-L outlier (high-value region surrounded by low-value regions), both representing dissimilar value clustering.
Figures 4c,d show the H-H cluster distribution of the animal-based DSI, including Jilin, Liaoning, Inner Mongolia, Beijing, Tianjin, Hebei, Shanxi, Shandong, Jiangsu, and Anhui in 2015, and Shaanxi in 2022. H-H provinces served as hot-spot areas with higher animal-based DSI. Sichuan, Chongqing, Yunnan, Guizhou, Guangxi, Hunan, Guangdong, and Hainan (2015), along with Jiangxi (2022), formed L-L clusters with lower animal-based DSI. Ningxia and Shaanxi (2015) and Ningxia (2022) were L-H outliers, while Jiangxi (2015) and Chongqing (2022) were H-L outliers, indicating negative local spatial autocorrelation due to dissimilar value clustering.
Figures 4e,f show the H-H cluster distribution of the plant-based DSI, including Heilongjiang in 2015 and Jilin, Liaoning, Inner Mongolia, Beijing, Tianjin, Hebei, Shanxi, Shandong, Anhui, and Shaanxi in 2022. H-H provinces were hot-spot areas with higher plant-based DSI. Tibet (2015) and Yunnan, Guangxi, Guangdong, and Hainan (2022) formed L-L clusters with lower plant-based DSI. No H-L or L-H clusters were observed for the plant-based DSI in either 2015 or 2022.
3.2 Influencing factors of DSI in Chinese urban residents
3.2.1 Selection of influencing factors
We referred relevant research from various authors (Wang, 1998; Chen et al., 2012; Yang and Zhen, 2019) for consumption capacity, consumer price index, urbanization level, and education level as influencing factors of the DSI of Chinese urban residents. The comprehensive DSI was chosen as the dependent variable, and the selected indicators influencing the consumption are defined as follows (Table 4).
1. Consumption capacity (CC) is characterized by the per capita disposable income of urban residents. Assuming all other factors remain constant, an increase in income level will inevitably lead to changes in the dietary level, purchasing power, and dietary choices of urban residents. Higher requirements will be placed on the nutrition and safety of diets, and the dietary structure will shift from a plant-based diet dominated by cereal products to an animal-based diet dominated by meat, eggs, and milk, and then to quality-of-life products, thereby promoting the development of a balanced dietary structure.
2. Consumer price index (CPI) is an index that reflects the price changes such as dietary purchased by urban residents from the perspective of consumers. It can reflect the trend and degree of changes in the price level of dietary purchased by urban residents. An increase in the consumer price index may affect the ability and desire of urban residents to purchase a corresponding dietary, thereby hindering the formation of diverse dietary among urban residents.
3. Urbanization level (UL) is characterized by urbanization rate, which is the proportion of urban population to total population. With the improvement of urbanization level, residents’ consumption of non-staple and processed foods will increase, while primary food consumption will decrease. The consumption of meat, eggs, and dairy products will increase, promoting the gradual diversification of urban residents’ dietary consumption. In this process, urban residents will actively or passively engage in nutritional balance and dietary structure optimization, achieving the transformation and upgrading of urban residents’ dietary structure.
4. Educational level (EL) is characterized by the number of higher education students per 100,000 population. The level of education and culture can cause differences in the food consumption concepts, dietary habits, dietary culture, and absorption of various nutrients among urban residents, which affects their dietary behavior choices. Urban residents with higher levels of education have higher health awareness and nutritional knowledge reserves and attach importance to the intake of healthy dietary such as vegetables and fruits products, which has a positive impact on the formation of a balanced dietary structure.
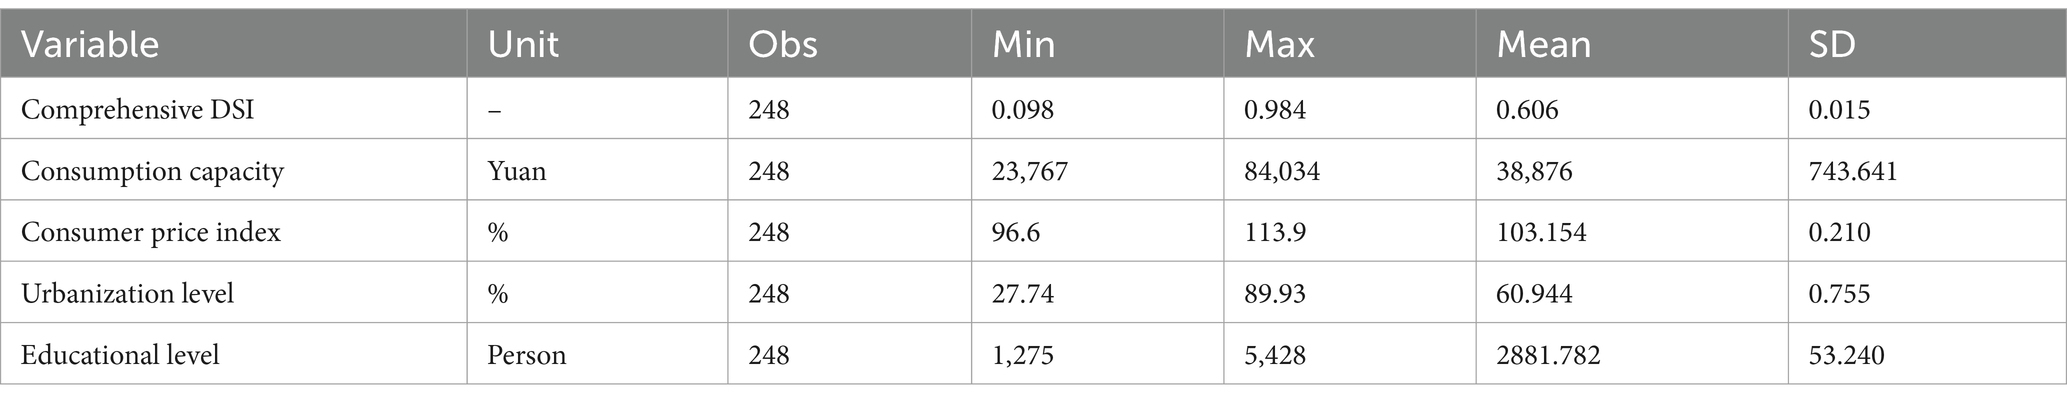
Table 4. Statistical description of the variables.
3.2.2 Analysis of influencing factors
Due to significant discrepancies in data across indicators, logarithms were applied to all variables before model estimation to mitigate heteroscedasticity. Regression analysis of the influencing factors on the comprehensive DSI for urban residents in China was conducted using Stata 17. The OLS model exhibited a goodness-of-fit (R2) of 0.353 (Table 5), indicating a moderate level of model fit. Among the selected indicators, only three variables—consumption capacity (CC), urbanization level (UL), and education level (EL)—were statistically significant (p < 0.05) (Table 5). Given that the OLS model does not account for spatial correlation, the construction of a spatial econometric model was deemed necessary to derive more robust conclusions. The GMI in Table 3 revealed significant spatial agglomeration effects in the comprehensive DSI for Chinese urban residents, suggesting that traditional ordinary least squares (OLS) regression models are inadequate and necessitating the adoption of spatial econometric model. When using spatial econometric models to analyze the magnitude of influencing factors, it is necessary to compare the SLM, SEM, and SDM to avoid the risk of subjective model specification and ensure that the results of spatial econometric analysis are not only statistically significant but also have realistic explanatory power. As shown in Table 5, results from the spatial error LR test, spatial lag LR test, and Wald test collectively identified the SDM as the optimal specification, as all tests rejected the null hypothesis that the SDM could be simplified to the SLM or SEM. A Hausman Test with results below zero (or passing the significance test) led to the rejection of the random-effects model. Given that the SDM accommodates three types of fixed effects—time-fixed, space-fixed, and space–time-fixed, an LR test was employed to select the most appropriate model. The test supported the adoption of the space–time fixed-effects model. Consequently, the SDM with space–time fixed effects was identified as the best-fitting model, and its parameter estimation results were subsequently analyzed and discussed.
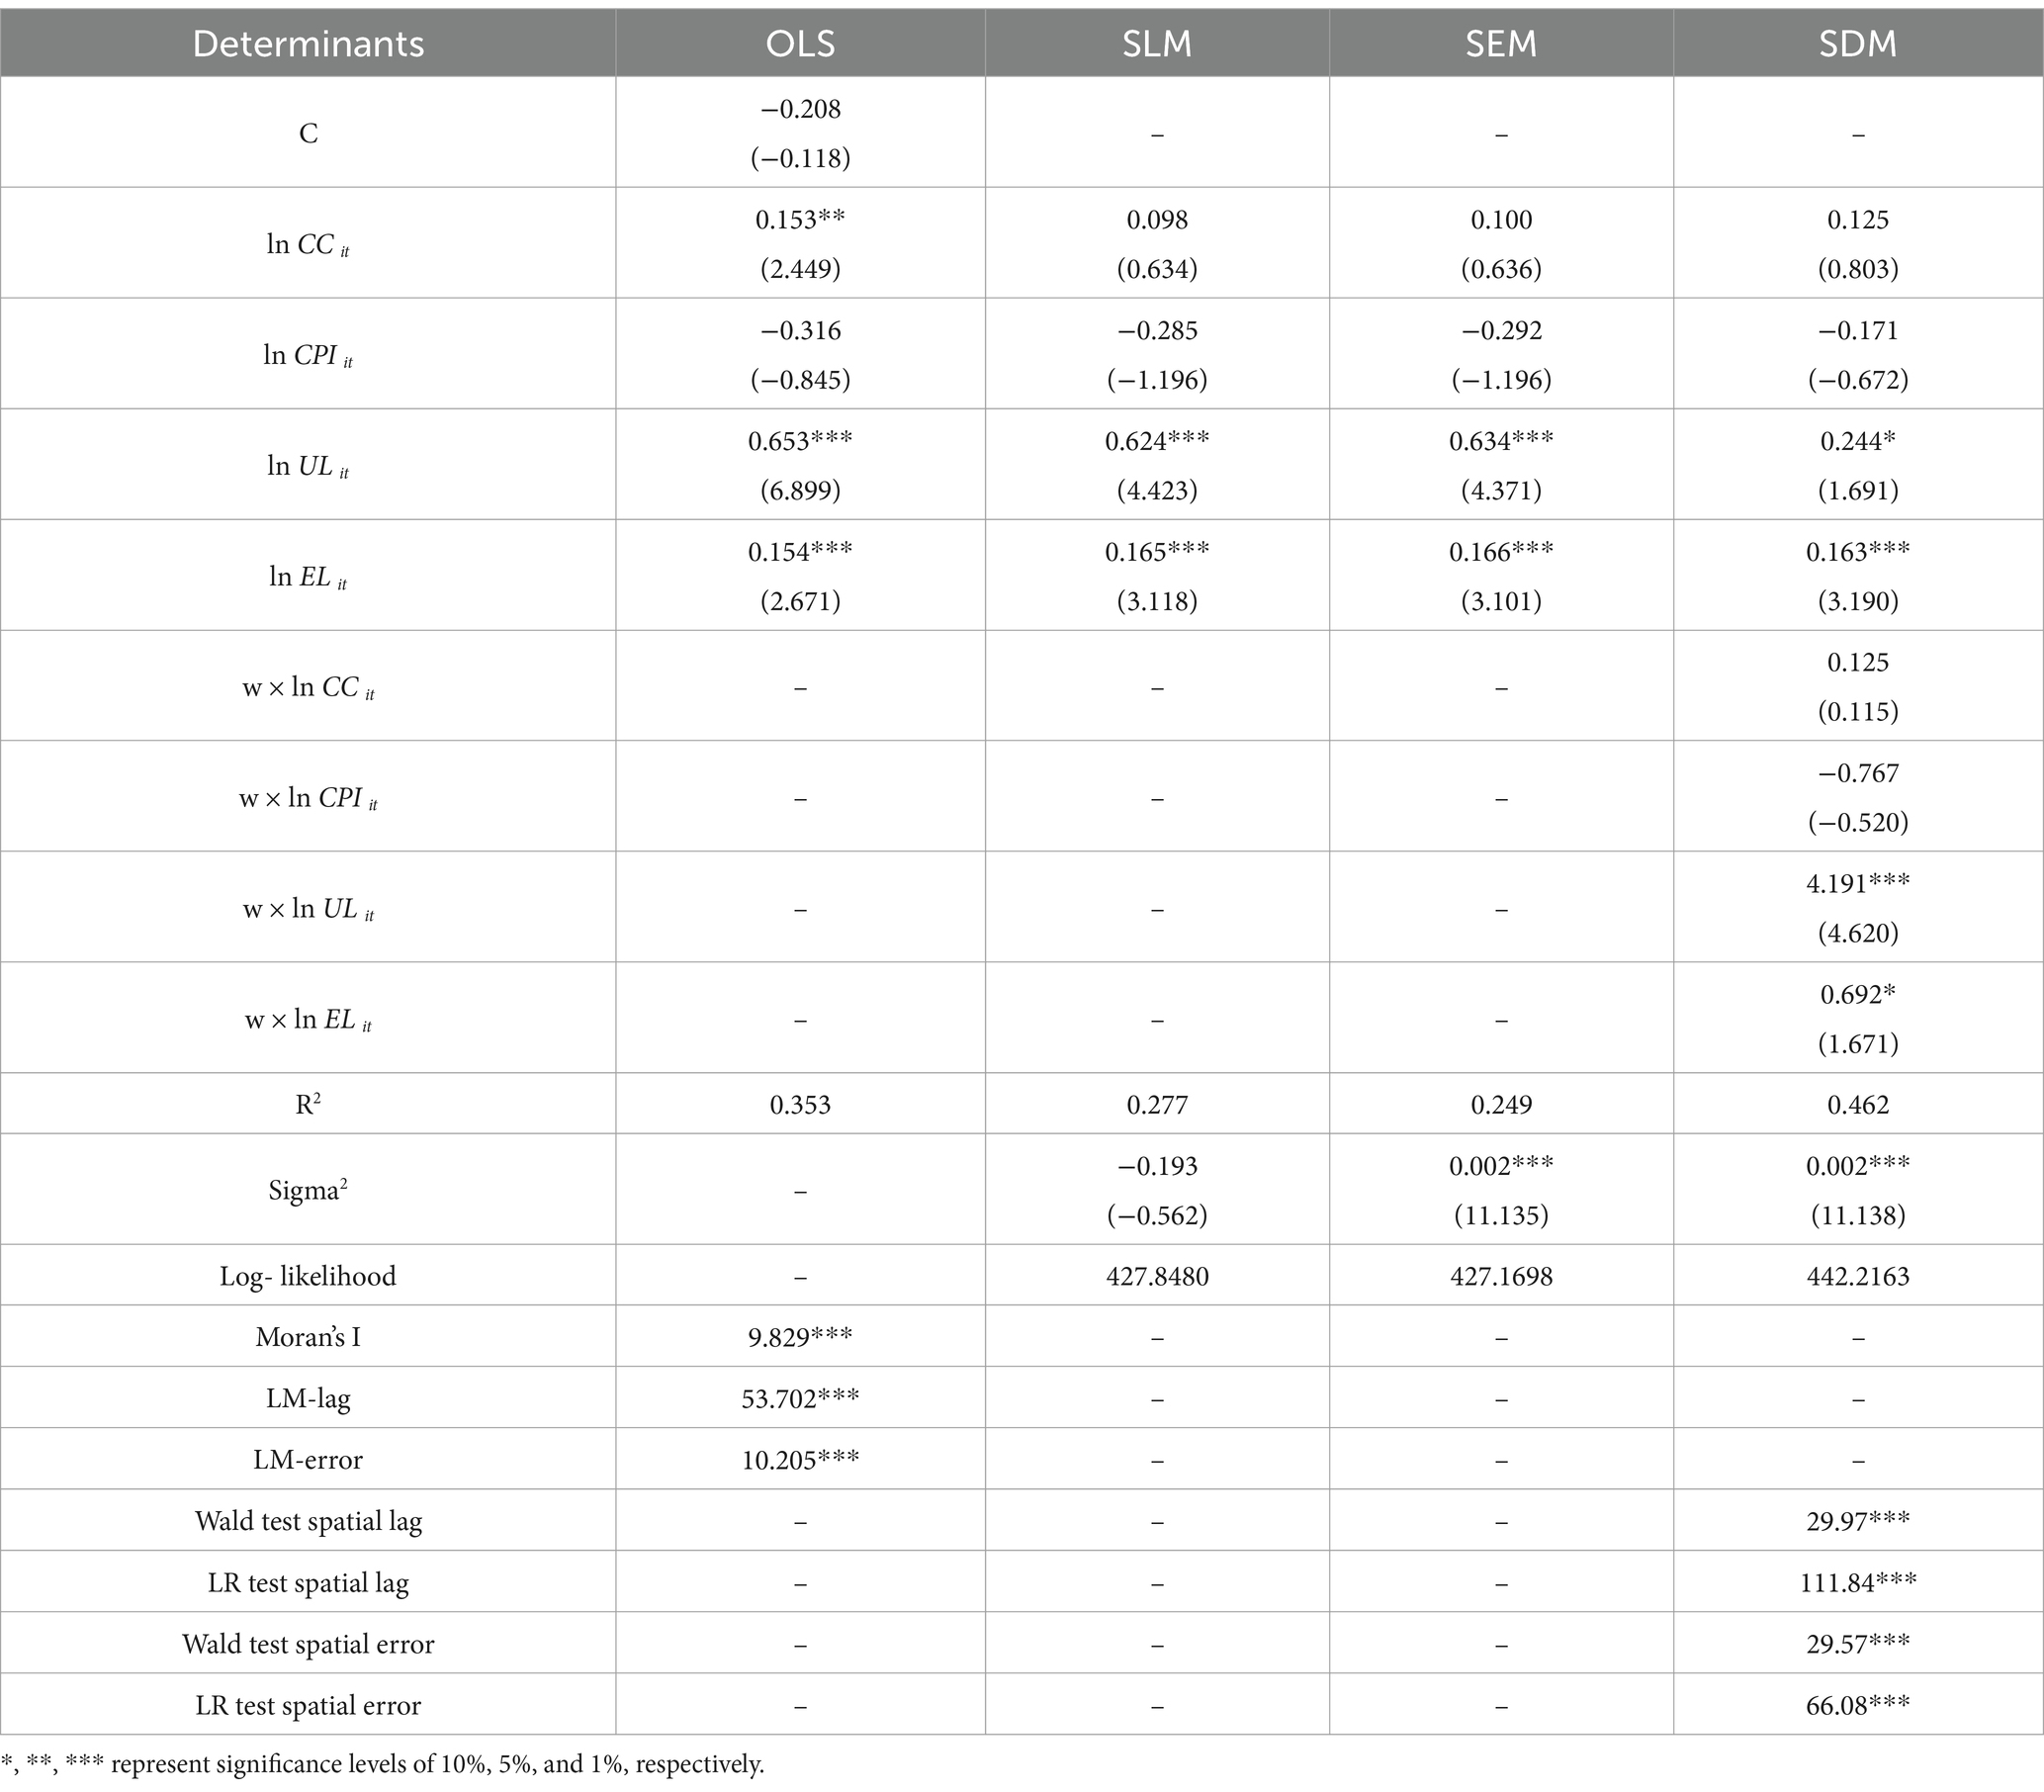
Table 5. Estimation results of spatial regression model.
The SDM results revealed relationships between influencing factors and the DSI. CC exhibited a positive coefficient (0.125), though statistically insignificant, potentially due to regional income disparities or collinearity with urbanization, as higher incomes in developed regions may already align with diversified diets, leaving limited marginal effects. The negative coefficient of the CPI (−0.171, p < 0.1) suggests that rising food prices hinder dietary diversity, likely by reducing affordability of nutrient-rich foods, particularly in low-income regions. UL showed a significant positive effect (0.244, p < 0.1), aligning with studies indicating that urban environments enhance access to diverse foods and promote shifts toward balanced diets through improved supply chains and dietary awareness. Conversely, the negative coefficient of EL (0.163, p < 0.01) appears counterintuitive but may reflect educated populations prioritizing quality over quantity—opting for nutrient-dense, plant-based foods over excessive animal products, thereby narrowing deviations from recommended guidelines. Spatially, neighboring regions’ urbanization (4.191, p < 0.01) and education (0.692, p < 0.1) exerted positive spillover effects, implying clustered policy interventions could amplify benefits. These findings underscore the need for regionally tailored strategies: boosting rural incomes and stabilizing food prices to mitigate CPI impacts, leveraging urbanization’s infrastructure advantages, and integrating nutrition education to align dietary behaviors with scientific guidelines.
4 Discussion
From an overall perspective of China, there is a clear regional differentiation pattern in the DSI of urban residents, which generally shows a decreasing trend from China’s northeast to southwest region. The formation and changes of the DSI of urban residents across China are not only related to various factors such as consumption capacity, consumer price index, urbanization level, and education level, but also the impact of changes of the regional natural environment, external transportation convenience, and differences in the dietary culture (Yin, 2013). As the climate in Northeast China is cold and the winter is relatively long, people are accustomed to storing dry vegetables for winter consumption, such as pickled dishes. At the same time, to resist severe cold, residents living in high latitude areas consume high calorie diet such as meat. A diversity in the consumption of both plant-based and animal-based foods could be the reason why the DSI of northern provinces would become relatively high. For example, except for the low altitudinal area, such as the Huangshui Valley, the Tibet autonomous region in southwest China, where extensive livestock farming including the rearing of sheep and yaks is common indicating a predominant meat diet in the region (Gao et al., 2017). The meat consumption in urban areas of China is dominated by beef followed by mutton, but the consumption pattern is largely influenced by the changes in the local natural environment and inconvenient transportation, imbalanced demand and supply of various types of food including vegetables, eggs, and poultry often causing insufficiency of diet among consumers in the Tibetan autonomous region. Besides, Tibetan Buddhists do not consume fish further the improving the DSI of the residents yet in a relatively low level of change compared to other regions (Figure 3).
The spatial clustering of DSI provides actionable insights for targeted policy interventions. In high-DSI regions (e.g., northeastern and coastal provinces such as Beijing, Liaoning, and Shandong), where dietary diversity approaches recommended guidelines but overreliance on animal-based foods persists, policymakers should prioritize public health campaigns to promote plant-based diets and reduce excessive meat consumption, leveraging urban infrastructure for nutrition education and subsidizing healthier food options in markets. For instance, cities like Beijing and Shanghai could integrate dietary guidelines into school curricula and workplace wellness programs, while offering tax incentives for retailers to stock plant-based alternatives (Wang et al., 2023). Conversely, in low-DSI clusters (e.g., southwestern and remote regions such as Yunnan, Guizhou, and Tibet), where dietary imbalances stem from limited access to diverse foods, interventions must address structural barriers: in addition to incentivizing local production of vegetables and legumes through agricultural subsidies (e.g., grants for greenhouse farming in Tibet), promoting the commercialization of traditional and autochthonous foods could enhance dietary diversity while aligning with sustainable food systems. For example, Yunnan’s ethnic minority regions could develop geographical indication products for traditional crops like wild mushrooms and colored rice, leveraging e-commerce platforms to expand market access (Pretty et al., 2018). In Tibet, integrating highland barley—a climate-resilient staple with cultural significance—into urban food supply chains through public-private partnerships could improve both nutritional diversity and local agricultural livelihoods (Bellemare et al., 2020). Such initiatives not only address food accessibility but also preserve agro-biodiversity and cultural heritage, supporting long-term sustainability.
Further measures include expanding cold-chain logistics to enhance perishable food distribution (Xue et al., 2021), establishing community-based nutrition programs to improve food literacy (Yang and Zhen, 2019), and fostering cross-regional collaborations for neighboring provinces with contrasting DSI levels (e.g., H-L outliers like Chongqing), such as joint subsidies for interprovincial food supply chains or shared public health initiatives (Zhang et al., 2021). By aligning zoning regulations (e.g., prioritizing markets in low-DSI areas) and fiscal policies (e.g., tax breaks for nutrient-dense food retailers) with spatial agglomeration patterns, China can bridge regional dietary gaps while offering a model for other nations navigating similar transitions (Meng et al., 2020). These measures directly address the spatiotemporal disparities identified in the study, ensuring that policy actions are both geographically precise and scalable to national goals.
This study has several limitations that warrant consideration. First, the analysis relied on provincial-level data from China (2015–2022), which may overlook intra-regional heterogeneity and short-term fluctuations in dietary patterns. Second, the exclusion of granular food categories (e.g., processed foods, micronutrient intake) limits the holistic assessment of dietary quality. Third, spatial econometric models assume static spatial relationships, potentially underestimating dynamic interactions across regions. While findings are context-specific to China’s urbanization and policy landscape, the mechanisms linking socioeconomic factors (e.g., urbanization, education) to dietary transitions may hold relevance for other developing nations undergoing similar nutritional shifts. For instance, regions in Southeast Asia or Sub-Saharan Africa with rising incomes and urban sprawl might experience comparable trends toward animal-based diets and spatial agglomeration effects. However, cultural preferences, agricultural policies, and infrastructure disparities could modulate these patterns, necessitating localized adaptations of interventions. Future studies should validate these frameworks in diverse settings to enhance cross-regional applicability.
5 Conclusion
The DSI of Chinese urban residents showed a significant upward trend from 2015 to 2022, with the gap narrowing gradually between observed diets and the balanced dietary pattern recommended in the Chinese Dietary Guidelines for Residents (2022). The comprehensive and animal-based DSIs improved rapidly, characterized by spatially concentrated distributions and a reduction in low-value regions; however, both remained far from the recommended balanced pattern, though inter-provincial disparities decreased moderately. The plant-based DSI showed steady improvement, but its upward trajectory was limited by already high baseline consumption of plant-based foods. Spatially, the DSI exhibited a clear northeast-to-southwest gradient, with significant spatial agglomeration. The comprehensive and animal-based DSIs demonstrated stronger clustering than the plant-based DSI, likely due to more uniform plant-based food consumption across regions. Socioeconomic factors played a critical role: DSI correlated positively with consumption capacity, urbanization, and education level, and negatively with the consumer price index.
From a policy perspective, these findings advocate spatially tailored interventions. In high-DSI regions, strategies should focus on curbing excessive meat consumption through subsidies for plant-based foods (e.g., vegetables, legumes) and integrating nutrition education into urban public health systems. Low-DSI areas require investments in cold-chain logistics and agricultural subsidies to enhance access to diverse, perishable foods, complemented by community nutrition programs to improve dietary literacy. Leveraging spatial spillover effects (identified through spatial econometric models), cross-regional collaborations—such as inter-provincial cold-chain networks and joint agricultural subsidy schemes—could amplify policy efficacy. Scientifically, this study advances the application of spatial econometrics in dietary research, addressing gaps in regional dietary disparities and reinforcing the role of geographic context in shaping nutritional outcomes.
Data availability statement
The original contributions presented in the study are included in the article/supplementary material, further inquiries can be directed to the corresponding author.
Author contributions
TC: Data curation, Investigation, Software, Writing – original draft. ZG: Conceptualization, Formal analysis, Funding acquisition, Supervision, Writing – review & editing. SC: Funding acquisition, Writing – review & editing. GK: Formal analysis, Writing – review & editing. SY: Visualization, Formal analysis, Writing – review & editing.
Funding
The author(s) declare that financial support was received for the research and/or publication of this article. This research was financially supported by the National Natural Science Foundation of China (W2412156; 42161144003), the Open Fund Project of the Key Laboratory of Lake and Watershed Science for Water Security (2024SKL020), the General Project of Basic Science (Natural Science) Research in Jiangsu Provincial Colleges and Universities (24KJB170016), and the National Key R&D Program of China (2018YFE0105900).
Conflict of interest
The authors declare that the research was conducted in the absence of any commercial or financial relationships that could be construed as a potential conflict of interest.
Generative AI statement
The authors declare that no Gen AI was used in the creation of this manuscript.
Publisher’s note
All claims expressed in this article are solely those of the authors and do not necessarily represent those of their affiliated organizations, or those of the publisher, the editors and the reviewers. Any product that may be evaluated in this article, or claim that may be made by its manufacturer, is not guaranteed or endorsed by the publisher.
References
Anselin, L. (1988). Spatial econometrics: methods and models. Berlin: Springer. Available at: https://link.springer.com/book/10.1007/978-94-015-7799-1
Ax, E., Warensjö Lemming, E., Becker, W., Andersson, A., Lindroos, A. K., Cederholm, T., et al. (2015). Dietary patterns in Swedish adults; results from a national dietary survey. Br. J. Nutr. 115, 95–104. doi: 10.1017/S0007114515004110
Bellemare, M. F., Okello, G., and Jayne, T. S. (2020). Agricultural commercialization and food security in sub-Saharan Africa. J. Dev. Econ. 143:102479. Available at: https://original-ufdc.uflib.ufl.edu/UFE0049632/00001
Chen, G. Z. (2012). Exploring the factors influencing residents' food consumption and dietary nutrition. China Health Care Nutr. 22, 4832–4833. (in Chinese).
FAO. (2023). Food security and nutrition. Available online at: https://www.fao.org/faostat/en/#data/FS (Accessed November 11, 2024).
Gao, L. W., Xu, Z. R., Xu, S. W., Zhang, X. Z., Yu, C. Q., Sun, W., et al. (2017). Food consumption structure and dietary nutrition of residents in rural Tibet. Resour. Sci. 39, 168–174. (in Chinese)
Ha, D., Arora, A., Harford, J., Luzzi, L., Chrisopoulos, S., and Do, L. (2022). Population impact of sugar-sweetened beverages on dental caries and overweight/obesity in Australian children. JDR Clin. Transl. Res. 8, 224–233. doi: 10.1177/238008442210917
Hou, X., Song, B., Zhang, X., Wang, X., and Li, D. (2024). Multi-scenario simulation and spatial-temporal analysis of LUCC in China’s coastal zone based on coupled SD-FLUS model. Chin. Geogr. Sci. 34, 579–598. doi: 10.1007/s11769-024-1439-4
Imaeda, N., Wakai, K., Goto, C., Kamano, S. K., Nanri, H., Hosono, S., et al. (2015). Optimal food consumption among Japanese adults with adequate nutritional intake according to the dietary reference intakes for Japanese. Int. J. Epidemiol. 44:i113. doi: 10.1093/ije/dyv096.078
Li, S., Chen, X., Ren, Y., and Glauben, T. (2024). The impact of demographic dynamics on food consumption and its environmental outcomes: evidence from China. J. Integr. Agric. 23, 414–429. doi: 10.1016/j.jia.2023.11.017
Li, Y. Y., Wang, E. L., Liu, X. J., and Cheng, S. K. (2018). Structure and characteristics of food consumption of Rura households in Shandong Province based on household tracking survey. J. Nat. Resour. 33, 978–991. (in Chinese)
Li, Y., Zhang, Y., Zhang, X., Zhao, J., Huang, Y., Wang, Z., et al. (2024). Distribution of geothermal resources in Eryuan County based on entropy weight TOPSIS and AHP–TOPSIS methods. Nat. Gas Ind. sstry B 11, 213–226. doi: 10.1016/j.ngib.2024.03.002
Lu, Y., Wang, J., Liu, J., Qin, F., and Wang, J. (2022). Evaluating water withdrawals for regional water management under a data-driven framework. Chin. Geogr. Sci. 32, 521–536. doi: 10.1007/s11769-022-1281-5
Majumder, S., Roy, S., Bose, A., and Chowdhury, I. R. (2023a). Multiscale GIS based-model to assess urban social vulnerability and associated risk: evidence from 146 urban centers of eastern India. Sustain. Cities Soc. 96:104692. doi: 10.1016/j.scs.2023.104692
Majumder, S., Roy, S., Bose, A., and Chowdhury, I. R. (2023b). Understanding regional disparities in healthcare quality and accessibility in West Bengal, India: a multivariate analysis. Reg. Sci. Policy Pract. 15, 1086–1114. doi: 10.1111/rsp3.12607
Meng, F. Y., Xu, Y. Q., and Zhang, L. J. (2020). Food consumption and policy implications of urban and rural residents in China. Resour. Sci. 32, 1333–1341. (In Chinese)
NBSC (2016–2023c). China social development and statistical bulletin. Beijing: China Statistics Press (in Chinese).
NSCPRC (National Health Commission of the People’s Republic of China). (2023). Chinese Residents’ Nutrition and Health Status Report 2022. Beijing: People’ Medical Publishing House.
Nunes, R., Silva, V., Consiglio-Kasemodel, M. G., Polizer, Y. J., Saes, M. S., and Fávaro-Trindade, C. S. (2020). Assessing global changing food patterns: a country-level analysis on the consumption of food products with health and wellness claims. J. Clean. Prod. 264:121613. doi: 10.1016/j.jclepro.2020.121613
Nurhasan, M., Ariesta, D. L., Utami, M. M. H., Fahim, M., Aprillyana, N., Maulana, A. M., et al. (2024). Dietary transitions in Indonesia: the case of urban, rural, and forested areas. Food Secur. 16, 1313–1331. doi: 10.1007/s12571-024-01488-3
Padwal, R. S., Hackam, D. G., Khan, N. A., and Tobe, S. W. (2016). Primary prevention of CVD: modification of diet in people with hypertension. BMJ Clin. Evid., 2016. Available online at: https://www.ncbi.nlm.nih.gov/pmc/articles/PMC4701123/pdf/2016-0214.pdf (Accessed November 12, 2024).
Pan, X., Wang, L., and Pan, A. (2021). Epidemiology and determinants of obesity in China. Lancet Diabetes Endocrinol. 9, 373–392. doi: 10.1016/S2213-8587(21)00045-0
Pretty, J. N., Bharucha, Z. P., and McLean, A. J. (2018). Sustainable intensification in agriculture: premises and policies. Annu. Rev. Environ. Resour. 341, 33–34. doi: 10.1126/science.1234485
Roy, S., Bose, A., Majumder, S., Chowdhury, I. R., Abdo, H. G., Almohamad, H., et al. (2022). Evaluating urban environment quality (UEQ) for class-I Indian city: an integrated RS-GIS based exploratory spatial analysis. Geocarto Int. 38:2153932. doi: 10.1080/10106049.2022.2153932
Roy, S., and Chowdhury, I. R. (2025). Brighter nights, safer cities? Exploring spatial link between VIIRS nightlight and urban crime risk. Remote Sens. Appl.: Soc. Environ. 37:101489. doi: 10.1016/j.rsase.2025.101489
Roy, S., Majumder, S., Bose, A., and Chowdhury, I. R. (2023). Does geographical heterogeneity influence urban quality of life? A case of a densely populated Indian City. Pap. Appl. Geogr. 9, 395–424. doi: 10.1080/23754931.2023.2225541
Roy, S., Majumder, S., Bose, A., and Chowdhury, I. R. (2024a). The rich-poor divide: unravelling the spatial complexities and determinants of wealth inequality in India. Appl. Geogr. 166:103267. doi: 10.1016/j.apgeog.2024.103267
Roy, S., Majumder, S., Bose, A., and Chowdhury, I. R. (2024b). Spatial heterogeneity in the urban household living conditions: A-GIS-based spatial analysis. Ann. GIS 30, 81–104. doi: 10.1080/19475683.2024.2304194
Shen, J., Wilmot, K. A., Ghasemzadeh, N., Molloy, D. L., Burkman, G., Mekonnen, G., et al. (2015). Mediterranean dietary patterns and cardiovascular health. Annu. Rev. Nutr. 35, 425–449. doi: 10.1146/annurev-nutr-011215-025104
Shi, C., Wu, C., Zhang, J., Zhang, C., and Xiao, Q. (2022). Impact of urban and rural food consumption on water demand in China—from the perspective of water footprint. Sustain. Prod. Consum. 34, 148–162. doi: 10.1016/j.spc.2022.09.006
Turner, C., Aggarwal, A., Walls, H., Herforth, A., Drewnowski, A., Coates, J., et al. (2018). Concepts and critical perspectives for food environment research: a global framework with implications for action in low- and middle-income countries. Glob. Food Sec. 18, 93–101. doi: 10.1016/j.gfs.2018.08.003
UN (2015). The 2030 agenda for sustainable development: Resolution / adopted by the general assembly, 2015. Transforming our world: the 2030 Agenda for Sustainable Development. Available at: https://digitallibrary.un.org/record/3923923
Wang, J. (1998). Analysis of the Characteristics, Influencing Factors, and Countermeasures of Food Consumption in China. China Soft Science, 6, 93–96, 102. (in Chinese).
Wang, J. (2012). Analysis of the characteristics, influencing factors, and countermeasures of food consumption in China. China Soft Sci. 102, 93–96. (in Chinese)
Wang, Z. W., Chen, H. Y., and Zhu, X. H. (2023). Regional differences and health effects of dietary pattern of Chinese residents. Sci. Geogr. Sin. 43, 1825–1836. (In Chinese)
Wang, L. E., Guo, J. X., Fen, L., Luo, Y. H., Zhang, X. Z., Fan, Y. Z., et al. (2021). The structure and characteristics of resident food consumption in rural areas of the Tibetan plateau: taking three-Rivers region in Tibet as an example. Acta Geograph. Sin. 76, 2104–2117. (in Chinese)
Wang, L., Huang, W., Zhao, C., Hu, Y., and Cui, S. (2022). Exploring the environment-nutrition-obesity effects associated with food consumption in different groups in China. J. Environ. Manag. 317:115287. doi: 10.1016/j.jenvman.2022.115287
Xiong, X., Zhang, L., Hao, Y., Zhang, P., Chang, Y., and Liu, G. (2019). Urban dietary changes and linked carbon footprint in China: a case study of Beijing. J. Environ. Manag. 255:109877. doi: 10.1016/j.jenvman.2019.109877
Xue, L., Liu, X., Lu, S., Cheng, G., Hu, Y., Liu, J., et al. (2021). China’s food loss and waste embodies increasing environmental impacts. Nat. Food 2, 519–528. doi: 10.1038/s43016-021-00317-6
Yang, Q., Wang, L., Qin, X., Fan, Y., Wang, Y., and Ding, L. (2022). Urban land use efficiency and contributing factors in the Yangtze River Delta under increasing environmental restrictions in China. Chin. Geogr. Sci. 32, 883–895. doi: 10.1007/s11769-022-1306-0
Yang, W. N., and Zhen, L. (2019). Food consumption features and influencing factors in Xilin Gol grassland transect. Chin. J. Agric. Resour. Reg. Plan. 40, 203–213. (in Chinese)
Yin, T. K. (2013). A brief analysis of the geographical factors influencing the differentiation of Chinese food culture. J. TaiYuan Urban Vocational Coll. 5, 76–77. (In Chinese)
Yu, G., Lu, R., Yang, J., Rahman, M. L., Li, L., Wang, D. D., et al. (2024). Healthy dietary patterns are associated with exposure to environmental chemicals in a pregnancy cohort. Nat. Food 5, 563–568. doi: 10.1038/s43016-024-01013-x
Yuan, M., Seale, J. L. Jr., Wahl, T., and Bai, J. (2019). The changing dietary patterns and health issues in China. China Agric. Econ. Rev. 11, 143–159. doi: 10.1108/CAER-12-2017-0254
Keywords: dietary structure, spatiotemporal differentiation, influencing factors, spatial econometric model, urban residents
Citation: Chen T, Guo Z, Chen SS, Kattel GR and Yao S (2025) Spatiotemporal differences and influencing factors of the dietary structure index in Chinese urban residents. Front. Sustain. Food Syst. 9:1548702. doi: 10.3389/fsufs.2025.1548702
Edited by:
Kathleen L. Hefferon, Cornell University, United StatesReviewed by:
Subham Roy, University of North Bengal, IndiaAdriana Marcela Ruiz Pineda, University of Antioquia, Colombia
Copyright © 2025 Chen, Guo, Chen, Kattel and Yao. This is an open-access article distributed under the terms of the Creative Commons Attribution License (CC BY). The use, distribution or reproduction in other forums is permitted, provided the original author(s) and the copyright owner(s) are credited and that the original publication in this journal is cited, in accordance with accepted academic practice. No use, distribution or reproduction is permitted which does not comply with these terms.
*Correspondence: Zheng Guo, MDAzNTgzQG51aXN0LmVkdS5jbg==