 Andi Weummung Haruna1,2
 Muslim Salam3*Andi Amran Sulaiman3Rahmadanih Rahmadanih3Muhammad Hatta Jamil1,3Wempie Pakiding4A. Nixia Tenriawaru5Akhsan Akhsan3Mahyuddin Mahyuddin3Nurbaya Busthanul3Letty Fudjaja5Heliawaty Heliawaty3Ahmad Imam Muslim6Hamed Noralla Bakheet Ali7Muhammad Ridwan8
- 1Agribusiness Study Program, Graduate School of Hasanuddin University, Makassar, Indonesia
- 2Department of Animal Health of Office Animal Husbandry and Health Service South Sulawesi Province, Makassar, Indonesia
- 3Laboratory of Agricultural Development, Department of Socio-economics of Agriculture, Faculty of Agriculture, Hasanuddin University, Makassar, Indonesia
- 4Faculty of Animal Husbandry, Hasanuddin University, Makassar, Indonesia
- 5Department of Socio-economics of Agriculture, Faculty of Agriculture, Hasanuddin University, Makassar, Indonesia
- 6The United Graduate School of Agriculture Sciences, Kagoshima University, Kagoshima, Japan
- 7Agricultural Economics and Rural Development, Faculty of Agriculture, Omdurman Islamic University, Al-Khartoum, Sudan
- 8Agricultural Information Institute (AII), Chinese Academy of Agricultural Sciences, Haidian, China
The poultry farming industry is a substantial contributor to Indonesia’s economy. It helps with the country’s food security policy, unemployment relief, and development strategy. Therefore, this study aimed to examine the effect of farmers’ characteristics and production costs on the income of layer chicken farms in Pinrang District, Indonesia. The binary logistic regression model was employed to meet the research objective. We then conducted a census of 109 layer chicken breeders to serve as the research respondents. Twelve independent variables were examined to analyze the direct effect of farmers’ characteristics and production costs on the income of layer chicken farms as the dependent variables. The research findings indicated that the variables of breeder experiences (BEX), cost of labor (COL), cost of seeds (COS), cost of feeds (COF), cost of electricity (COE), cost of vaccine (COC), and cost of vitamin (COV) had a significant effect on the income of layer chicken farms. Meanwhile, the independent variables of breeder age (BA), gender (G), breeder education (BE), capital (C), and cost of medicine (COM) had no significant effect. These findings provide essential and critical data and valuable insights for supporting and enhancing the breeder income of the layer chicken farm. The findings reasonably conclude that production cost management and the breeder experience primarily determine breeder income. As a result, some policy actions and a management plan were suggested to help breeders increase their profits as part of the livestock sector’s efforts to achieve sustainable production and a strategy for steady income. Generally, the breeders’ most significant policy goal is to reduce production costs. Prioritizing low-cost production management is crucial, particularly in lowering labor expenses, seeds, feeds, electricity, vaccines, and vitamins. Moreover, the breeder’s experience was an important thing to consider in increasing the breeder’s income. This implies that breeders should enhance their poultry management skills, especially in analyzing and managing production costs.
1 Introduction
The poultry farming industry substantially contributes to Indonesia’s economy (Ferlito and Respatiadi, 2019; Hasan et al., 2023). It also helps with the country’s food security policy, unemployment relief, and development strategy (Wahyono and Utami, 2018). Furthermore, it is a significant source of revenue generation for small farmers in developing countries (Attia et al., 2022), including Indonesia, as well as an essential livestock production activity in rural and peri-urban areas (Birhanu et al., 2023), despite significant challenges and emerging potential (Bist et al., 2024). The poultry industry contributes significantly to the country’s economy and provides the Indonesian populace with protein (Ali et al., 2021). The average income in a livestock business, particularly the poultry industry, provides a clear picture of the importance of breeders in developing their business, even though it requires large production costs (Triana et al., 2007). In order to meet the needs of the population and other businesses for eggs, the layer farming industry is expanding quite quickly (Prasetyo, 2018). This is because the layer business is one type that still has great potential to be developed (Yana et al., 2022). Furthermore, poultry farming is essential for rapid economic growth, particularly in low-income countries (Ekunwe et al., 2006). Economically, layer farming is a profitable business because capital turnover and production costs only require a short time (Mulyono et al., 2017). The production and development of laying hens are also expected to meet the fulfillment of domestic production and obtain multi-functional benefits from business units, including optimizing the working hours of farmers and overcoming domestic unemployment problems (Parasdya et al., 2013). Smallholder farmers in rural areas chose the laying hens business because it was easy to handle and resulted in a good income (Sofyan et al., 2019). Moreover, it is known in Niger that commercial layer production is not only a source of quality protein but also the most significant income compared to other livestock production activities (Ijaiya et al., 2012). Besides being a good income, egg production also plays a vital role in supplying protein for rural communities (Ymeri et al., 2017). The livestock business is conducted by many smallholders in rural areas of Indonesia (Agus et al., 2020). Indonesia has a population increase of around 1.49% per year. The spotlight is also on the livestock sector. This is because livestock farming in developing countries contributes significantly to people’s income and plays a crucial socio-economic role (Thornton and Gerber, 2010). Therefore, Indonesia presents significant opportunities for developing the poultry industry (Haryuni and Fanani, 2017).
South Sulawesi Selatan Province is one of the centers of the layer chicken business in Indonesia, contributing significantly to the national egg supply. South Sulawesi Selatan Province produced 210,302 tons of eggs in 2023, compared to 6,117,905 tons produced nationally. Meanwhile, the national layer chicken population was 407,980,418 and the South Sulawesi Selatan Province layer population was 14,024,276 (Directorate General of Food Crops, 2023). The following, as presented in Figure 1, shows the layer of chicken population and egg production in 2019–2023 in South Sulawesi Selatan Province.
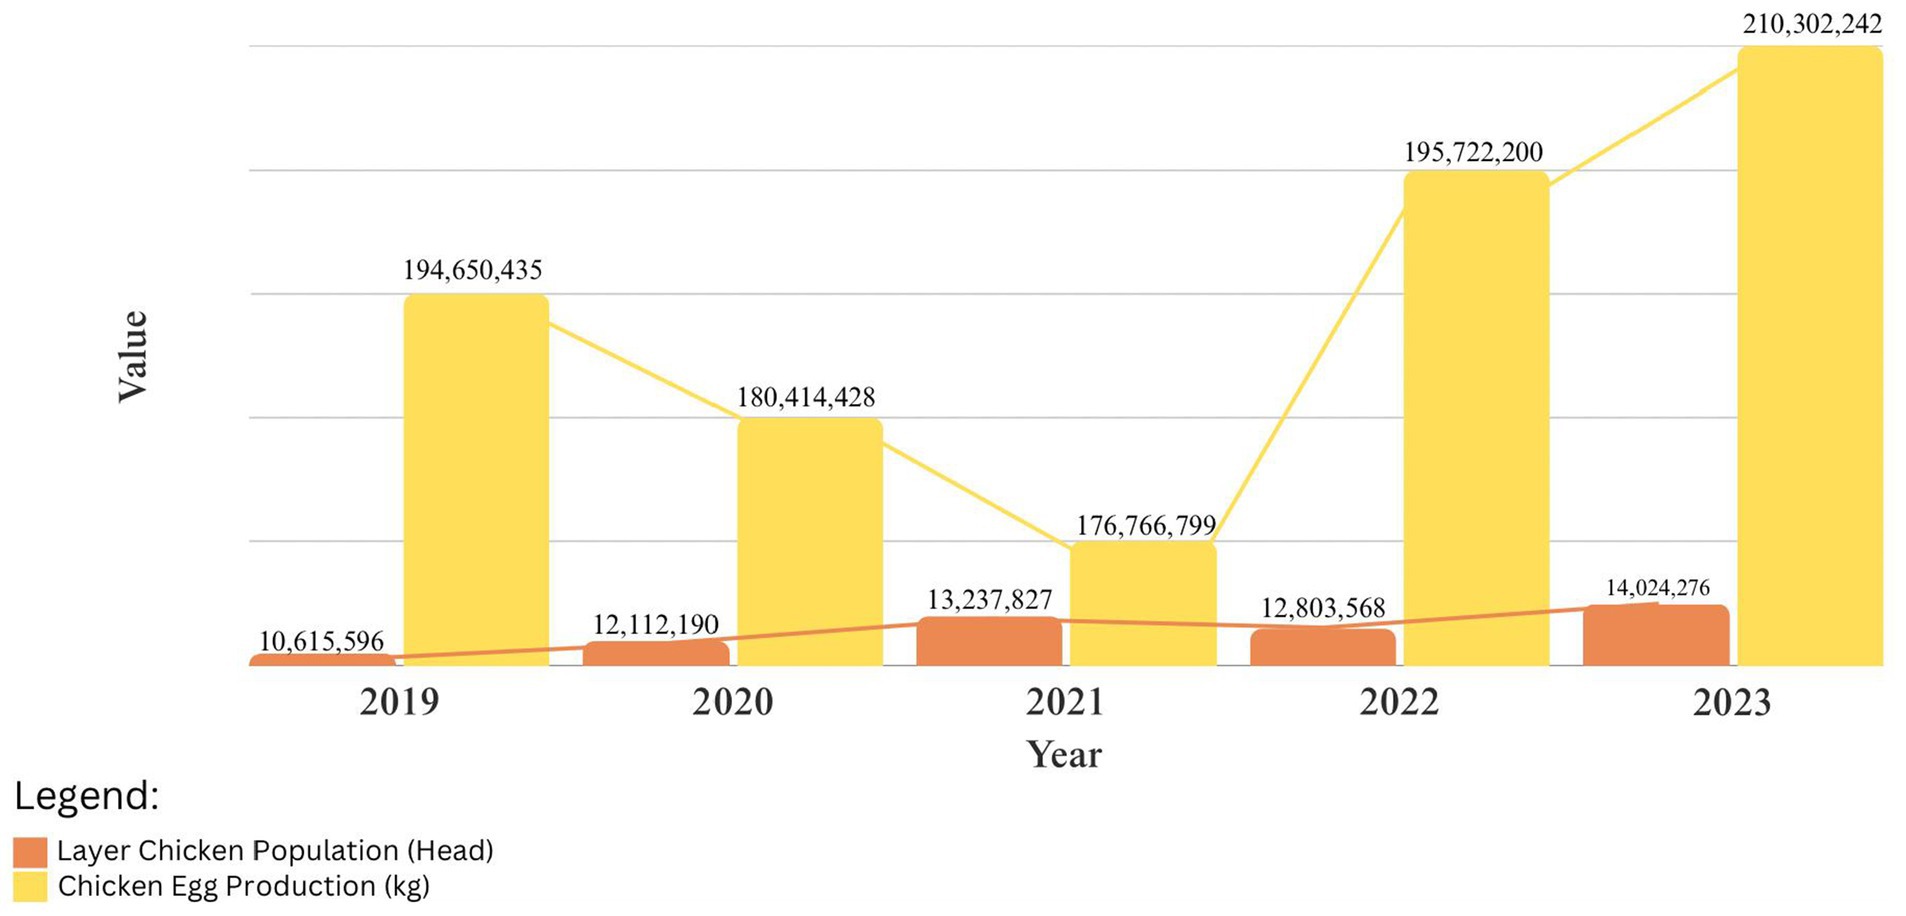
Figure 1. Population and production of layer chicken in South Sulawesi Selatan Province.
Figure 1 shows that from 2019 to 2021, the layer population in the province experienced a consecutive increase, but decreased again in 2022 and increased again in 2023. The same figure shows a successive decrease in egg production from 2019 to 2021, then an increase from 2022 to 2023 (Badan Pusat Statistik Provinsi Sulsel, 2024). Based on these data, it can be seen that the layer population and egg production in South Sulawesi Selatan is experiencing instability; of course, the instability that occurs is caused by several factors, one of which is production factors because the use of production factors carried out by production factors, because the proper use of production factors will prevent farmers from inefficiency. The appropriate use of production factors will deter farmers from inefficiency in achieving optimal production (Abadi et al., 2022). According to Murib et al. (2014), the production factors include labor, cages, medicines, seeds, and feed. Therefore, it is essential to optimize production factors, as a continuous decline in production will affect income. The objective of this study was to analyze the effect of farmers’ characteristics and production costs on the income of layer chicken farms. The study was intended to be on the lookout for an applicable management plan for boosting breeders’ income and maximizing the income of the laying hen business.
2 Literature review and conceptual framework
2.1 Production cost
In a confined context, costs represent the sacrifices of economic resources to obtain goods (Mulyadi, 2000). Production costs are expenses directly linked to the manufacturing sector, encompassing those incurred in transforming raw materials into finished items until the product is ultimately prepared for sale (Purwaji et al., 2017). Production costs encompass all expenditures enterprises incur for functions or activities related to converting raw materials into marketable final products (Hidayat and Halim, 2013). Purwoko et al., 2022 define production cost as the corporation’s aggregate expense in converting raw resources into completed products prepared for market transactions. Lastianti et al., 2018 assert that production processes, particularly transforming raw materials into semi-finished or finished products, incur several production costs that cumulatively constitute the entire cost of commodities manufactured. Tugiyanto and Mudawaroh, 2013 elucidated that various production factors, including feed, labor, and medications, concurrently influence the net revenue and efficiency of layer farms in the Wonosobo Region. Managing a layered enterprise has various production expenses:
2.1.1 Capital, seeds, and feed
Capital is fundamental in establishing a business to produce revenue (Adila and Mustahidda, 2024). The financial resources a corporation allocates will influence its revenue generation. Sufficient capital is crucial for a firm to operate efficiently. Substantial capital will enable the business to increase its sales of goods. This will also influence the revenue level. Similarly, insufficient capital will significantly restrict the capacity to maintain enough inventory (Andi et al., 2020). Capital movements can influence income distribution (Liu et al., 2023). Aprilia, 2018 research demonstrates that corporate capital has a substantial influence on income generation. Muntari’s (2007) research findings indicate a positive and significant correlation between the level of business capital and the revenue of entrepreneurs. Furthermore, Utami and Wibowo, 2013 asserts that the outcomes of hypothesis testing indicate that working capital exerts a positive and significant influence on the income of traders at the Surakarta Klithikan Notoharjo Market. Selecting high-quality seeds can lead to increased productivity. High productivity will have an indirect effect on income. Previous research, particularly that of Dewanti and Sihombing (2012) and Helmi et al. (2018), has confirmed that seed costs have a favorable impact on income. In addition to quality, market share might impact seed prices. According to Cahyono’s (2011) assessment, market share substantially affects the cost of free-range hens, and this fluctuation occurs regularly, influencing revenue.
Animal feed is a comprehensive feed product made from various raw ingredients from plants and animals and from pharmaceutical and industrial sources (Sapkota et al., 2007). Furthermore, producers incur expenses when they offer surplus feed. According to Shahzadi et al., 2006, feed efficiency refers to a livestock’s ability to use its feed to attain a specified body weight or production, particularly meat and eggs. According to Permatahati et al. (2019), feed is the most significant cost element. Feed expenses contribute 60–80% of total production costs. According to Mluge et al.'s (2022) research, feed expenses make up a significant share of the variable and total production costs of laying hens, at 71.4%. Malarvizhi and Geetha (2015) state that layer farmers are mainly concerned with feed costs and poor egg prices. As a result, there is a strong correlation between feed costs and income. Several researchers, including Helmi et al. (2018) and Tumion et al. (2017), suggest that feed costs have a significant influence on income.
2.1.2 Vaccines, medicines, and vitamins
According to Verbeke et al. (2015), animal health is a determining element in the success of a livestock business. The costs of vaccinations, vaccine administration (including labor and equipment), monitoring, laboratory testing, and other related activities must all be considered and accounted for (Marangon, 2006). Vaccines are vital, but so are vitamins and medications. Vaccines, drugs, and vitamins are administered to livestock to prevent and treat disease. Wekhe et al. (2012) investigated the medical expenses associated with commercial broiler production in the tropics. The study suggested that the cost of medication had no detrimental influence on manufacturing costs. Tao et al. (2016) demonstrate that parasites significantly reduce host fitness. This highlights the importance of a management program that can detect these parasites and support farmers in lowering treatment expenses, which can substantially burden animal care. Vitamins are compounds added to food or drink to help the body’s organs work properly (Rahmadi, 2009). These factors can help increase laying hen productivity, as healthy chicks produce more eggs.
2.1.3 Electricity and labor
Electricity and the installation of water pumps ensure that laying hens have unrestricted access to drinking water. In addition to providing drinking water, laying hens cleaned the cage equipment, such as feed and drinking stations. This is consistent with Daroini and dan Ariefianto’s (2018) view that the primary use of water is to hydrate hens and clean labor equipment. As a result, power expenses are included in production costs because they help supply the need for water and lights for livestock. Previous research by Dewanti and Sihombing (2012) found that electricity consumption has a significant impact on income.
Labor costs are incurred when using human labor (Rosdiyanti, 2017). When a company utilizes expensive labor, manufacturing costs increase, which significantly impacts revenue. However, some businesses save on labor expenditures or unpaid labor since their employees are family members or farmers. Dewanti and Sihombing's (2012) statement, which bases family labor on the number of hours worked to raise chickens rather than compensation, is consistent.
2.2 Farmer characteristics
Each farmer has a set of inherent qualities. The basis of breeders’ traits consists of behavioral, psychographic, and demographic aspects, which include age, education, and experience (Wardhani, 1994). It has become common practice for individuals to evaluate breeders’ communication skills and select appropriate media according to the source of information received.
2.2.1 Age and gender
Age is one of the characteristics that help determine whether or not an activity is successful and whether or not it is willing to be carried out. Age also affects the physical ability to work and the way of thinking (Asih, 2021). The typical salary pattern throughout a person’s life is represented by their age (Gould and Saupe, 1989). According to Halidu et al. (2021), that age range is considered to be productive, specifically between the ages of 15 and 65. A productive workforce or active working level spans the age range of 15 to 64 years. There is a consistent turnover of breeders, which suggests that there is still room for expansion in the cattle sector. This shows that there is ongoing growth in the industry. The physical capacity of farmers to manage their farms and carry out additional chores is impacted by their age level; nevertheless, once they exceed the age at which they are considered to be productive, their relative workability tends to diminish. An increase in workability and a decline in work ability will lead to different results at work, and these outcomes will surely affect revenue (Dadang, 2007).
The principle of gender is a social organization that separates society into two primary categories, referred to as “the female category and the male category” (Lorber, 2018). Despite the limited research on gender in general, Mokhlis and Salleh (2009) discovered gender variations in the decision-making process. The coefficient for gender is positive, indicating a positive association between experience and income. According to Baskoro (2014), male breeders have a bigger influence on revenue. It is possible that the participation of women in livestock husbandry could result in financial benefits, such as increased income for the family.
2.2.2 Education and farming experience
Stating that a low level of education will generally inhibit the entry of innovations (Dadang, 2007). Furthermore, according to Maryam et al. (2016), education influences mindset, attitudes, and talents, which in turn affect the productivity of livestock businesses, making it one of the key elements that impact business performance. However, this contradicts the assertion made by Utami et al. (2015) that farmers’ high levels of education do not guarantee the success of their businesses, as there is no difference in the number of livestock owned based on education. According to Okwuokenye et al., 2022 research, given the available resources, education can help farmers enhance their farming practices.
In the opinion of Hidayat and Wulantika (2021), experience plays a crucial role in a cattle breeding business’s ability to succeed. Makatita, 2014 asserted that an individual’s experience with livestock raising increases over time, providing them with greater knowledge to inform their attitude when making company management decisions. The research results by Manyamsari and Mujiburrahmad (2014) show that farmers with more than 10 years of experience are more concerned with mastering the combination of business branch behavior to increase production, while farmers with new experience are more concerned with mastering entrepreneurship and harvesting.
2.3 Conceptual framework
A conceptual framework is a network of interrelationships between variables considered integral to the dynamics of the situation under study (Kothari, 2004). Researchers and scientists from universities and research centers worldwide have extensively investigated the factors influencing income. Various institutions in Indonesia, including government offices, academic institutions, businesses, and non-governmental organizations, have researched factors that can affect the income of layer farms. Therefore, this study examines the influence of farmer characteristics and production factors on the income of layer chicken farms. The framework is summarized in Figure 2.
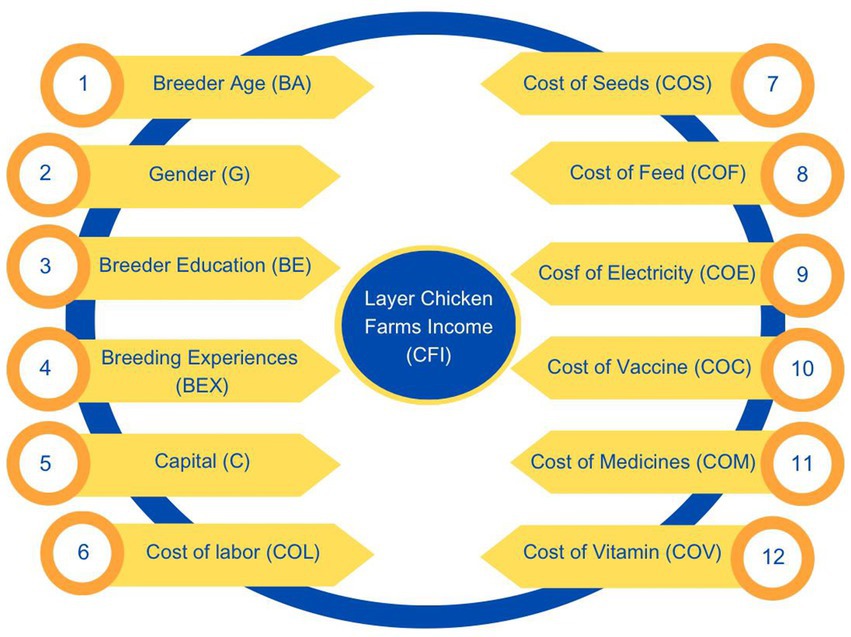
Figure 2. Conceptual framework.
3 Research methods
The study’s method was provided in this section. An overview of the research site, sample plan, respondent selection, sample data sources, and methods for data collecting and subsequent analysis were provided in this section. This study employed primary data from pre-tested questionnaires delivered to selected respondents and structured interviews.
3.1 Study location, data gathering method, and sample
Pinrang Regency was the study’s location (Figure 3). Pinrang Regency is presented in Figure 3, located in South Sulawesi Province of Indonesia (Map of Pinrang Regency, 2022; Map of South Sulawesi Province, 2019; Map of Indonesia, 2022). With its fertile land and favorable climate, the regency is an essential agricultural center in the province, producing crops and animal products. Therefore, it was selected due to its high egg production in the province of South Sulawesi. A sample of layer farmers provided primary quantitative data for this study. In May 2024, a sample of layer farmers participated in structured interviews to gather primary data. A pre-made questionnaire was used to conduct the interviews. One hundred nine farmers comprise the layer farming community, and the sample used in this study included every layer farmer in Pinrang District. We chose Pinrang District as the research location because its population continues to increase every year, unlike the pattern observed in South Sulawesi Province. Therefore, it is interesting for us to follow. Data on the layer population in Pinrang District are shown in Figure 4 (Badan Pusat Statistik Kabupaten Pinrang, 2021).
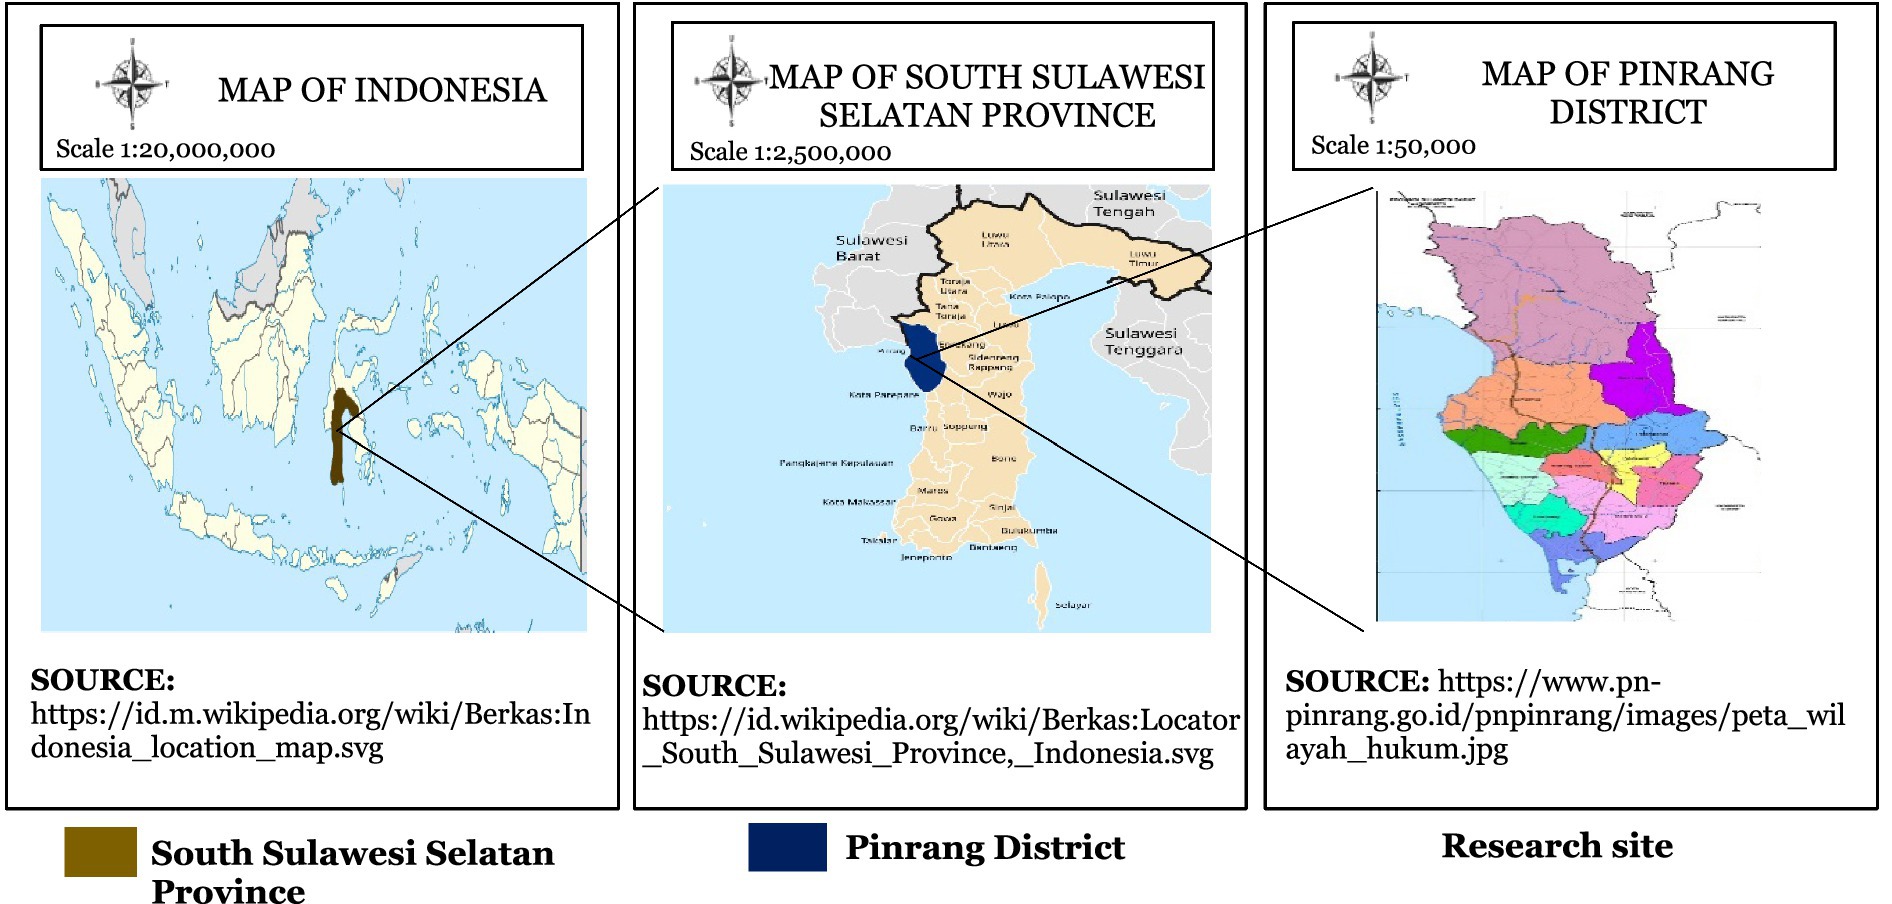
Figure 3. Research site map.
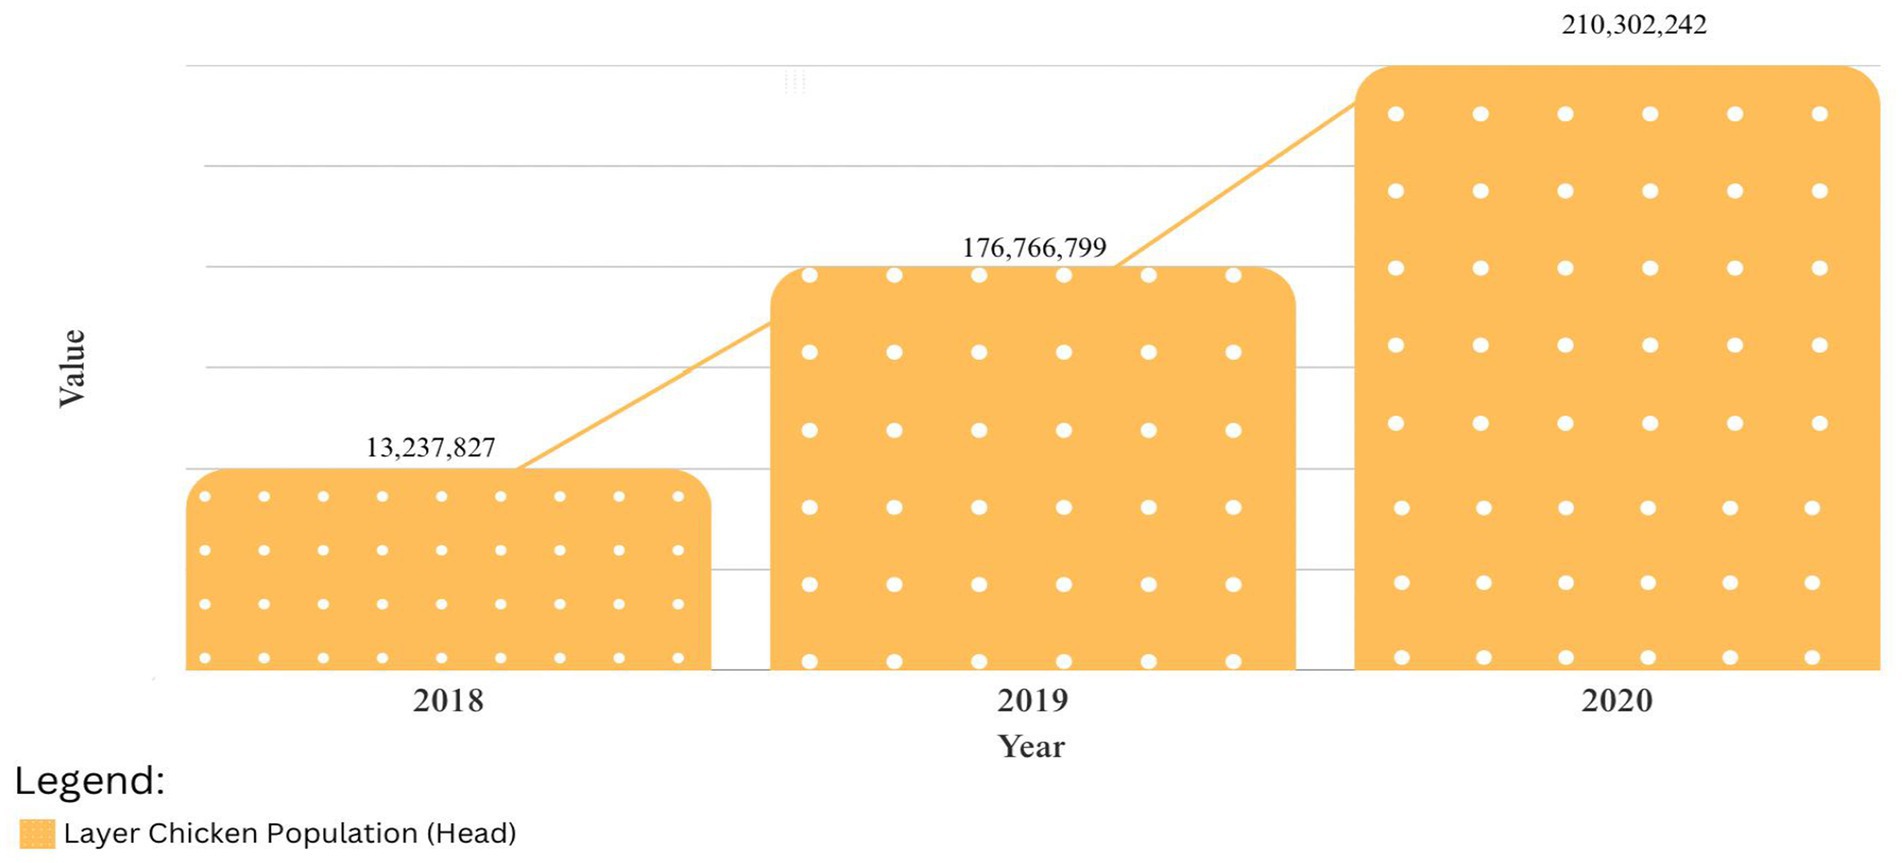
Figure 4. Population of laying hens in Pinrang District 2019–2020.
3.2 Binary logistic regression analysis
In that they use multiple regression analysis to categorical data and predictor variables (X), which might be continuous, discrete, or mixed, logistic regression models are comparable to linear regression. One of the most fundamental and widely used statistical techniques in predictive analysis is this model, so it is frequently employed in studies on adoption that use binary answer variables. This model can establish if one or more predictor variables and the response variable are causally related. This study’s dependent variable (the layer chicken farm’s income) was divided into high and low-income categories. According to Ref, the features of this data are excellent for the model. Binary logistic regression models are used in logistic models to examine how multiple independent factors affect a binary dependent variable. The regression coefficient, the coefficient’s significance, and the odds ratio are the three statistical indicators used in binary logistic regression to determine the contribution of independent factors to the dependent variable.
3.2.1 The general model of binary logistic regression
Statistical methods called regression models are employed to stop independent variables from being mined for their influence on dependent variables. The simplest type of regression model is the simple linear regression model, represented by Equation 1.
Where: Y = dependent variable; Χ1-n = independent variables; β0 = constant; β1-n = regression coefficient; ε = error.
Furthermore, the statistical technique known as logistic regression is employed to examine the correlation between one or more continuous or categorical independent variables and a dependent variable with multiple categories. A binary logistic regression model uses Dichotomous qualitative data as the response variable. According to Equation 2, a value of 1 denotes the presence of a given trait, whereas a value of 0 denotes its absence.
Where: πi = Probability of the i-th event; yi = i–th random variable with the values 0 and 1.
Equation 3 displays the format of the logistic regression model with a single predictor variable.
Furthermore, Equation 4 illustrates how π(x) in the preceding equation is transformed to create the logit logistic form of regression, which facilitates the estimation of regression parameters.
3.2.2 Specification of the research model
3.2.2.1 Empirical model, definition of operational, measurement unit, and data type
A quality, attribute, or characteristic of a person, thing, or state that shows the capacity to change is known as a variable. In social science research, elucidating cause-and-effect links between social events is frequently the study’s primary goal. For these links to exist, analyzing how one or more independent factors affect a dependent variable is necessary. The anticipated cause is typically identified as the independent variable, and the anticipated result as the dependent variable in a cause-and-effect relationship. Understanding that a variable’s status as an independent or dependent variable can fluctuate is essential. It is possible for an independent variable from one study to function as the dependent variable in another. There are three primary methods for adding variables to research hypotheses. These approaches comprise (1) assessing the influence of an independent variable on a dependent variable by comparing a group, (2) linking one or more independent variables to one or more dependent variables, and (3) summarizing the response to an independent variable. The impact of the independent variables in this study was ascertained by examining the relationship between 12 independent variables and one dependent variable, as illustrated in Figure 2. Based on Figure 2, the empirical model of the research was constructed in Equation 5.
Next, the description of each symbol in Equation 5 is shown in Table 1, clearly defining each variable, its data type, unit of measurement, and the corresponding hypothesis.
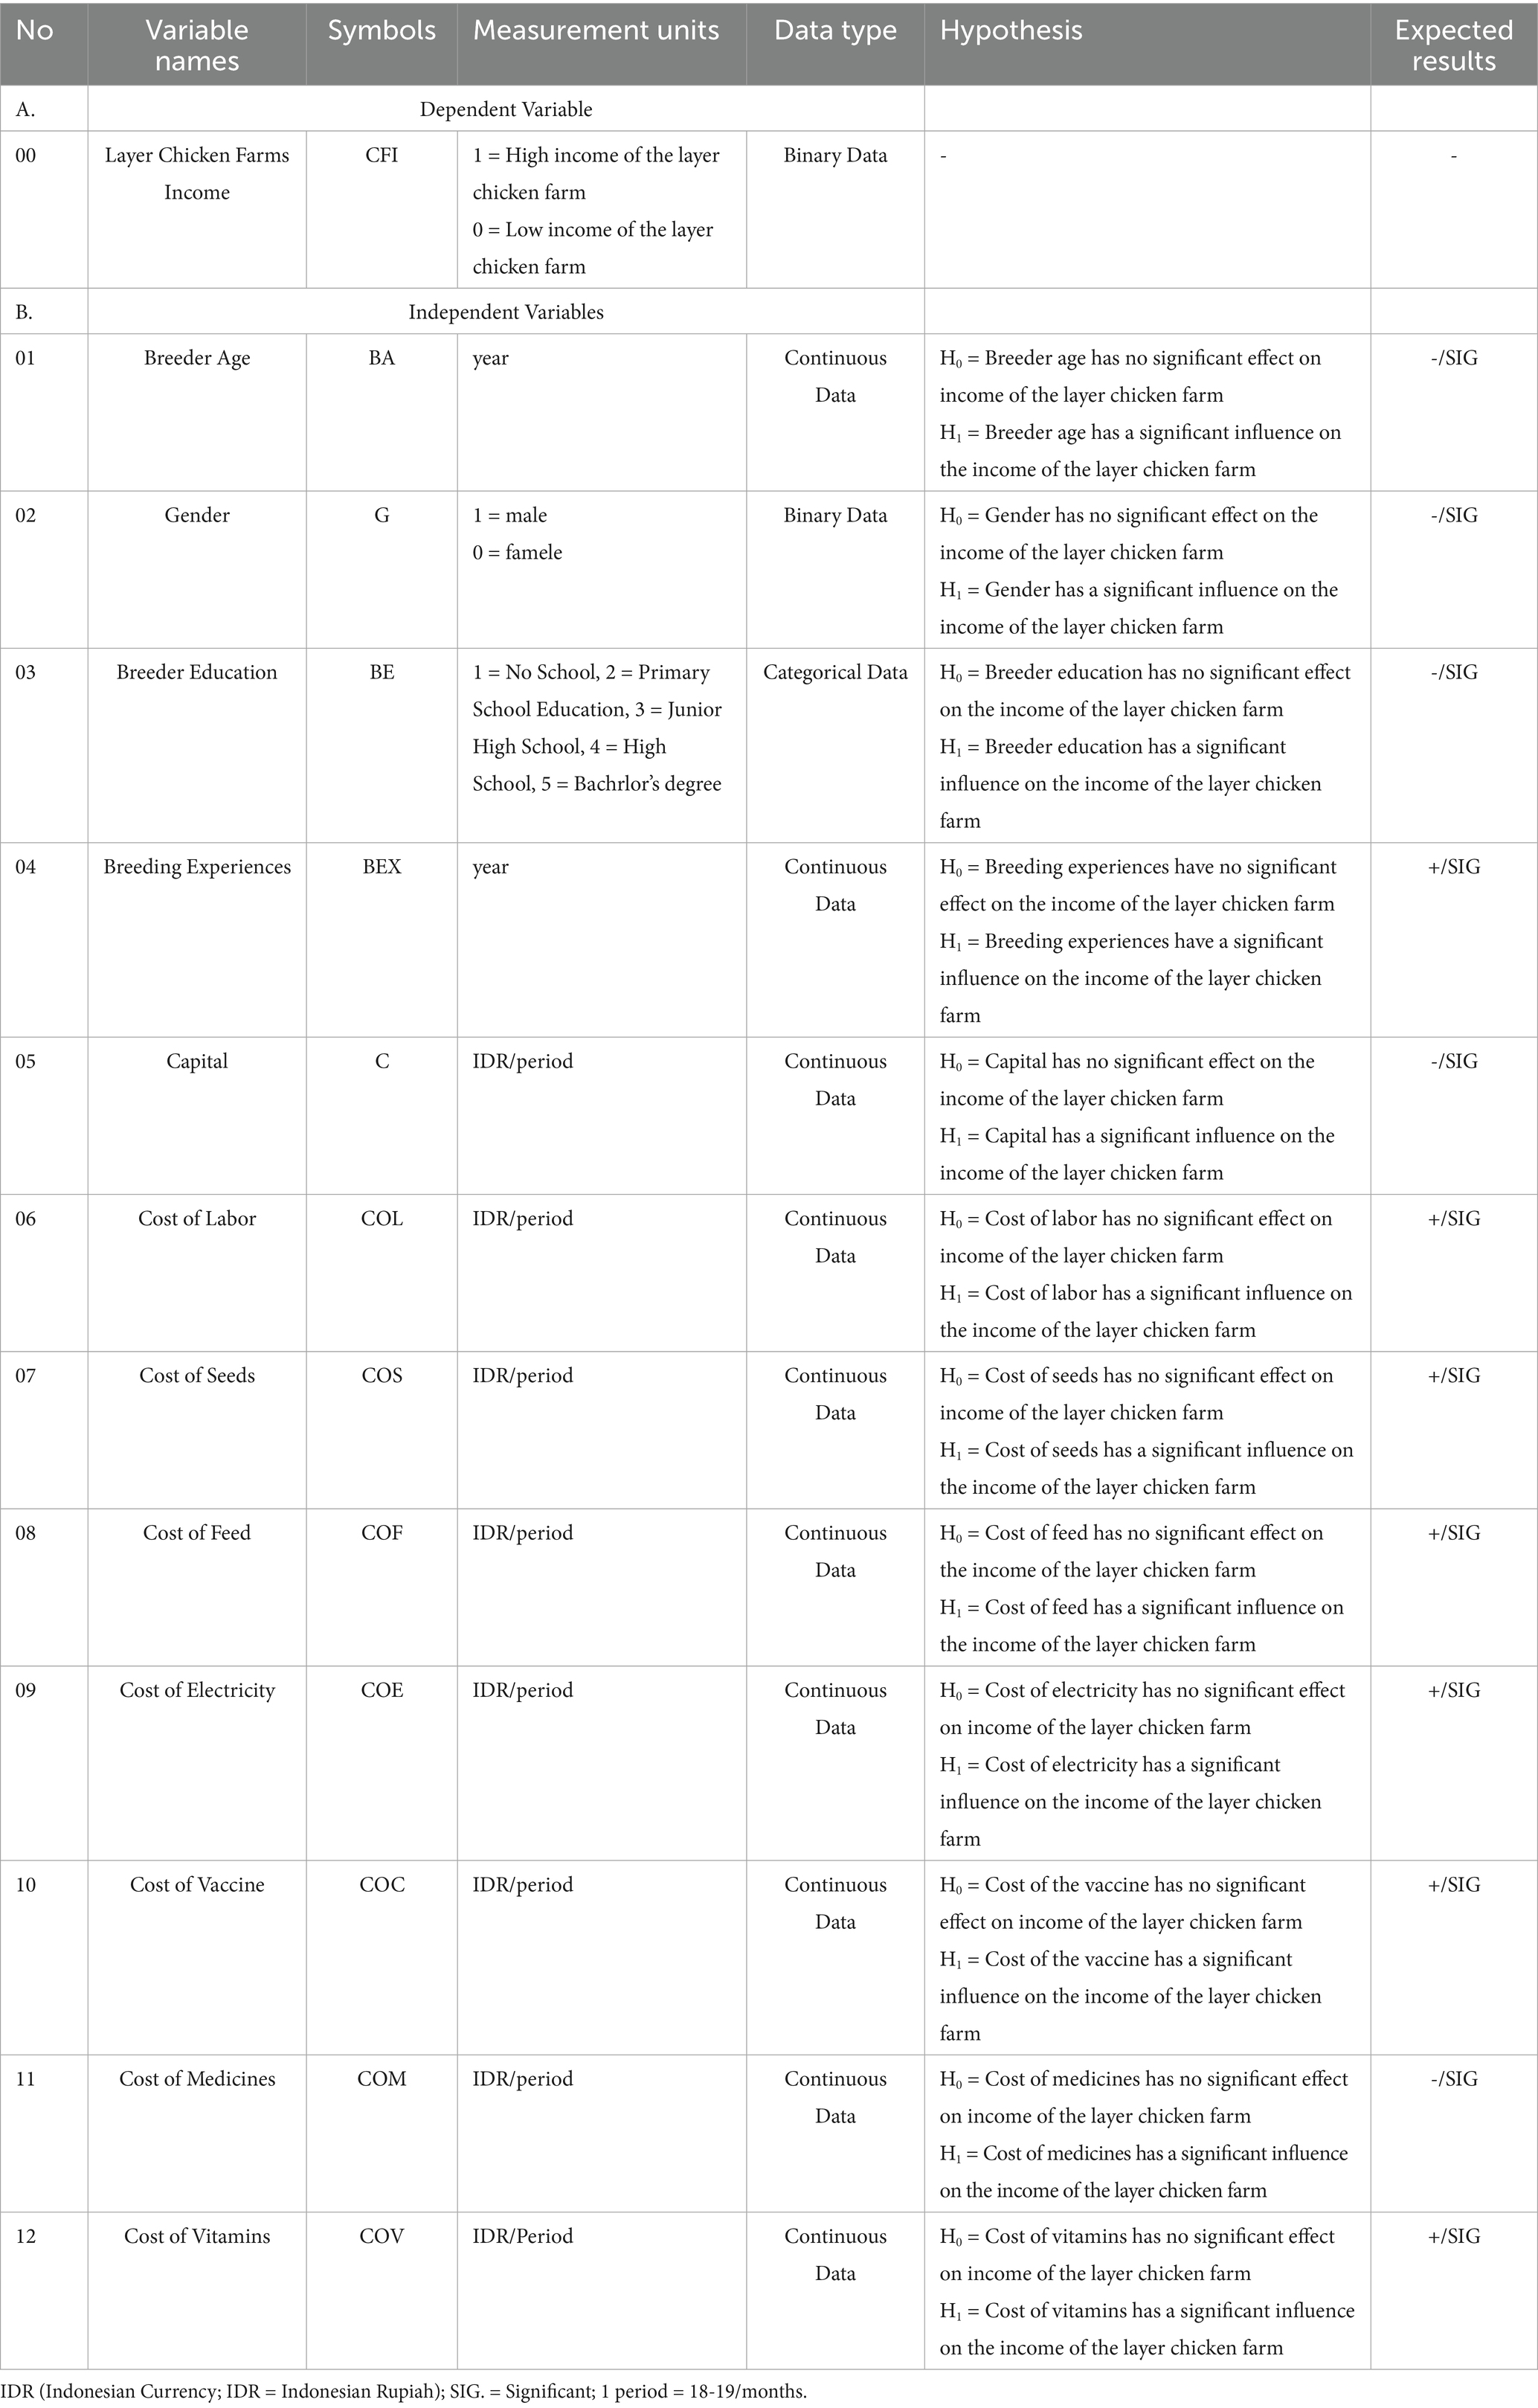
Table 1. Hypothesis development.
3.2.2.2 Hypothesis development
In research, a hypothesis is a concise statement of a potential solution to an issue that can be expressed in a straightforward or sophisticated manner. Rather than focusing on finding a solution, most researchers in quantitative research activities plan to verify the hypothesis set first. As a result, the researcher must understand the purpose and character of the hypothesis that was developed in the first stage of the research activity. One of the goals in designing a study hypothesis is to forecast causal relationships between observable variables or to draw and verify the logical consequences of causal relationships. We created expected hypotheses, hypothesis statements, and significant findings for every independent variable in this investigation. Table 1 displays the findings. Table 1 demonstrates that not every independent variable postulated in this study has a statistically significant impact on the income of layer chicken farms (CFI). Breeding experience (BEX), cost of labor (COL), cost of seeds (COS), cost of feed (COF), cost of electricity (COE), cost of vaccine (COC), and cost of vitamins (COV) are the essential variables.
3.2.2.3 Simultaneous test and determinant coefficient
With values ranging from 0 to 1, similar to the R-square in multivariate linear regression, is the Nagelkerke R-square in logistic regression. Little or no independent variables are indicated by a value near 0. According to Nagelkerke (1991), a number near 1 denotes the degree to which the independent variables may account for fluctuations in the dependent variable. Additionally, assessing the concurrent impact of the coefficients on the independent variables is the goal of benchmarking the model or testing the important parameters. According to Steenbergen and Jones (2002), if the test value of the G statistic is higher than the value of the Chi-square table, it can be presumed that at least one independent variable in Equation 6 significantly affects the dependent variable.
Where: G = The number of model predictor variables; Lp = Likelihood value with predictor variables; L0 = Likelihood value without predictor variables.
3.2.2.4 Tests of partial and goodness of fit
According to Steenbergen and Jones (2002), a partial test evaluates how the independent factors impact the dependent variable. Equation 7 provides the formula for the Wald test, which is used to execute partial tests. Based on the p-value, decisions are taken, and if the p-value indicates that the independent variable has some influence.
Where: SE(βi) = the coefficient’s standard error estimate; βi = the expected amount of the parameter (βi).
Additionally, the Hosmer and Lemeshow test, using the Chi-square statistic, is employed by the regression model fit test to determine if the model is compatible with the data. When there is no discernible difference between the model’s outcomes and the empirical evidence, the model is deemed appropriate. Equation 8 displays the results of the Hosmer-Lemeshow statistical test (Steenbergen and Jones, 2002).
Where: X2 = the Chi-Square statistic’s value; Ei = expected frequency in group i based on the regression model; Oi = observed frequency in group i.
3.2.2.5 Interpretation of odds ratio
When binary logistic regression is employed, the odds ratio (OR) quantifies the relationship between independent factors and the likelihood of an event in the dependent variable. While the OR value demonstrates how changes to the independent variables affect the probability of occurrence, the beta coefficient’s Exp(B) value indicates the intensity of the relationship. The formula for this is given in Equation 9 (Ospina et al., 2012).
Where: β = The regression model’s logistic regression coefficient; e = Euler’s number, which is approximately 2.71828.
4 Results and discussions
4.1 Farmer characteristics
Farmer characteristics are characteristics that form the identity of each farmer. According to Wardhani (1994), farmer characteristics are built from behavioral, psychographic, and demographic elements. In this study, farmer characteristics include farmer age, gender, education level, and breeding experience, which can be seen in Figure 5.
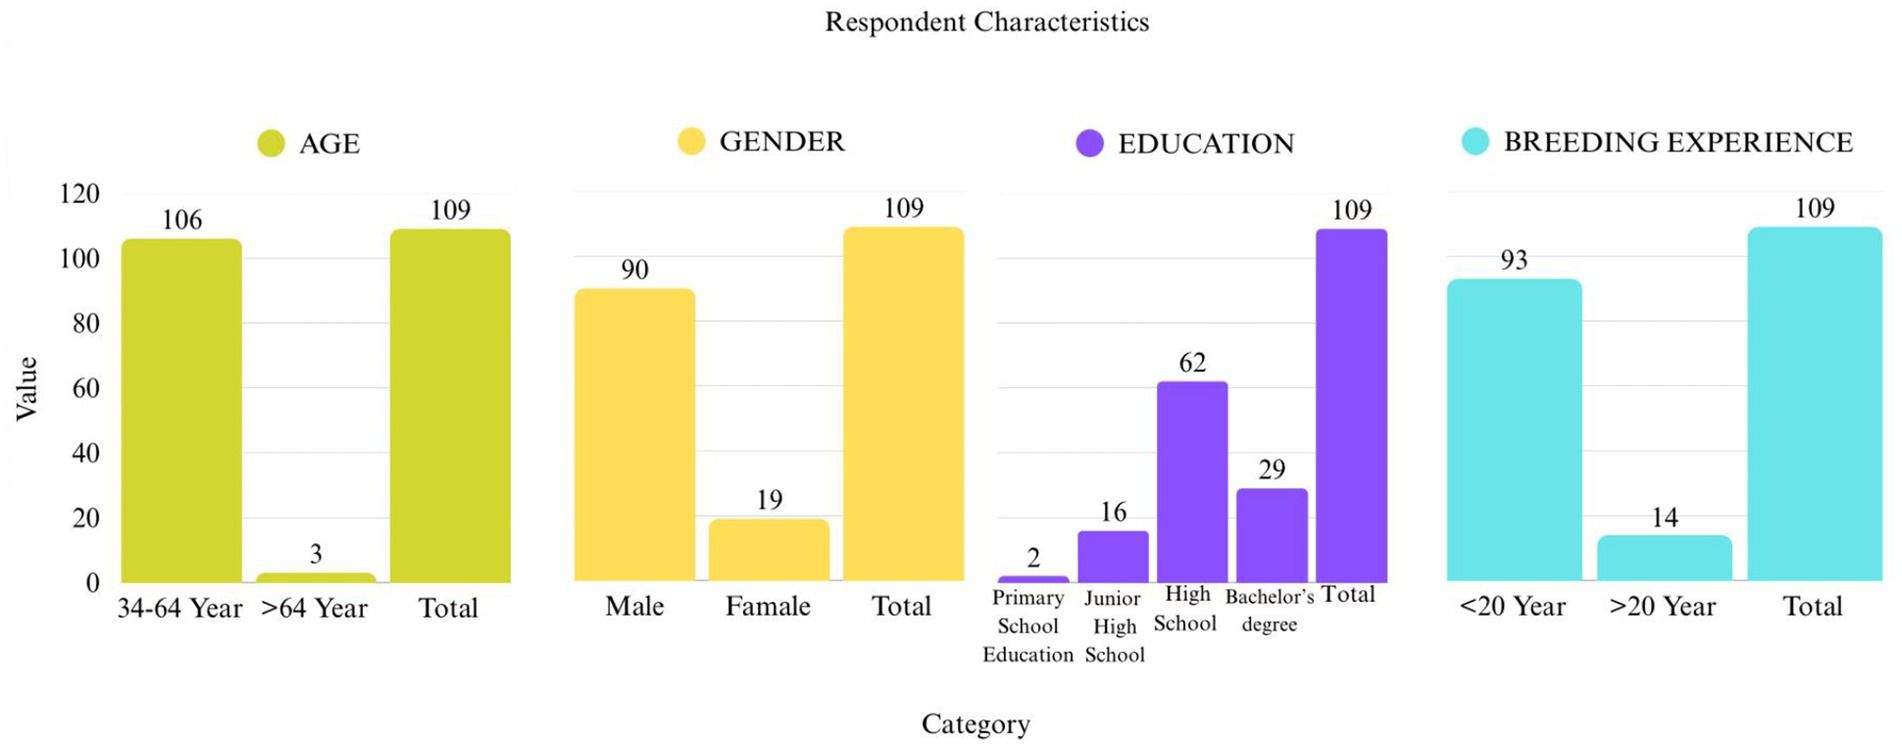
Figure 5. Respondent characteristics.
In this study, 106 respondents were still classified as of productive age, and three had passed the productive age limit. This is in line with the opinion of the Central Bureau of Statistics, which states that the productive age is 15 to 64 years; those who are 15 years and older and those who are 64 years and older are not included in the productive age group. Knowing the farmer’s age is essential because it will affect his ability to conduct business. This finding is also in line with Kaine et al., 2018 research, which indicates that most farmers are in the active age group, with an average age of 43. Younger farmers usually have stronger physical abilities and better health than older farmers (Andri, and Wati, dan Suresti, 2011). In addition, the speed or slowness with which farmers adopt innovations is also influenced by age (Soekartawi, 1995). The gender of respondents who dominate is men, with 90 out of 109 respondents, and the rest are women, with 19 respondents. This confirms previous research findings (Osinowo and Tolorunju, 2019) that male households are more involved in poultry egg production in Nigeria. Furthermore, according to Soekartawi (1995), education will influence farmers in determining the right alternatives for managing their businesses. The higher a person’s level of education, the faster they will adopt new innovations (Mosher, 1981). According to Rasyaf (1995), farmers often lack the necessary skills to solve problems and make informed decisions on their farms. From the figure above, it can be seen that out of 109 respondents, the majority have a high school education, namely 62 people, followed by those with a bachelor’s degree, namely 29 people. Additionally, 16 people have a junior high school education, and two people have a primary school education. Finally, regarding work experience, according to Rasyaf (1995), skills are things that everyone can have; with a lot of practice and experience, he can gradually manage his business well. The results showed that the experience of 109 respondents in breeding less than 20 years amounted to 93 people, and more than 20 years amounted to 16 people. Long enough farming experience is generally because farmers have pioneered the laying hen farming business for generations. By examining the community’s farming experience, it can be concluded that broiler farming has long been an integral part of the community’s local economy.
4.2 The results of binary logistic regression analysis
Based on the research that has been conducted, several results will be discussed, namely the influence of respondent characteristics described by breeder age (BA), gender (G), breeder education (BE), and breeding experience (BEX) of each farmer and the influence of the cost of production factors including capital (C), cost of labor (COL), cost of feed (COF), cost of seeds (COS), cost of electricity (COE), cost of vaccines (COC), cost of medicines (COM) and cost of vitamins (COV) on the business income of the layer chicken farm obtained using binary logistic regression analysis.
4.2.1 Model fit test
The model fit test is applied to evaluate the model’s fit to the data, where the observed values are identical or close to the anticipated values predicted by the model. The selected model must comply with the principles of Goodness of Fit (GoF), The model is said to fulfill this principle if there is a match between the data used as model input and the observed data. According to Vikaliana et al. (2022) and Gio and dan Rosmaini, 2017, the suitability or FIT of the model can be determined from the significance value in the Hosmer and Lemeshow test. The findings of the model fit test for this study are shown in Table 2.

Table 2. Hosmer and Lemeshow test.
The results of the Chi-square table calculation with a significance level = 0.05 and df = 8 obtained a Chi-square table value of 15.507. Based on the data presented in Table 2, the Chi-square value obtained is 2.592 with a significance level of 0.957. Based on the collected data, it can be concluded that H0 is accepted, indicating that there is no statistically significant difference between the observed and anticipated values. This result indicates that the model is suitable and can be used effectively. This conclusion is supported by the fact that the calculated Chi-square value (2.592) is less than the critical Chi-square value (15.507), and that the significance value (0.957) exceeds the predetermined alpha level (0.05).
4.2.2 Cox & Snell R-square and Nagelkerke R-square test
The Cox and Snell R-square and Nagelkerke R-square tests assess how the independent variables explain the observed variability in the dependent variable. Table 3 displays the results of the Cox and Snell R-square and Nagelkerke R-square tests. As stated in Table 3, the Nagelkerke R-square value was determined to be 0.869. This diagram illustrates the influence of the various independent variables on the dependent variable (Income of the layer chicken farm) in the study conducted. The independent variables studied include breeder age (BA), gender (G), breeder education (BE), breeding experience (BEX), capital (C), cost of labor (COL), cost of seed (COS), cost of feed (COF), cost of electricity (COE), cost of vaccines (COC), cost of medicine (COM) and cost of vitamins (COV). The results show that these independent variables collectively explain 8.69% of the observed variation in layer farming income. External factors outside the research model influenced the remaining 1.31%.

Table 3. Model summary.
4.2.3 Simultaneous test
According to Bekuma et al. (2023), Simultaneous testing is used to assess how independent factors affect the dependent variable. The simultaneous test involves comparing the resulting Chi-square (X2) value with the Chi-square table value of the Omnibus Test table, using a 5% significance level. Table 4 displays a Chi-square value of 114.759, indicating a statistically significant relationship. The significance value associated with this test is 0.000. Meanwhile, the Chi-square table value of 21.03 was obtained from 12 degrees = of 12 at the 5% level. If the calculated Chi-square value is compared with the Chi-square table value, it can be seen that G = 114.759 > X2 = 21.03, and the significance value is 0.000 < 0.05. Thus, H0 is rejected because it refers to the decision rule H0 rejected at a significant level α if G > X2 (α,v) and the significance value in the test statistic < α,s it can be concluded this value indicated that at least one of the independent variables tested in the model simultaneously influences income of layer chicken farm.
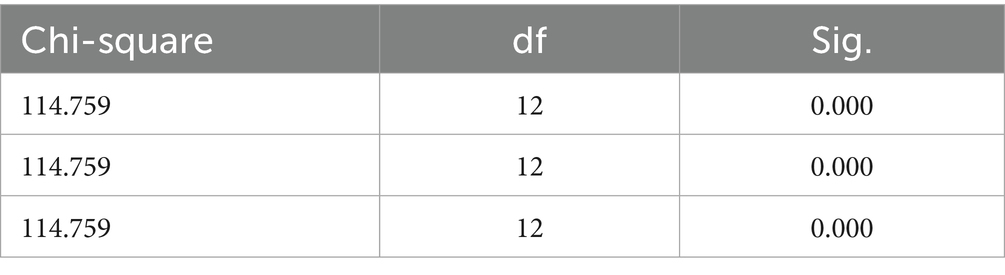
Table 4. Omnibus tests of model coefficients.
4.2.4 Partial test (Wald test)
According to Vikaliana et al. (2022), the significant values of the variables in the equation table must be examined to evaluate the independent factors’ individual effects on the dependent variable. We accept hypothesis H1 if at least one variable directly influences the dependent variable. Table 5 shows that the factors of breeding experience (BEX), labor cost (COL), seed cost (COS), feed cost (COF), electricity cost (COE), vaccination cost (COV), and vitamin cost (COV) all had a significant effect on layer hen chicken income, with a p-value of less than 0.05. Meanwhile, the layer hen chicken income variable was not significantly influenced by breeder age (BA), gender (G), education (BE), capital (C), or medical costs (COM).
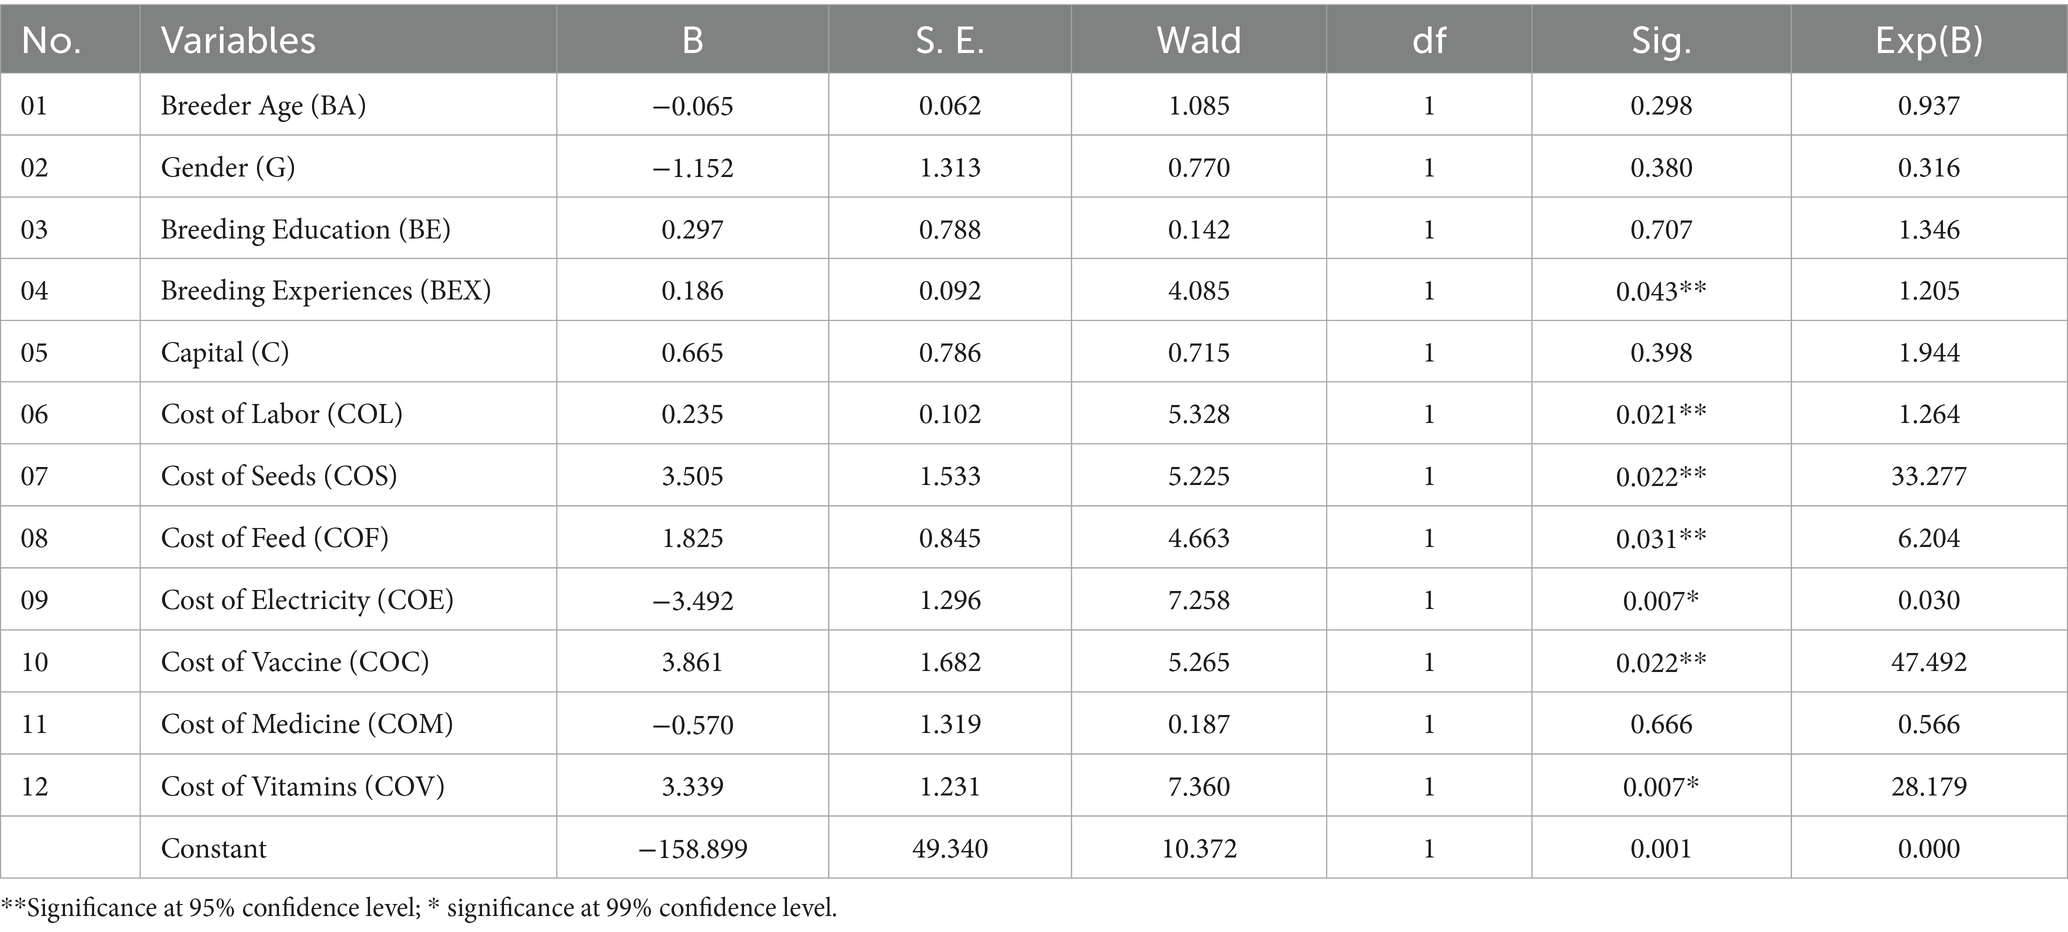
Table 5. Variables in the equation.
4.3 Discussions: the odds ratio interpretation
The odds ratio (OR) and beta coefficient were used in a binary logistic regression analysis to determine the relationship between independent factors and the likelihood of events in the dependent variable occurring (Chen et al., 2010; Ospina et al., 2012). Furthermore, the research results presented in Table 5 were used to evaluate and interpret the odds ratio (OR)/Exp(B) and determine the importance of independent variables in this research. A summary of the research results can be seen in Figure 6.
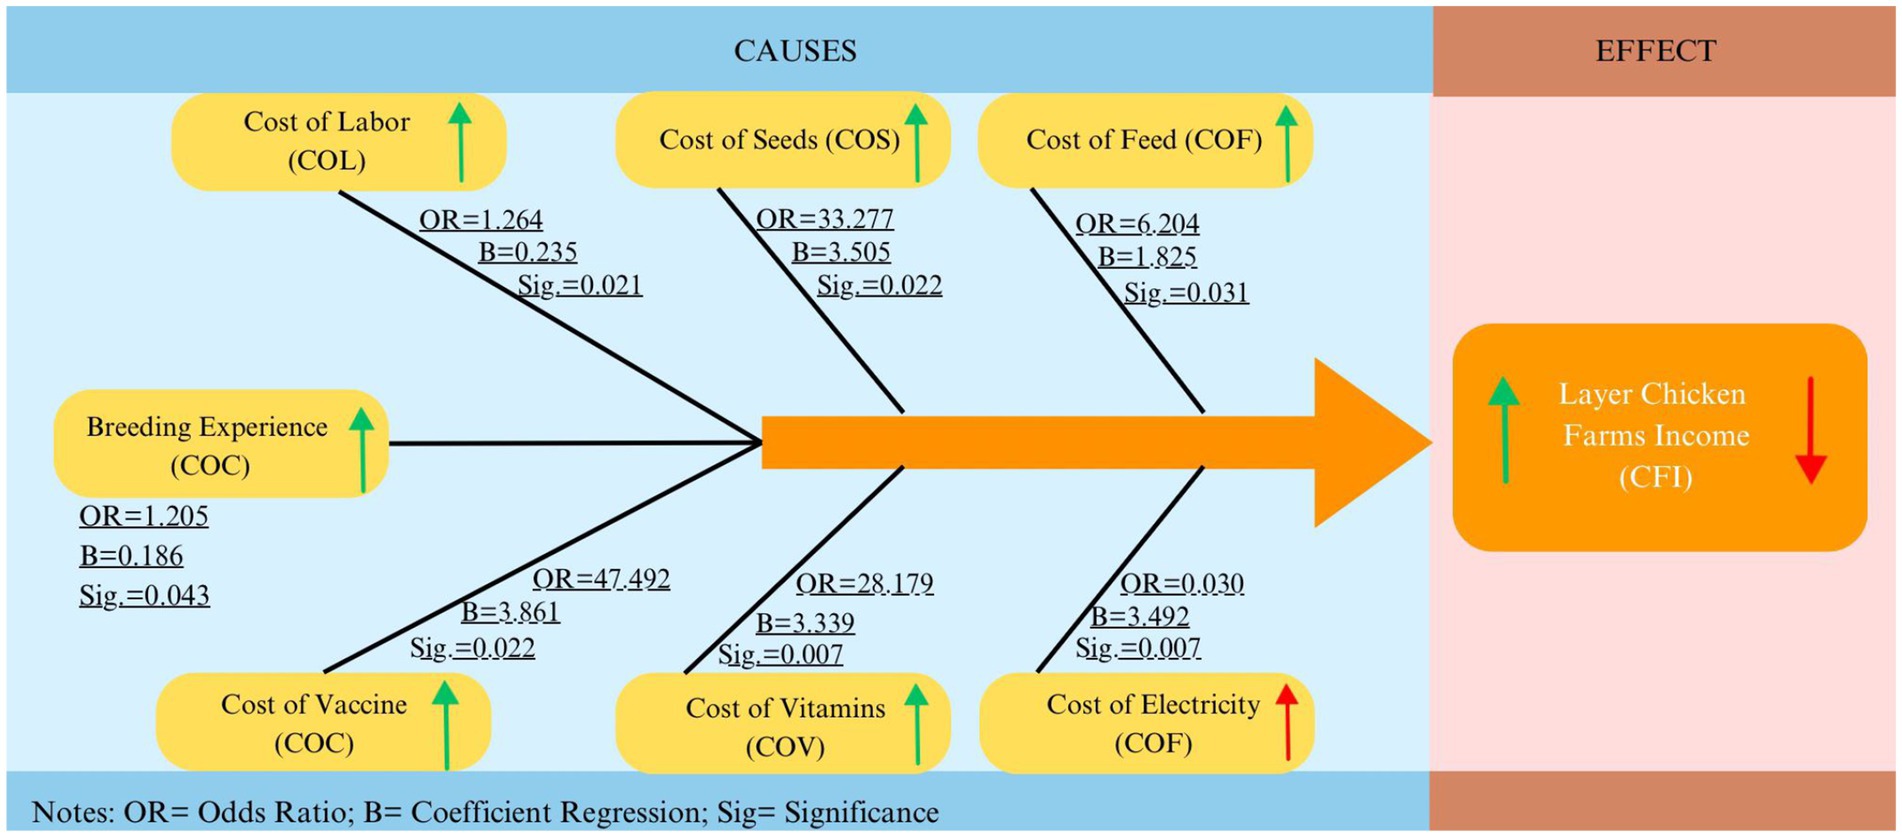
Figure 6. Graphical summary of layer chicken farms income.
4.3.1 The effects of breeder experience (BEX) and cost of labor (COL) on income layer chicken
This study will examine the independent variable of breeding experience (BEX) and its effect on the income of layer chicken farms (CFI). As presented in Figure 6, this variable was significant in the model tested. The significance value of 0.043 was less than the alpha value of 0.05. Meanwhile, the odds ratio value (OR) for the BEX variable was 1.205, with an estimated value (B) of 0.186. This value indicated a positive effect of the BEX variable on the CFI variable. Based on this value, we can conclude that the breeding experience (BEX) variable positively impacted the layer chicken farms’ income (CFI). This indicates that layer farming income can increase as the breeding experience grows. This phenomenon occurs because the longer farmers have experience, the more they will know about the risks that can harm their business, so they will be more prepared and careful in preventing these risks. If the risk is successfully prevented, it will minimize the decline in income. The findings obtained in this study were consistent with the conclusions obtained in research (Iskandar and Arfa’i, 2007; Suwarta and Hanafie, 2018; Amos, 2006), which states that breeding experience will affect the ability of farmers to run their business so that experience will have a significant positive influence on chicken livestock business income. On the other hand, contrary to the findings of Ibrahim (2020) and Nurlaili and G dan Reshi (2021), it has been found that breeding experience does not have a significant and real influence on income.
The cost of labor (COL) variable was also examined to determine its impact on the income of layer chicken farms (CFI). In Figure 6, the COL variable had a significant effect on the variable CFI. Its significance value of 0.021 was less than the alpha value of 0.05 for the significance level of 95%. Meanwhile, the cost of labor (COL) variable had an odds ratio (OR) of 1.264 and an estimated value (B) of 0.235. This figure showed a positive effect of the COL variable on the layer chicken farms’ income (CFI). This value assumes that any increase in labor costs can lead to higher income for layer farms. This assumption occurs because it is expected that the higher the cost spent on labor, the higher the knowledge and experience of the labor. High expertise and labor experience will increase income because laborers are better at mastering the work to be done, and almost all livestock management is managed by labor. This is also stated by Salele et al. (2014), who state that the labor involved in layer farming includes mixing feed, feeding, providing water, cleaning cages and equipment, and collecting eggs. This result aligns with several research studies by Helmi et al. (2018), which suggest that seeds and the labor force are the production elements that have a positive and significant impact on the revenue of laying hens.
4.3.2 The effects of costs of seed (COS), feed (COF), and electricity (COE) on the income of a layer chicken farm
The study’s findings showed that the cost of seed (COS) variable had a significant effect on the income of layer chicken farms (CFI). Figure 6 shows that the considerable value was 0.22, less than the alpha value of 0.05. In the meantime, the COS variable had an odds ratio (OR) of 33.277 and an estimated value (B) of 3.505. This figure demonstrates a positive and significant influence of the cost of seed (COS) variable on the layer chicken farms’ income (CFI). The interpretation of these figures is that increasing seed costs could improve the income of layer chicken farms. The basis for this conclusion is that one factor that determines the price of seedlings is the quality of the seedlings. The higher the seed price, the higher the quality. High-quality seedlings will support maximum production. When production is maximized, it will increase income. Another factor that affects seedling prices is market share (Cahyono, 2011). The findings of this study are also similar to research (Helmi et al., 2018; Dewanti and Sihombing, 2012) who discovered that seed costs (COS) have a positive effect on revenue and that seeds and labor force are production factors that are thought to have a positive and significant impact on laying hen income.
Furthermore, the study examined the feed cost (FC) variable to determine its impact on the income of layer chicken farms (CFI). This variable significantly affected the CFI variable, whose significance value was 0.031 (Figure 6). Then, the estimated value (B) for the cost of feed (COF) variable was 1.825, and the odds ratio (OR) value for the variable was 6.204. These specific figures concluded that the COF variable had a positive impact on the CFI variable. These figures also indicated that there was a possibility that an increase in the cost of feed (COF) could have increased the income of layer chicken farms (CFI). In other words, income will increase as feed costs increase. We believe that farmers who spend more on feed will produce better quality. Apart from the amount of feed purchased, the distance between farms, markets, and traders can affect the feed price (Altahat et al., 2012). Feed quality is also a factor that affects the price of feed because high-quality feed will provide good nutrition for laying hens and support productivity. When there is an increase in productivity, income will also increase. However, if feed costs are increased excessively, it is possible that income will not increase proportionally or decrease due to the imbalance between the high increase in feed costs and large income. According to research by Kibunja and Musau, 2024 and Afand et al. (2020), feed represents the most significant expense in the production process. However, this result is not in line with the research of Nurliani et al. (2024), which suggests that increasing feed costs can lead to financial losses for farmers.
Moreover, the cost of electricity (COE) variable was examined to determine its impact on the income of layer chicken farms (CFI). In Figure 6, the cost of electricity (COE) variable significantly affected the variable CFI. Its significance value of 0.007 was less than the alpha value of 0.05 for the significance level of 99%. Meanwhile, the cost of electricity (COE) variable had an odds ratio (OR) of 0.030 and an estimated value (B) of −3.429. This figure showed a negative effect of the COE variable on the layer chicken farms’ income (CFI). This value can be assumed to mean that every increase in electricity costs will reduce the income of layer farms. We conclude that this is because electricity use on layer farms does not have a significant direct impact on layer production. Musholihah et al. (2020) state that electricity in layer livestock businesses is used for lighting and installing water pumps to provide drinking water ad libitum and clean cage equipment. Thus, there is no direct interaction between laying hens and electricity. Therefore, regardless of the amount of electricity used, it will not impact production. It will only increase the cost of electricity, which can lead to lower revenues. This finding aligns with the research of Dewanti and Sihombing (2012), who found that electricity costs influence the breeder’s income.
4.3.3 The effect of the cost of vaccine (COC) and vitamins (COV) on the income layer chicken
This research also examined the effect of the cost of vaccine (COC) variable on the income of layer chicken farms (CFI). This variable significantly affected the CFI variable, whose significance value (Sig) was 0.022 (Figure 6). The estimated value (B) for the cost of the vaccine (COC) variable was 3.861, and the odds ratio (OR) value for the variable was 47.492. These specific figures concluded that the COC variable had a positive impact on the CFI variable. These figures also indicated that there was a possibility that an increase in the cost of vaccine (COC) could have increased the layer chicken farm’s income (CFI). We think that this phenomenon occurs because vaccines are used to prevent diseases in laying hens. Increased vaccine costs will result in laying hens receiving better and more routine vaccines, which will likely help avoid fatal diseases caused by the virus. If the laying hens are healthy, the production will be maximized, increasing the income. This is also supported by research (Basri et al., 2022), which states that vaccination costs greatly affect the income of laying hens.
The cost of vitamin (COV) variable was one of the significant variables in the model tested in this research. The significance value of this variable was 0.007, which is less than the significance level of 99% (Figure 6). Meanwhile, the odds ratio (OR) for the COV variable was 28.179, with an estimated value (B) of 3.339. Since this value was positive, it was clear that the COV variable positively impacted the income of layer chicken farms (CFI). With this data, it can be assumed that the additional cost of vitamins can increase the income of a layer chicken farm. This can happen because vitamins are widely used to stimulate laying hens to increase productivity. Therefore, farmers who spend more on vitamins are more likely to have higher productivity levels. High productivity will guarantee opportunities for increased income. This finding is consistent with a previous study (Wardhana et al., 2023), which states that vitamin costs have a significant and positive impact on revenue. However, in contrast to this study, Dewanti and Sihombing (2012) found no discernible relationship between vitamin costs and laying hens’ ability to make a profit. This may be because excessive vitamins given will not increase production significantly because each animal has a maximum point of output, so that no matter how much vitamin is given it will not make the animal exceed its maximum production limit, instead giving excessive vitamins will harm animal health due to overdose usage, so it can make income decrease.
5 Conclusions and recommendations
This study aimed to examine the effect of farmer characteristics and production costs on the income of a layer chicken farm in Pinrang District, South Sulawesi Province, Indonesia. The study aimed to identify an effective management model that could enhance breeder income and optimize laying hen farming. This study used the survey approach to interview all 109-layer chicken breeders in the district as respondents. Next, we use the binary logistic regression approach to analyze the data. The study’s findings revealed that 7 of the 12 independent variables examined had a significant effect on the income of layer breeders. The significant variables included breeder experiences (BEX), cost of labor (COL), cost of seeds (COS), cost of feeds (COF), cost of electricity (COE), cost of vaccine (COC), and cost of vitamin (COV). Meanwhile, the independent variables of breeder age (BA), gender (G), breeder education (BE), capital (C), and cost of medicine (COM) had no significant effect. This discovery is an essential indicator for establishing a practical management framework for income control, which supports the development of layer hen farming, and for designing a set of policy recommendations to help breeders manage their farms effectively.
Based on the data and the findings above, it is reasonable to conclude that the primary factors that impact breeder income are production cost management and the breeder’s degree of experience. Consequently, within the livestock industry’s efforts to establish sustainable production and implement a strategy for consistency and stability, some policy recommendations and a management plan were proposed to assist breeders in enhancing their financial stability. Generally speaking, breeders’ most important policy objective is to minimize production costs. It is essential to prioritize low-cost production management, particularly by reducing labor costs, seeds, feeds, electricity, vaccines, and vitamins. When it came to raising the breeder’s income, his experience was also an essential factor to take into consideration. This suggests that the breeders’ expertise in poultry management should be further enhanced, particularly in analyzing and managing production costs.
Regarding the breeder experiences and education, it is essential to establish a comprehensive training program that addresses issues such as sustainable farming methods, farm safety, and animal welfare, which would be an effective way to enhance farmers’ skills. We also propose that farmers establish an online community where they may exchange information, learn from one another, and access relevant resources.
5.1 Limitations of the study
This study has certain limitations. The main limitation is that some important variables were not included in the regression model, both internal and external factors, the age of the birds, the strain of chickens used in production, and the housing types (internal factors) and market prices, supply chain challenges, or climatic conditions (external factors). The exclusion of these factors may limit the generalizability of the findings. In future research, these factors should be included in the model examined to ensure the model’s generalizability.
Data availability statement
The raw data supporting the conclusions of this article will be made available by the authors, without undue reservation.
Ethics statement
Ethical review and approval was not required for the study on human participants in accordance with the local legislation and institutional requirements. Written informed consent from the patients/participants or patients/participants legal guardian/next of kin was not required to participate in this study in accordance with the national legislation and the institutional requirements.
Author contributions
AH: Conceptualization, Data curation, Formal analysis, Funding acquisition, Investigation, Methodology, Project administration, Software, Visualization, Writing – original draft, Writing – review & editing. MS: Conceptualization, Formal analysis, Methodology, Supervision, Validation, Visualization, Writing – review & editing. AS: Funding acquisition, Writing – review & editing. RR: Supervision, Writing – review & editing, Conceptualization, Project administration, Validation. MJ: Supervision, Writing – review & editing. WP: Writing – review & editing, Supervision. AT: Funding acquisition, Writing – review & editing. AA: Funding acquisition, Writing – review & editing. MM: Writing – review & editing, Funding acquisition. NB: Writing – review & editing, Funding acquisition. LF: Writing – review & editing, Funding acquisition. HH: Funding acquisition, Writing – review & editing. AM: Writing – review & editing. HA: Writing – review & editing. MR: Writing – review & editing.
Funding
The author(s) declare that no financial support was received for the research and/or publication of this article.
Conflict of interest
The authors declare that the research was conducted in the absence of any commercial or financial relationships that could be construed as a potential conflict of interest.
Generative AI statement
The author(s) declare that no Gen AI was used in the creation of this manuscript.
Any alternative text (alt text) provided alongside figures in this article has been generated by Frontiers with the support of artificial intelligence and reasonable efforts have been made to ensure accuracy, including review by the authors wherever possible. If you identify any issues, please contact us.
Publisher’s note
All claims expressed in this article are solely those of the authors and do not necessarily represent those of their affiliated organizations, or those of the publisher, the editors and the reviewers. Any product that may be evaluated in this article, or claim that may be made by its manufacturer, is not guaranteed or endorsed by the publisher.
References
Abadi, J., Zulfanita,, and Mudawaroch, R. E. (2022). Efisiensi Faktor-Faktor Produksi Usaha Peternakan Ayam Ras Petelur di Asosiasi Berkah Telur Makmur Purworejo. Jurnal Sains Peternakan Nusantara 2:1. doi: 10.53863/jspn.v2i01.440
Adila, A. B. N., and Mustahidda, R. (2024). The influence of business capital, labor, on income with length of business as a moderation variable. Journal Ekonomics 13:3. doi: 10.54209/ekonomi.v13i03
Afand, R., Hartono, B., and Djunaidi, I. (2020). The analysis of production costs of laying hen farms using semi self-mixing and total self-mixing feeds in Blitar regency, East Java. Trop. Anim. Sci. J. 43:70. doi: 10.5398/tasj.2020.43.1.70
Agus, S., Imam, S. S., Ahmad, S., Dwi, M. A., Suryani, N., and Kadhung, P. (2020). Can layer chicken business generate income for smallholder farmers in rural area of Indonesia? RJOAS 6:102. doi: 10.18551/rjoas.2020-06.10
Ali, P.R., Machfud,, Sukardi,, and Noor, E. (2021). The challenges in Indonesia poultry industry business.
Altahat, E., Al-Sharafat, A. S., and Alatarawneh, M. (2012). Factors affecting profitability of layer hens enterprises. Am. J. Agric. Biol. Sci. 7:1. doi: 10.3844/ajabssp.2012.106.113
Amos, T. T. (2006). Analysis of backyard poultry production in Ondo state, Nigeria. Int. J. Poult. Sci. 5:3. doi: 10.3923/ijips.2006.247.250
Andi, A., Atika, S., and Bakhrudin,. (2020). Pengaruh Modal Kerja terhadap Pendapatan Masyarakat Berpenghasilan Rendah (MBR) di Kota Malang. Jurnal Administrasi dan Bisnis 14, 1–7. doi: 10.33795.J-ADBIS.V1412.95
Andri, R., and Wati, dan Suresti, A. (2011). Analisis Faktor-Faktor yang Mempengaruhi Pendapatan Peternak Ayam Ras Petelur di Kecamatan Lareh Sago Halaban Kabupaten Lima Puluh Kota. J. Peternak. Indones. 13:3. doi: 10.25077/jpi.13.3.205-214.2011
Aprilia, H. (2018). Pengaruh bantuan Modal Usaha Produktif Terhadap peningkatan Pendapatan mustahik Pada Baitul Mal aceh. Fakultas Dakwah dan Komunikasi Universitas Islam Negeri Ar-Ranirybanda Aceh Available online at: https://repository.ar-raniry.ac.id/id/eprint/2971/1/HENNI%20APRILIA.pdf (Accessed 12 November 2024).
Asih, E. W. (2021). Effect of production on income and feasibility of hybrid corn farming in Sidondo I village, Sigi Biromaru District, Sigi regency. Int. J. Health Econ. Soc. Sci. 3:4. doi: 10.56338/ijhess.v3i4.2534
Attia, Y., Rahman, T., Hossain, J., Basiouni, S., Khafaga, A., Shehata, A., et al. (2022). Poultry prodiction and sustainble in developing countries under the CIVID-19 crisis: lessons learned. J. Anim. 12:644. doi: 10.3390/ani12050644
Badan Pusat Statistik Kabupaten Pinrang. (2021). Available online at: https://pinrangkab.bps.go.id/id/statistics-table/2/MTIwIzI=/populasi-unggas.html (Accessed 09 January 2024).
Badan Pusat Statistik Provinsi Sulsel. (2024). Available online at: https://www.bps.go.id/id/statistics-table/2/NDc3IzI=/populasi-ayam-ras-petelur-menurut-provinsi--ekor-.html (Accessed 09 January 2024).
Baskoro, F. A. (2014). Persepsi peternak terhadap kambing Peranakan Ettawa kepala hitam di Kaligesing. 2, 54–55.
Basri, H., Suherman,, Herlin, F., and Rosita, R. (2022). Analisis Faktor yang Mempengaruhi Pendapatan Usaha Ayam Ras Petelur di Desa Kasang Pudak, Kecamatan Kumpeh Ulu, Kabupaten Muaro Jambi. J. Econ. Bus. 6:690. doi: 10.33087/ekonomis.v6i2.690
Bekuma, T., Mamo, G., and Regassa, A. (2023). Indigenous and improved adaptation technologies in response to climate change adaptation and barriers among smallholder farmers in the east Wollega zone of Oromia, Ethiopia. Res. Glob. 6:100110. doi: 10.1016/J.RESGLO.2022.100110
Birhanu, M. Y., Amponsah, R. O., Obese, F. Y., and Dessie, T. (2023). Smallholder poultry production in the context of increasing global food prices: roles in poverty reduction and food security. Anim. Front. 13:69. doi: 10.1093/af/vfac069
Bist, R. H., Bist, K., Poudel, S., Subedi, D., Yang, X., Paneru, B., et al. (2024). Sustainable poultry farming practices: a critical review of current strategies and future prospects. Poult. Sci. 103:104295. doi: 10.1016/j.psj.2024.104295
Chen, H., Cohen, P., and Chen, S. (2010). How big is a big odds ratio? Interpreting the magnitudes of odds ratios in epidemiological studies 39, 383. doi: 10.1080/03610911003650383
Dadang, S. (2007). Kaji komparatif pendapatan usaha ternak sapi perah berdasarkan skala pemilikan ternak di Kabupaten Rejang Lebong. Seminar Nasional Tekhnologi Peternakan dan Veteriner 2007
Daroini, A., and dan Ariefianto, Y. (2018). Analisis Ekonomi Usaha Berbasis Perbandingan pada Usaha Peternakan Ayam Broiler dengan Ayam Pejantan Layer di Kecamatan Kandat Kabupaten Kediri. Jurnal Ilmiah Fillia Cendekia 3, 36–44. doi: 10.32503/fillia.v3i1.174
Dewanti, R., and Sihombing, G. (2012). Analisis Pendapatan Usaha Peternakan Ayam Buras (Studi Kasus Di Kecamatan Tegalombo, Kabupaten Pacitan). Bull. Peternak 36:1. doi: 10.21059/buletinpeternak.v36i1.1276
Directorate General of Food Crops. (2023). Available online at: https://m.antaranews.com/berita/3491409/usai-tinjau-peternakan-di-sulsel-syl-kebutuhan-telur-lebaran-aman (Accessed January 9, 2024).
Ekunwe, P. A., Soniregun, O. O., and Oyedeji, J. O. (2006). Economics of small scale deep litter system of egg production in Oredo local government area of Edo state, Nigeria. Int. J. Poult. Sci. 5, 81–83. doi: 10.3923/ijps.2006.81.83
Ferlito, C., and Respatiadi, H. (2019). Policy reforms on poultry industry in Indonesia. Jakarta, Indonesia: Center for Indonesian Policy Studies. doi: 10.35497/271878
Gio, P. U., and dan Rosmaini, E. (2017). Belajar Olah Data Statistika dengan K-Stat. Medan, Indonesia: USUpress.
Gould, B. W., and Saupe, W. E. (1989). Off-farm labour market entry and exit. Am. J. Agric. Econ. 71, 960–969. doi: 10.2307/1242672
Halidu, J., Saleh, Y., and Ilham, F. (2021). Identifikasi Jalur Pemasaran Sapi Bali Di Pasar Ternak Tradisional. Jambura J. Anim. Sci. 3, 135–143. doi: 10.35900/jjas.v3i2.6943
Haryuni, N., and Fanani, Z. (2017). Study of feasibility on broiler business development. J. Dev. Res. 1, 63–67. doi: 10.28926/jdr.v1i2.25
Hasan, N. M., Haryuni, N., and Lestariningsih,. (2023). The effect of unproductive and productive chicken ratio on the feasibility of laying hensbusiness. Anim. Sci. J. 14, 59–66. doi: 10.30736/jt.v14i2.160
Helmi, A., Rihan, i., Ratna, A., and Mega, P. N. (2018). Analisis Faktor-Faktor yang Mempengaruhi Pendapatan Usaha Ayam Ras Petelur di Kabupaten Lima Puluh Kota. Agric. Food Secur. 1, 120–126. doi: 10.31258/unricsagr.1a16
Hidayat, L., and Halim, S. (2013). Analisis Biaya Produksi Dalam Meningkatkan Profitabilitas Perusahaan. J. Ilm. Manaj. Kesat. 1:2. doi: 10.37641/jimkes.v1i2.263
Hidayat, I. R., and Wulantika, L. (2021). Pengaruh Pengalaman Kerja, Pelatihan Kerja dan Disiplin Kerja Terhadap Kinerja Karyawan Pada PT. Vonex Indonesia Rancaekek. J. Economics, Management, Bussines, And Accounting. 1, 93–106. doi: 10.34010/jemba.v1i1.5023
Ibrahim, S. d. Z. (2020). Analisis Faktor-Faktor yang Mempengaruhi Pendapatan Peternak Rakyat Sapi Potong di Kacanmatan Lampasio Kabupaten Tolitoli Provinsi Sulawesi tengah. J. Sos. Ekon. Pertan. 13, 307–315. doi: 10.19184/jsep.v13i3.18446
Ijaiya, A. T., Egena, S. S. A., and Omohain, D. (2012). “Egg production of Japanese quails (Coturnix coturnix japonica) fed dietary levels of fermented cassava (Manihot spp.) peal meal.” in 17th Annual Conference of Animal Science Association of Nigeria (ASAN) Abuja, Nigeria. 20:6.
Iskandar, I., and Arfa’i,. (2007). Analisis Program Pengembangan Usaha Sapi Potong di Kabupaten Lima Puluh Kota, Sumatera Barat (Studi Kasus: Program Bantuan Pinjaman Langsung Masyarakat). Skripsi. Padang: Universitas Andalas.
Kaine, A. I. N., Iku, J. E., and Ebigwai, S. J. (2018). Analysis of determinants demand and supply of maize in Aniocha north local government area, Delta state, Nigeria. Int. J. Sustain. Agric. Res. 2:1. doi: 10.18488/journal.70/2015.2.1/70.1.12.21
Kibunja, E. T., and Musau, S. (2024). Cost of production and financial performance of selected poultry rearing farmers in Kiambu County, Kenya. Int. J. Current Aspects Finan. Banking Account. 6, 14–30. doi: 10.35942/7h3v8c56
Kothari, C. R. (2004). Research methodology: Methods and techniques. New Delhi: New Age International (P) Ltd., Publishers.
Lastianti, S. D., Muryani, E., and Ali, M. (2018). The role of the internal audit management of enterprise risk management. Int. J. Entrep. Bus. Dev. 1, 110–119. doi: 10.29138/ijebd.v1i2.553
Liu, Z., Spieger, M. M., and Zhang, J. (2023). Capital flows and income inequality. J. Int. Econ. 144:103776. doi: 10.1016/j.jinteco.2023.103776
Makatita, J. (2014). Tingkat Efektifitas Penggunaan Metode Penyuluhan Pengembangan Ternak Sapi Potong di Kabupaten Buru Provinsi Maluku. Agromedia 32, 64–74. doi: 10.47728/ag.v32i2.95
Malarvizhi, V., and Geetha, K. T. (2015). Economic cost & profit assessment of poultry farming in Namakkal District. J. Manag. Sci. 5, 42–55. doi: 10.26524/jms.2015.14
Manyamsari, I., and Mujiburrahmad, d. (2014). Karakteristik Petani dan Hubungannya dengan Perilaku Petani Lahan Sempit. Agrisep 15, 59–74.
Map of Indonesia. (2022). Available online at: https://id.m.wikipedia.org/wiki/Berkas:Indonesia_location_map.svg [Accessed 9 September 2024].
Map of Pinrang Regency. (2022). Available online at: https://www.pn-pinrang.go.id/pnpinrang/images/peta_wilayah_hukum.jpg [Accessed 9 September 2024].
Map of South Sulawesi Province. (2019). Available online at: https://id.wikipedia.org/wiki/Berkas:Locator_South_Sulawesi_Province,_Indonesia.svg [Accessed 9 September 2024].
Maryam, M., Paly, M. B., and Astati, A. (2016). Analisis Faktor-Faktor yang Mempengaruhi Penentu Pendapatan Usaha Peternakan Sapi Potong (Studi Kasus Desa Otting Kab. Bone). J. Ilmu Dan Ind. Peternak 3, 79–101. doi: 10.24252/jiip.v3i1.3921
Marangon, S. B. (2006). The Use of Vaccination in Poultry Production. Rv. sCI. Tech. Off. Int. Epiz. 26, 265–274. doi: 10.20506/rts.26.1.1742
Mluge, F. F., Ndyerabula, D. W., Waized, B. M., Alphonce, R. S., and Sorensen, O. J. (2022). Profitability analysis of layer chicken production in Dar Es Salaam, Tanzania. East. South. Afr. J. Agric. Econ. Dev. 12.
Mokhlis, S., and Salleh, H. (2009). Consumer decision-making styles in Malaysia: an exploratory study of gender differences. Eur. J. Soc. Sci. 10:4.
Mosher, A. (1981). Menggerakkan dan Membangun Pertanian, Syarat-Syarat Pokok Pertanian dan Modernisasi. Jakarta: CV Yasaguna.
Mulyono, A. D., Sumekar, W., and Sunarti, D. (2017). Analisis Profitabilitas Pengembangan Usaha Ternak Itik Petelur di Kecamatan Bayubiru Kabupaten Semarang Jawa Tengah. J. Ilmu Peternak. Ter. 1:1. doi: 10.25047/jipt.v1i1.531
Muntari, (2007). Hubungan Antara Besarnya Modal Usaha Dan Kesulitan Pemasaran Dengan Tingkat Pendapatan Pengusaha. Program Studi Pendidikan Akuntansi Jurusan Pendidikan Ilmu Pengetahuan SosialFakultas Keguruan Dan Ilmu Pendidikan Universitas Sanata Dharma Yogyakarta.
Murib, P., Kruniasih, I., and Kadarso,. (2014). Analisis Ekonomi Usaha Ayam Petelur Di Farm Harma Banjarharjo Kecamatan Ngemplak. Agros 16, 19–29.
Musholihah, A., Zulfanita,, and Mudawaroch, R. E. (2020). Analysis of income of laying breed chicken farmers at the Purworejo prosperous egg blessing association. J. Indones. Anim. Sci. 2:1. doi: 10.53863/jspn.v2i01.454
Nagelkerke, N. J. D. (1991). A note on a general definition of the coefficient of determination. Biometrika 78, 691–692. doi: 10.1093/biomet/78.3.691
Nurlaili, F., and G dan Reshi, W. (2021). Faktor-Faktor yang Mempengaruhi Pendapatan Usaha Ternak Sapi Potong di Desa Rejodadi Kecamatan Sumbawa Kabupaten Banyuasin. Jurnal Socienta. 2, 59–65. doi: 10.32502/jsct.v10i2.4291
Nurliani,, Rosada, I., Sirajuddin, S.N., Nurhapsa,, Al Tawaha, A.R., Al Tahawa, A.R.M.S., et al. (2024). Factors affecting the trend in the number of chicken eggs produced in South Sulawesi REDVET. 1, 108–119. Available online at: http://www.veterinaria.org (Accessed 1 November 2024).
Okwuokenye, G. F., Onyemekihian, F., and Damisa, A. K. (2022). Determinants of giant snail (Achatina achatina) production in Federal Capital Territory (FCT) and Nasarawa state, Nigeria: challenges and prospects. J. Agric. Environ. 18:12.
Osinowo, O. H., and Tolorunju, E. T. (2019). Technical efficiency of poultry egg production in Ogun state, Nigeria. J. Agribus. Rural Dev. 51, 51–58. doi: 10.17306/J.JARD.2019.01137
Ospina, P. A., Nydam, D. V., and DiCiccio, T. J. (2012). Technical note: the risk ratio, an alternative to the odds ratio for estimating the association between multiple risk factors and a dichotomous outcome. J. Dairy Sci. 95, 2576–2584. doi: 10.3168/jds.2011-4515
Parasdya, W., dan, S. M., and Djatmiko, O. D. (2013). Analisis Finansial Usaha Peternakan Ayam Petelur di Kecamatan Kademangan Distric of Blitar. J. Ilm. Peternak 1, 88–98. Available at: https://id.scribd.com/doc/315874879
Permatahati, D., Mutia, R., and Astuti, A. D. (2019). Efect of cricket meal (Gryllus bimaculatus) on production and physical quality of japanese quail egg. Trop. Anim. Sci. J. 42:1. doi: 10.5398/tasj.2019.42.1.53
Prasetyo, R. M. (2018). Analisis Usaha AyamRas Petelur dan Pendapatan Petani di Desa Pula u Harapan Kecamatan Sembawa Kabupaten Banyuasin : Universitas Sriwijawa. Palembang.
Purwoko, B., Hadi, M. A., Gamal, A., and Prihartanti, W. (2022). The effect of production costs and sales volumes on profits of registered food and beverage sub-sector manufacturing companies on the Indonesia stock exchange for the 2018-2020 period. Enrichment J. Manag. 12:657. doi: 10.35335/enrichment.v12i3.657
Rahmadi, F. I. (2009). Manajemen Pemeliharaan Ayam Petelur di Peternakan Dony Farm Kabupaten Magelang. Surakarta: Fakultas Pertanian Universitas Sebelas Maret.
Rosdiyanti, (2017). Pengaruh faktor jumlah produksi dan biaya tenaga kerja terhadap laba usaha telur asin UD. Sumber Rejeki Desa Tawangrejo Turi Kabupaten Lamongan. Jurnal EKBIS 17:73. doi: 10.30736/ekbis.v17i1.73
Salele, C. C. L., Roimpandey, B., Massie, M. T., and Waleleng, P. O. V. (2014). Analysis of the use of production factors in laying chicken companies. Zootek J. 34, 1–14.
Sapkota, A. R., Lefferts, L. Y., MckENZIE, S., and Walker, P. (2007). What do we feed to food-production animals? A review of animal feedingredients and their potential impacts on human health. Environ. Health Perspect. 115, 663–670. doi: 10.1289/ehp.9760
Shahzadi, T., Salim, M., Umekalsoom,, and Shahzad, K. (2006). Growth performance and feed conversion ratio (FCR) of hybrid fingerlings (Catla catla x Labeo rohita) fed on cottonseed meal. sunflower meal and bone meal. Pak. Vet. 26, 163–166. Available at: http://www.pvj.com.pk/pdf-files/26_4/page%20163-166.pdf.
Sofyan, A., Suprijatna, E., Santoso, S. I., and Setiadi, A. (2019). Business sustainability model of smallholder layer farms in Kendal regency, Central Java, Indonesia. J. Indones. Trop. Anim. Agric. 44, 408–414. doi: 10.14710/jitaa.44.4.408-414
Steenbergen, M. R., and Jones, B. S. (2002). Modeling multilevel data structures. Source: Am. J. Political Sci. 46:218. doi: 10.2307/3088424
Suwarta,, and Hanafie, R. (2018). The influence of business management on income and the risk of income in the broiler chicken farming. J. Soc. Dev. 1:1. doi: 10.31328/jsed.v1i1.520
Tao, L., Hoang, K. M., Hunter, M. D., and de Roode, J. C. (2016). Fitness costs of animal medication: anti-parasitic plant chemicals reduce fitness of monarch butterfly hosts. J. Anim. Ecol. 85, 1246–1254. doi: 10.1111/1365-2656.12558
Thornton, P. K., and Gerber, P. (2010). Climate change and the growth of the livestock sector in developing countries. Mitig. Adapt. Strateg. Glob. Chang. 15, 169–184. doi: 10.1007/s11027-009-9210-9
Triana, A., Salam, T., and Muis, M. (2007). Income analysis of layer breeds in the layer period Cenrana District, Maros regency. Agrisist. J. 3:1.
Tugiyanto, P., and Mudawaroh, R. F. (2013). Analisis pendapatan dan efisiensi usaha ayam ras petelur di Kabupaten Wonosobo. Jurnal: Surya Agritama 2, 31–41.
Tumion, B. V. V. J., Panalewan, A., Makalew, B., and Rorimpandey,. (2017). Pengaruh Biaya Pakan Dan Tenaga Kerja Terhadap Keuntungan Usaha Ayam Ras Petelur Vony Kanaga Di Kelurahan Tawaan Kota Bitung. Zootek 37:15800. doi: 10.35792/zot.37.2.2017.15800
Utami, L. S., Baba, S., and Sirajuddin, S. N. (2015). Hubungan Karakteristik Peternak dengan Skala Usaha Ternak Kerbau di Desa Sumbang Kecamatan Surio Kabupaten Enrekang. Fakultas Peternakan: Universitas Hasanuddin.
Utami, S. R., and Wibowo, U. (2013). Pengaruh Modal Kerja Terhadap Pendapatan Dengan Lama Usaha sebagai Variabel Moderasi (Survei Pada Pedagang Pasar Klithikan Notoharjo Surakarta). J. Ekon. Kewirausahaan 13, 171–180. Available at: https://www.neliti.com/id/publications/23473/pengaruh-modal-kerja-terhadap-pendapatan-dengan-lama-usaha-sebagai-variabel-mode.
Verbeke, W., Spranghers, T., Clercq, P. D., Smet, S. D., Sas, B., and Eeckhout, M. (2015). Insects in animal feed: acceptance and its determinants among farmers, agriculture sector stakeholders and citizens. Anim. Feed Sci. Technol. 204, 72–87. doi: 10.1016/j.anifeedsci.2015.04.001
Vikaliana, R., Pujianto, A., Fika, R., Ronaldo, R., Reza, H. K., Ngii, E., et al. (2022). Ragam Penelitian Dengan SPSS. Sukoharjo, Jawa Tengah: Tahta Media Group.
Wahyono, N. D., and Utami, M. M. D. (2018). A review of the poultry meat production industry for food safety in Indonesia. J. Phys. 953:012125. doi: 10.1088/1742-6596/953/1/012125
Wardhana, H., Alfikri,, Nofrianil,, and Iryani, N. (2023). Analisis Faktor-Faktor yang Mempengaruhi Pendapatan Usaha Peternakan Ayam Petelur di Kabupaten Lima Puluh Kota. Jurnal ekonomi manajemen dan bisnie 1, 120–133. doi: 10.55043/ekonomipedias
Wardhani, A. (1994). Hubungan Karakteristik Demografis dan Motivasi Peternak dengan Penggunaan sumber-Sumber Informasi Tentang Ayam Buras Di Desa Cisontrol, Kabupaten Ciamis. Bogor: Institut Pertanian Bogor.
Wekhe, S. N., Owen, O. J., and Amadi, I. G. (2012). Evaluation of cost of medication of commercial broiler production in the tropics. Rev. Cient. UDO Agric. 12, 220–224.
Yana, D. P. S., Suparta, N., and Sanjaya, I. G. M. P. (2022). Business strategy of layer chicken business in the new normal era in the Bali Province. Agriwar J. 12, 55–60. doi: 10.22225/aj.2.2.2022.55-60
Keywords: layer chicken, production factors, poultry farming income, binary logistic regression, production cost management
Citation: Haruna AW, Salam M, Sulaiman AA, Rahmadanih R, Jamil MH, Pakiding W, Tenriawaru AN, Akhsan A, Mahyuddin M, Busthanul N, Fudjaja L, Heliawaty H, Muslim AI, Ali HNB and Ridwan M (2025) Examining the effect of farmer’s characteristics and production costs on the income of the layer chicken farm: on the lookout for an applicable management plan for boosting the breeder’s income. Front. Sustain. Food Syst. 9:1555709. doi: 10.3389/fsufs.2025.1555709
Edited by:
Denise Adelaide Gomes Elejalde, Universidade Tecnológica Federal do Paraná Pato Branco, BrazilReviewed by:
Olajide Mark Sogunle, Federal University of Agriculture, Abeokuta, NigeriaShivam Kumar Sharma, Jawaharlal Nehru University, India
Cheng Fang, South China Agricultural University, China
Copyright © 2025 Haruna, Salam, Sulaiman, Rahmadanih, Jamil, Pakiding, Tenriawaru, Akhsan, Mahyuddin, Busthanul, Fudjaja, Heliawaty, Muslim, Ali and Ridwan. This is an open-access article distributed under the terms of the Creative Commons Attribution License (CC BY). The use, distribution or reproduction in other forums is permitted, provided the original author(s) and the copyright owner(s) are credited and that the original publication in this journal is cited, in accordance with accepted academic practice. No use, distribution or reproduction is permitted which does not comply with these terms.
*Correspondence: Muslim Salam, bXVzbGltc2FsQHlhaG9vLmNvbQ==