 Huae Dang1
 Yuanjie Deng
- 1School of Economics, Sichuan University of Science and Engineering, Zigong, China
- 2Research Center of Agricultural Economy, Sichuan University of Science and Engineering, Zigong, China
- 3Key Laboratory for Intelligent Management and Ecological Decision Optimization of Baijiu in the Upper Reaches of the Yangtze River, Yibin, China
Food security has become one of the central issues drawing global attention. Currently, the global food security situation is becoming increasingly urgent, profoundly impacting both China’s economic development and social stability, while also bearing significant national strategic importance. This paper is based on county-level grain production data from Sichuan Province between 2000 and 2022. Firstly, it employs methods such as standard deviation ellipses, center of gravity shifts, and spatial autocorrelation analysis to explore the spatiotemporal evolution of grain production in Sichuan Province. Furthermore, the Geodetector and GWR models are applied to identify and quantify the key drivers affecting grain production in Sichuan Province, as well as their spatial heterogeneity. The study finds that: (1) grain production in Sichuan Province shows a fluctuating growth trend, with clear regional disparities in its spatial distribution; (2) The spatial distribution of grain production in Sichuan Province exhibits a positive correlation, with its spatial association gradually strengthening, while also displaying significant spatial differences and regional clustering; (3) In terms of detecting driving factors, actual cultivated land area of the year has a significant impact on grain production, with its influence becoming particularly prominent when interacting with other factors; (4) Regarding the spatial heterogeneity of driving factors, each driver shows distinct spatial differentiation characteristics. Cultivated land area, fertilizer usage, and rural electricity consumption all exert a significant positive effect on overall grain production, while other influencing factors generally have a negative impact. This study not only deepens the scientific understanding of the spatiotemporal evolution and driving mechanisms of grain production but also provides scientific evidence and policy recommendations for food security and sustainable agricultural development in Sichuan Province and similar regions.
1 Introduction
Food security is a crucial foundation for global sustainable development (Pawlak and Kołodziejczak, 2020), directly related to key issues such as eradicating hunger (SDG 2) and reducing poverty (SDG 1) in the United Nations Sustainable Development Goals (Khanal et al., 2021). According to data from the United Nations Food and Agriculture Organization (FAO), global grain production reached 2.8 billion tons in 2022, an increase of 1.2% year-on-year. However, due to factors such as climate change, land degradation, and socioeconomic pressures, over 800 million people worldwide still face food insecurity, and food security remains a critical challenge (Barakat et al., 2023; Agapkin and Makhotina, 2021). In China, food security is given even greater attention. Statistics show that China’s total grain production reached 686 million tons in 2022, maintaining a level above 650 million tons for eight consecutive years, effectively ensuring the food supply for its 1.4 billion people. However, in the face of challenges such as the reduction of arable land, climate change, and the aging of the agricultural labor force, food security remains an important issue for China’s socio-economic development. The Chinese government highlights the importance of ensuring food security in its annual No. 1 Central Document, continuously emphasizing the need to increase grain production and optimize the structure of grain production. Grain production is not only an important indicator of agricultural productivity but also a key factor in ensuring national food security (Fei et al., 2023; Li et al., 2021). In recent years, the trends and driving factors behind changes in grain production have garnered widespread attention from the academic community. In-depth research on the spatiotemporal evolution of grain production and its driving factors helps to understand the dynamics of grain production in different regions, providing support for the formulation of scientific agricultural management policies, thereby ensuring food security and contributing to sustainable agricultural development.
In the academic field of food security, much of the research has focused on the spatiotemporal evolution characteristics of grain production and the identification of its driving factors. Firstly, scholars have widely applied methods such as remote sensing monitoring and spatial analysis to study the trends of grain production changes on global and regional scales. These studies have effectively revealed the dynamic temporal and spatial characteristics of grain production (Jiang et al., 2024; Pan et al., 2020; Zhou et al., 2020; Zhu et al., 2022; Zhang D. et al., 2023), which can help us understand the regional differences in grain production and the trends in grain production over different periods, thus providing foundational support for formulating more effective agricultural policies and improving grain production efficiency. Further, based on the analysis of the spatiotemporal evolution of grain production, scholars have used methods such as regression analysis (Liu Y. et al., 2021; Liu, 2024), path analysis (Sun et al., 2024; Liu et al., 2023), and structural equation modeling (Khan et al., 2024; Eze and Abe, 2024) to identify the driving factors behind it. However, these methods often overlook the spatial heterogeneity of driving factors across different regions, leading to an inability to fully identify the local characteristics of the driving factors, thus limiting the understanding of the complexity of grain production changes. To address this issue, some scholars have introduced the Geodetector model (Lei et al., 2022; Kheyruri et al., 2024) or the Geographically Weighted Regression (GWR) model (Zhao et al., 2022; Xia et al., 2018) into their studies. However, while the Geodetector model can reveal spatial heterogeneity, it cannot quantitatively assess the local effect strengths of different driving factors (Chen et al., 2024; Zhang et al., 2022) and while the GWR model can further identify local effects, it has certain limitations in revealing the spatial differences of driving factors (Zhang W. et al., 2023; Yuan et al., 2024). Therefore, combining the Geodetector and GWR models can more comprehensively identify the heterogeneity of driving factors. The Geodetector model can reveal the spatial differentiation of influencing factors at the macro level and identify the relative importance of driving factors in different regions (Zhang H.-Z. et al., 2023; Wan et al., 2023), while the GWR model can further quantify the local effect strength of each driving factor at the micro level (Cheng et al., 2024; Hu Y. et al., 2024). By combining these two models, it is possible to obtain an overall spatial distribution of driving factors and also finely depict the specific manifestations of driving effects in different regions, thus achieving a comprehensive identification of spatial heterogeneity and enhancing the relevance and effectiveness of policy measures. Therefore, combining these two models can effectively address the gaps in existing research on the identification of spatial heterogeneity in driving factors, providing more precise support for the scientific management and decision-making of grain production.
Sichuan Province, as a major grain-producing area in southwest China, holds a significant strategic position for national food security. The province’s diverse natural geographic conditions and agricultural production methods result in significant complexity and heterogeneity in the spatial distribution of grain production and its driving factors in Sichuan. Based on this, the study utilizes grain production data from 177 counties in Sichuan Province between 2000 and 2022. First, it employs models such as kernel density estimation and standard deviation ellipse center of gravity shift to comprehensively characterize the spatiotemporal evolution of grain production. Second, it combines the Geodetector and GWR models to comprehensively identify the heterogeneous driving factors. This study aims to provide a deeper understanding of the spatial distribution patterns and driving mechanisms of grain production in Sichuan Province, thereby offering scientific evidence for formulating more refined agricultural policies and optimizing agricultural inputs in the province, and providing valuable insights to help Sichuan build a higher-level “Tianfu Granary” in the new era.
2 Overview of the study area
Sichuan Province is located between 97°21′E and 108°33′E, and 26°03′N and 34°19′N, covering an area of approximately 486,000 km2 (Liu C. et al., 2021; He C. et al., 2022) (Figure 1). It is mainly divided into five major economic regions: the Chengdu Plain Economic Zone (CPEZ), the South Sichuan Economic Zone (SSEZ), the Northeast Sichuan Economic Zone (NSEZ), the Panxi Economic Region (PER), and the Northwest Sichuan Ecological Demonstration Area (NSEDA) (Wan et al., 2023). The terrain of Sichuan Province is characterized by high mountains in the west and lower elevations in the east, sloping from northwest to southeast. The topography is complex and diverse, dominated by mountains and plateaus, with hills in secondary prominence and plains being relatively scarce. Sichuan Province has a diverse range of climate types, generally exhibiting characteristics of a subtropical humid climate, with warm and moist conditions and ample rainfall. The climate of the province is heavily influenced by its topography, with an annual average temperature ranging from 15°C to 22°C. Specifically, the climate in the eastern basin region is mild, with annual precipitation ranging from 500 to 1,200 mm. Such climatic conditions are highly favorable for the growth of food crops. In contrast, the climate in the western plateau region is relatively cold, with annual precipitation around 600–700 mm, and there is a notable vertical climate variation.
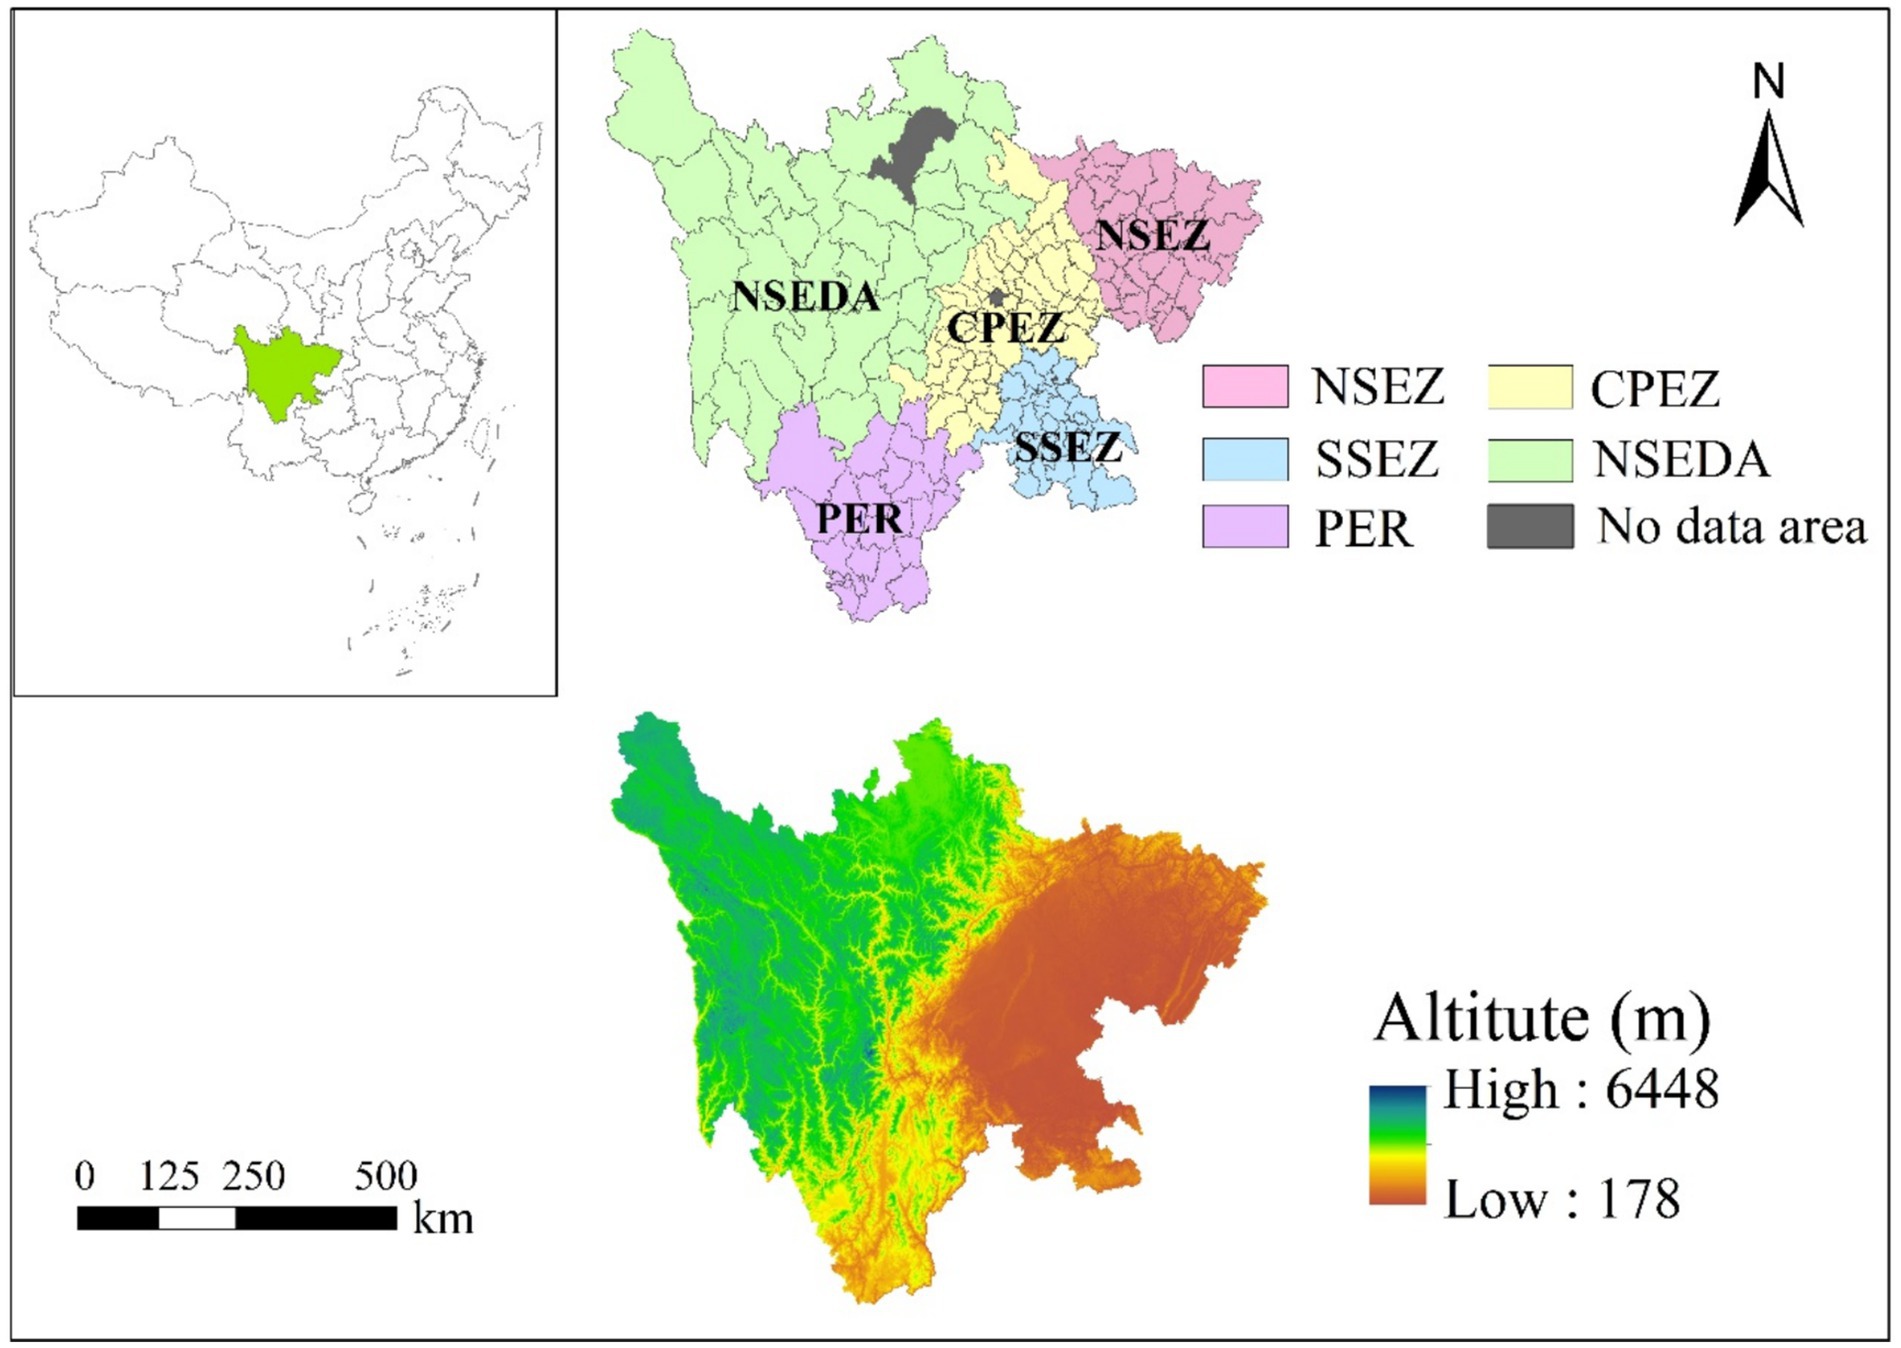
Figure 1. Overview of the study area. Data: National Geographic Information Resource Directory Service System and Open Topography Platform.
3 Research methods and data sources
3.1 Research methods
3.1.1 Standard deviation ellipse and center of gravity shift
The standard deviation ellipse is a spatial statistical method used to reveal the spatial distribution and multidimensional characteristics of the subject under study. This study uses the standard deviation ellipse to analyze the shift of the grain production center of gravity. The long axis of the standard deviation ellipse represents the spatial characteristics of the data distribution, while the short axis indicates the degree of data dispersion. The formula is given by Wu and Li (2024):
In Equation (1), are the longitude and latitude of the center of gravity, respectively; represent the longitude and latitude of the center of the i-th region; denotes the spatial weight of the attribute value of the i-th region.
3.1.2 ESDA exploratory spatial data analysis
Spatial autocorrelation analysis can reveal the spatial distribution of a certain attribute and its association and differences with neighboring regions. It can be divided into global spatial autocorrelation and local spatial autocorrelation.
(1) Global Autocorrelation
The function of global spatial autocorrelation is to describe the overall distribution of a variable’s attribute values and determine whether the phenomenon exhibits clustering characteristics. The calculation method is as follows (Zhou et al., 2020)
In Equation (2), xi and ji represent the attribute values of the i-th and j-th spatial units, respectively; n is the number of spatial units; and x is the average attribute value of all i-th and j-th spatial units. The I value ranges from [−1 to 1]. A I value greater than 0 and closer to 1 indicates a more significant spatial clustering of grain production. A I value less than 0 and closer to −1 indicates a more significant spatial dispersion of grain production.
(2) Local Autocorrelation
The drawback of global autocorrelation analysis is its inability to specifically characterize local spatial clustering effects. Local spatial autocorrelation can estimate the extent of clustering areas. Local spatial autocorrelation exhibits spatial heterogeneity, meaning that the degree of spatial autocorrelation varies across different regions, which can be tested using LISA (Local Indicators of Spatial Association) (Li et al., 2022):
In Equation (3), When Ii > 0, it indicates positive spatial correlation in neighboring areas, including two types: “high-high” and “low-low,” where grain production in adjacent areas exhibits high (low) clustering. When Ii < 0, negative spatial correlation exists, including two types: “high-low” and “low-high,” where there is a significant difference in grain production between neighboring areas.
3.1.3 Selection of Geodetector and GWR indicators
This study introduces the use of the Geodetector and GWR to investigate the factors influencing grain production in Sichuan Province. Based on previous studies and the ease of data collection as well as data completeness (Liu C. et al., 2021; He C. et al., 2022; Wu and Li, 2024; Zhou et al., 2020; Li et al., 2022), nine indicators were selected for measurement, as shown in Table 1.
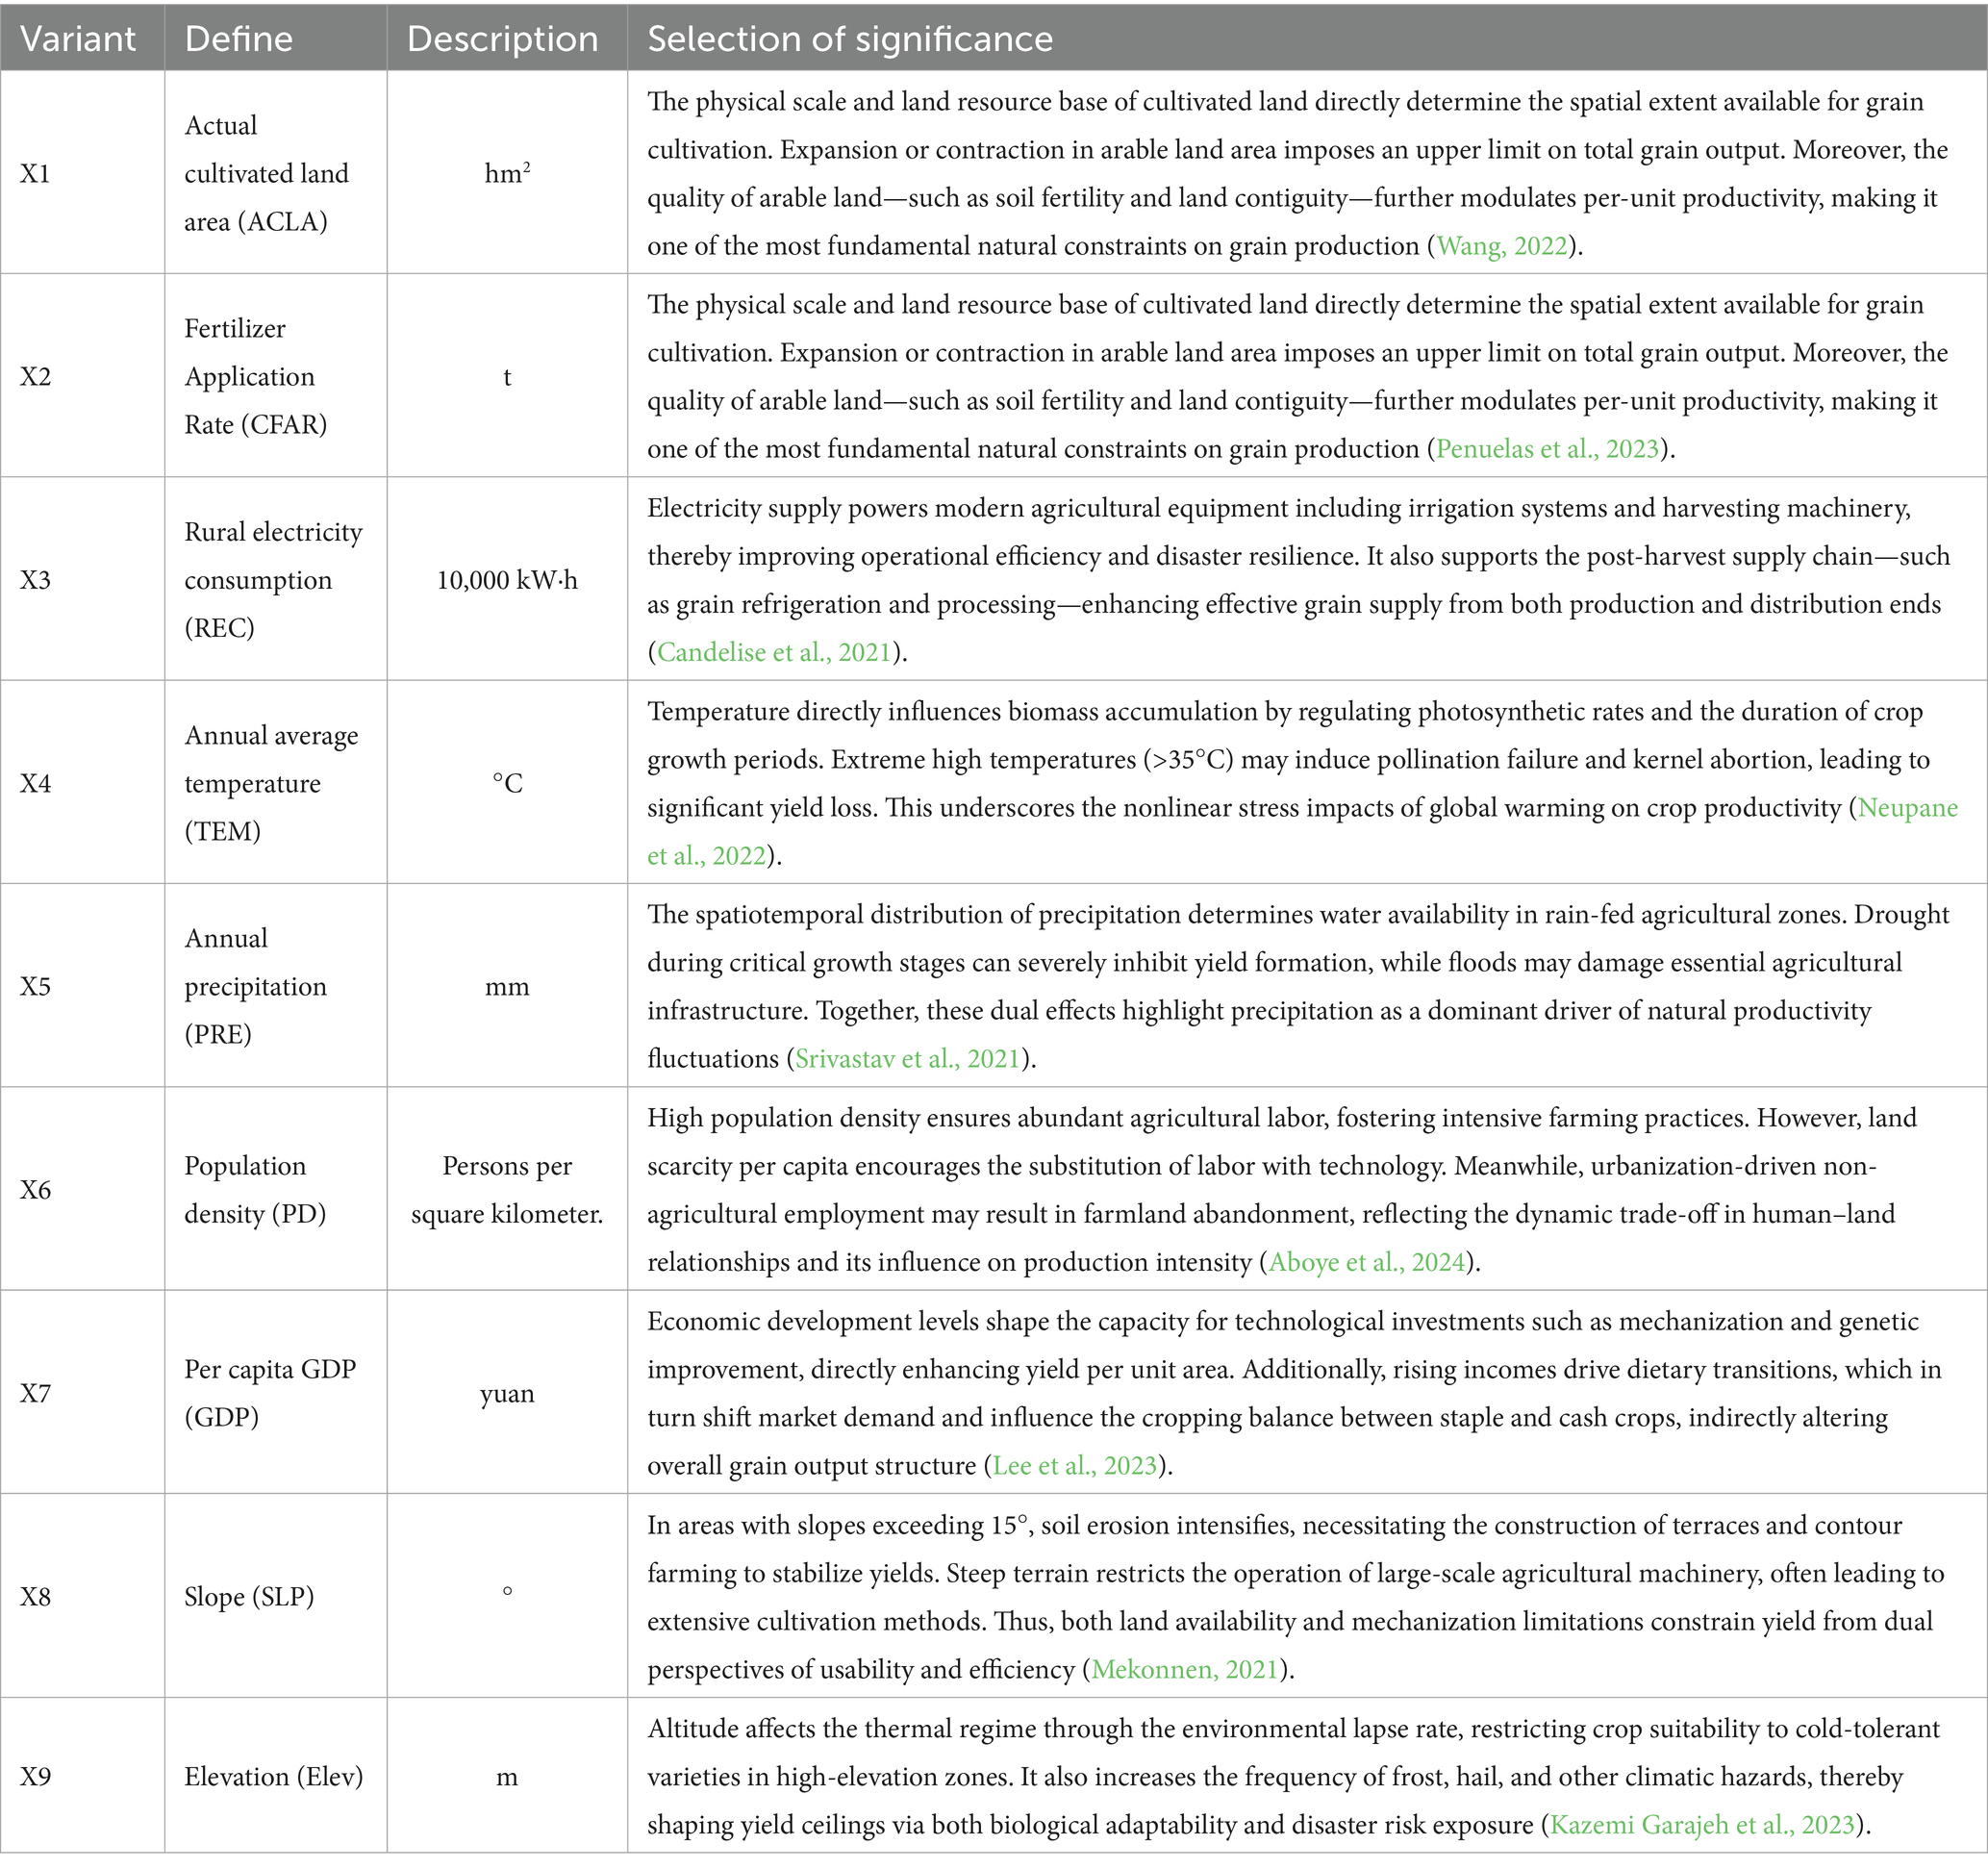
Table 1. Selection of impact factor indicators.
3.1.4 Research framework
As shown in Figure 2, this study first constructs a comprehensive indicator system from three dimensions: socioeconomic factors, agricultural input elements, and geographical environment. Next, standard deviation ellipse and center of gravity shift analysis, and spatial autocorrelation analysis are employed to reveal the spatial distribution characteristics of grain production. Finally, the Geodetector model and GWR model are used to deeply analyze the spatial heterogeneity relationship between grain production and various driving factors.
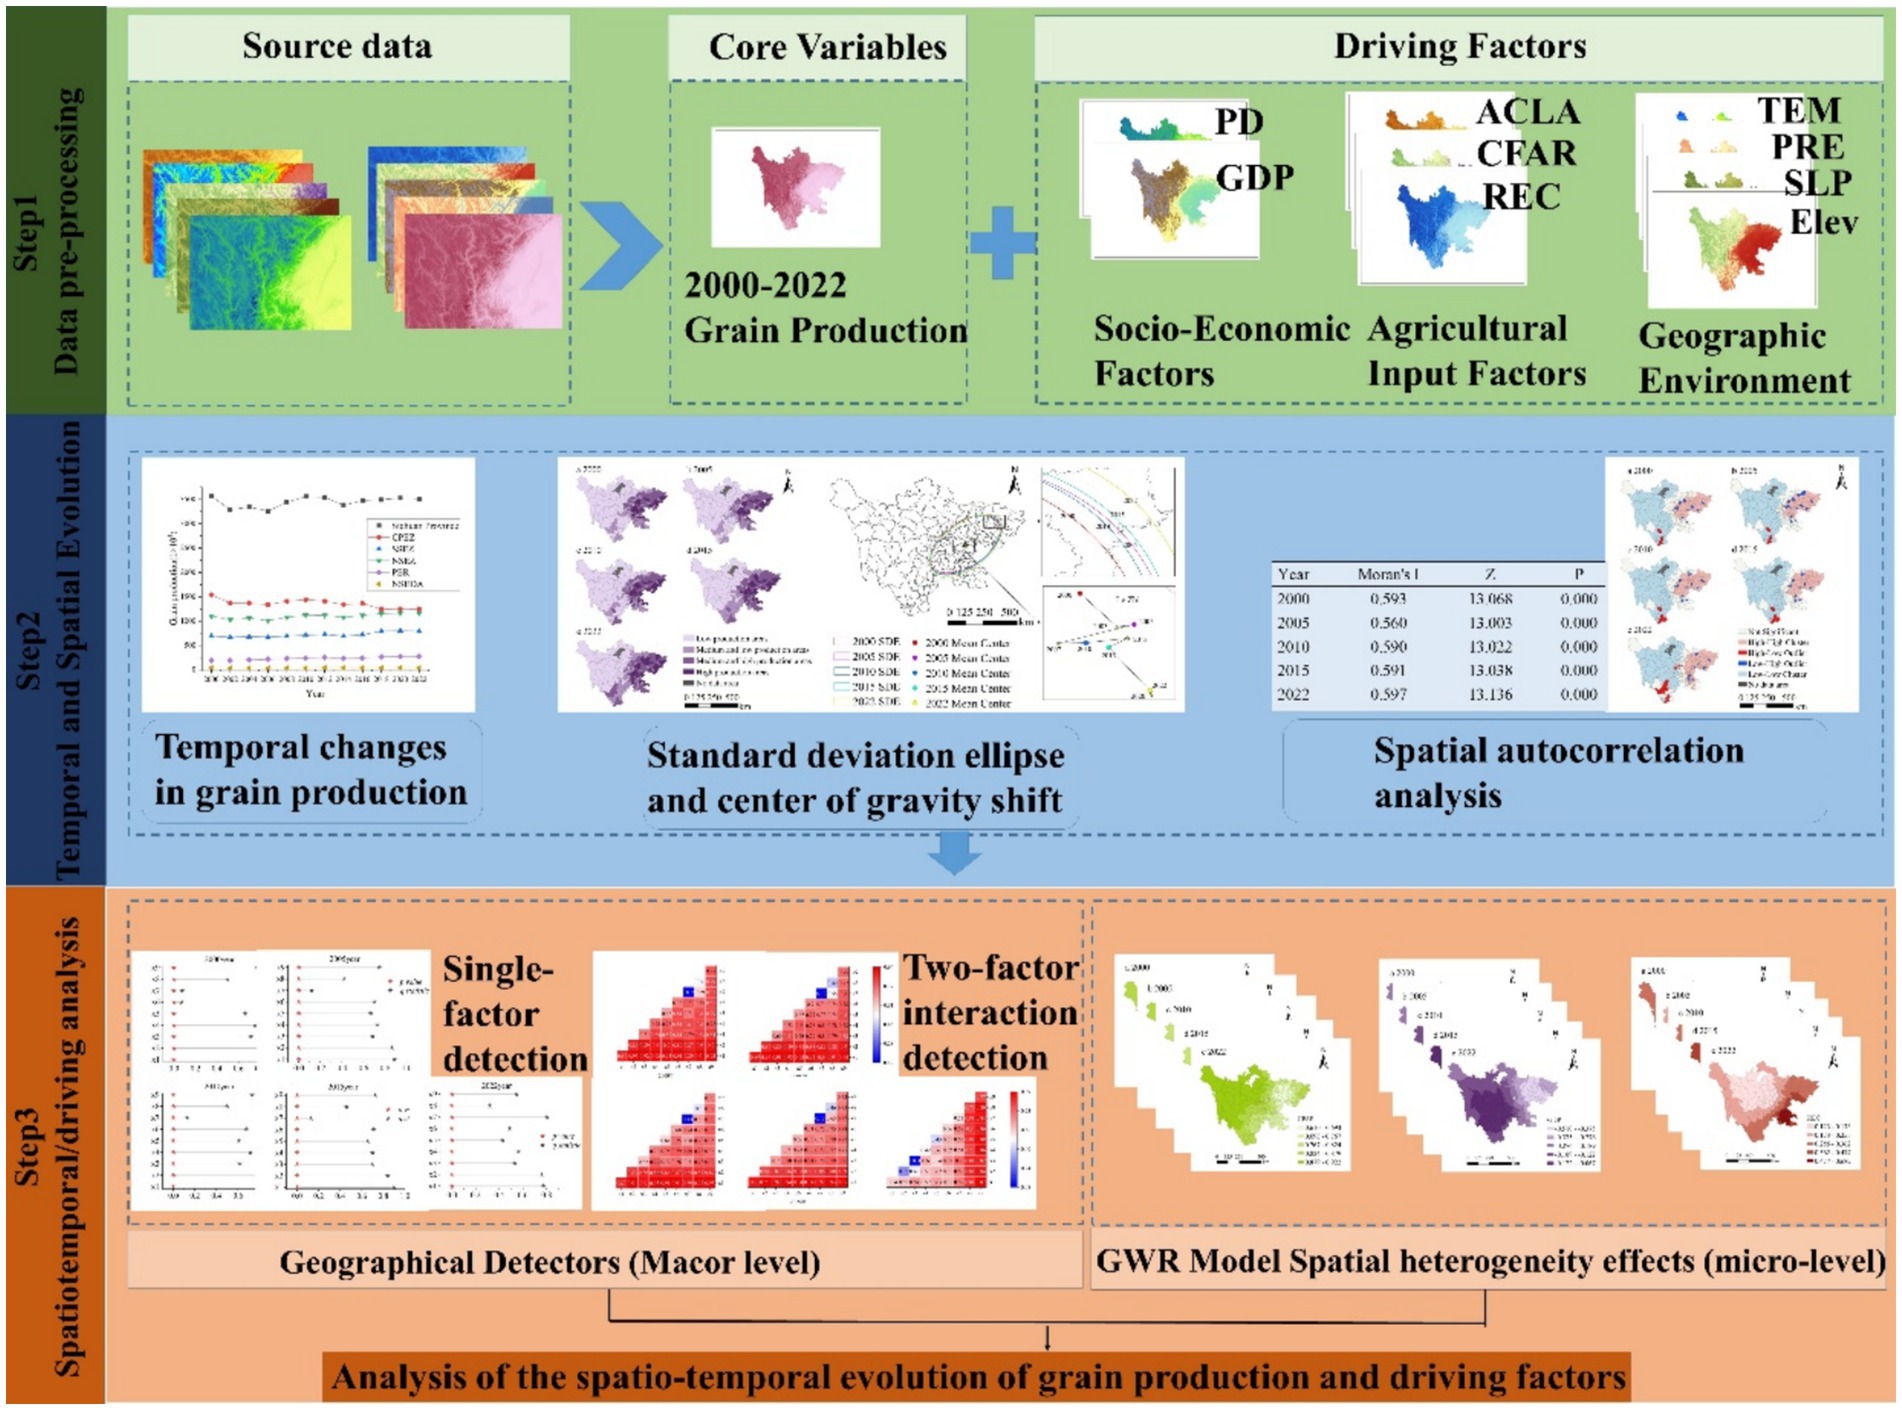
Figure 2. Research framework diagram.
3.1.5 Geodetector
Geodetector is a statistical method used to detect the spatial differentiation of geographical factors and their driving forces. Based on the optimal parameter-based Geodetector model (OPGD), it uses factor detection to analyze the explanatory power of influencing factors on grain production in Sichuan Province (Chen et al., 2023). The expression for the explanatory power q-value is as follows:
In Equation (4), the explanatory power, represented by the q-value, is expressed as follows: where the q-value ranges from [0, 1]. A larger q-value indicates a stronger explanatory power of the independent variable on the dependent variable, and a more obvious spatial differentiation of the dependent variable; conversely, a smaller q-value suggests weaker explanatory power. N is the total sample size of the study area; σ2 is the variance of the indicator; Nj and σj2 are the sample size and variance of indicator j-th (j = 1, 2, …, p); p is the total number of indicators.
3.1.6 Geographically weighted regression (GWR)
GWR is a local parameter estimation method used to quantify spatial heterogeneity. In this study, the GWR model is used to analyze the spatial impact of various factors on grain production in Sichuan Province (Gao et al., 2022). The expression is as follows:
In Equation (5), yi represents the grain production of the i-th county; () represents the geographic coordinates of the i-th county; is the intercept of the regression equation; represents the regression coefficient of the m-th explanatory variable for the i-th county; and λi is the error term.
3.2 Data sources
The main study period of this research is from 2000 to 2022, with statistical data primarily sourced from the following three aspects:
(1) Geographic Information Base Data: The county-level vector data of grain production in Sichuan Province is sourced from the National Geographic Information Resource Directory Service System,1 covering a total of 183 county-level administrative units.
(1) Remote Sensing Data: DEM data was downloaded from the Open Topography Platform.2 Slope data was calculated from DEM data using the “Slope” tool in ArcGIS 10.7. Meteorological data includes both temperature and precipitation data, sourced from the China 1 km Resolution Monthly Average Temperature Dataset (1901–2022) and the China 1 km Resolution Monthly Precipitation Dataset (1901–2022), both provided by the National Qinghai-Tibet Plateau Science Data Center.3
(3) Socio-economic Data: The county-level socio-economic statistical data used in this study was compiled from the “Sichuan Provincial Statistical Yearbook (2001–2023)” published by the Sichuan Provincial Bureau of Statistics.4 Missing data was supplemented by referring to the statistical yearbooks of various prefecture-level cities.
Due to missing agricultural data for Jinjiang District, Qingyang District, Jinniu District, Wuhou District, Chenghua District, and Hongyuan County, these six areas were excluded from this study.
4 Results of the study
4.1 Characteristics of temporal changes
Using county-level units in Sichuan Province as the research scale, grain production data from 2000 to 2022 were statistically analyzed to examine the temporal evolution characteristics of grain production in Sichuan Province (Figure 3). The results reveal that the grain production in Sichuan Province fluctuated between 3,200 × 104 and 3,600 × 104 t overall. In the regional comparative analysis, the grain production in the CPEZ generally showed a downward trend, primarily due to farmland being converted into construction land. Specifically, it decreases from 1,540 × 104 t in 2000 to 1,245 × 104 t in 2022; Despite this, the grain production in the CPEZ remained at a relatively high level compared to the five major economic regions. Meanwhile, the grain production in the SSEZ, NSEZ, and the PER showed an annual growth trend, though the growth rate was relatively slow. In contrast, the grain production in the NSEDA remained relatively stable, consistently staying at a low level of approximately 37 × 104 t.
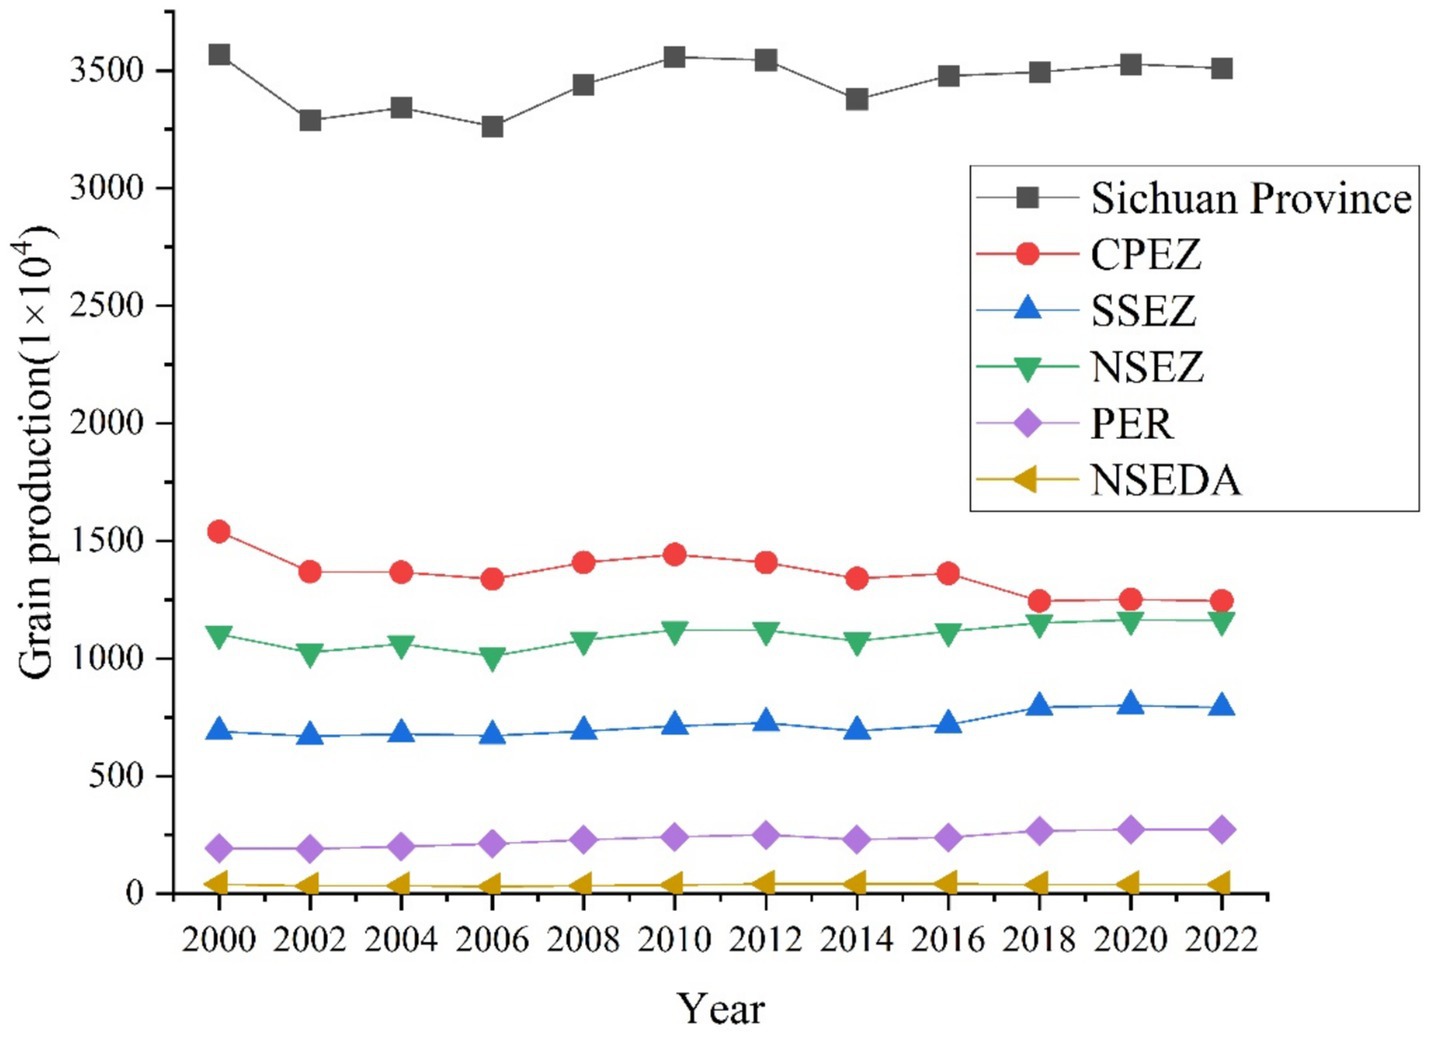
Figure 3. Chronological evolution of grain production in Sichuan Province. Data: Sichuan Provincial Statistical Yearbook.
4.2 Spatial distribution characteristics
4.2.1 Spatial variation characteristics
The natural breaks classification method was used to visualize the spatial distribution of grain production at the county level in Sichuan Province (Figure 4). As shown in Figure 4, high-production counties are concentrated in the NSEZ, CPEZ, and SSEZ, which consistently exhibit high grain production across all years. Low-production counties are mainly located in the NSEDA, from 2000 to 2022, the number of high-production counties increased from 24 to 25, while the number of low-production counties decreased from 100 to 97.
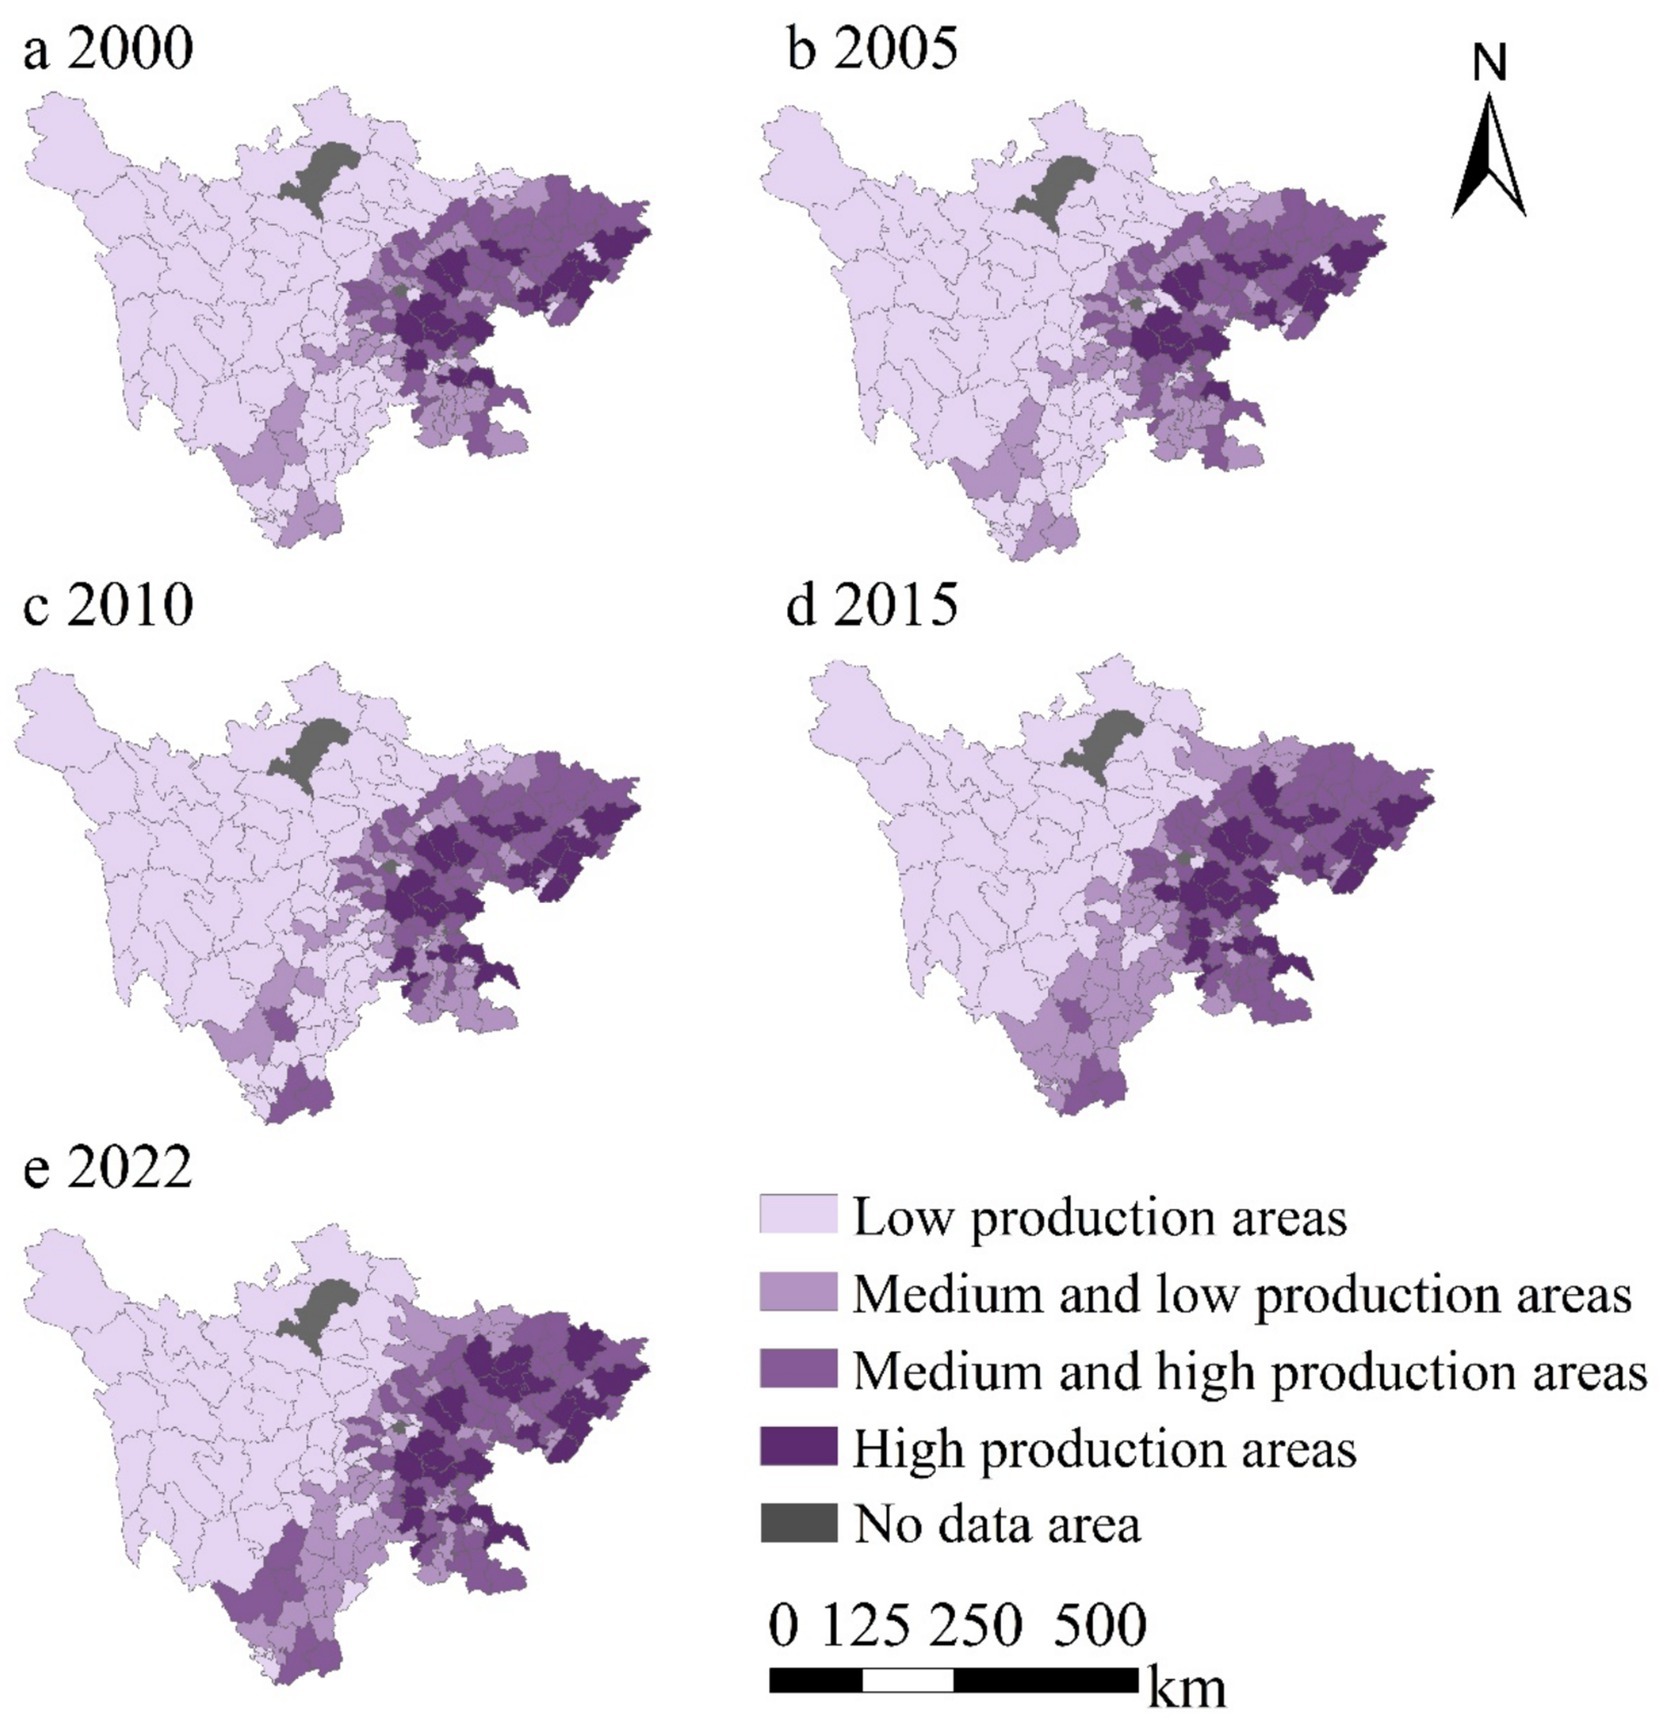
Figure 4. Spatial distribution of grain production by county in Sichuan Province, 2000–2022. Data: Sichuan Provincial Statistical Yearbook.
4.2.2 Standard deviation ellipse and center of gravity shift
Figure 5 illustrates the standard deviation ellipse and the shift of the center of gravity for grain production in Sichuan Province from 2000 to 2022. The standard deviation ellipse reveals the main trend and directionality of grain production distribution in Sichuan Province. The ellipse is oriented from northeast to southwest, with an overall southeastward shift. The major and minor axes of the standard deviation ellipse represent the degree of dispersion and the distribution range of grain production in Sichuan Province, respectively (Table 2). From 2000 to 2022, the major axis increased from 2.281 km to 2.482 km, while the minor axis fluctuated from 1.305 km to 1.302 km, indicating an increase in the dispersion of grain production in Sichuan Province. The ellipse’s eccentricity increased from 0.428 in 2000 to 0.471 in 2022, suggesting a rise in the concentration of grain production in Sichuan Province. The standard deviation ellipse of grain production in Sichuan Province exhibits a distinct northeast–southwest orientation, which closely aligns with the region’s topographic and hydrological configuration. In the northeast, the Jialing River basin is dominated by alluvial plains with fertile soils and well-developed irrigation systems, forming a traditional high-yield agricultural zone. In contrast, the southwestern region is shaped by tributaries of the Anning and Jinsha Rivers, where arable land is distributed in linear strips along river valleys. This spatial pattern reflects the fundamental constraints imposed by terrain and water availability on the distribution of grain production. Moreover, the elliptical orientation corresponds to the gradual elevation increase from east to west across Sichuan, highlighting the spatial variation in land suitability along topographic gradients. This directional trend reveals an adaptive coupling between natural environmental conditions and agricultural land use patterns in the province.
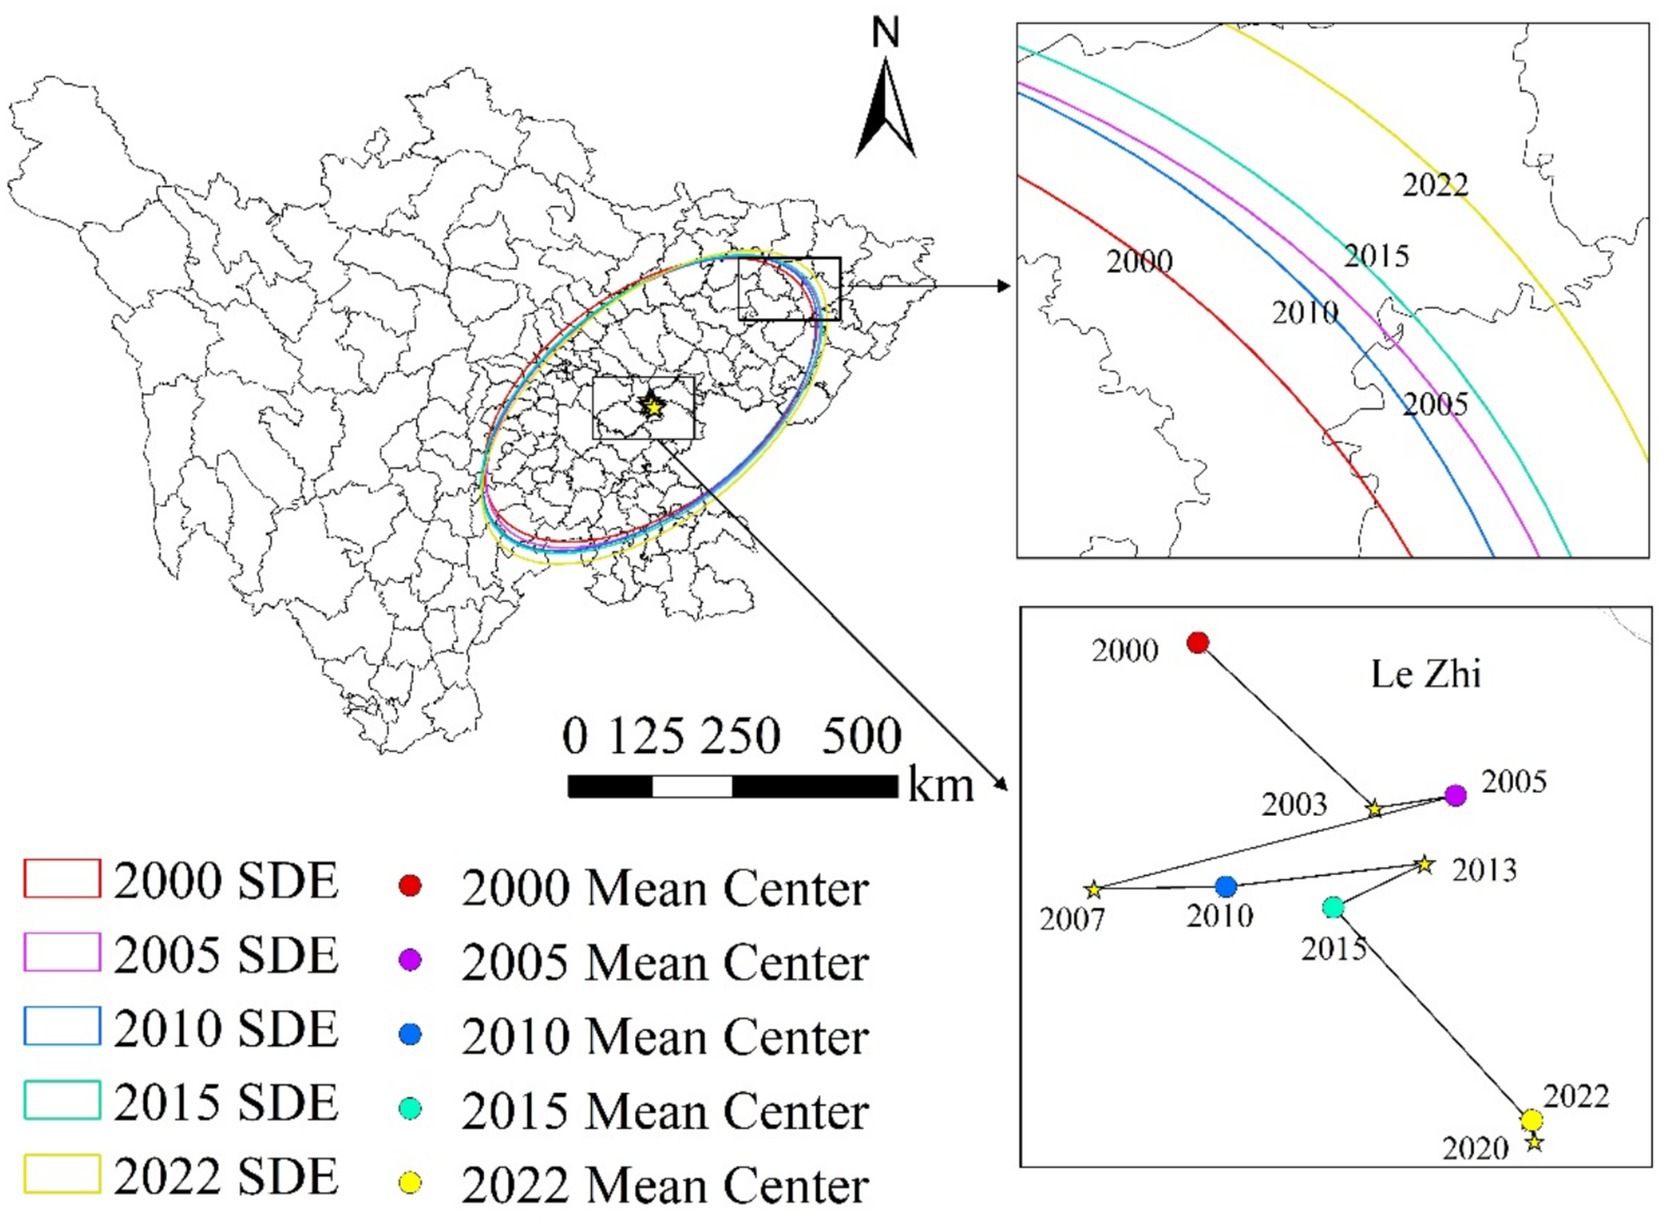
Figure 5. Spatial directionality analysis of grain production in Sichuan Province. Data: Sichuan Provincial Statistical Yearbook.
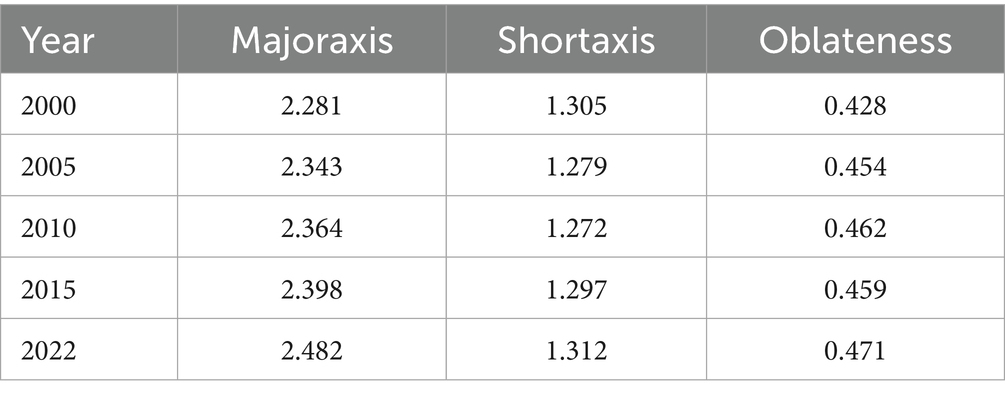
Table 2. Shape parameters of standard deviational ellipses.
The shift of the center of gravity reflects the changing trend of grain production distribution. As seen in the figure, the center of gravity for grain production in Sichuan Province has undergone a noticeable shift, yet it has remained within Lezhi County, indicating that grain production in Sichuan Province exhibits high stability and continuity. The shifting path of the center of gravity shows the changing trend of grain production distribution. The path of the center of gravity shift shows the changing trend in the distribution of grain production. The center of gravity positions in 2005 and 2010 are relatively close, indicating that the distribution of grain production was relatively stable during this period. The center of gravity positions in 2015 and 2020 are also relatively close; however, compared to 2005 and 2010, the center shifted eastward, indicating faster growth in grain production in the eastern regions during this period.
4.3 Spatially correlated features
(1) Global autocorrelation analysis
According to Table 3, the Moran’s I results for 2000–2022 show that the global Moran’s I values were all positive, with Z-values exceeding 13, and all passed the significance test, indicating a significant positive correlation in grain production across Sichuan Province. The Moran’s I values were all above 0.5, with relatively large values, reflecting a high degree of spatial autocorrelation in grain production within Sichuan Province.
(2) Local autocorrelation analysis
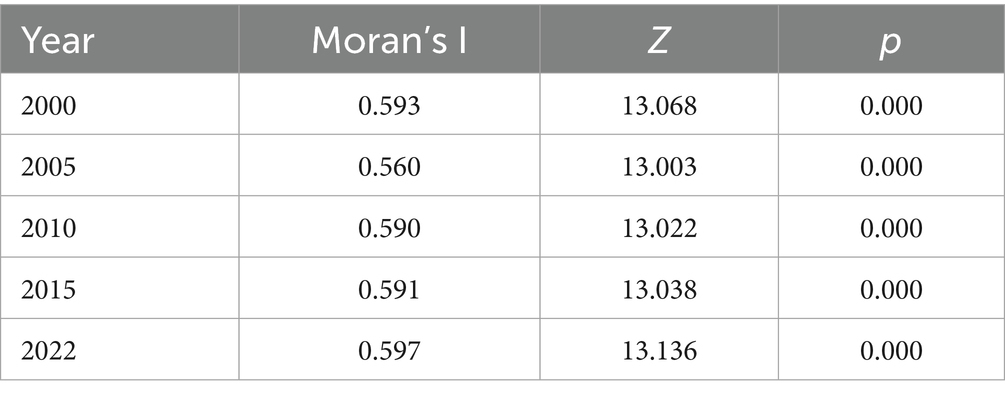
Table 3. Global correlation results.
The evaluation of global spatial association features has the drawback of overlooking the instability of local spatial processes. Therefore, to further explore the clustering relationships of grain production in Sichuan Province, this study conducts a local spatial autocorrelation analysis of grain production from 2000 to 2022 at the county level, calculating the LISA values for different years. As shown in Figure 6, overall, high-high and low-low clustering are the most widespread patterns of grain production distribution in Sichuan Province.
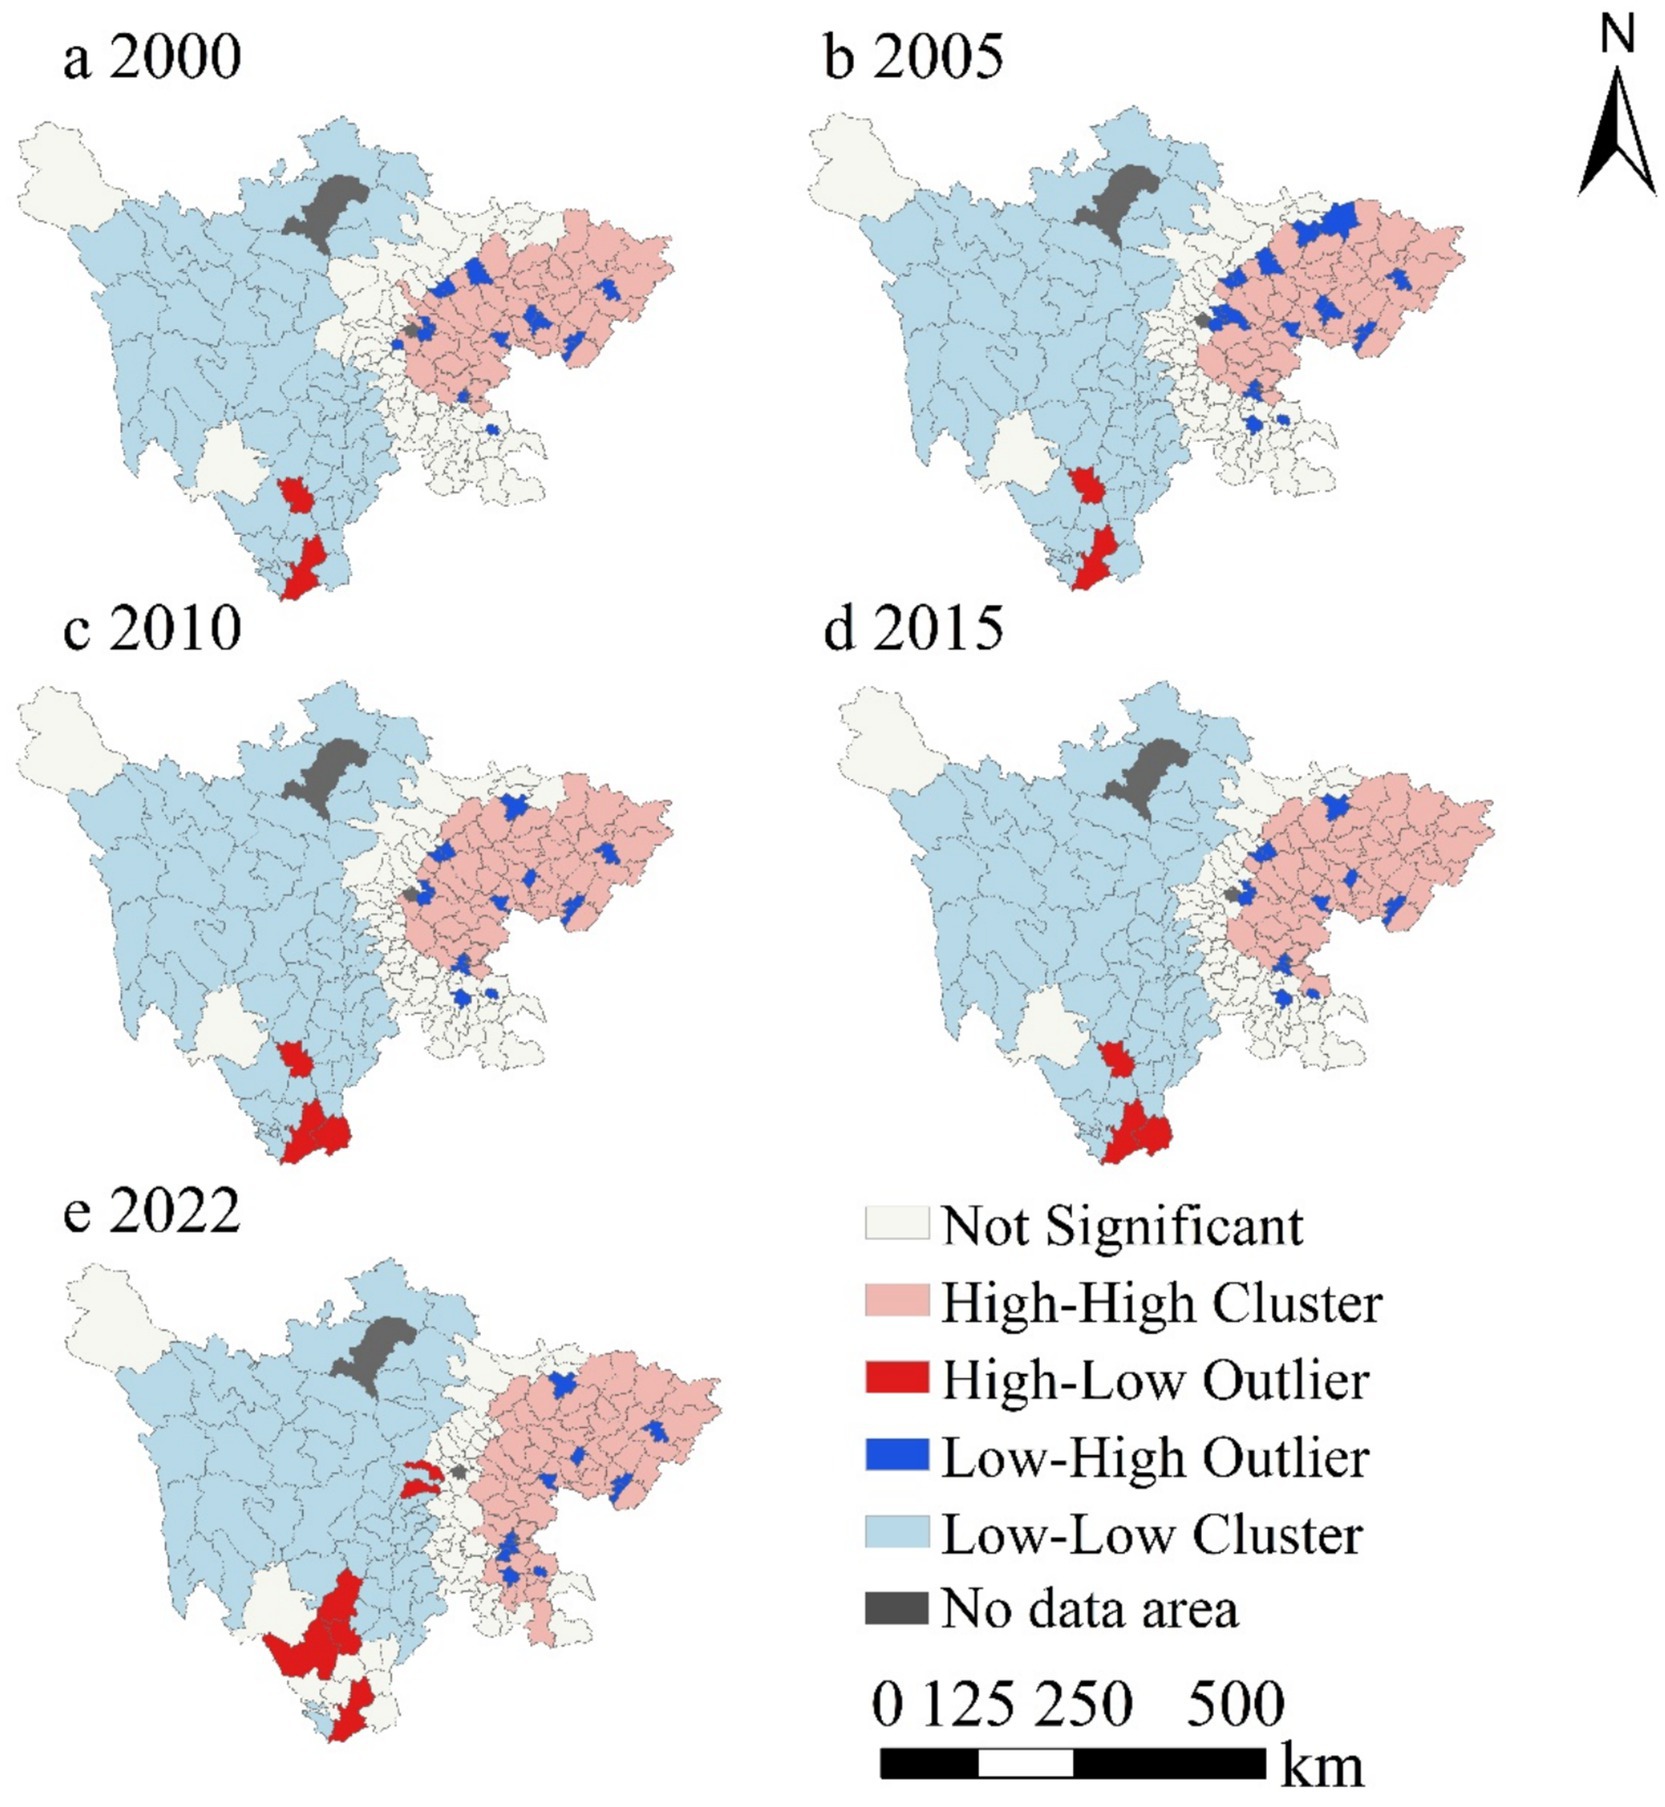
Figure 6. LISA clustering of grain production in Sichuan Province, 2000–2022. Data: Sichuan Provincial Statistical Yearbook.
High-value clustering areas are mainly concentrated in the NSEZ and the CPEZ, and expanded into the SSEZ in 2022; Low-value clustering areas are primarily distributed in the NSEDA and the PER, with a decreasing trend in 2022; High-low dispersed areas are mainly located in the PER, showing a year-on-year growth trend; Low-high dispersed areas are sporadically distributed around the high-high clustering zones; As for the non-significant areas, these regions exhibit no significant spatial autocorrelation with surrounding areas. From 2000 to 2015, the distribution of non-significant areas remained largely stable, but decreased in 2022.
4.4 Analysis of the results of the impact factors
4.4.1 Geodetector
Grain production is influenced by various factors, and exploring the impact and intensity of different factors on the regional differences in grain yield has long been a focus of many scholars. The results of the single-factor analysis indicate the degree of influence of nine factors on grain production in that particular year.
As shown in Figure 7, at the county level, with the exception of per capita GDP, the intensity of the influence of various factors on the spatial differentiation of grain production remained relatively stable across different periods, without exhibiting significant fluctuations. Actual cultivated land area and the amount of fertilizer applied consistently maintained high positive values in all years, serving as the dominant factors influencing the spatial differentiation of grain production in Sichuan Province. Among these, the effect of actual cultivated land area is the most prominent. Although the q-value shows a declining trend, it still ranks first among all factors, as the area of arable land directly affects the scale and level of grain production.
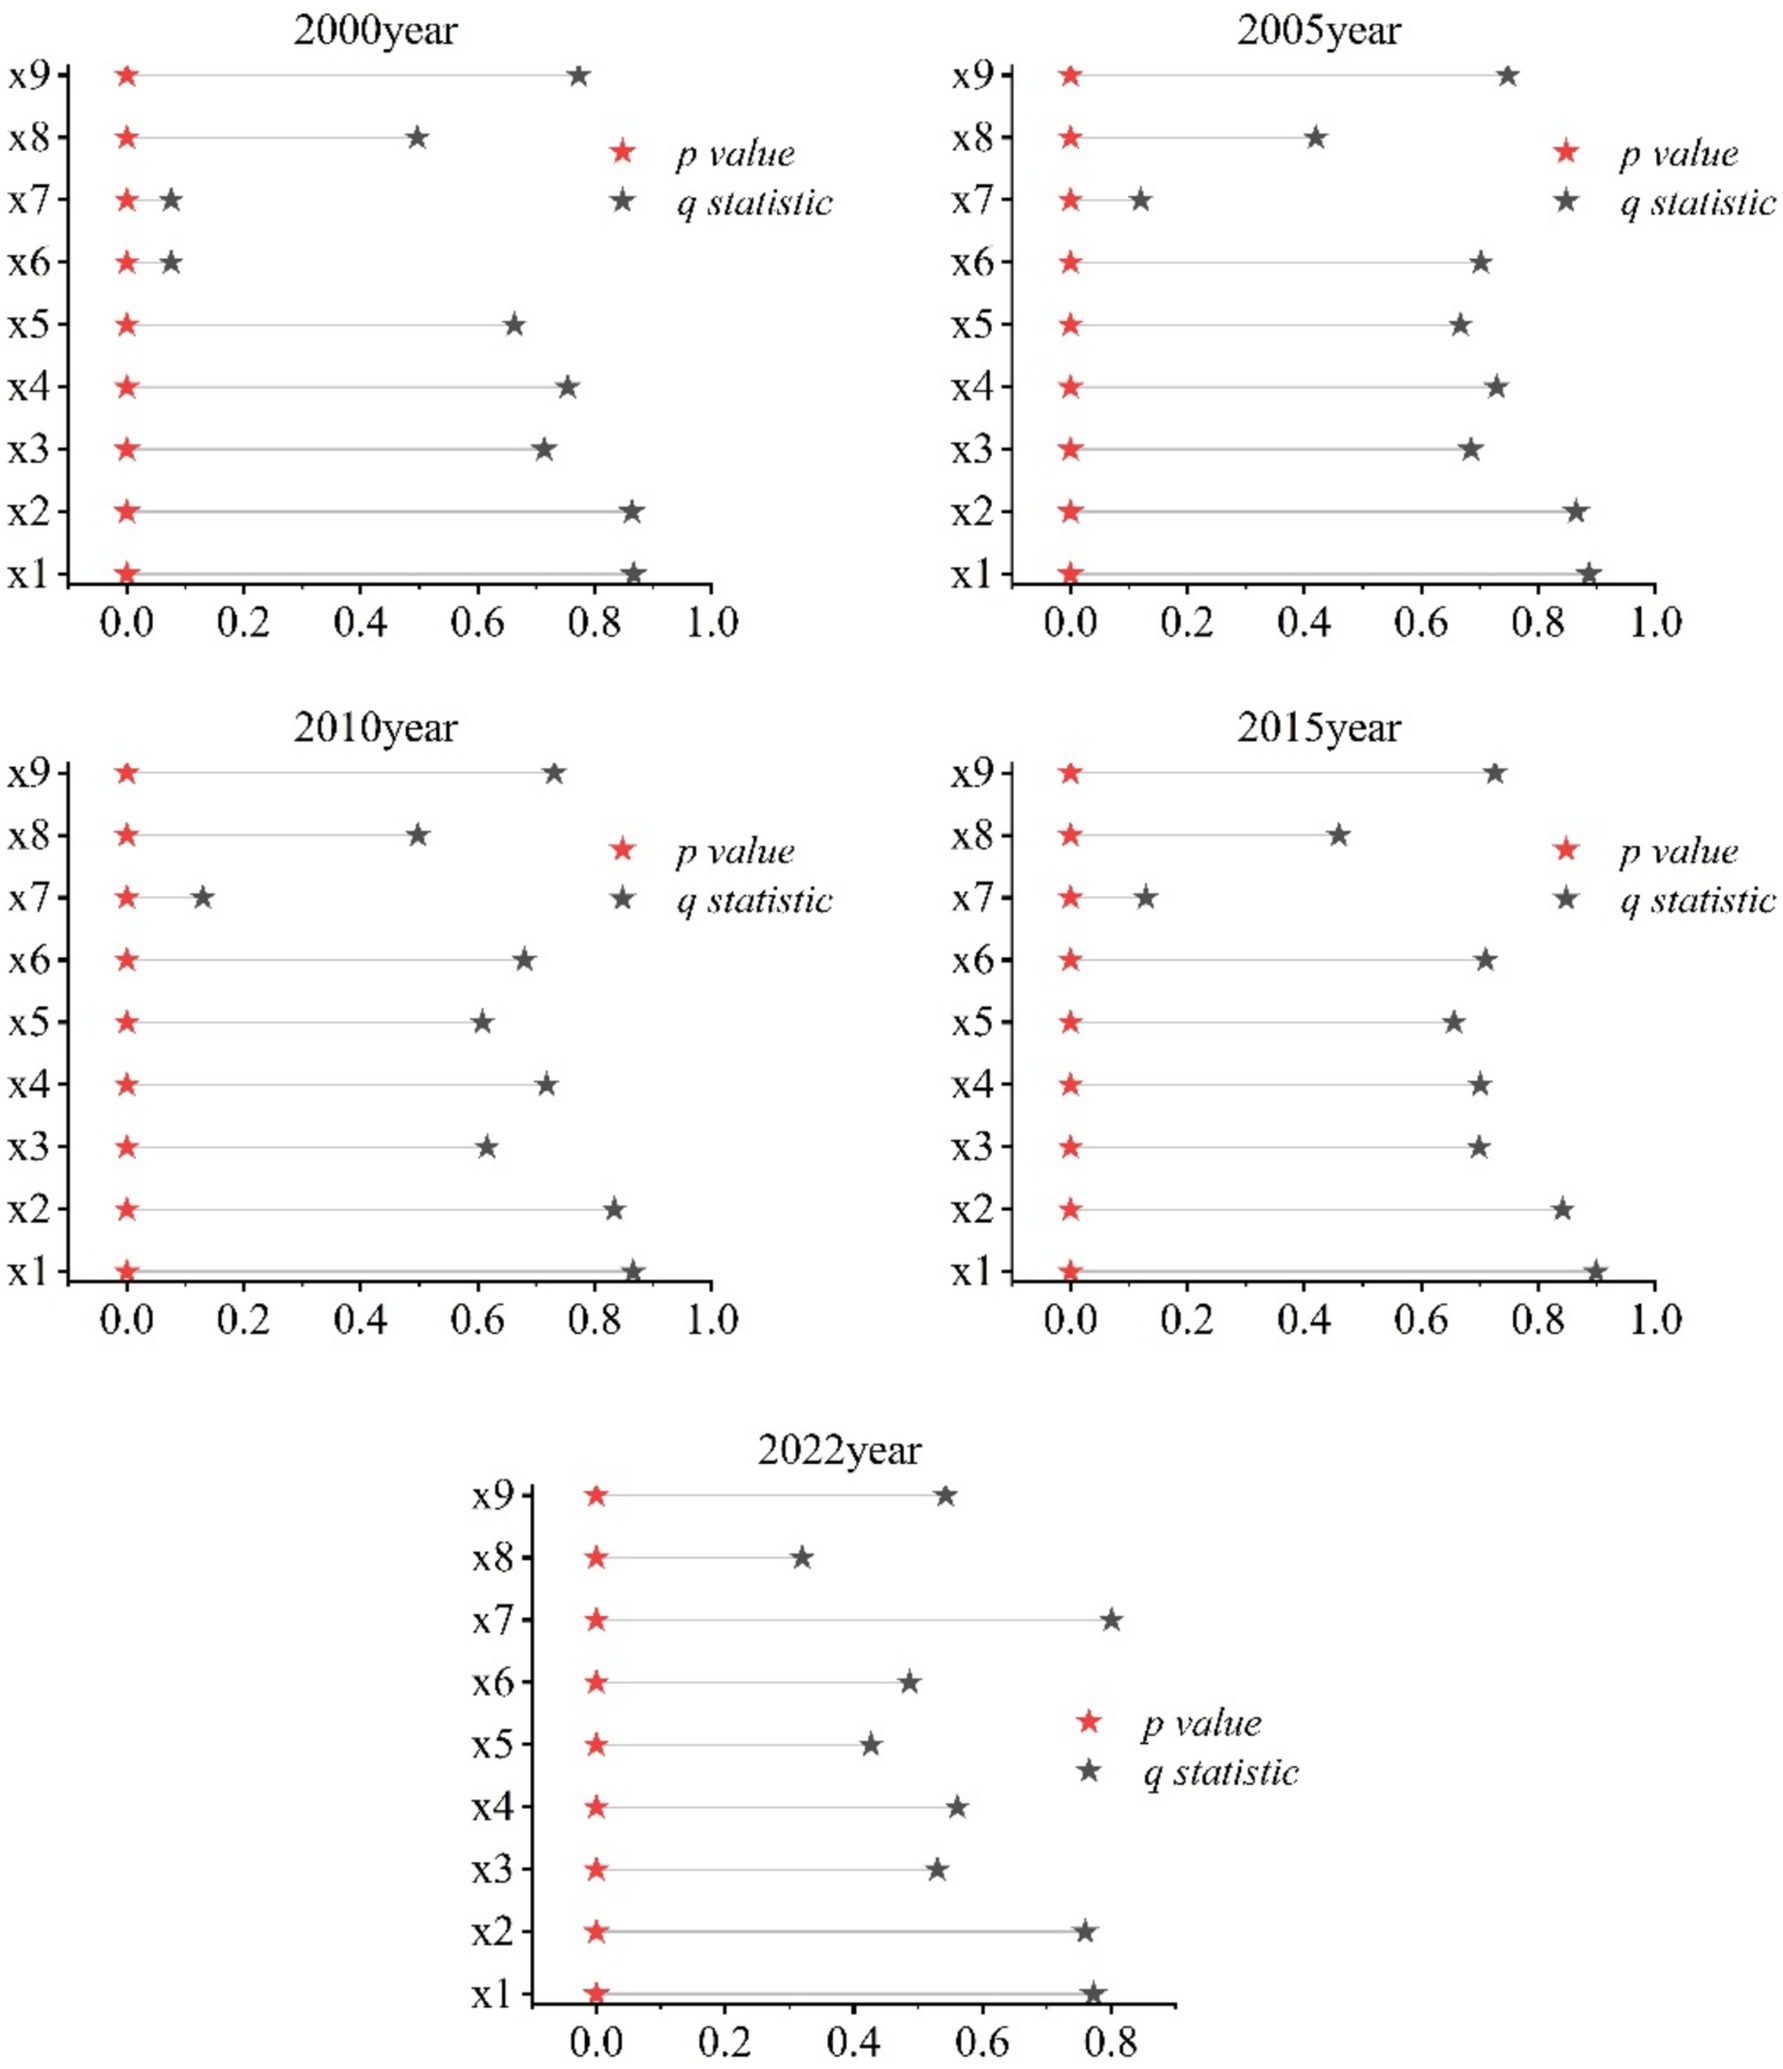
Figure 7. Single-factor probes of grain production in Sichuan Province, 2000–2022. Data: Calculated using the Geodetector Model.
The positive impact on grain production was most significant in 2005. With increased agricultural investment, improved labor quality, and enhanced agricultural disaster resilience (Zhang Y. et al., 2023; Wijerathna-Yapa and Pathirana, 2022), the impact of per capita GDP on grain production in 2022 showed a significant increase compared to other years. Changes in other influencing factors remained relatively stable.
The above content analyzed the impact of individual factors on grain production in Sichuan Province, but in practice, complex interactions among multiple factors jointly influence the spatial distribution pattern of grain production. To investigate the contribution of interactions among various factors to grain production in Sichuan Province, this study conducted interaction detection on the driving factors from 2000 to 2022, with the results shown in Figure 8. These interaction results can be categorized into two main types: dual-factor enhancement effects and nonlinear enhancement effects, revealing the significant efficacy of interaction analysis in explaining grain production, far exceeding that of single-factor analysis. This indicates that grain production in the study area is influenced by the combined effects of multiple factors, rather than the simple addition or independent effects of individual factors.
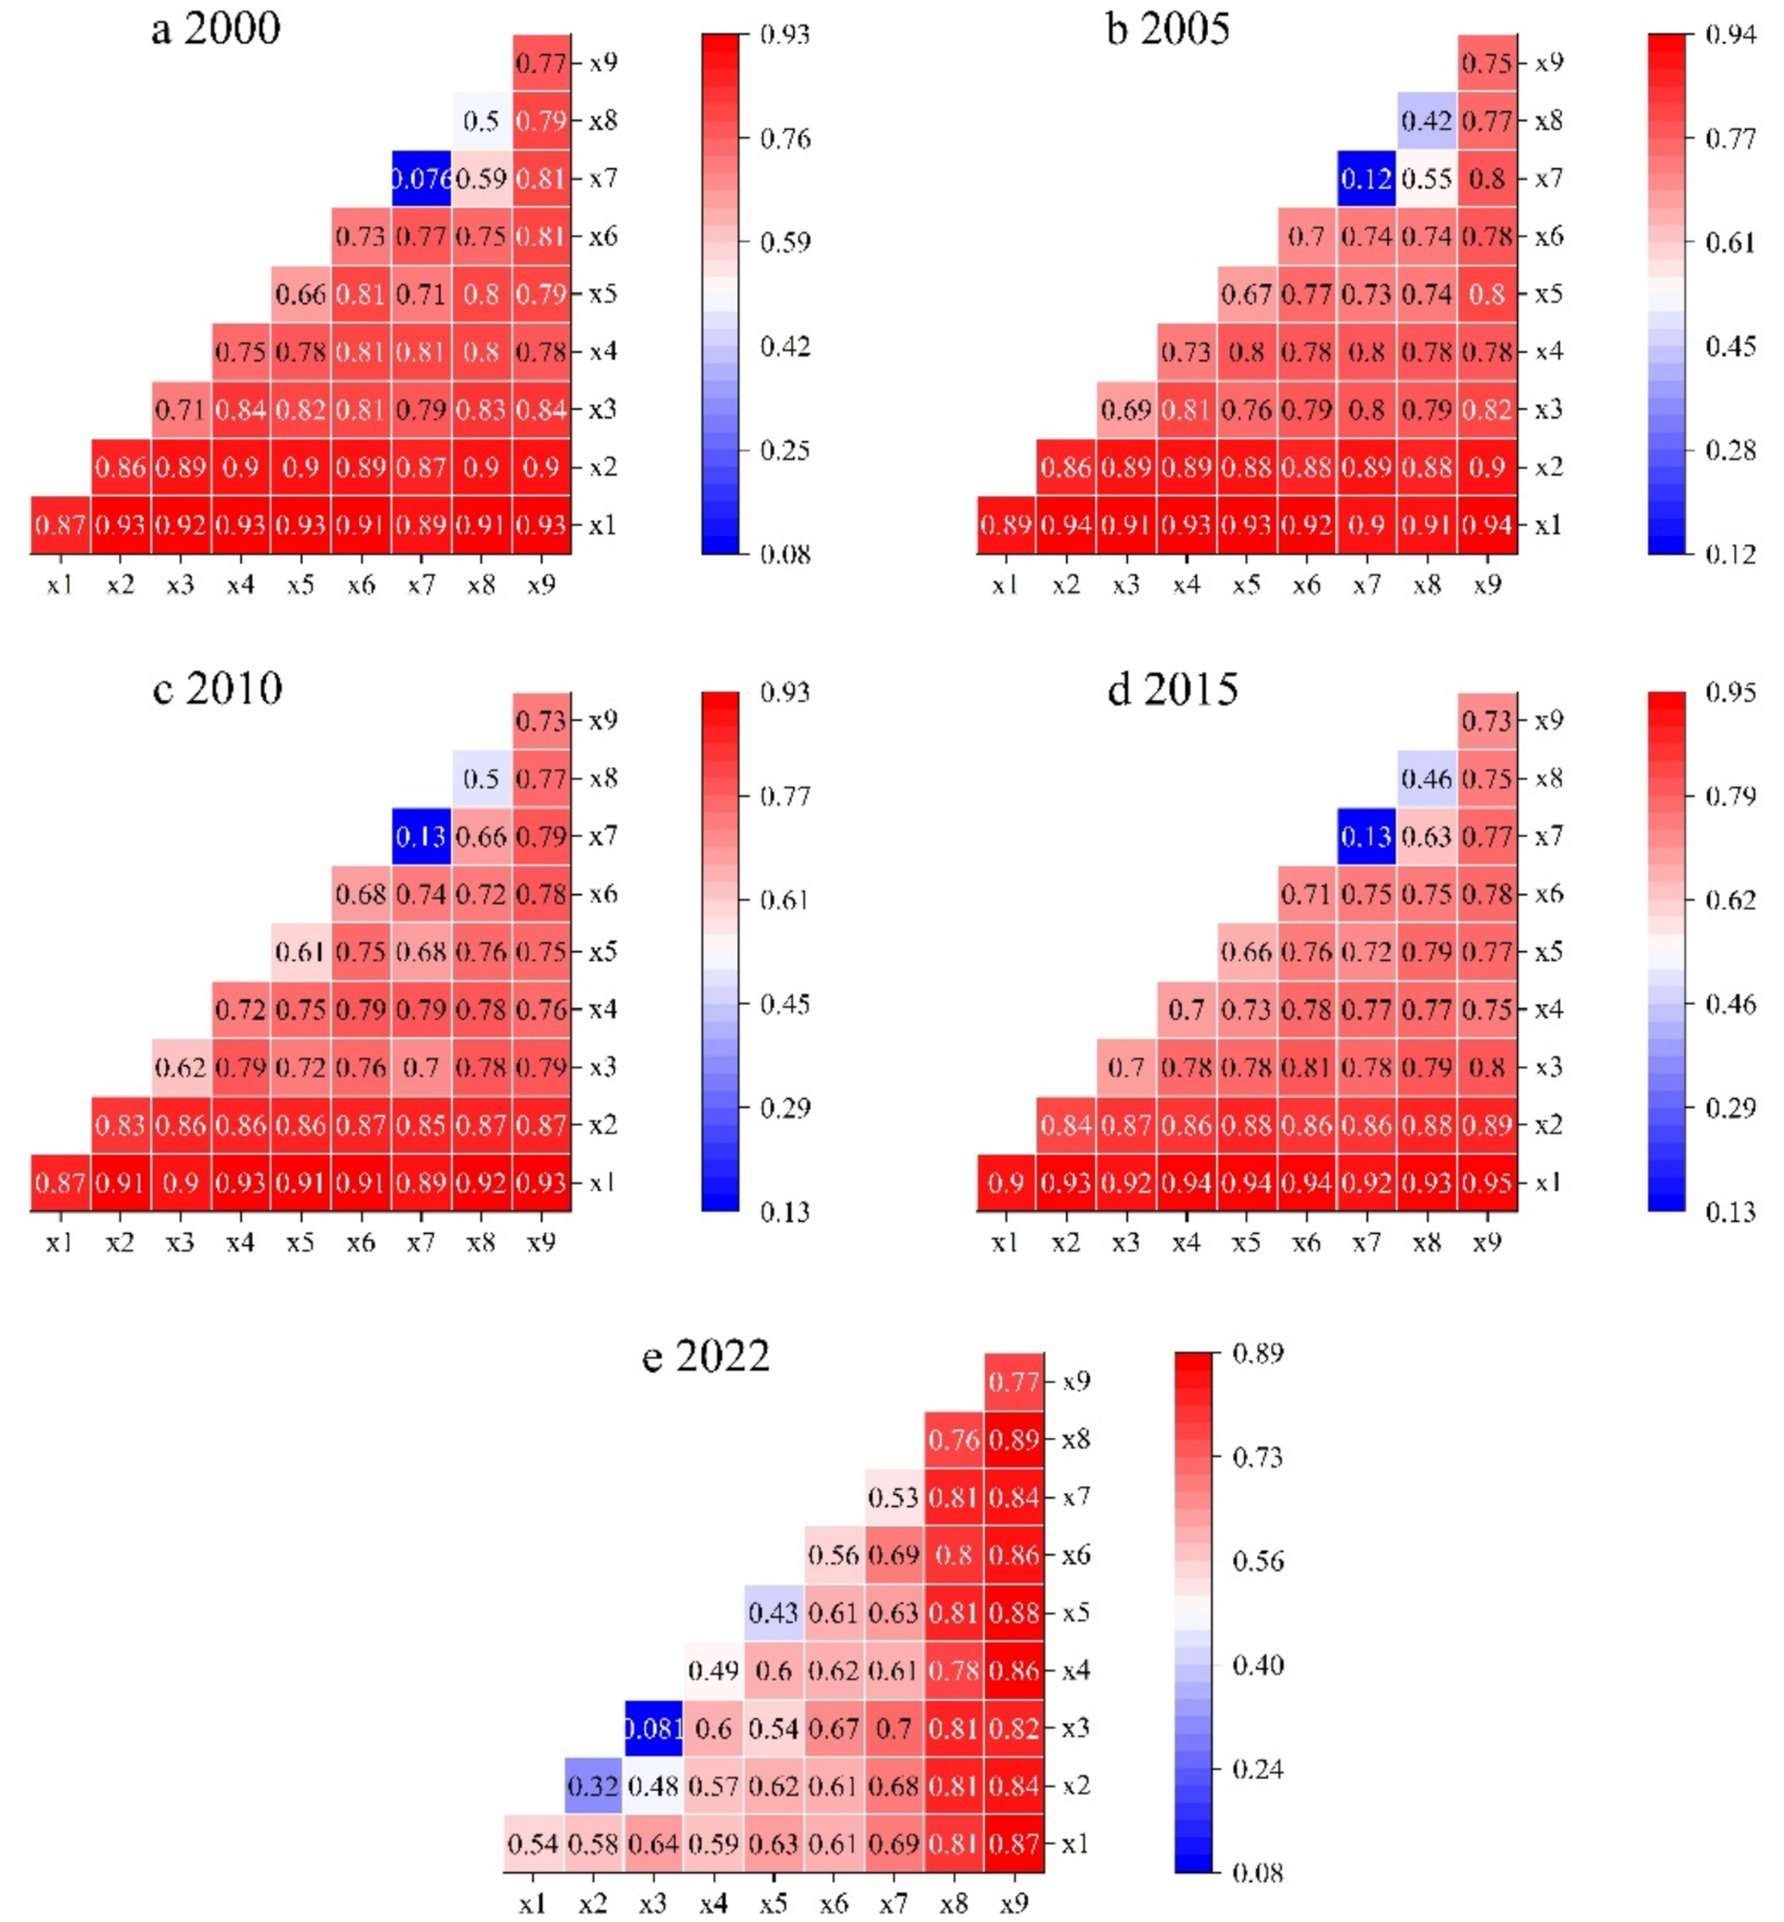
Figure 8. Interactions of grain production drivers in Sichuan Province (2000–2022). Data: Calculated using the Geodetector Model.
Specifically, in 2000, the highest interaction value among influencing factors was 0.93 (X1∩X2, X1∩X4, X1∩X5, X1∩X9), and the lowest was 0.59 (X7∩X8). Interaction factor values related to the actual cultivated land area (X1) were consistently high. In 2005, the highest interaction value among influencing factors was 0.94 (X1∩X2, X1∩X9), and the lowest was 0.55 (X7∩X8). In 2010, the highest interaction value among influencing factors was 0.93 (X1∩X4, X1∩X9). In 2015, the interaction between actual cultivated land area (X1) and elevation (X9) had a particularly significant impact on grain production, with a q-value as high as 0.95, while the lowest value was 0.63 (X7∩X8). In 2022, interaction values among influencing factors generally declined but remained significant. Throughout all years, the interaction between actual cultivated land area and other factors consistently demonstrated significance, indicating strong explanatory power for grain production in Sichuan Province. To enhance grain production in Sichuan Province, it is essential to pay attention to the uniqueness of these interaction factors. For interaction factors that promote grain production, efforts should focus on further enhancing their positive effects. For interaction factors that inhibit grain production, prudent measures should be taken to mitigate their negative impacts.
4.4.2 Geographically weighted regression
Based on the aforementioned analysis, grain production in Sichuan Province exhibits significant positive spatial autocorrelation. Although the Geodetector model excels in assessing the impacts of variables at the macro level, it shows limitations in analyzing local spatial heterogeneity and spatial weighting. In contrast, the GWR model, with its in-depth analysis of spatial non-stationarity and effective integration of spatial weights, demonstrates significant advantages in uncovering local spatial relationships and spatial correlations. Therefore, this study introduces the GWR model to perform more refined local spatial regression analysis, aiming to reveal the spatial direction and intensity differences of nine influencing factors. After standardizing all variables, the GWR regression analysis was conducted to construct the GWR model. Detailed results of the model parameters are presented in Table 4. The adjusted R2 values of the model all exceed 0.7, indicating a high goodness of fit.
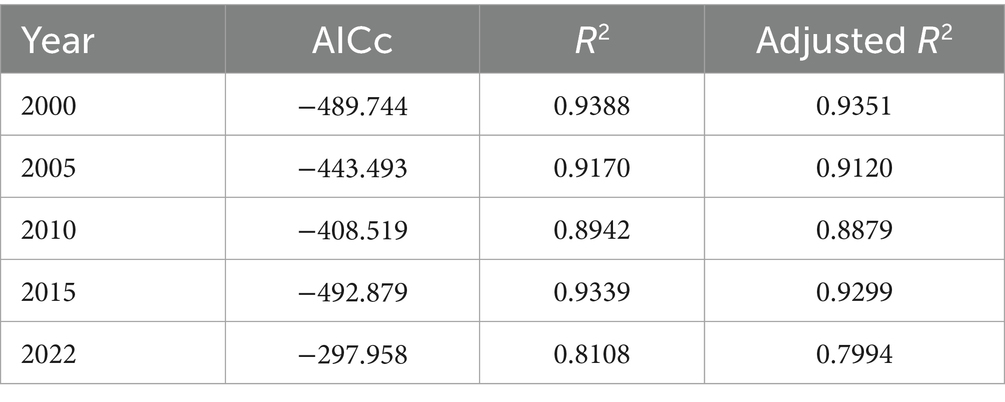
Table 4. Results of model parameters.
Cultivated land resources, as a key indicator of agricultural production conditions, have a significant direct impact on grain production. As can be seen from Figure 9, the cultivated land area exhibits a decreasing trend from east to west. Specifically, from 2000 to 2005, there was an overall upward trend, particularly in the CPEZ, indicating an increasing reliance of grain production in Sichuan Province on cultivated land resources. However, after 2010, the regression coefficients generally declined across the province, and the impact of cultivated land area on grain production weakened, with negative correlations emerging in certain areas.

Figure 9. Spatial heterogeneity of key drivers: GWR coefficients for ACLA, CFAR, and REC. Data: Calculated using the GWR model.
Grain production in Sichuan Province is significantly influenced by fertilizer application, with this impact exhibiting notable heterogeneity across different regions and time periods. The regression coefficients of fertilizer application generally show a decreasing trend from west to east. As shown in the regression analysis results in Figure 9, the impact of fertilizer application on grain production has gradually intensified over time. In 2000, a significant positive correlation was observed between fertilizer application and grain production in the NSEDA. From 2005 to 2015, the positive effects of fertilizer application were generally enhanced across the province, with particularly notable impacts in the central and southern regions. In 2022, the positive impact of fertilizer application in the PER and the NSEDA was further amplified across the province.
The impact of rural electricity consumption on grain production varies significantly across different regions in Sichuan Province. As can be seen in Figure 9, in 2000, rural electricity consumption in the NSEZ exhibited a significant positive relationship with grain production, whereas the positive impact of rural electricity consumption on grain production in the NSEDA was less pronounced. From 2005 to 2010, the positive impact of rural electricity consumption on grain production increased across the province. However, the negative regression coefficients in the western regions persisted. From 2015 to 2022, the positive impact of rural electricity consumption on grain production significantly intensified in the NSEDA and the SSEZ.
The impact of temperature on grain production varies significantly across different regions in Sichuan Province. As can be seen from Figure 10, in 2000, temperature had a greater impact on grain production in the CPEZ, the NSEZ, and the SSEZ. In contrast, the impact of temperature in the NSEDA was relatively minor. In 2005, the positive impact of temperature on grain production increased across the province, particularly in the central region. In 2010, the impact of temperature on grain production was generally low across the province, with negative values observed in some regions. From 2015 to 2022, the positive impact of temperature on grain production increased across the province, especially in the western regions and the SSEZ.
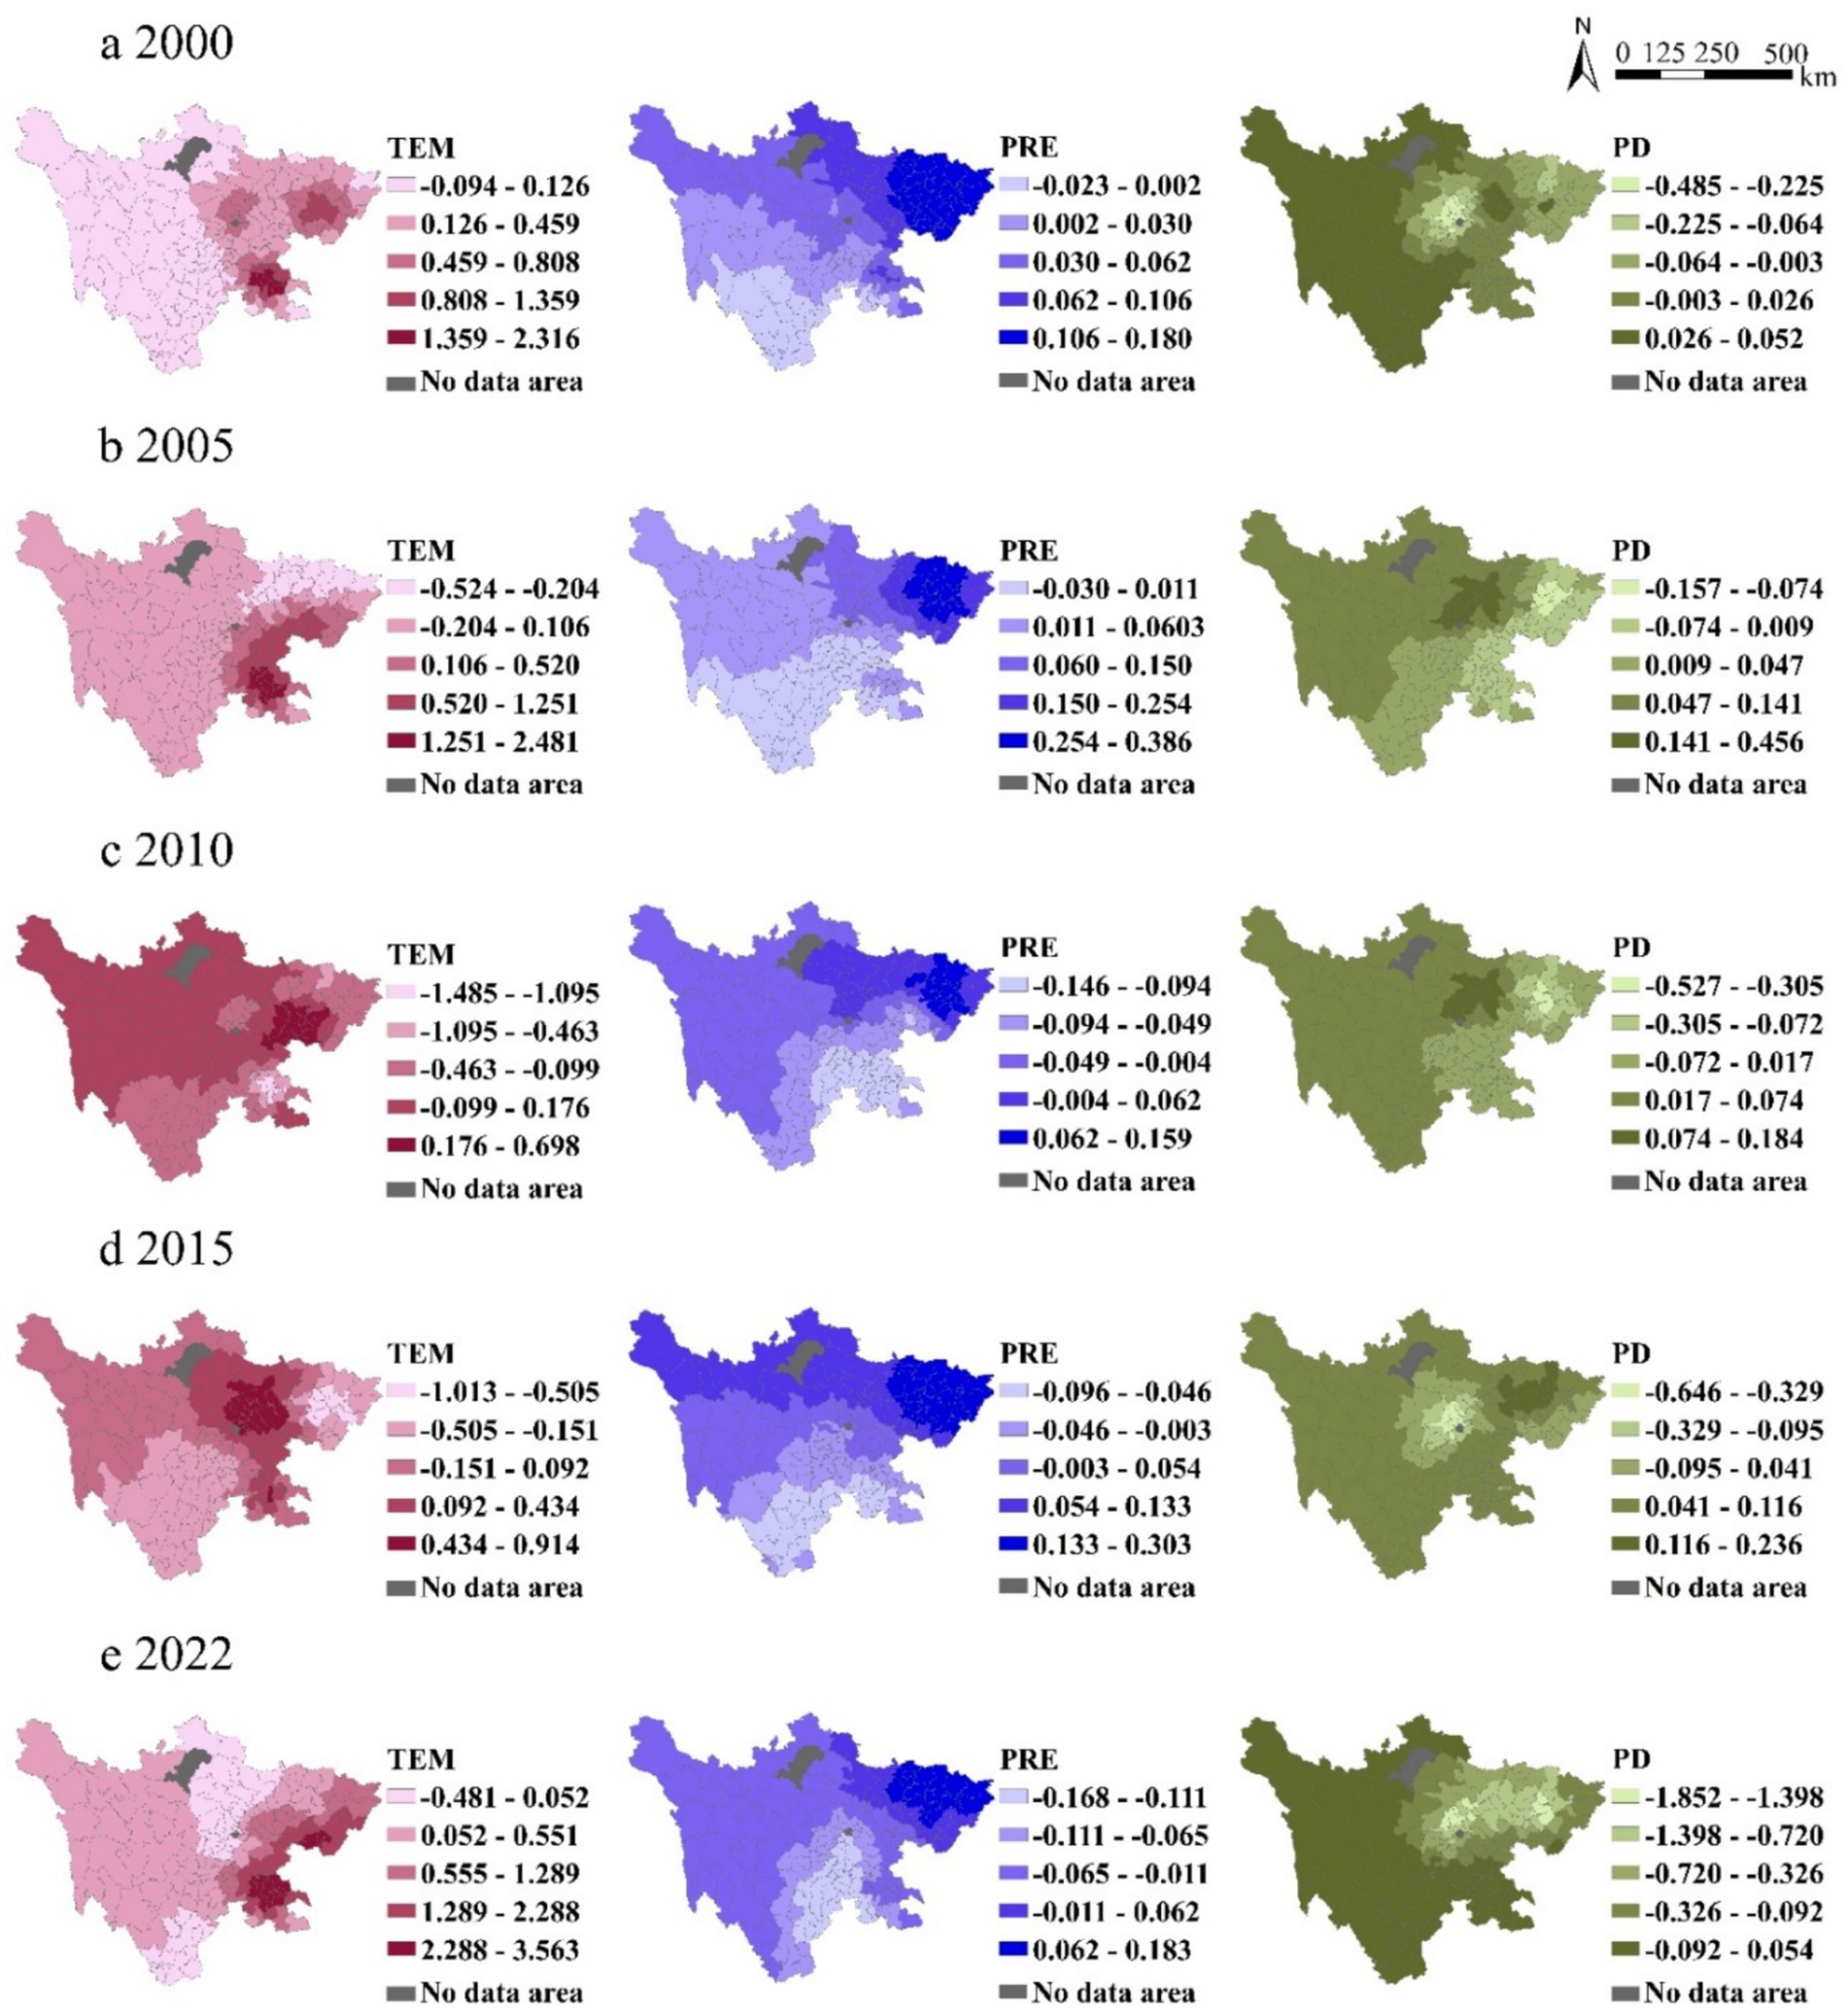
Figure 10. Spatial heterogeneity of key drivers: GWR coefficients for TEM, PRE, and PD. Data: Calculated using the GWR model.
Water resources are a crucial factor in agricultural development, with higher annual precipitation improving regional irrigation conditions. As shown in Figure 10, the spatial distribution of rainfall’s impact on grain production shows a decreasing trend from east to west. The NSEZ and the CPEZ have a greater impact on grain production, primarily exhibiting positive effects. In contrast, the central and western regions have relatively smaller impacts. From 2000 to 2005, the positive impact of annual precipitation on grain production increased, particularly in the NSEZ. In 2010, the impact of precipitation on grain production in Sichuan Province was generally low across the province. Especially in the central and western regions, the uneven distribution of precipitation resulted in a relatively minor impact of temperature. From 2015 to 2022, the range of areas with high positive values first expanded and then contracted.
As shown in Figure 10, population density from 2000 to 2022 exhibits significant heterogeneity across different regions and time periods. The regression coefficients display a decreasing trend from west to east. In 2000, the increase of population density in Northwest Sichuan and Pannan regions of Sichuan Province provided abundant labor resources for agricultural production, and population density had a positive effect on grain production. From 2010 to 2022, the positive impact of population density on grain production weakened across the province. However, in the Chengdu Plain region, the massive influx of population increased the pressure on cultivated land, resulting in a negative correlation between population density and grain production.
As shown in Figure 11, from 2000 to 2022, the regression coefficients of per capita GDP generally showed a decreasing trend from west to east. The proportion of positive values exhibited a trend of first decreasing and then increasing. Despite fluctuations, the regression coefficients of per capita GDP remained generally low overall. The direct impact of GDP per capita on grain production is relatively small.
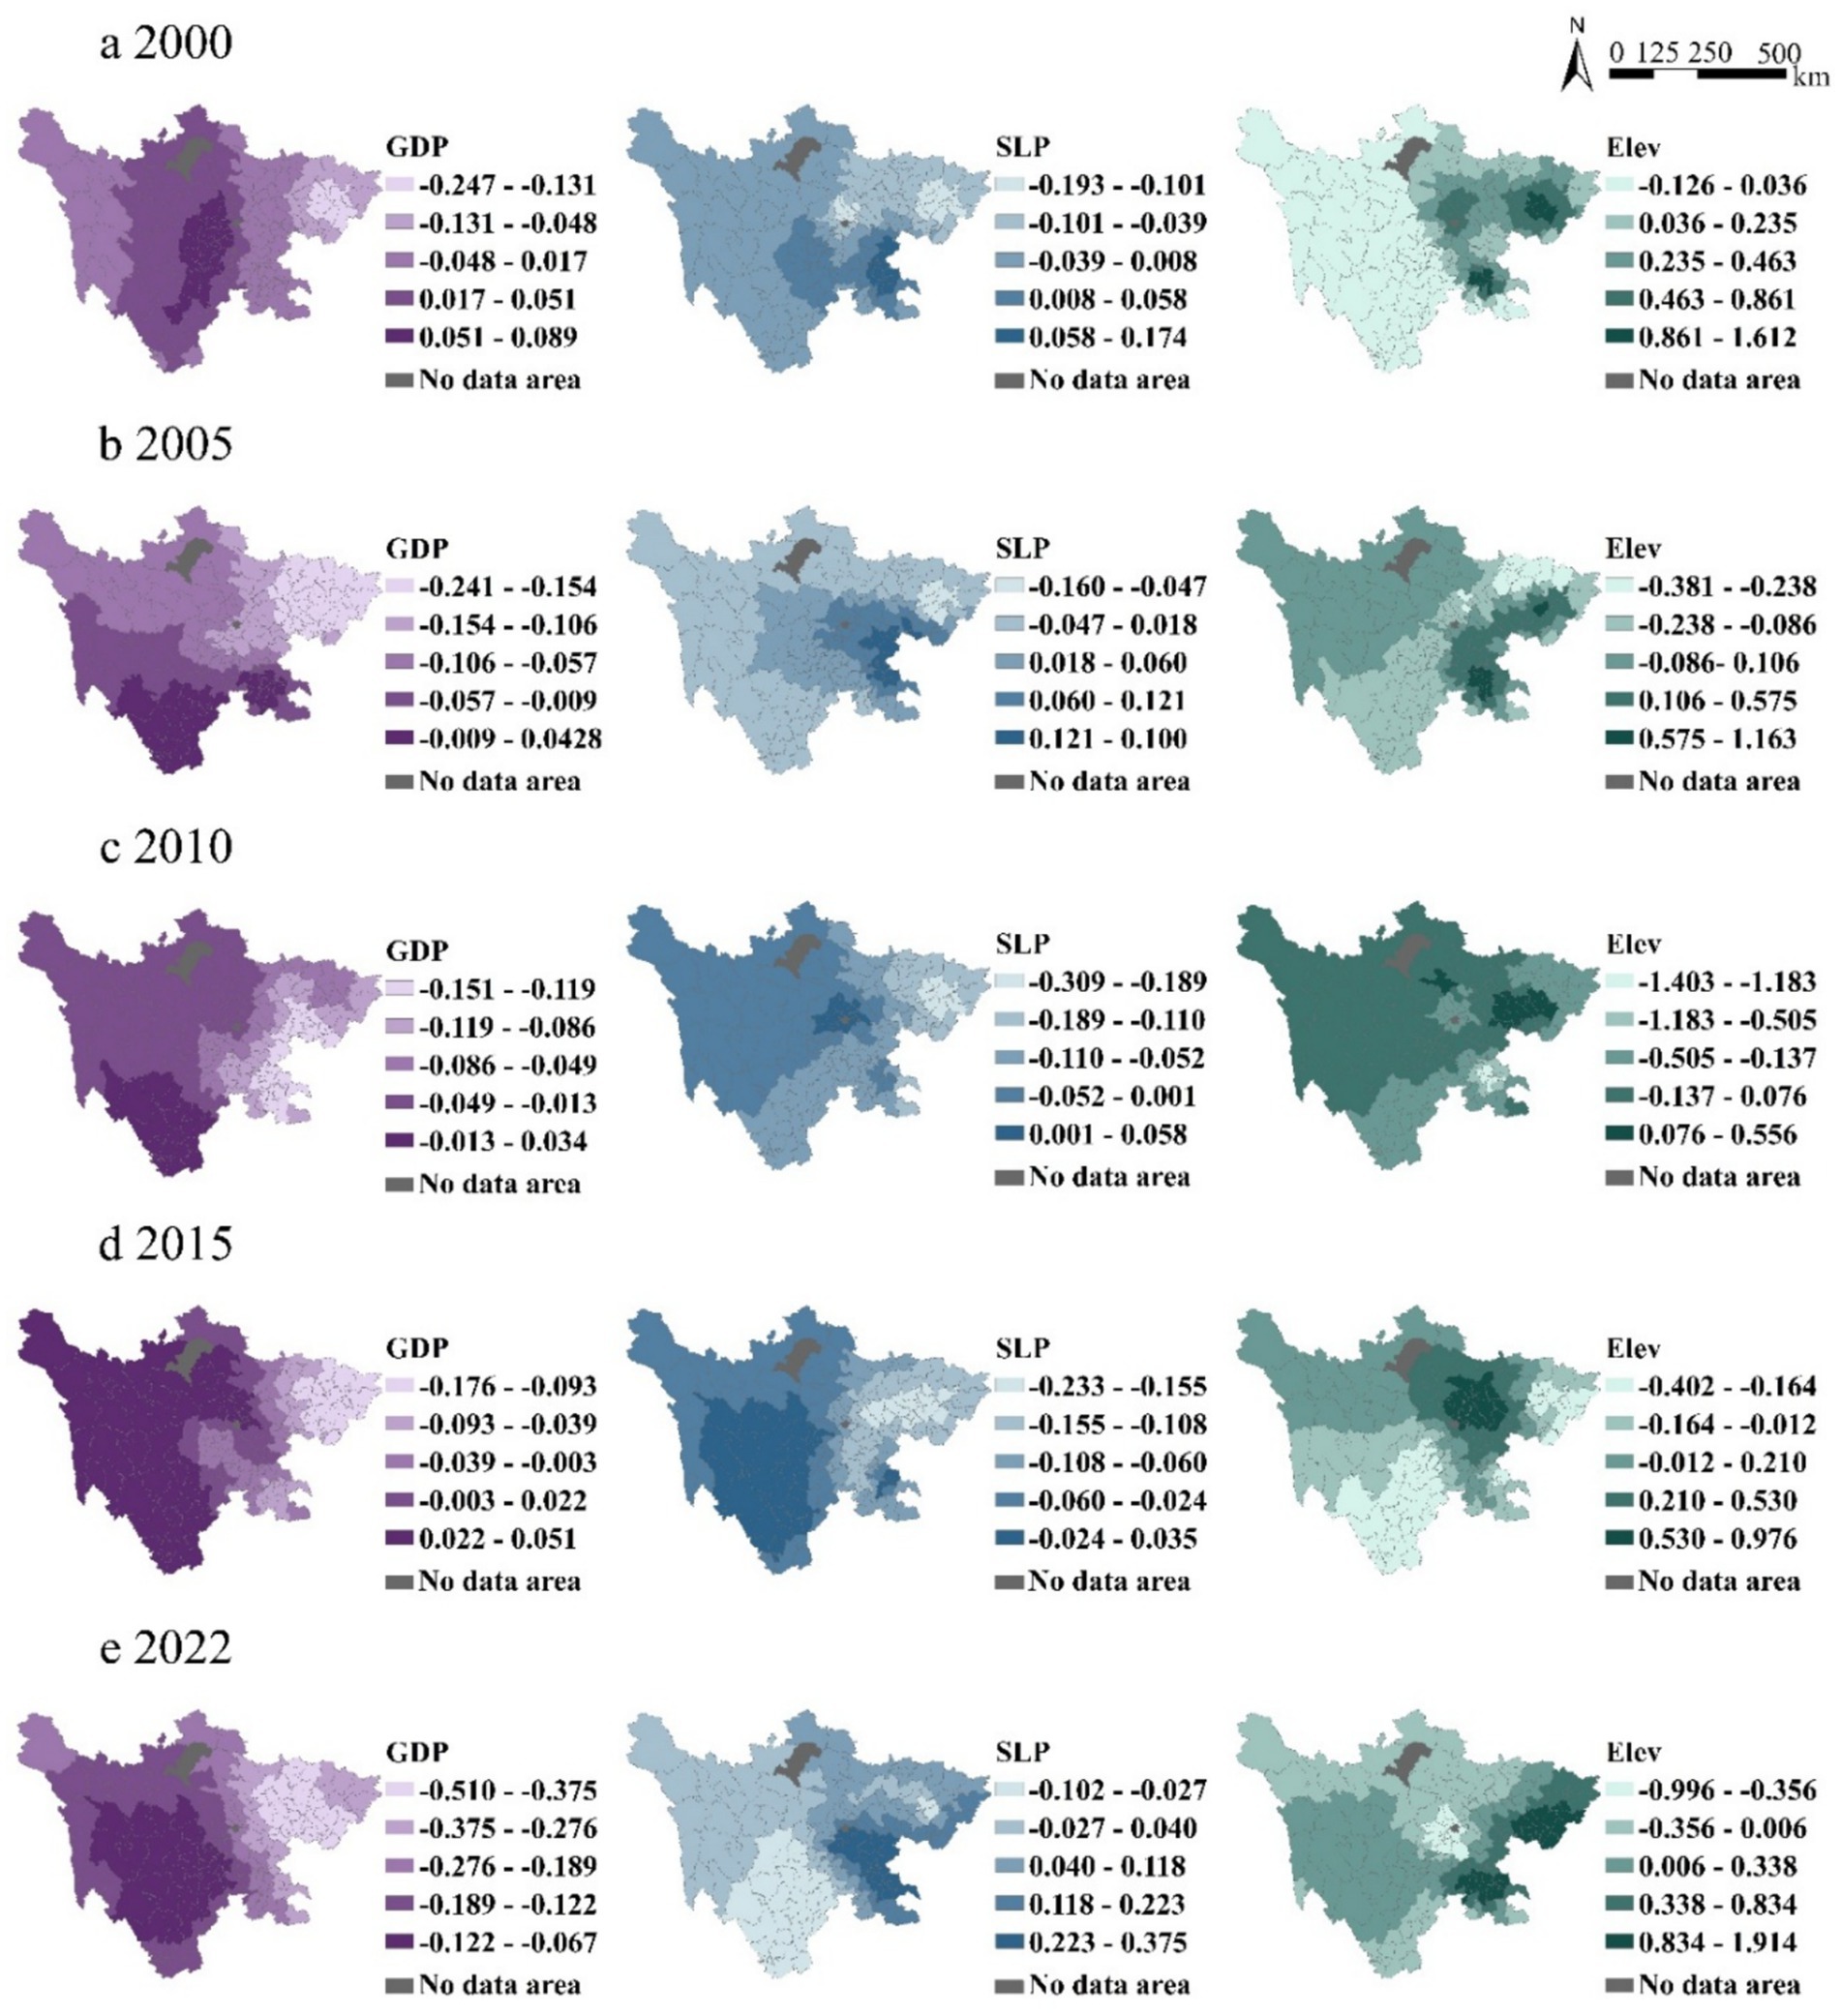
Figure 11. Spatial heterogeneity of key drivers: GWR coefficients for GDP, SLP, and Elev. Data: Calculated using the GWR model.
As shown in Figure 11, the central region has a significant impact on grain production due to its suitable slope. In contrast, the western and eastern regions are less affected due to steeper slopes. The regression coefficients in the central region are generally high, indicating a significant positive impact of slope on grain production. However, the regression coefficients in the western region are generally low and even show negative values, suggesting that the impact of slope on grain production is relatively minor or negatively correlated.
As shown in Figure 11, from 2000 to 2022, the positive impact in the central and eastern regions showed a trend of gradual expansion or increased intensity. The areas with high positive elevation values were primarily concentrated in the central and eastern regions, characterized by lower elevations and relatively gentle terrain, which provides favorable conditions for land cultivation and agricultural production. In contrast, the regression coefficients in the western region exhibited negative correlations or insignificant relationships. This region generally has higher elevations, which may result in harsher climatic conditions, such as lower temperatures, shorter growing seasons, and potential arid or semi-arid climates, all of which are unfavorable for agricultural production.
5 Discussion
5.1 Evolution of spatial and temporal patterns of grain production in Sichuan Province
(1) From a temporal perspective, grain production in Sichuan Province experienced a slight decline in the early 2000s, followed by a fluctuating upward trend beginning in 2004. Overall, the province maintained a slow yet steady growth in grain output, with production levels remaining relatively stable. Although fluctuations were observed, their amplitude was limited, with the maximum annual increase reaching 5.42% (between 2006 and 2008) and the maximum decline recorded at −7.79% (between 2000 and 2002), indicating a relatively high degree of output stability—a pattern comparable to that observed in traditional grain-producing provinces such as Henan and Shandong (Wu and Li, 2024; He H. et al., 2022). The reasons for this fluctuating growth lie in the significant emphasis placed on grain production by the national and Sichuan provincial governments, which have introduced a series of supportive policies, such as the minimum grain purchase price policy and subsidies for grain farmers (Qian et al., 2020), thereby boosting farmers’ production enthusiasm and promoting the growth of grain production.
(2) Grain production among counties shows significant variability. The total grain production in Sichuan Province exhibits a trend of increasing from west to east, a pattern consistent with the overall distribution of grain production in China (Li et al., 2022), a phenomenon common to most provinces in China, as supported by numerous previous studies (Xin et al., 2020). Surprisingly, the area of high grain production in Sichuan Province is not located in the flat and expansive CPEZ, but is concentrated in the SSEZ and NSEZ, differing from the findings of previous studies (Chang et al., 2024). The possible reason for this is that, although the Chengdu Plain has a large expanse of arable land, in recent years, with the accelerated pace of urbanization and the advanced progress of industrialization, part of the arable land has been converted into construction land, leading to the loss of arable land resources (Pan et al., 2021), which in turn affects the area under food crops, causing grain production in the Chengdu Plain to exhibit a declining trend, posing a challenge to regional food security and the sustainable development of agriculture. The spatial and temporal distribution characteristics of grain production in Sichuan Province reveal distinct regional differences, suggesting that in future strategic agricultural planning, greater emphasis should be placed on the principle of adapting to local conditions, and on formulating targeted policies and measures based on the unique conditions of each region, with the aim of optimizing the distribution of agricultural production in alignment with regional characteristics, and promoting the sustainable development of grain production.
5.2 Analysis of factors affecting grain production in Sichuan Province
(1) Agricultural factor inputs are critical to ensuring grain production. According to the results of Geodetector and GWR, actual cultivated land area, the amount of fertilizer applied, and electricity usage in rural areas significantly impact grain production, consistent with findings from previous studies (Liu et al., 2014; Zhang, 2024; Zhe et al., 2023). Therefore, implementing active and effective measures to protect and utilize arable land resources rationally is a key cornerstone for ensuring the stability and sustainability of grain production. Moreover, inputs such as fertilizers and electricity supply are equally crucial. Fertilizer, as a critical input for agricultural production, directly influences crop growth and yield. The scientific and rational application of fertilizers can effectively enhance soil fertility, meet nutrient demands during crop growth and development, and thereby achieve a steady increase in grain production (Li et al., 2023). Similarly, an adequate and stable electricity supply can support the efficient operation of agricultural machinery, irrigation systems, and agricultural product processing (Jadhav et al., 2022).
(2) Geography provides the fundamental conditions for the growth of food crops. Mean annual air temperature, annual precipitation, and slope significantly affect grain production, consistent with findings from existing studies (Ha et al., 2021; Pickson et al., 2020; Tan et al., 2021). In this study, air temperature played a crucial role in grain production in Sichuan Province, particularly in the plateau region of northwest Sichuan, where temperature changes significantly impacted the crop growth cycle, photosynthesis, and water evaporation. Moderate and well-distributed annual precipitation enhances grain production, whereas extreme weather can adversely impact grain production (Lesk et al., 2022; Gandía et al., 2021). Slope influences soil water accumulation and drainage; steeper slopes lead to soil erosion, while gentler slopes promote water retention and fertilizer accumulation (Wang et al., 2023). Additionally, elevation has received less attention in previous studies. However, the complex topography and geomorphology of Sichuan Province make elevation a critical factor, especially in mountainous and hilly areas, as it limits the crop growth cycle and heightens the risk of frost damage at high altitudes by influencing air temperature and precipitation (Lou et al., 2023). The plateau region of northwest Sichuan experiences low temperatures, short frost-free periods, and a dry climate, which constrain crop growth cycles and photosynthetic efficiency. Additionally, higher evapotranspiration exacerbates soil moisture loss, negatively affecting crop growth. Furthermore, the region’s steep slopes and dramatic terrain variations hinder soil moisture and fertilizer retention, adversely affecting crop growth and yields. These factors result in relatively low grain production in northwest Sichuan and heightened sensitivity to changes in natural conditions such as temperature, precipitation, slope, and elevation.
(3) Socioeconomic factors are an important driving force. The impact of per capita GDP on grain production in Sichuan Province is minor compared to other influencing factors, whereas the effect of population density on grain production is more pronounced, consistent with findings from previous studies (Alemu et al., 2024). Comprehensive regional economic development and the expansion of secondary and tertiary industries may reduce the quantity and quality of arable land, cause environmental pollution, and negatively impact the efficiency of arable land utilization, ultimately reducing grain production. An increase in population density provides abundant labor resources for agricultural production. However, in the Chengdu Plain region, the large influx of people, particularly non-agricultural populations, coupled with accelerated urbanization and industrialization, directly strains arable land resources (Hu Y.N. et al., 2024) and affects grain production. Therefore, managing population flows reasonably is key to balancing the relationship between population growth and grain production.
(4) By combining the Geodetector and GWR methods, we can reveal the spatial heterogeneity characteristics of influencing factors in greater depth. Previous studies primarily relied on Geodetectors (Swain et al., 2024), which can analyze the magnitude of explanatory power among influencing factors at the macro level but struggle to accurately depict differences in these factors across spatial locations. The present study advances this approach, retaining macro-level insights while delving deeper into the micro level to carefully depict the spatial trends of influencing factors. Similarly, previous studies using GWR (Zhou et al., 2020) alone could capture spatial differences in factors but struggled to comprehensively assess their interactive explanatory power. In this study, factors such as temperature, precipitation, and elevation, which were not the most prominent when analyzed independently, exhibited peak effects when interacting with cropland area. Therefore, the combination of Geodetector and GWR leverages the strengths of both methods, detecting the explanatory power of influencing factors while revealing their local spatial relationships. In policy formulation, this combined method can provide a scientific basis for policies on agriculture, soil and water conservation, and adjustments to planting structures.
(5) The temporal dynamics captured by the GWR model reveal that the effects of key driving factors on grain production exhibit distinct phase-dependent variations over time. For example, the median positive regression coefficient for cultivated land area declined from 0.73 in 2000 to −0.40 in 2022, indicating a diminishing marginal effect on grain output. This trend aligns with the dual decline in both the quantity and quality of arable land under the pressure of urban expansion.
Conversely, the influence of fertilizer input has intensified over time. High-value zones of the regression coefficients have progressively expanded toward southern and western regions, with the upper bound increasing from 0.30 in 2000 to 0.92 in 2022, suggesting that fertilizer has become a critical compensatory input in maintaining yields in certain areas.
The impact of electricity consumption has also grown, especially after 2015. In western regions such as the Northern Sichuan Economic Development Area (NSEDA), the average regression coefficient rose from 0.003 in 2010 to 0.36 in 2022, reflecting the accelerating adoption of agricultural electrification in mid- to high-altitude zones and its growing contribution to productivity.
In contrast, the effects of climatic variables—temperature and precipitation—have shown greater volatility. Between 2000 and 2022, areas with significant positive correlations between temperature and grain production have notably expanded, particularly across the western Sichuan Plateau and southern regions, with peak coefficients rising from 0.12 to 1.29. Meanwhile, the spatial influence of precipitation appears to have shifted gradually from central to peripheral regions, underscoring the increasingly nonlinear and spatially heterogeneous response of agricultural systems to water availability.
Taken together, the temporal evolution of regression coefficients suggests a general pattern of “declining land effects, strengthening input dependence, and increasing variability of natural factors.” These quantified transitions not only reflect stage-specific differences in the mechanisms driving agricultural output, but also provide empirical guidance for the formulation of regionally tailored, phase-appropriate agricultural management strategies.
5.3 Research shortcomings and prospects
This study has the following shortcomings: (1) Data acquisition limitations: In exploring the spatio-temporal evolution characteristics of grain production and its heterogeneous driving factors in Sichuan Province, this study was constrained by data acquisition difficulties and did not adequately address the impacts of key factors, such as policies and the total power of agricultural machinery, on grain production. In future research, access to more comprehensive data could facilitate an in-depth analysis of the specific mechanisms through which these factors influence grain production. (2) Model selection and extension: This study used the GWR model to analyze the spatio-temporal heterogeneity of grain production. While the GWR model is advantageous in capturing local spatial heterogeneity, its capacity for temporal analysis is limited. Future research could consider incorporating spatio-temporal geographically weighted regression (GTWR) or multiscale geographically weighted regression (MGWR) models to better capture the temporal dynamics of grain production changes and their interactions with spatial heterogeneity. (3) This study primarily employed the Geodetector and GWR models to identify the spatial heterogeneity of driving mechanisms. While these methods offer substantial explanatory power for spatial patterns, there remains considerable room for improvement in terms of model complexity and predictive accuracy. Future research could benefit from the integration of interpretable machine learning approaches—such as Random Forest and XGBoost-SHAP—to enhance the identification of nonlinear drivers and to quantify the interactive effects among variables. Moreover, the incorporation of higher-resolution remote sensing imagery would enable the capture of finer-scale land use dynamics, thereby improving the temporal sensitivity and spatial accuracy of the analysis. In terms of data integration, efforts should be made to fuse multisource datasets, including agricultural machinery operations, satellite-based meteorological observations, and farmer input records. Such an approach would support the construction of a more comprehensive driver system and provide robust data intelligence for advancing research on food security.
6 Conclusions and policy recommendations
6.1 Conclusion
This paper examines the spatial and temporal changes in grain production using county-level grain production data from Sichuan Province (2000–2022), employing the standard deviation ellipse and center of gravity transfer methods. It also analyzes the spatial agglomeration of grain production through the spatial autocorrelation method and investigates the driving factors of grain production changes in Sichuan Province using Geodetector and GWR. The main conclusions are summarized as follows.
(1) From a time-series perspective, grain production in Sichuan Province exhibited a fluctuating upward trend within the range of 3,200 × 104 to 3,600 × 104 tons, accompanied by a gradual narrowing of inter-county disparities in output.
(2) From a spatial order perspective: analysis of the standard deviation ellipse and center of gravity shift reveals that the standard deviation ellipse of grain production in Sichuan Province exhibits a “Northeast-Southwest” distribution pattern. While the center of gravity of the ellipse has shifted significantly over different time periods, it has consistently remained concentrated in the area of Lezhi County. The overall spatial distribution of grain production in Sichuan Province remains relatively stable. According to the spatial autocorrelation analysis, there is a clear positive correlation in grain production among counties in Sichuan Province. Grain production distribution shows significant clustering, with high-high aggregation areas becoming more concentrated and increasing in number. Meanwhile, low-low aggregation areas also display a certain degree of clustering, although their numbers have decreased.
(3) From the perspective of influencing factors, the results of one-factor detection indicate that the area of actual cultivated land at the end of the year has the strongest explanatory power for grain production. The results of two-factor interaction detection reveal that the interaction between actual cultivated land area and other factors is the most significant. The geographically weighted regression results indicate that grain production in Sichuan Province is influenced by the complex interplay of multiple factors. Each variable exhibits significant spatial differentiation characteristics, and the spatial distribution pattern of their influence is diverse. Cultivated land area, fertilizer application, and rural electricity consumption all exert a significant positive effect on grain production, whereas other factors have a negative impact.
6.2 Policy recommendations
Based on a systematic analysis of the spatiotemporal dynamics of grain production and its driving factors in Sichuan Province, we propose the following four targeted policy recommendations to enhance regional food security and promote sustainable agricultural development:
(1) Improve the Utilization Efficiency of Cultivated Land Resources
Cultivated land area remains a key determinant of grain output, yet its marginal contribution has gradually diminished. Efforts should focus on accelerating the construction of high-standard farmland to boost per-unit productivity. Given the spatial disparity in land distribution—more abundant in the east than in the west—region-specific strategies are needed. These include promoting agricultural machinery suitable for hilly and mountainous terrain, as well as the adoption of water-saving irrigation technologies in western Sichuan, to enhance land productivity and achieve more balanced regional grain capacity.
(2) Promote Precision and Green Fertilizer Application
While fertilizer input exerts a significant positive impact on grain yields, it also poses risks of resource inefficiency and environmental degradation. Precision fertilization technologies should be widely promoted to optimize application methods and timing, thereby minimizing nutrient loss. In regions such as northeastern Sichuan, where soils are relatively infertile, emphasis should be placed on improving soil health and advancing “soil testing and formula fertilization” practices to reduce excessive fertilizer use, mitigate soil degradation, and achieve higher-quality, more efficient agricultural production.
(3) Strengthen Rural Electricity Supply and Adoption of Smart Agricultural Equipment
Electric power is essential for the modernization of agriculture. Upgrading and expanding rural power infrastructure is crucial to ensure stable and widespread electricity supply, thereby supporting the operation of agricultural machinery and smart farming technologies. Promoting the use of intelligent irrigation systems and energy-efficient agricultural equipment can significantly improve productivity and enhance the resilience of food supply systems.
(4) Optimize Population Mobility and Land Use Patterns
Shifts in population density exert mounting pressure on cultivated land, particularly in high-density regions such as the Chengdu Plain. Policies should support the orderly migration of rural populations to urban areas and facilitate the transition of agricultural labor to non-agricultural sectors, thereby easing land-use pressures. Integrating rural–urban land use planning can optimize agricultural spatial layouts, enhance the efficiency of land resource allocation, and ensure the preservation of foundational resources for grain production.
Data availability statement
The raw data supporting the conclusions of this article will be made available by the authors, without undue reservation.
Author contributions
HD: Conceptualization, Formal analysis, Methodology, Resources, Validation, Visualization, Writing – original draft, Writing – review & editing. YD: Conceptualization, Funding acquisition, Project administration, Resources, Supervision, Validation, Writing – review & editing. YH: Data curation, Formal analysis, Resources, Validation, Writing – review & editing. HC: Resources, Software, Validation, Visualization, Writing – review & editing. WW: Conceptualization, Validation, Visualization, Writing – review & editing, Investigation.
Funding
The author(s) declare that financial support was received for the research and/or publication of this article. This research was funded by the Key Laboratory of Philosophy and Social Sciences in Sichuan Province—Key Laboratory for Intelligent Management and Ecological Decision Optimization of Baijiu in the Upper Reaches of the Yangtze River (grant no. zdsys-02) and supported by the Innovation Fund of Postgraduate, Sichuan University of Science and Engineering.
Acknowledgments
The first author, Huae Dang, would like to sincerely thank all the teachers and students who have helped us. It is with everyone’s joint efforts that we were able to achieve this.
Conflict of interest
The authors declare that the research was conducted in the absence of any commercial or financial relationships that could be construed as a potential conflict of interest.
Generative AI statement
The authors declare that no Gen AI was used in the creation of this manuscript.
Publisher’s note
All claims expressed in this article are solely those of the authors and do not necessarily represent those of their affiliated organizations, or those of the publisher, the editors and the reviewers. Any product that may be evaluated in this article, or claim that may be made by its manufacturer, is not guaranteed or endorsed by the publisher.
Footnotes
References
Aboye, B. H., Gebre-Egziabher, T., and Kebede, B. (2024). Farm factors influencing spatial variations of cropland use and change in the context of urban expansion: the case of Jimma City, Southwest Ethiopia. J. Agric. Food Res. 16:101069. doi: 10.1016/j.jafr.2024.101069
Agapkin, A. M., and Makhotina, I. A. (2021). The grain market of Russia. IOP Conf. Ser.: Earth Environ. Sci. 839:022023. doi: 10.1088/1755-1315/839/2/022023
Alemu, F. M., Mengistu, Y. A., and Wassie, A. G. (2024). Factor productivity impacts of climate change and estimating the technical efficiency of cereal crop yields: evidence from sub-Saharan African countries. PLoS One 19:e0310989. doi: 10.1371/journal.pone.0310989
Barakat, S., Cochrane, L., and Vasekha, I. (2023). The humanitarian-development-peace nexus for global food security: responding to the climate crisis, conflict, and supply chain disruptions. Int. J. Disaster Risk Reduct. 98:104106. doi: 10.1016/j.ijdrr.2023.104106
Candelise, C., Saccone, D., and Vallino, E. (2021). Electricity access and food security: an empirical assessment. World Dev. 141:105390. doi: 10.1016/j.worlddev.2021.105390
Chang, X., Wang, S., Yang, Z., Li, K., Qin, M., and Meng, X. (2024). Coupling of urbanization and grain production: patterns, processes, and mechanisms—a case study from China. Front. Sustain. Food Syst. 8:1524420. doi: 10.3389/fsufs.2024.1524420
Chen, J., Wang, S., Han, Y., Zhang, Y., Li, Y., Zhang, B., et al. (2024). Geodetector analysis of individual and joint impacts of natural and human factors on maternal and child health at the provincial scale. Sci. Rep. 14:1643. doi: 10.1038/s41598-024-52282-2
Chen, W., Yang, L., Wu, J., Wang, G., Bian, J., Zeng, J., et al. (2023). Spatio-temporal characteristics and influencing factors of traditional villages in the Yangtze River basin: a geodetector model. Herit. Sci. 11:111:1. doi: 10.1186/s40494-023-00948-x
Cheng, S., Wang, L., Wang, P., and Lu, F. (2024). An ensemble spatial prediction method considering geospatial heterogeneity. Int. J. Geogr. Inf. Sci. 38, 1856–1880. doi: 10.1080/13658816.2024.2358052
Eze, F. J., and Abe, G. N. (2024). Green agricultural technology and food security: implications for Nigeria. Afr. J. Agric. Food Sci. 7, 389–410. doi: 10.52589/AJAFS-CGJH3WBP
Fei, L., Shuang, M., and Xiaolin, L. (2023). Changing multi-scale spatiotemporal patterns in food security risk in China. J. Clean. Prod. 384:135618. doi: 10.1016/j.jclepro.2022.135618
Gandía, M. L., Del Monte, J. P., Tenorio, J. L., and Santín-Montanyá, M. I. (2021). The influence of rainfall and tillage on wheat yield parameters and weed population in monoculture versus rotation systems. Sci. Rep. 11:22138. doi: 10.1038/s41598-021-00934-y
Gao, Y., Zhao, J., and Han, L. (2022). Exploring the spatial heterogeneity of urban heat island effect and its relationship to block morphology with the geographically weighted regression model. Sustain. Cities Soc. 76:103431. doi: 10.1016/j.scs.2021.103431
Ha, T. T. V., Faiz, M. A., and Shuang, L. (2021). Assessment of the response of climate variability and price anomalies to grain yield and land use in Northeast China. Environ. Sci. Pollut. Res. 28, 36559–36572. doi: 10.1007/s11356-021-13068-5
He, H., Ding, R., and Tian, X. (2022). Spatiotemporal characteristics and influencing factors of grain yield at the county level in Shandong Province, China. Sci. Rep. 12:12001. doi: 10.1038/s41598-022-14801-x
He, C., Shao, H., and Xian, W. (2022). Spatiotemporal variation and driving forces analysis of eco-system service values: a case study of Sichuan Province, China. Int. J. Environ. Res. Public Health 19:8595. doi: 10.3390/ijerph19148595
Hu, Y. N., Connor, D. S., Stuhlmacher, M., Peng, J., and Turner Ii, B. L. (2024). More urbanization, more polarization: evidence from two decades of urban expansion in China. Npj Urban Sustain. 4, 1–11. doi: 10.1038/s42949-024-00170-z
Hu, Y., Harris, R., Timmerman, R., and Lu, B. (2024). A backfitting maximum likelihood estimator for hierarchical and geographically weighted regression modelling, with a case study of house prices in Beijing. Int. J. Geogr. Inf. Sci. 38, 2458–2491. doi: 10.1080/13658816.2024.2391412
Jadhav, H. T., Patil, T., and Jamadar, N. M. (2022). Evaluation and cost analysis of methods of power supply for irrigation pumps. J. Inst. Eng. India Ser. B 103, 1147–1157. doi: 10.1007/s40031-022-00718-6
Jiang, H., Jiang, L., He, L., Murengami, B. G., Jing, X., Misiewicz, P. A., et al. (2024). Yield prediction of root crops in field using remote sensing: a comprehensive review. Comput. Electron. Agric. 227:109600. doi: 10.1016/j.compag.2024.109600
Kazemi Garajeh, M., Salmani, B., Zare Naghadehi, S., Valipoori Goodarzi, H., and Khasraei, A. (2023). An integrated approach of remote sensing and geospatial analysis for modeling and predicting the impacts of climate change on food security. Sci. Rep. 13:1057. doi: 10.1038/s41598-023-28244-5
Khan, F., Abbass, K., Qun, W., and Grebinevych, O. (2024). Moderating role of digital media on environmental awareness and environmental beliefs to shape farmers’ behavioral intentions towards sustainable agricultural land conservation practices. J. Environ. Manag. 373:123745. doi: 10.1016/j.jenvman.2024.123745
Khanal, U., Wilson, C., Rahman, S., Lee, B. L., and Hoang, V.-N. (2021). Smallholder farmers’ adaptation to climate change and its potential contribution to UN’S sustainable development goals of zero hunger and no poverty. J. Clean. Prod. 281:124999. doi: 10.1016/j.jclepro.2020.124999
Kheyruri, Y., Sharafati, A., Neshat, A., Hameed, A. S., and Rahman, A. (2024). Analyzing the impact of socio-environmental parameters on wheat and barley cultivation areas using the geographical detector model. Phys. Chem. Earth Parts A B C 135:103630. doi: 10.1016/j.pce.2024.103630
Lee, C.-C., Zeng, M., and Luo, K. (2023). Food security and digital economy in China: a pathway towards sustainable development. Econ. Anal. Policy 78, 1106–1125. doi: 10.1016/j.eap.2023.05.003
Lei, C., Qi, Q., Fu, Y., Jiang, L., and Liang, Q. (2022). Analysis on mechanism of China’s grain production development and evolution from 1985 to 2019. IEEE Access 10, 43221–43234. doi: 10.1109/ACCESS.2022.3165189
Lesk, C., Anderson, W., Rigden, A., Coast, O., Jägermeyr, J., McDermid, S., et al. (2022). Compound heat and moisture extreme impacts on global crop yields under climate change. Nat. Rev. Earth Environ. 3, 872–889. doi: 10.1038/s43017-022-00368-8
Li, B., Liu, Z., Huang, F., Yang, X., Liu, Z., Wan, W., et al. (2021). Ensuring national food security by strengthening high-productivity black soil granary in Northeast China. Bull. Chin. Acad. Sci. Chin. Version 36, 1184–1193. doi: 10.16418/j.issn.1000-3045.20210706003
Li, H., Zhang, Y., Sun, Y., Liu, P., Zhang, Q., Wang, X., et al. (2023). Long-term effects of optimized fertilization, tillage and crop rotation on soil fertility, crop yield and economic profit on the loess plateau. Eur. J. Agron. 143:126731. doi: 10.1016/j.eja.2022.126731
Li, S., Zhang, D., Xie, Y., and Yang, C. (2022). Analysis on the spatio-temporal evolution and influencing factors of China’s grain production. Environ. Sci. Pollut. Res. 29, 23834–23846. doi: 10.1007/s11356-021-17657-2
Liu, Y. (2024). Moment estimation for uncertain regression model with application to factors analysis of grain yield. Commun. Stat. 53, 4936–4946. doi: 10.1080/03610918.2022.2160461
Liu, Y., Heuvelink, G. B. M., Bai, Z., He, P., Xu, X., Ding, W., et al. (2021). Analysis of spatio-temporal variation of crop yield in China using stepwise multiple linear regression. Field Crop Res. 264:108098. doi: 10.1016/j.fcr.2021.108098
Liu, L., Wang, X., Meng, X., and Cai, Y. (2023). The coupling and coordination between food production security and agricultural ecological protection in main food-producing areas of China. Ecol. Indic. 154:110785. doi: 10.1016/j.ecolind.2023.110785
Liu, L., Xu, X., Liu, J., Chen, X., and Ning, J. (2014). Impact of farmland changes on production potential in China during recent two decades. Acta Geograph. Sin. 69, 1767–1778. doi: 10.11821/dlxb201412003
Liu, C., Yang, C., Yang, Q., and Wang, J. (2021). Spatiotemporal drought analysis by the standardized precipitation index (SPI) and standardized precipitation evapotranspiration index (SPEI) in Sichuan Province, China. Sci. Rep. 11:1280. doi: 10.1038/s41598-020-80527-3
Lou, W., Zhao, Y., Huang, X., Zhu, T., Yang, M., Deng, S., et al. (2023). Frost risk assessment based on the frost-induced injury rate of tea buds: a case study of the Yuezhou Longjing tea production area, China. Eur. J. Agron. 147:126839. doi: 10.1016/j.eja.2023.126839
Mekonnen, M. (2021). Impacts of soil and water conservation practices after half of a generation age, northwest highlands of Ethiopia. Soil Tillage Res. 205:104755. doi: 10.1016/j.still.2020.104755
Neupane, D., Adhikari, P., Bhattarai, D., Rana, B., Ahmed, Z., Sharma, U., et al. (2022). Does climate change affect the yield of the top three cereals and food security in the world? Earth 3, 45–71. doi: 10.3390/earth3010004
Pan, J., Chen, Y., Zhang, Y., Chen, M., Fennell, S., Luan, B., et al. (2020). Spatial-temporal dynamics of grain yield and the potential driving factors at the county level in China. J. Clean. Prod. 255:120312. doi: 10.1016/j.jclepro.2020.120312
Pan, Y., Ma, L., Tang, H., Wu, Y., and Yang, Z. (2021). Land use transitions under rapid urbanization in Chengdu-Chongqing region: a perspective of coupling water and land resources. Land 10:812. doi: 10.3390/land10080812
Pawlak, K., and Kołodziejczak, M. (2020). The role of agriculture in ensuring food security in developing countries: considerations in the context of the problem of sustainable food production. Sustain. For. 12:5488. doi: 10.3390/su12135488
Penuelas, J., Coello, F., and Sardans, J. (2023). A better use of fertilizers is needed for global food security and environmental sustainability. Agric. Food Secur. 12:5. doi: 10.1186/s40066-023-00409-5
Pickson, R. B., He, G., Ntiamoah, E. B., and Li, C. (2020). Cereal production in the presence of climate change in China. Environ. Sci. Pollut. Res. 27, 45802–45813. doi: 10.1007/s11356-020-10430-x
Qian, J., Ito, S., and Zhao, Z. (2020). The effect of price support policies on food security and farmers’ income in China. Aust. J. Agric. Resour. Econ. 64, 1328–1349. doi: 10.1111/1467-8489.12398
Srivastav, A. L., Dhyani, R., Ranjan, M., Madhav, S., and Sillanpää, M. (2021). Climate-resilient strategies for sustainable management of water resources and agriculture. Environ. Sci. Pollut. Res. 28, 41576–41595. doi: 10.1007/s11356-021-14332-4
Sun, C., Xia, E., Huang, J., and Tong, H. (2024). Coupled coordination and pathway analysis of food security and carbon emission efficiency under climate-smart agriculture orientation. Sci. Total Environ. 948:174706. doi: 10.1016/j.scitotenv.2024.174706
Swain, K. C., Singha, C., and Pradhan, B. (2024). Estimating total rice biomass and crop yield at field scale using PlanetScope imagery through hybrid machine learning models. Earth Syst. Environ. 8, 1713–1731. doi: 10.1007/s41748-024-00481-2
Tan, Q., Liu, Y., Dai, L., and Pan, T. (2021). Shortened key growth periods of soybean observed in China under climate change. Sci. Rep. 11:8197. doi: 10.1038/s41598-021-87618-9
Wan, J., Wang, Z., Ma, C., Su, Y., Zhou, T., Wang, T., et al. (2023). Spatial-temporal differentiation pattern and influencing factors of high-quality development in counties: a case of Sichuan, China. Ecol. Indic. 148:110132. doi: 10.1016/j.ecolind.2023.110132
Wang, X. (2022). Managing land carrying capacity: key to achieving sustainable production systems for food security. Land 11:484. doi: 10.3390/land11040484
Wang, L., Li, Y., Wu, J., An, Z., Suo, L., Ding, J., et al. (2023). Effects of the rainfall intensity and slope gradient on soil Erosion and nitrogen loss on the sloping fields of Miyun reservoir. Plan. Theory 12:423. doi: 10.3390/plants12030423
Wijerathna-Yapa, A., and Pathirana, R. (2022). Sustainable agro-food systems for addressing climate change and food security. Agriculture 12:1554. doi: 10.3390/agriculture12101554
Wu, J., and Li, K. (2024). Analysis of spatial and temporal evolution and driving factors of carbon emission in Shandong Province: based on the perspective of land use. Environ. Sci. Eur. 36:171. doi: 10.1186/s12302-024-01000-w
Xia, S., Zhao, Y., Xu, X., Wen, Q., Sun, Q., and Wang, L. (2018). Spatio-temporal pattern and driving factors of grain production in Jiangsu Province. Econ. Geogr. 38, 166–175. doi: 10.15957/j.cnki.jjdl.2018.12.021
Xin, F., Xiao, X., Dong, J., Zhang, G., Zhang, Y., Wu, X., et al. (2020). Large increases of paddy rice area, gross primary production, and grain production in Northeast China during 2000–2017. Sci. Total Environ. 711:135183. doi: 10.1016/j.scitotenv.2019.135183
Yuan, S., Mu, N., Bai, J., and Zhang, H. (2024). Spatial heterogeneity analysis on distribution patterns and underlying determinants of historical rural settlements: a case study in Taihang Baxing. Herit. Sci. 12, 1–22. doi: 10.1186/s40494-024-01486-w
Zhang, Z. Y. (2024). Spatial-temporal distribution characteristics of fertilizer application and grain yield in Yellow River Basin from 2000 to 2021. Soil Water Conserv. Bull. 44, 312–321,332. doi: 10.13961/j.cnki.stbctb.2024.02.032
Zhang, H.-Z., Cui, W.-G., Liu, S.-H., Cui, H.-W., and Huang, Y.-M. (2023). Identifying driving factors and their interacting effects on sources of heavy metal in farmland soils with geodetector and multi-source data. Huan Jing Ke Xue 44, 2177–2191. doi: 10.13227/j.hjkx.202205201
Zhang, Y., Kumar, S., Huang, X., and Yuan, Y. (2023). Human capital quality and the regional economic growth: evidence from China. J. Asian Econ. 86:101593. doi: 10.1016/j.asieco.2023.101593
Zhang, W., Li, Y., and Zheng, C. (2023). The distribution characteristics and driving mechanism of vacant land in Chengdu, China: a perspective of urban shrinkage and expansion. Land Use Policy 132:106812. doi: 10.1016/j.landusepol.2023.106812
Zhang, D., Yang, W., Kang, D., and Zhang, H. (2023). Spatial-temporal characteristics and policy implication for non-grain production of cultivated land in Guanzhong region. Land Use Policy 125:106466. doi: 10.1016/j.landusepol.2022.106466
Zhang, S., Zhou, Y., Yu, Y., Li, F., Zhang, R., and Li, W. (2022). Using the geodetector method to characterize the spatiotemporal dynamics of vegetation and its interaction with environmental factors in the Qinba Mountains, China. Remote Sens. 14:5794. doi: 10.3390/rs14225794
Zhao, C., Dong, X., Wang, H., Wang, Y., and Zhu, J. (2022). Spatio-temporal pattern changes and driving factors of grain production in Henan Province. J. Henan Agric. Univ. 56, 312–322. doi: 10.16445/j.cnki.1000-2340.20210518.001
Zhe, Y. A., Lin, C. H., Yibin, X. I., Chen, W. A., Wanyi, T. A., Tianwei, W. A., et al. (2023). Spatiotemporal changes and driving forces of main grain crop planting types in Northeast China from 2017 to 2021. Resour. Sci. 45, 966–979. doi: 10.18402/resci.2023.05.07
Zhou, C., Zhang, R., Ning, X., and Zheng, Z. (2020). Spatial-temporal characteristics in grain production and its influencing factors in the Huang-Huai-Hai plain from 1995 to 2018. Int. J. Environ. Res. Public Health 17:9193. doi: 10.3390/ijerph17249193
Keywords: Sichuan Province, grain production, spatiotemporal evolution, Geodetector, geographically weighted regression
Citation: Dang H, Deng Y, Hai Y, Chen H and Wang W (2025) Characterization of spatio-temporal evolution of grain production and identification of its heterogeneity drivers in Sichuan Province based on Geodetector and GWR models. Front. Sustain. Food Syst. 9:1561910. doi: 10.3389/fsufs.2025.1561910
Edited by:
Patricia Abrantes, University of Lisbon, PortugalReviewed by:
Daojun Zhang, Northwest A&F University, ChinaYaofeng Luo, Northwest A&F University, China
Copyright © 2025 Dang, Deng, Hai, Chen and Wang. This is an open-access article distributed under the terms of the Creative Commons Attribution License (CC BY). The use, distribution or reproduction in other forums is permitted, provided the original author(s) and the copyright owner(s) are credited and that the original publication in this journal is cited, in accordance with accepted academic practice. No use, distribution or reproduction is permitted which does not comply with these terms.
*Correspondence: Yuanjie Deng, dGltaWR5dWFuamllQGdtYWlsLmNvbQ==