 B. K. D. J. R. Samarasinghe1
 Yuchun Zhu1*N. R. Abeynayake2Xuemei Zeng1B. Mathavan1R. W. W. M. P. K. Wanninayake3Somaiya Rasheed1A. Salami Bah1
- 1College of Economics and Management, Northwest A&F University, Yangling, Shaanxi, China
- 2Department of Computing and Mathematics, Faculty of Science and Engineering, Manchester Metropolitan University, Manchester, United Kingdom
- 3Faculty of Agriculture and Plantation Management, Wayamba University, Makandura, Gonawil, Sri Lanka
This study explores climate change's symmetric and asymmetric impacts on rice production in Sri Lanka, a crucial sector for food security in the country. The analysis utilized Autoregressive Distributed Lag (ARDL) and Non-linear Autoregressive Distributed Lag (NARDL) models. This study analyses annual data from 1952 to 2022 to capture relationships among the study variables. The ARDL findings reveal that temperature and cultivated land area have a significant long-term effect on rice production. The NARDL model reveals that positive and negative changes in climate variables have asymmetrical long-term impacts. Positive changes in temperature and rainfall lead to a notable decline in rice yields in the long term. Negative rainfall changes create a significant beneficial effect on rice production in the long term. Cultivated land area shows a significant positive impact on rice yield in the long term. The results of symmetric and asymmetric climate change impact are essential for formulating agricultural climate adaptation policies, such as promoting climate resilience rice varieties, improving irrigation and water management, developing early warning systems that promote sustainability and enhance climate adaptation strategies, ensuring food security in Sri Lanka.
1 Introduction
Sri Lankan rice production is highly dependent on climate factors, mainly rainfall patterns and temperature (Ratnasiri et al., 2019). Rice cultivation primarily relies on two monsoon seasons. Climate change-induced variability in these monsoons, combined with rising temperature and changing rainfall patterns (Menike and Arachchi, 2016; Thevakaran et al., 2019). It is having significant effects on rice yields, water resources and food security (Jayasooriya, 2022; Samaraweera et al., 2024). The country faces significant risks from various hydro-metrological disasters, including floods and droughts. The leading challenges facing agricultural practices include seasonal rainfall variability, prolonged dry periods, decrease in rainfall frequency and duration, delayed arrival of the rainy season, intense rainfall events, drought conditions in dry regions, and sudden flash floods (Aheeyar et al., 2023; Marambe et al., 2015).
In the global climate risk index, it was positioned 2nd in 2017 and 6th in 2018, highlighting its vulnerability to climate-related challenges (Aheeyar et al., 2023). Between 2000 and 2020, climate-related disasters impacted total of 14,246,769 people (Donatti et al., 2024). In the Climate Risk Index for 2000–2019, Sri Lanka ranks 35th in annual fatalities among all countries, 42nd in loss of life per 100 000 populations, 28th in average losses in million US dollars, and 45th in average losses per unit gross domestic product in % 2000–2019. The climate variables play a significant involvement in determining crop production in the nation. Temperature and rainfall are the primary climatic parameters that significantly influence agriculture productivity. As a result, agronomic methods and farming systems have developed in most of Sri Lanka's agricultural regions in close accordance with the local climate in each separate climate zone (Bang et al., 2019; Marambe et al., 2015).
Agriculture holds a key position in the Sri Lankan economy and shares around 7.5% of the gross domestic product (Central Bank of Sri Lanka, 2022). As of 2021, Sri Lanka's population is around 22.18 million, with the majority, about 81%, residing in rural areas. Additionally, the agricultural domain employs about 25.75% of the total workforce in the country (World Bank, 2021). The International Food Policy Research Institute has indicated a projected decrease in global rice production by 12–14% by 2050 due to climate change. The demand for rice consumption is increasing in the Asian region, but most climate-affected regions are in South Asia. However, the demand for rice consumption is decreasing in high and middle-income countries (Kassam, 2003). Rice is the main food of the Sri Lankan population, with an average consumption per person of around 1,112.3 kilograms annually. It contributes 42% of an individual's total calories and meets 34% of their protein requirements (Department of Agriculture Sri Lanka, 2023; Department of Census and Statistics, Sri Lanka, 2022). An average consumer spends 12.8% of the total food monthly expenditure on rice (Central Bank of Sri Lanka, 2022). Total rice crop damages reported due to floods, drought, pests and diseases, and other reasons are 20,093 ha out of the total sown extent of 497,113 ha reported at the end of September 2023 (Department of Agriculture Sri Lanka, 2023). In addition, accounts for 40% of the country's arable land is paddy cultivation (United States Department of Agriculture Foreign Agricultural Service, 2023).
Irrigated agriculture constitutes the primary method of cultivation in the country. Around 45% of the total cultivated area is supported by large-scale irrigation systems, while 25% relies on smaller irrigation systems, and 30% depends on rainfall (Suresh et al., 2021). Rice is the first widely consumed staple food, occupying two-fifths of the cultivated land area in the country (Ratnayake et al., 2023). Studying the consequences of climate instability on rice production is crucial for ensuring food security (Rathnayake et al., 2020). Compared to other crop production, rice production is a leading form of agricultural practice in the nation. As a result, and because of their large shares in people's diets, the rice crop production sector has received particular attention in the country. Achieving rice self-sufficiency is a central objective of the agriculture sector policy framework in Sri Lanka (Food Agriculture Organization, 2023). Various literature has attempted to determine how climate variability influences crop yields in various countries. Chandio et al. (2022) highlighted the long-term impact of climatic parameters such as relative humidity, rainfall, temperature, and agronomic factors on rice production in prominent Asian regions. Amarasingha et al. (2018) explored the consequences of climate variations on paddy cultivation, depending on the specific variety and geographical context. Furthermore, Joseph et al. (2023) reported how temperature shifts and rainfall variations affect rice yield by modeling production trends in the top rice-producing countries.
Many studies have highlighted the impact of climatic variables on crop harvests. Out of these, temperature and rainfall emerge as the primary influences on agricultural production (Ayanlade et al., 2018; Dawid and Boka, 2025; Lee et al., 2024; Li, 2023; Solaymani, 2023). The impacts on the agriculture sector differ across geographical regions and local environmental conditions (Mereu et al., 2021). Rice production depends on climatic and non-climatic variables, exhibiting both symmetrical and asymmetrical relationships between these factors (Chung et al., 2015; Zhang et al., 2023). The effects of changes in climate variables differ among rice varieties (Sarker et al., 2014). For instance, Amarasingha et al. (2018) discovered that Maha and Yala seasons production of Bg300 and Bg359 rice varieties yields vary in the dry and wet zones due to impacts of climatic factors. Extreme temperature variations pose the greatest threat to rice yield (Rayamajhee et al., 2021; Tan et al., 2021). Abbas et al. (2022) as well as Warsame et al. (2021) Identifying a connection among rainfall and rice production highlights positive and negative correlations. Climate variables impact rice production both in the long and short run in different countries (Emediegwu et al., 2022; Herath et al., 2020).
Additionally, paddy production is significantly influenced by technology and agriculture policy (Nasrullah et al., 2021). Furthermore, Anh et al. (2023), Guo et al. (2022), Kumar et al. (2021) and Warsame et al. (2021) found that the cultivated area positively influences crop yield. The study exposed that paddy production in Southeast Asia will decrease by about 5% by 2030 (Lobell et al., 2008). In Southwest China, rice production will decrease to 10.5% by 2050 and 47.9% by 2080 due to high temperatures and CO2 (Wang et al., 2021).
Mainly, Sri Lankan research studies did not adequately focus on the impact of climate fluctuations on rice production. As per my knowledge, no research papers focus on the long and short-term positive and adverse effects of rainfall and temperature changes on rice production. Proper awareness of the long-term effects of climatic variability is important for creating effective policy recommendations. Therefore, this research focuses on long and short term positive and negative shock impacts of climatic variation on rice production, with data from 1952 to 2022 using ARDL and NARDL models.
This study aims to assess whether climatic variables influence symmetric or asymmetric effects on rice production over time and to identify how these effects vary in the short and long run. Our research is significant because of its potential to inform climate-resilient agricultural policies and strategies by offering empirical insights in to how rice productivity responds to symmetric and asymmetric climate variability, an urgent need for ensuring national food security in the face of increasing climate risks.
This paper has four main parts. The introduction is the first part, and the second part provides materials and methods. The third part defines the results of the research. The last section includes a discussion, policy recommendations, and a conclusion.
2 Materials and methods
2.1 Overview of research variables
The study used annual data from 1952 to 2022, obtained from Census and Statistics Department and the World Bank database (Department of Census and Statistics, Sri Lanka, 2022; World Bank Climate Change Knowledge Portal, 2023). More details about study variables are shown in Table 1. Rice production is used as a response variable, while mean temperature, annual rainfall and cultivated land area are used as explanatory variables.
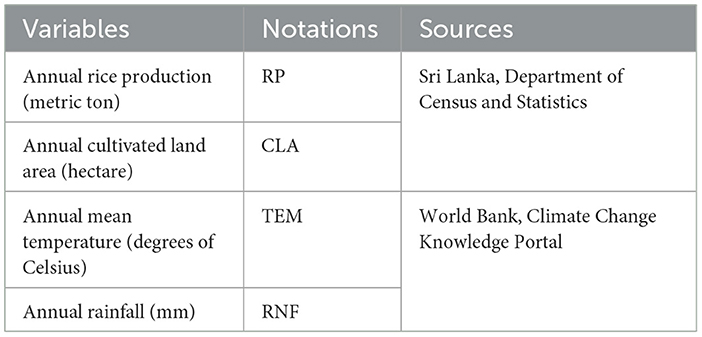
Table 1. Summary of study variables.
2.2 Model framework
This study observed the relationship between rainfall, temperature, cultivated land area, and rice production in Sri Lanka, focusing on both symmetric and asymmetric aspects. To improve the stability of the data for regression analysis, the variables were transformed using natural logarithms. This approach ensures that the variance is stabilized, facilitating a more accurate regression analysis.
LRPt is the natural logarithm of rice crops produced at time t, and β0 is the intercept of the function. LRNFt is the natural logarithm of rainfall at time t, while LCLAt indicates the natural logarithm of land used for crop cultivation at time t. Additionally, LTEMt refers to the natural logarithm of temperature at time t. β1, β2, β3 are slope coefficients of the function and εt is the residuals.
Rainfall (LRNF+, LRNF−), Cultivated land area (LCLA+, LCLA−) and temperature (LTEM+, LTEM−), were divided into positive and negative changes to test asymmetric effects.
The revised model can be specified as:
As a first step, identifying the stability of the variables contained in the equation is essential to ensure that data is suitable for analysis. Some variables can be highly variable over time. Therefore, it is crucial to find out their order of integration. Once stationary is confirmed, we move on to conduct linear and non-linear cointegration analysis as well as long-run evaluations. This step helps to recognize the order of integration of the variables.
We applied symmetric and asymmetric ARDL methods in our study. These methods accommodate variables can be integrated into at a level or at first difference, showcasing their flexibility. This method is highly reliable for small sample sizes, effectively addresses endogeneity issues when selecting an appropriate lag and assists in identifying long-run coefficients. It can effectively address potential multicollinearity issues, when variables are highly correlated. Additionally, the Non-linear ARDL model estimates the Error Correction Model, which provides insights into the speed of change to the long-run equilibrium after a shock.
The Error Correction Term techniques used in this research are to identify short and long-run dynamics and understand both short-term fluctuations and long-term trends. This approach mitigates issues like spurious relationships due to non-stationary time series data. Equation 1 can then be rewritten as below:
Where △ represents the initial variation, β0 represents the intercept, q represents the optimal lag length, μt Represents the residuals and t represents the time trend.
2.3 Estimation method
We began by applying Ordinary Least Squares techniques to estimate the coefficient of Equation 1, followed by an investigation into the long-term connection between variables (Pesaran et al., 2001). Following this, we utilized the F-test and Wald test to evaluate the statistical validity of the coefficients for the lagged variables. The null hypothesis, represented as LRP (LRP, LRNF, LCLA, LTEM) asserts that there are no long-term associations among the variables and that they are not correlated. In contrast, the alternative hypothesis suggests that at least one coefficient significantly differs from zero.
We used the F-test to find long-term relationships among the variables in our study. A cointegrating relationship between the variables was established to determine the long-run coefficients of the ARDL model (Equation 1.2).
The short-run association is derived from an Error Correction Model, represented in Equation 1.3.
2.4 NARDL model
The advanced and recently developed No-linear ARDL model was utilized to evaluate the asymmetric and non-linear effects of temperature, rainfall, and cultivated land area on rice outputs. Unlike the standard Autoregressive Distributed Lag model, which overlooks the non-linear and asymmetric relationship between variables, the NARDL model allows for a more nuanced analysis. This model was introduced to examine patterns of dynamic adjustment and the asymmetrical relationships among the variables in both the short and long run, as shown by Shin et al. (2013). The positive and negative fluctuations in rainfall, cultivated area and temperature are represented in the Equation 2. The determination of cumulative sums follows the methodology outlined in Equation 2a through Equation 2f.
The ARDL model, as presented by Shin et al. (2013), employs cumulative positive and negative partial sums to construct the Non-linear ARDL model, which is defined in Equation 3.
In this context, and reveal both long-term positive and negative influence of explanatory variables on rice production. Meanwhile and reflect the short-term positive and negative effects of these variables. The error correction model is detailed in Equation 4.
The ECT indicated by θi in Equation 4 explains the adjustment speed of equilibrium after short-run shock, and φi indicates the short-run asymmetries. Additionally, the Wald test identified short and long-run asymmetries for independent variables.
The asymmetric multiplier effect is evaluated afterwards confirming long-run relationship, typically by examining the impact of a 1% variation in , , , , , and can be obtained from Equation 3.
According to the projected asymmetric multipliers articulated in Equation 5, it is evident that system shocks facilitate dynamic adjustments that oscillate between stability and deviation. The α coefficients in Equation 5 represent the long-run association between an endogenous variable and each exogenous variable, indicating the degree of the long-run impact of each exogenous variable on the response variable.
2.5 Model diagnostic tests
We employed the Breusch-Godfrey LM test to detect serial correlation, the Ramsey RESET test for model specification or the presence of omitted variables, the Jarque-Bera test to examine normality and the Breusch-Pagan-Godfrey test to evaluate heteroscedasticity. The outcomes of these tests are outlined in subsections 3.5 and 3.6. Stability tests were also conducted, which encompassed the evaluation of multiplicative effects and the application of recursive regression residuals, specifically the CUSUM and CUSUMSQ. A check of the multiplicative effects among the research variables was also performed. The reliability of the model was examined by using these tests.
3 Results
3.1 Descriptive statistics
The average rice production over the study period was 2,317,000 metric tons. The country had an average cultivated land area of nearly 780,000 hectares. An increasing trend in both rice production and cultivated land area has been observed since 1952 (Figure 1). During this period, the highest average temperature recorded was 27.71 degrees Celsius. The results show that (Table 2), over the study period, highest rainfall is 2,524.06 mm annually. However, the lowest is 1,292.24 mm annually.
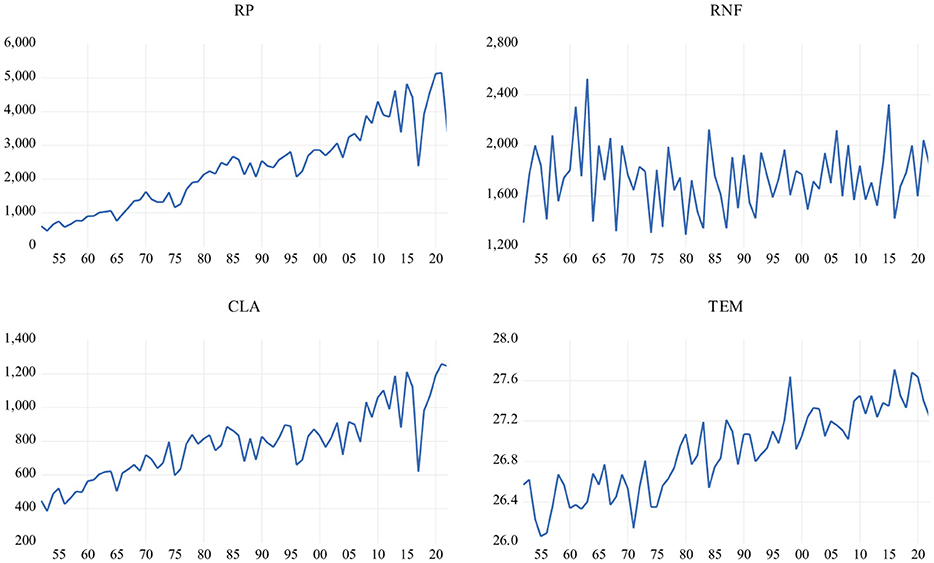
Figure 1. The trend analysis of endogenous and exogenous variables.
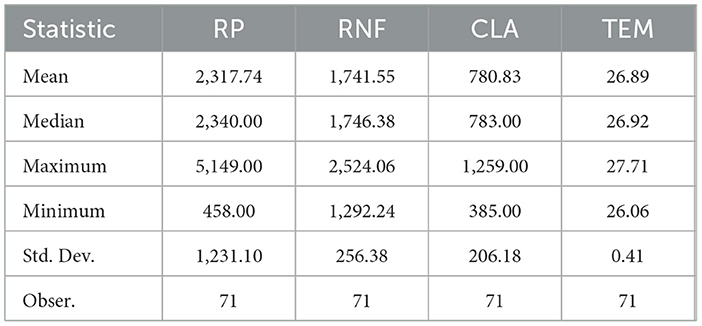
Table 2. Summary of the descriptive statistics.
3.2 Stability testing and structural analysis
In the time series analysis process, it is crucial to consider both non-linearity and stationarity to confirm the strength and validity of the outcomes. Non-linearity refers to the presence of relationships in the data that cannot be adequately captured by linear models, leading to the use of non-linear models. On the other hand, stationarity refers that the required statistical properties of time series for most types of modeling, such as variance and mean, remain stable over time. By addressing non-linearity and ensuring stationarity, researchers can improve the validity of their time series models and avoid misleading inferences.
The co-integration analysis started with assessing the univariate properties of the time series data. Two key conditions must be satisfied to ensure that the co-integration analysis yields significant findings. All variables should be integrated at the same level, and their linear relationship must be stationary. This study found that all variables, except rainfall, were non-stationary at the level. Based on the literature review, we utilized the Augmented Dickey-Fuller (ADF), Phillips-Perron (PP), Structural Break Unit Root (SBUR), and Kwiatkowski-Phillips-Schmidt-Shin (KPSS) tests. The SBUR test was conducted to identify any instability points present in the variables.
Each of the natural logarithms of the research variables was stationary at the first difference, as exposed in Table 3. The April 2021 policy for organic agriculture and disease outbreaks leads to structural changes impacting indicators and variables' stability. These factors need to be considered to confirm the accuracy of our findings. Therefore, ADF and PP, KPSS, and SBUR tests were used in the analysis (Zivot and Andrews, 1992). Table 3, under the unit root test with structural breaks, represents the SBUR test results, which exposed that the variables remain stable, even with structural breaks at the first difference.
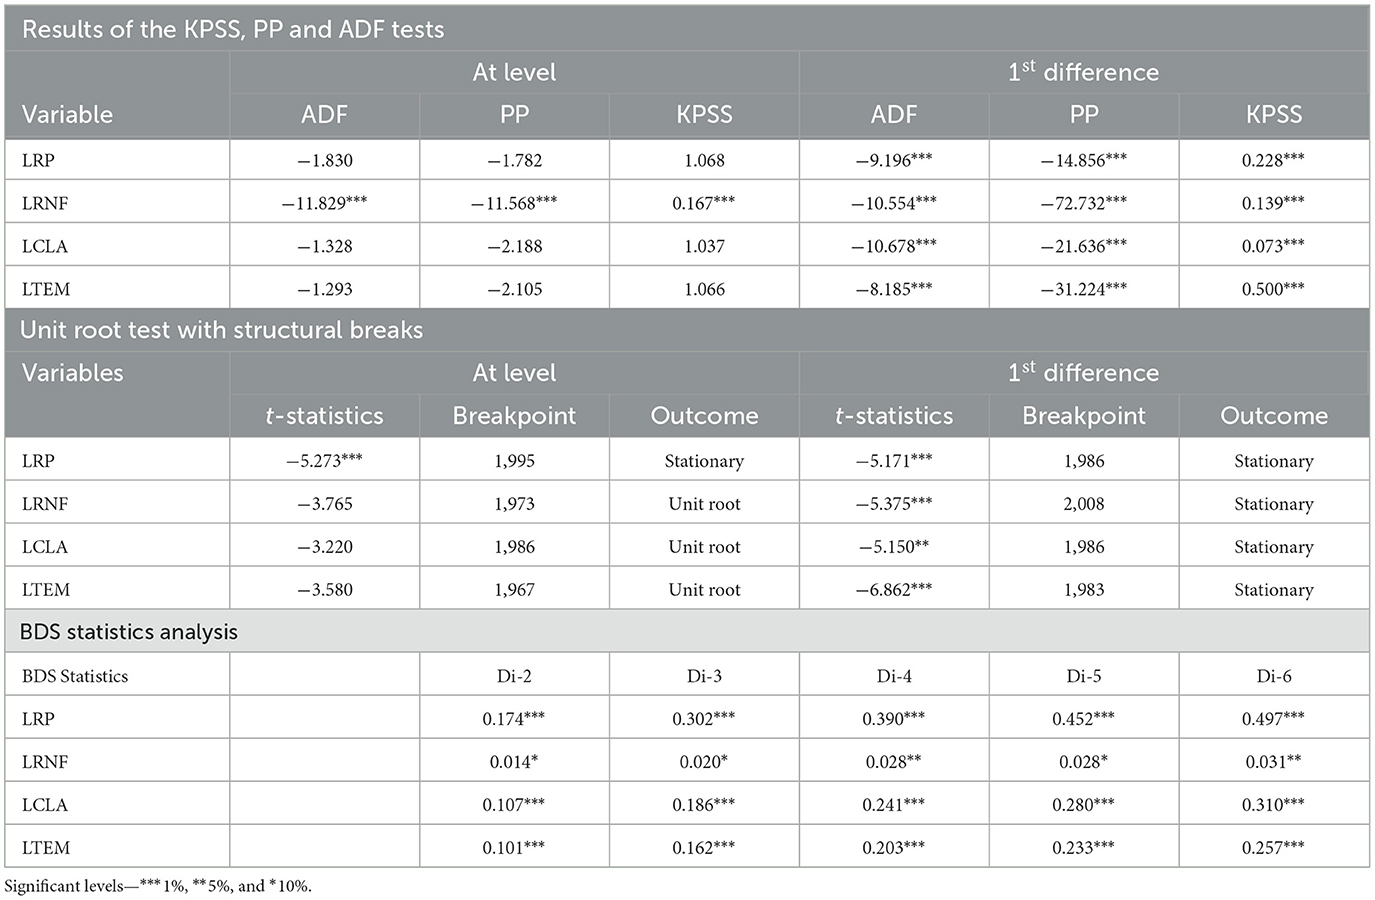
Table 3. Results of the KPSS, PP, ADF, unit root test with structural breaks and BDS tests.
Broock et al. (1996) developed the BDS test, which utilizes the correlation integral to detect non-linearity and independence in time series data. The BDS study aims to determine patterns of logical, expected instability in time series that have not been previously examined. This test effectively distinguishes between chaotic and non-linear procedures. While primarily designed to outperform linear regression, the BDS test can also evaluate a range of other non-linear models.
The BDS test statistics confirm that all four variables display non-linear dependencies, with rice production, cultivated land area and temperature showing strong non-linearity, while rainfall displays weaker non-linearity (Table 3, under BDS statistics analysis). The increasing BDS statistics with higher embedding dimensions further specify that variables show complex non-linear structures over time. It justifies using the NARDL model, which accounts for asymmetric and non-linear relationships in the estimation process.
3.3 Cointegration analysis
Table 4 shows that the minimum observed values of the Akaike Information Criterion (AIC), Schwarz Criterion (SC), Hannan-Quinn Criterion (HQ), Final Prediction Error (FPE) and LR statistic determine the optimal lag length. Additionally, the lag length selection for the vector autoregressive model is validated by a polynomial graph, where all points fall within the circle and representing that a lag length of 1 is appropriate (Figure 2).
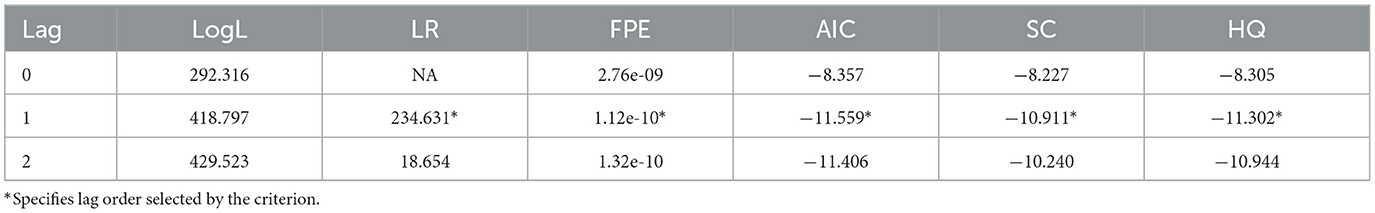
Table 4. Lag order selection criteria for VAR model.
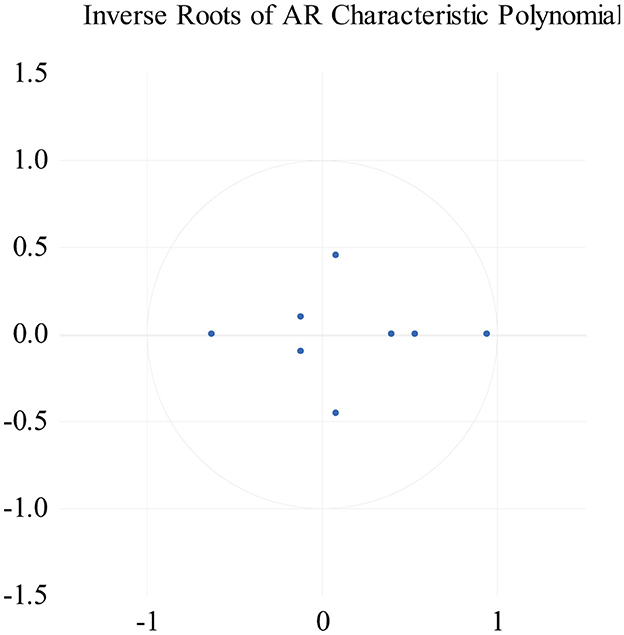
Figure 2. Polynomial graph for lag length selection in the VAR model.
We employed the F-statistic from the Wald test to assess the collective impact of all regressors, which confirmed the presence of co-integration among the variables. As shown in Table 5, for the period 1952–2022, when the equation is modeled linearly, the computed F-statistic of 98.512 exceeds the upper bound critical value of 3.67 at the 5% significance level. However, when the equation is modeled non-linearly over the same period, the computed F-statistic of 35.292 also exceeds the upper bound critical value of 3.28 at the 5% level. According to the findings from the bounds testing, we rejected the null hypothesis in both scenarios, providing evidence of co-integration between the study variables at the 5% significance level.
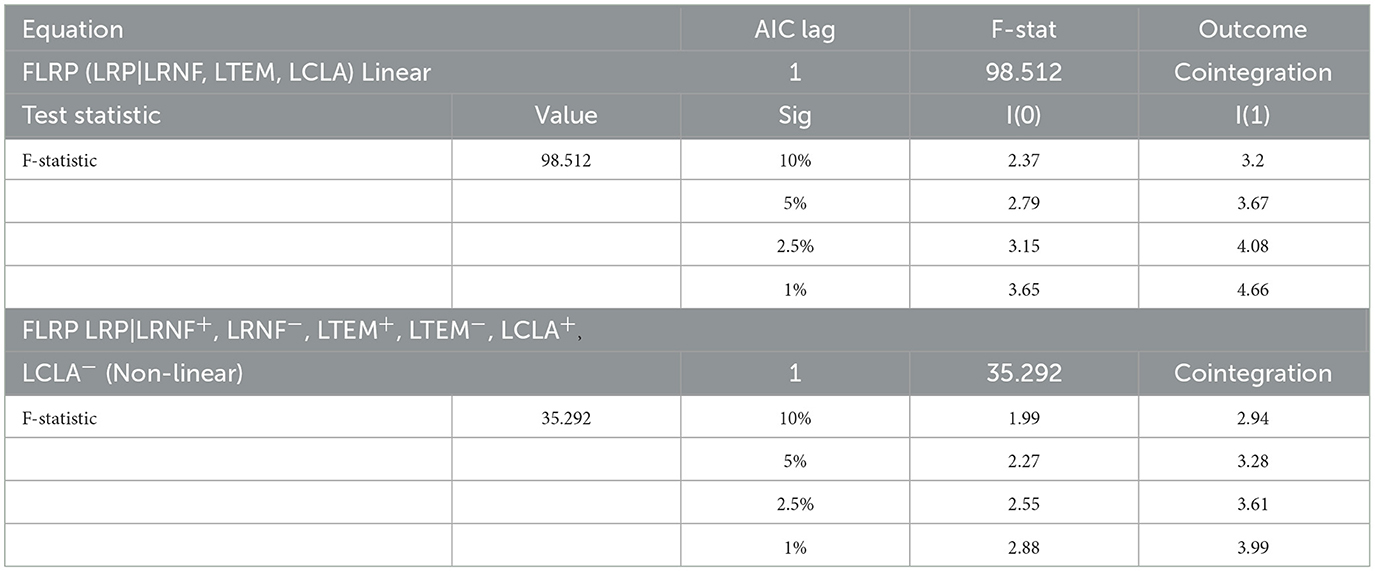
Table 5. Bound test outcomes: linear and non-linear analysis.
3.4 Assessing long and short-term effects: a comparative analysis
The long-term and short-term variable estimations by the ARDL model are shown in Table 6. Cultivated area and rice production have a significant long and short-run relationship. According to the results, a 1% increment in cultivable land area leads to a 1.269% increase in rice production over the long term and a 0.980% increment over the short term. This indicates that land expansion continues to be a vital driver of rice productivity over time. Additionally, a 1% increment in rainfall will result in a 0.256% surge in rice yield in the short term and implies that rainfall plays a more immediate role in crop performance during a given season and is one of the influencing factor on water availability and planting decisions. However, rainfall does not exhibit a significant impact in the long term.
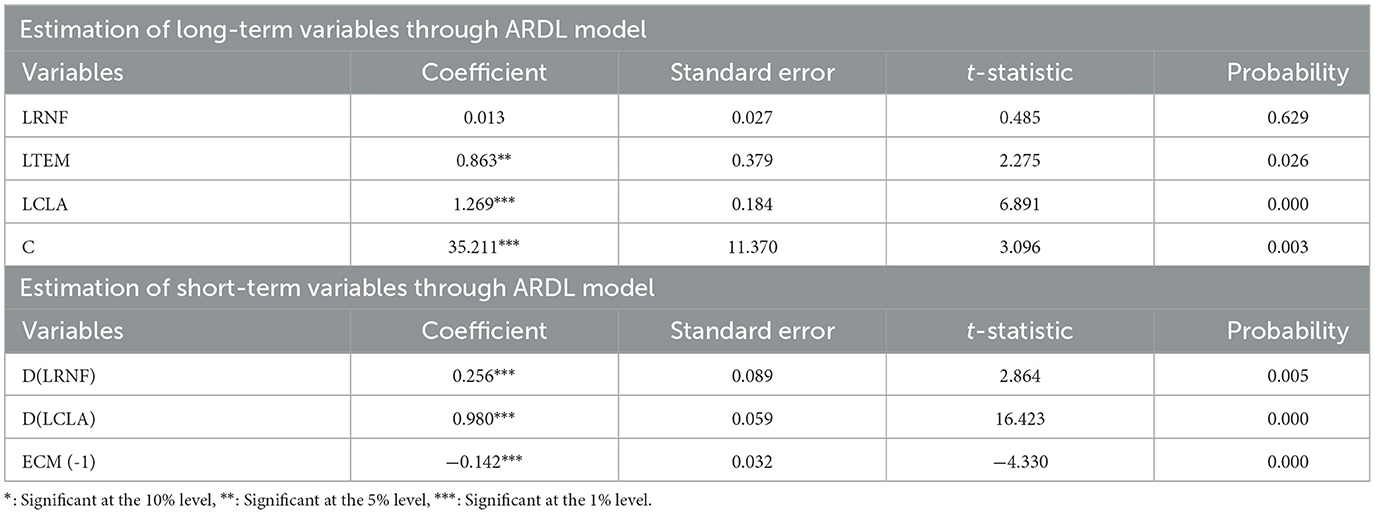
Table 6. Estimation of long-term and short-term variables through ARDL model.
The temperature coefficient has statistically substantial effects on rice production solely in the long term. Specifically, a 1% increment in temperature is associated with a 0.863% increase in rice production. Temperature changes do not have a statistically significant short-term effect and imply that short-run temperature fluctuations are either less impactful on immediate yield outcomes or can be managed through current adaptation practices such as adjusted sowing dates and resistant variety selection. Table 6 shows that the Error Correction Term (ECMt-1) is a negative value, and the probability value is 0.00, suggesting it is statistically significant. Overall, it shows long-term stability and indicates that any imbalance from previous periods can be corrected at a rate of 14.2%. It suggests that the system adjusts relatively quickly toward long-term equilibrium.
3.5 Structural and diagnostic reliability analysis of ARDL model
The R2 value of 87% indicates both diagnostically sound and structurally stable. According to a value of the Ramsey RESET, the regression model is appropriately defined, suggesting no functional issues with functional form misspecification. The serial correlation LM test suggests no significant serial correlation. Moreover, the Breusch-Pagan-Godfrey test suggests no significant heteroscedasticity. These results are indicated in Table 7. To analyze possible changes in the estimated model, the CUSUM statistics graph in Figure 3A confirms that the regression coefficients remain stable over time. Additionally, the CUSUMSQ graphs in Figure 3B show that the stability of the variance of residuals over time. The outcomes suggest slight instability in variance.
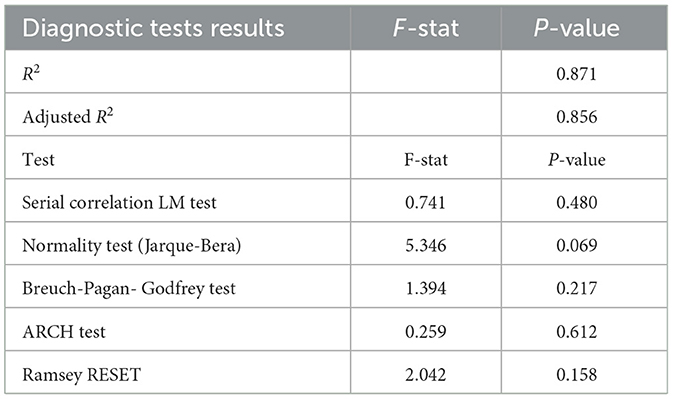
Table 7. Validation and diagnostics of ARDL model.
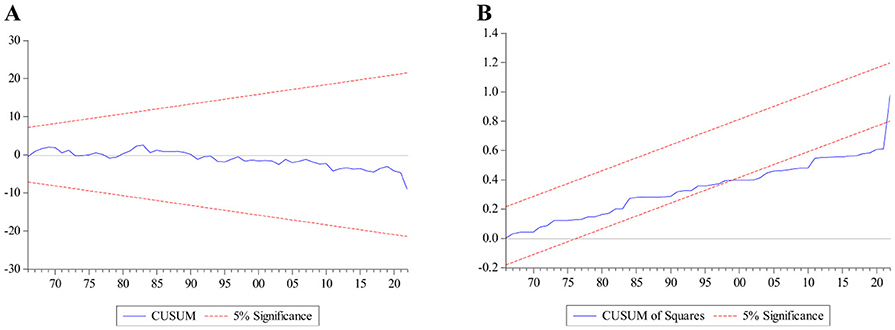
Figure 3. (A) Cumulative sum and (B) sum of squares plots of recursive residuals.
3.6 NARDL model analysis
The non-linear model F-statistic value is 35.292, surpassing the upper bound critical value at the 5% significance level (Table 5). Additionally, the results from the correlation analysis can help assess the presence of long-term correlation with the Error Correction Term at lag1. This analysis reveals that the suitable expression (ECT-1) is both destructive and statically significant in establishing a long-term relationship with RP, RNF+, RNF−,TEM+, TEM−, CLA+ CLA−. The coefficient of the ECMt-1 in this analysis is negative. It indicates that any deviations from the long-run equilibrium from previous years are corrected at a rate of 104.6% per period (Table 8).
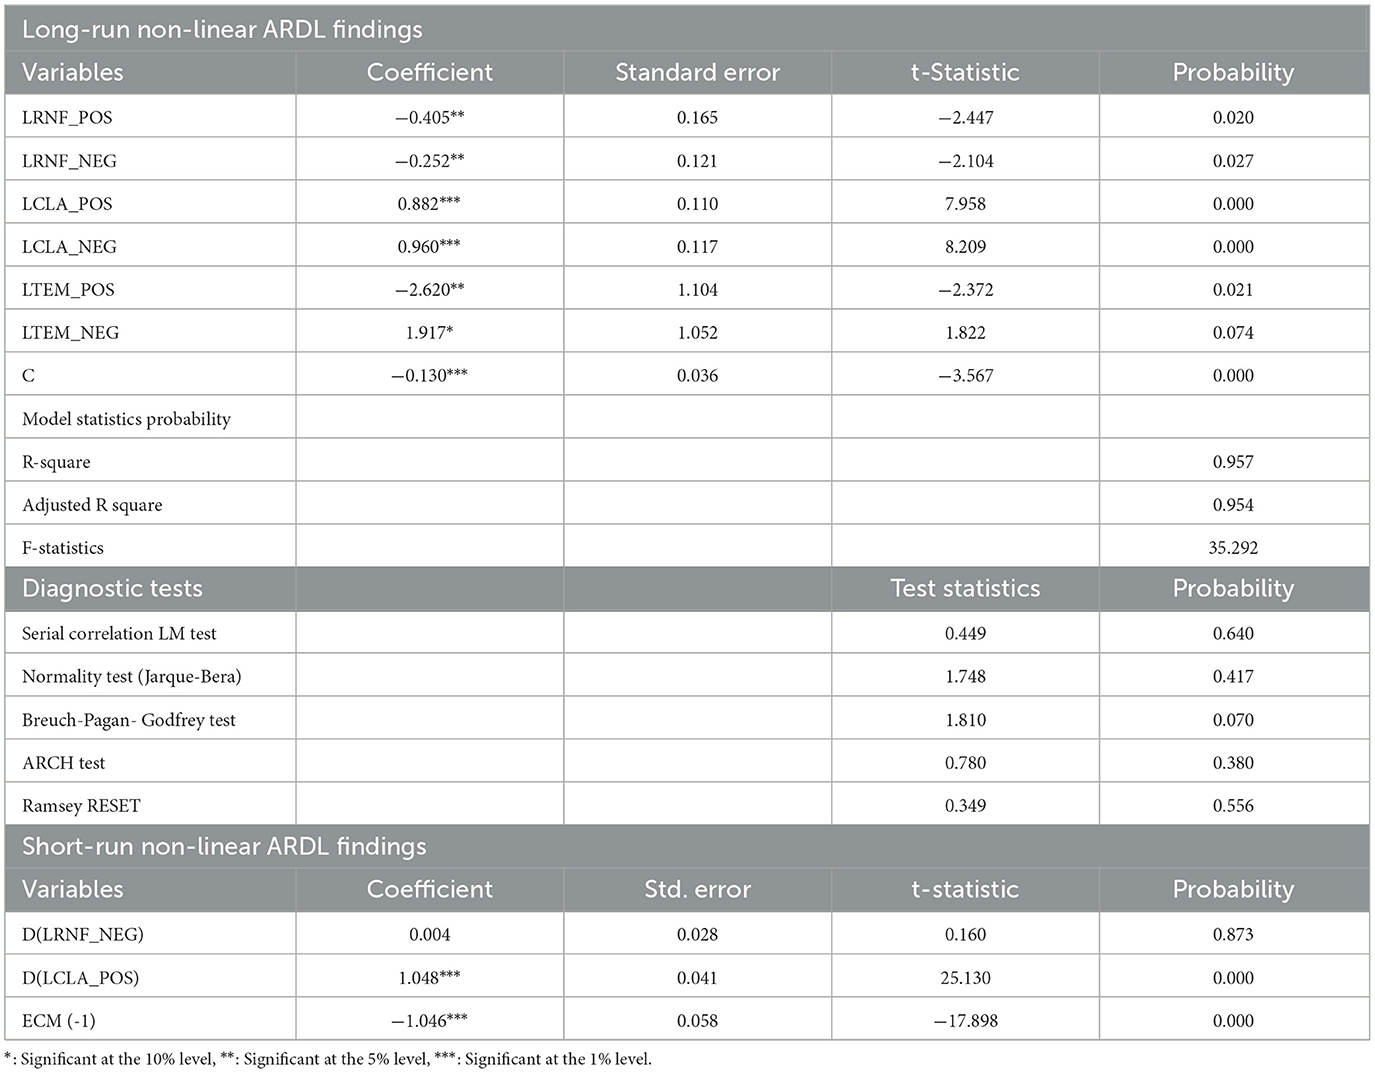
Table 8. Long-run and short-run non-linear ARDL findings and diagnostic results.
The results of the NARDL analysis for both long and short-term perspectives are presented in Table 8.The results align with what was observed in the ARDL analysis. Based on the long-term asymmetric relationship, positive shocks in the cultivated land area led to a boost in rice production. A 1% increment in positive changes in the cultivated land area will lead to a 1.048% upsurge in rice production in the short term as well as a 1% increment in positive changes to the cultivated land area will result in a 0.882% upsurge in rice production in the long term. Therefore, a positive correlation exists between cultivated land and rice production.
Based on the study of long-term NARDL estimates, the effect of rainfall fluctuations on rice yields due to both positive and negative shocks have been quantified at −0.405 and −0.252, respectively. This signifies a projected decline in rice production of 0.405%, with each 1% increase in rainfall. Conversely, a 1% decrease in rainfall is associated with an increase in rice production of 0.252%. However, the short-term coefficients denoting the impacts of rainfall variations within the asymmetric model do not reach statistical significance.
The long-term effect of temperature changes on rice yield is quantified as −2.620 for positive temperature variations and 1.917 for negative temperature variations. This indicates that the harmful effects of excessive heat have a considerable impact on rice yields. The findings explain that when there is a 1% rise in temperature, rice production declines by 2.620%, and this change is significant at the 5% significance level. Additionally, negative temperature shocks rise by 1%, and rice production decreases by 1.917% at the 10% significance level. However, it is important to note that neither positive nor negative temperature shocks seem to have no impact on rice yields in the short term.
The findings of the ARCH test and the Breusch-Pagan-Godfrey test indicate that probability values are 0.380 and 0.07, respectively (Table 8). The null hypothesis can be refuted as those values are higher than 5%, a significant level and indicate that there was no heteroscedasticity or ARCH effect in the model. Additionally, the Serial Correlation LM test was conducted to detect autocorrelation of the regression model. Based on the result, the p-value for the Chi-square statistic is 0.640. It is >0.05 and implies the non-existence of serial correlation in the residuals. The results show that the probability value is 0.417 in the normality test, which is larger than 0.05. Thus, we cannot reject the null hypothesis. It indicates that the residuals are not significantly different from a normal distribution.
The CUSUM line remains within the confidence bands, suggesting that the model coefficients do not change significantly over time (Figure 4A). Conversely, the crossing of the CUSUMSQ line through the confidence bands indicates a potential instability in the variance of the residuals (Figure 4B). These two tests used to assess the stability and consistency processes over time.
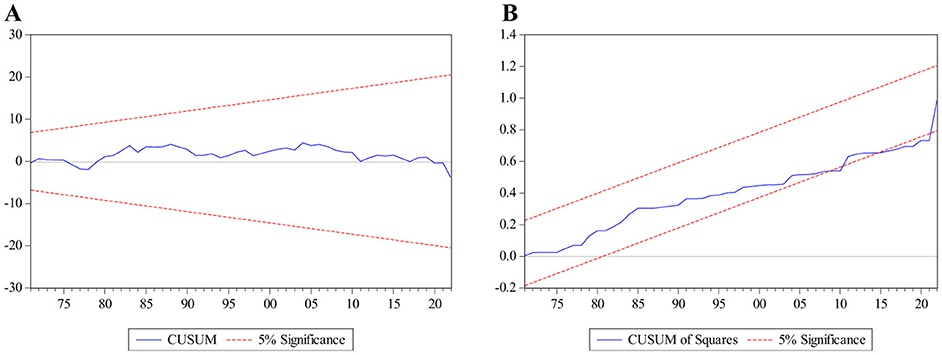
Figure 4. The (A) CUSUM and (B) CUSUM of squares of recursive residuals plots.
The multiplier graph of NARDL models illustrates the dynamic adjustment paths of the endogenous variable to positive and adverse shocks in the exogenous (LRNF, LTEM, and LCLA) variables. Figure 5A through Figure 5C illustrate how the new equilibrium equations have shifted due to earlier negative and positive shocks. They also show how the dependent variables react over time to variations in the independent variables, highlighting possible asymmetries. The black-scattered and hard black lines show that rice production changes asymmetrically as the changes to negative and positive shocks. Thick and thin lines with red dots indicate the asymmetric variations and critical boundaries. Figure 5 show an asymmetric relationship between study variables.

Figure 5. The multiplier effect of (A) temperature, (B) cultivated land area, and (C) rainfall.
3.7 Granger causality test results
We have analyzed the long and short-term impacts of temperature, rainfall, and cultivated land area on rice production in Sri Lanka. It is crucial to suggest policy recommendations for minimizing the effect of climate variation on agriculture farming. We applied the Granger causality model to investigate whether previous values of one variable can offer helpful information for forecasting the upcoming values of another variable introduced by Engle and Granger (1987). Our focus is on the causal relationship between rice production and climatic variables. Table 9 shows the predictive or causal relationship between every two-time series.
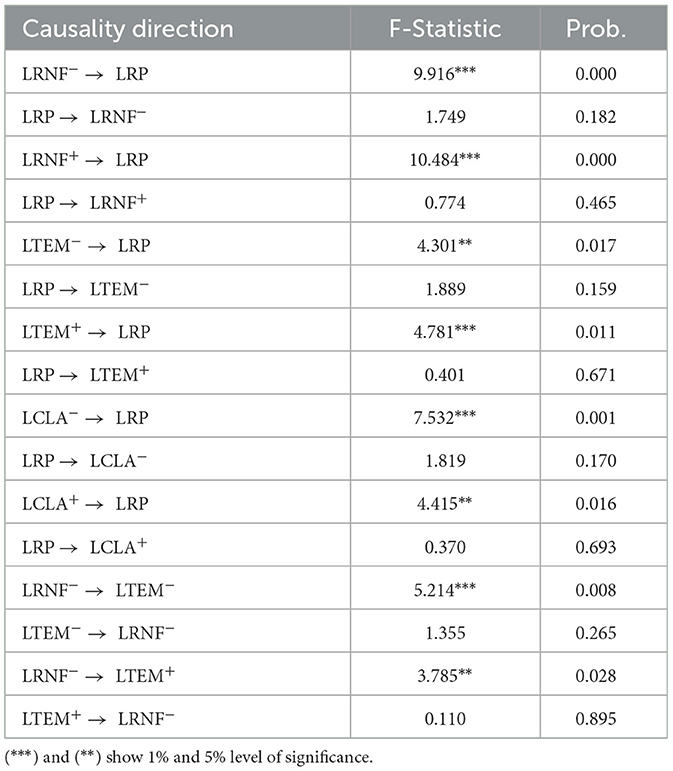
Table 9. Results of Granger causality analysis.
3.8 Evaluation of model stability
We can enhance the confidence in our long-term estimates from the Autoregressive Distributed Lag Model by integrating advanced techniques like Dynamic Ordinary Least Squares (DOLS), Fully Modified Ordinary Least Squares (FMOLS), and Canonical Cointegration Regression (CCR; Park, 1992; Phillips and Hansen, 1990; Stock and Watson, 1993). The FMOLS estimator identifies a single correlation among the variables and then employs a semi-parametric adjustment to address estimation issues arising from long-term correlations and random factors. The CCR technique resembles FMOLS but focuses especially on solving cointegration problems rather than adjustment for stationary data.
A significant advantage of the DOLS test is that it can handle variables with mixed integration orders within a cointegrated framework. It also helps reduce issues related to endogeneity and biases that can arise from small sample sizes. Table 10 shows that the long-term estimates from CCR test, FMOLS test and DOLS test show consistent signs for LCLA, LRNF and LTEM. Additionally, the Canonical Cointegration Regression findings also indicate that the NARDL long-run results are dependable.
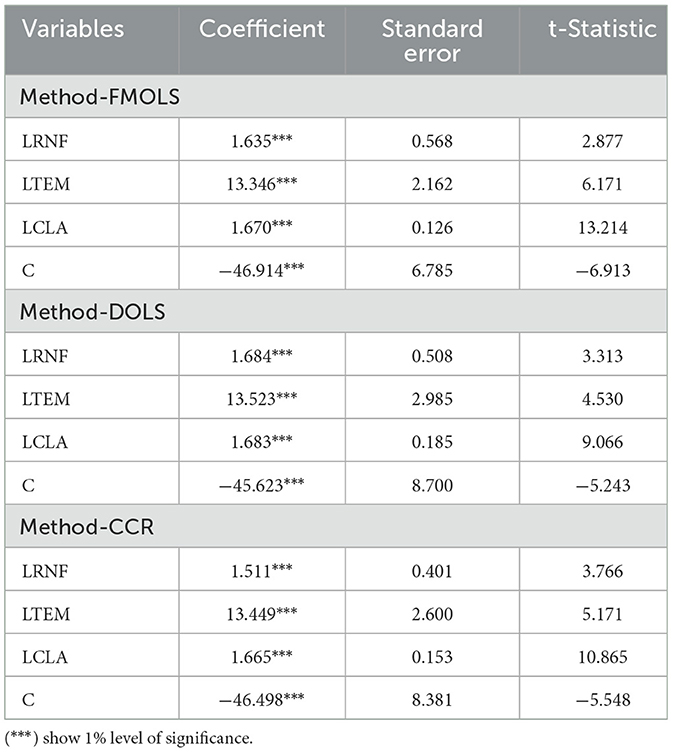
Table 10. DOLS, FMOLS, and CCR estimation results.
4 Discussion and policy recommendation
This research study explores the vigorous connection between climate fluctuations and rice production in Sri Lanka, focusing on whether this relationship is symmetric or asymmetric. We employ ARDL and NARDL methods for analysis over the period from 1952 to 2022. The Non-linear ARDL method is a modification of the linear ARDL model that effectively captures the asymmetrical relationship between variables in the long and short term. Additionally, it provides a strong framework for analyzing how positive and negative shocks in each explanatory variable affect rice production.
NARDL results demonstrate a significant, long and short-run asymmetric relationship among climatic variables and rice production in Sri Lanka. Both positive and negative climatic changes have affected rice production to a large extent in the country. It was observed that expansion and reduction in the cultivated land area significantly affect short- and long-term rice production. Importantly, these outcomes are similar to the research shown by Pickson et al. (2022) and Zhang et al. (2023).
According to the study results, there is an unfavorable effect on rice output due to positive rainfall shock. However, the beneficial effect on rice production is created due to the negative shock of rainfall in the long term. Rainfall is identified as the most crucial factor influencing crop yield in Central Asia, according to Guo et al. (2022). In Turkey, rainfall positively impacts rice production in the short and long term, as noted by Chandio et al. (2021). Conversely, rainfall harms the rice and wheat crops production efficiency, with extreme rainfall in India causing a particular reduction in crop yield (Singh, 2020). Additionally, positive and negative rainfall fluctuations and sown area significantly and strongly influence rice production in South Punjab.
Our research found that long-run positive temperature shocks negatively and significantly affect rice production. Similarly, long-term negative temperature shocks also negatively impact rice production statistically and significantly. However, in the short term, both positive and negative temperature changes do not affect rice production in Sri Lanka. These outcomes are similar to the results of Abbas and Mayo (2021). In Nepal, a rise of 1°C in average summer temperature is correlated with a decrease of 4,183 kg in rice yield (Rayamajhee et al., 2021). Furthermore, Tan et al. (2021) Observed that high temperature harmfully affects crop yield during the minor season and low temperature beneficially affects both main and minor seasons.
According to the study's results, the negative effects of temperature and rainfall highlight the need to promote practical implications of climate-resilient rice varieties, crop diversification, adjusting planting dates, deep tillage, application of organic materials, planting by parachute method, cultivation together, zero tillage and improve irrigation and drainage systems to ensure sustainable rice production. The positive impact of reduced rainfall on yield indicates that better water management is needed to improve field conditions by reducing waterlogging risks, especially in heavy clay soil areas. Implementing weather forecasting and early warning systems can help farmers make correct decisions to minimize the risk.
Therefore, our findings are essential for rapid and effective forecasting, policy formulation, and implementation of climate change prediction and rice production planning in Sri Lanka and are helpful to managing the issues of food security in the country. We need to highlight that suitable policies and innovative climate adaptation and mitigation strategies must be introduced to reduce the challenges of climate change on rice production nationally. Climate innovative agriculture practices are very essential to be introduced to the farmers at the field level. Promoting genetically modified rice varieties is crucial. At the same time, it needs to be ensured that farmers have access to these seeds through efficient seed resources and distribution systems. Crop diversity and adopting agroforestry practices can reduce risks associated with rice production and improve overall food security. Establishing and strengthening weather monitoring and early warning systems will help farmers make informed decisions and prepare for weather events. Conducting farmer education programs on climate-smart agricultural practices and strengthening agricultural extension services that provide continuous support and information. The development of sustainability policies, the promotion of institutional cooperation and financial incentives for the use of climate change measures are important. Introducing crop insurance systems and subsidies for climate-resilient technologies protects farmers from climate-related losses.
Investing in ongoing research and robust data collection processes will help us understand the impact of climate deviations and develop new solutions. Doing these things will increase the resilience of Sri Lanka's rice production to climate variations, guarantee food security and promote sustainable agriculture production. Therefore, the Sri Lankan government should review and focus on climate change strategy under the following key areas. First, weather forecasters, policymakers, and researchers need to collaborate to develop an effective and comprehensive plan enough to solve the problem of climate impacts. This ensures food safety over time. Second, the relevant authorities should prioritize developing the adaption capacity of farmers to manage the impact of climate variations on farming. Third, the Sri Lankan government should use agricultural research to promote strategic policy adjustments. In addition, the processes and activities of the current policies need to be reviewed. Farm-level climate change adaptations are crucial for long-term agricultural sustainability in Sri Lanka.
5 Conclusion
Our research study estimated the impact of temperature changes, rainfall changes, and cultivated land area covering the 70-year time series data. The analysis includes the climatic variables' positive and negative features at different levels. Very limited literature papers focused on climate change's symmetric and asymmetric impact on rice production. Therefore, our results significantly facilitate the country's rice sector development. The changing climate has significantly affected Sri Lanka's rice production recently. Also, it indirectly affects farmers' livelihoods.
Sri Lankan rice production is unstable due to prolonged drought and irregular rain patterns. The dry zone rice farmers are facing huge problems regarding water availability due to limited water sources. The main findings imply that climatic variables have adversely impacted rice yields. The results of ARDL showed that rainfall and temperature strongly impact rice production, but it could not approach the non-linear context. As a solution to that issue, the NARDL results captured asymmetrical impacts on rice output. The long and short-term analysis further described those results effectively. The results emphasized that positive and negative temperature fluctuations create adverse conditions for rice output in the long term. Positive and negative rainfall shocks negatively and positively impacted rice yield in the long term, respectively. Although, results implied that the positive shocks of the cultivated land area positively impacted rice output in the long and short term. This study was unable to focus on sunny days, hot days, air quality, and rainy days due to the unavailability of data. We focused only on rice production, cultivated land area, temperature and rainfall on a yearly basis. However, future research should expand to include additional variables. Additionally, farmer perception and factors affecting climate change adaptation strategies need to be focused on sustaining rice farming in Sri Lanka and ensuring food security in the nation.
Data availability statement
The raw data supporting the conclusions of this article will be made available by the authors, without undue reservation.
Author contributions
BS: Writing – original draft, Writing – review & editing, Conceptualization, Data curation, Formal analysis, Methodology, Visualization. YZ: Investigation, Project administration, Resources, Supervision, Validation, Visualization, Writing – review & editing. NA: Investigation, Software, Supervision, Validation, Visualization, Writing – review & editing. XZ: Resources, Validation, Writing – review & editing. BM: Resources, Validation, Writing – review & editing. RW: Resources, Validation, Writing – review & editing. SR: Resources, Validation, Writing – review & editing. AB: Resources, Validation, Writing – review & editing.
Funding
The author(s) declare that no financial support was received for the research and/or publication of this article.
Conflict of interest
The authors declare that the research was conducted in the absence of any commercial or financial relationships that could be construed as a potential conflict of interest.
Generative AI statement
The author(s) declare that no Gen AI was used in the creation of this manuscript.
Publisher's note
All claims expressed in this article are solely those of the authors and do not necessarily represent those of their affiliated organizations, or those of the publisher, the editors and the reviewers. Any product that may be evaluated in this article, or claim that may be made by its manufacturer, is not guaranteed or endorsed by the publisher.
References
Abbas, S., Kousar, S., Shirazi, S. A., Yaseen, M., and Latif, Y. (2022). Illuminating empirical evidence of climate change: impacts on rice production in the Punjab regions, Pakistan. Agric. Res. 11, 32–47. doi: 10.1007/s40003-021-00548-w
Abbas, S., and Mayo, Z. A. (2021). Impact of temperature and rainfall on rice production in Punjab, Pakistan. Environ. Dev. Sustain. 23, 1706–1728. doi: 10.1007/s10668-020-00647-8
Aheeyar, M., Amarasinghe, U., Amarnath, G., and Alahacoon, N. (2023). Factors affecting willingness to adopt climate insurance among smallholder farmers in Sri Lanka. Clim. Risk Manag. 42:100575. doi: 10.1016/j.crm.2023.100575
Amarasingha, R. K., Suriyagoda, L. D. B., Marambe, B., Galagedara, L. W., and Punyawardena, R. (2018). Impact of climate change on rice yield in Sri Lanka: A crop modelling approach using agriculture production system simulator (APSIM). Sri Lanka J. Food Agric. 4, 21–26. doi: 10.4038/sljfa.v4i1.54
Anh, D. L. T., Anh, N. T., and Chandio, A. A. (2023). Climate change and its impacts on Vietnam agriculture: a macroeconomic perspective. Ecol. Inform. 74, 101960. doi: 10.1016/j.ecoinf.2022.101960
Ayanlade, A., Radeny, M., Morton, J. F., and Muchaba, T. (2018). Rainfall variability and drought characteristics in two agro-climatic zones: An assessment of climate change challenges in Africa. Sci. Total Environ. 630, 728–737. doi: 10.1016/j.scitotenv.2018.02.196
Bang, S., Bishnoi, R., Chauhan, A. S., Dixit, A. K., and Chawla, I. (2019). “Fuzzy logic based crop yield prediction using temperature and rainfall parameters predicted through ARMA, SARIMA, and ARMAX models,” in 2019 Twelfth International Conference on Contemporary Computing (IC3) (Noida: IEEE), 1–6. doi: 10.1109/IC3.2019.8844901
Broock, W. A., Scheinkman, J. A., Dechert, W. D., and LeBaron, B. (1996). A test for independence based on the correlation dimension. Econom. Rev. 15, 197–235. doi: 10.1080/07474939608800353
Central Bank of Sri Lanka (2022). Annual Report 2022. Available online at: https://www.cbsl.gov.lk/en/publications/economic-and-financial-reports/annual-reports/annual-report-2022 (accessed December 19, 2023).
Chandio, A. A., Gokmenoglu, K. K., and Ahmad, F. (2021). Addressing the long- and short-run effects of climate change on major food crops production in Turkey. Environ. Sci. Pollut. Res. Int. 28, 51657–51673. doi: 10.1007/s11356-021-14358-8
Chandio, A. A., Gokmenoglu, K. K., Ahmad, M., and Jiang, Y. (2022). Towards sustainable rice production in Asia: the role of climatic factors. Earth Syst. Environ. 6, 1–14. doi: 10.1007/s41748-021-00210-z
Chung, N. T., Jintrawet, A., and Promburom, P. (2015). Impacts of seasonal climate variability on rice production in the central highlands of Vietnam. Agric. Agric. Sci. Procedia 5, 83–88. doi: 10.1016/j.aaspro.2015.08.012
Dawid, I., and Boka, E. (2025). Farmers' adaptation strategies to climate change on agricultural production in arsi zone, oromia national regional state of Ethiopia. Front. Clim. 7:1447783. doi: 10.3389/fclim.2025.1447783
Department of Agriculture Sri Lanka (2023). DOA SL, 2023′. Available online at: https://doa.gov.lk/agri_news_more/ (accessed December 20, 2023).
Department of Census and Statistics Sri Lanka.. (2022). Department of Census and Statistics. Available online at: http://www.statistics.gov.lk/#gsc.tab=0 (accessed January 21, 2025).
Donatti, C. I., Nicholas, K., Fedele, G., Delforge, D., Speybroeck, N., Moraga, P., et al. (2024). Global hotspots of climate-related disasters. Int. J. Disaster Risk Reduct. 108:104488. doi: 10.1016/j.ijdrr.2024.104488
Emediegwu, L. E., Wossink, A., and Hall, A. (2022). The impacts of climate change on agriculture in Sub-Saharan Africa: a spatial panel data approach. World Dev. 158:105967. doi: 10.1016/j.worlddev.2022.105967
Engle, R. F., and Granger, C. W. J. (1987). Co-integration and error correction: representation, estimation, and testing. Econometrica 55, 251–276. doi: 10.2307/1913236
Food and Agriculture Organization (2023). Sri Lanka | Economic and policy analysis of climate change | Food and Agriculture Organization of the United Nations. Available online at: https://www.fao.org/in-action/epic/countries/ika/en/ (accessed July 12, 2023).
Guo, H., Xia, Y., Jin, J., and Pan, C. (2022). The impact of climate change on the efficiency of agricultural production in the world's main agricultural regions. Environ. Impact Assess. Rev. 97:106891. doi: 10.1016/j.eiar.2022.106891
Herath, G., Hasanov, A., and Park, J. (2020). “Impact of climate change on paddy production in Malaysia: Empirical analysis at the national and state level experience,” in Proceedings of the Thirteenth International Conference Management Science and Engineering Management. (Springer: New York), 656–664. doi: 10.1007/978-3-030-21248-3_48
Jayasooriya, S. P. (2022). Climate change adaptation and production risks among paddy farmers in Sri Lanka. Sri Lanka J. Econ. Res. 10, 91–111. doi: 10.4038/sljer.v10i1.176
Joseph, M., Moonsammy, S., Davis, H., Warner, D., Adams, A., and Oyedotun, T. D. T. (2023). Modelling climate variabilities and global rice production: a panel regression and time series analysis. Heliyon 9:e15480. doi: 10.1016/j.heliyon.2023.e15480
Kassam, A. (2003). “Rice almanac: source book for the most important economic activity on earth,” in Experimental Agriculture eds. J. L. Maclean, D. C. Dawe, B. Hardy and G. P. Patel (Los Banos, Philippines: IRRI (2002) with WARDA, CIAT and FAO, Pp. 253, No Price Quoted. ISBN 971-22-0172-4), 337–337. doi: 10.1017/S0014479703261330
Kumar, P., Sahu, N. C., Kumar, S., and Ansari, M. A. (2021). Impact of climate change on cereal production: evidence from lower-middle-income countries. Environ. Sci. Pollut. Res. 28, 51597–51611. doi: 10.1007/s11356-021-14373-9
Lee, C.-C., Zeng, M., and Luo, K. (2024). How does climate change affect food security? Evidence from China. Environ. Impact Assess. Rev. 104:107324. doi: 10.1016/j.eiar.2023.107324
Li, C. (2023). Climate change impacts on rice production in Japan: a Cobb-Douglas and panel data analysis. Ecol. Indic. 147:110008. doi: 10.1016/j.ecolind.2023.110008
Lobell, D. B., Burke, M. B., Tebaldi, C., Mastrandrea, M. D., Falcon, W. P., and Naylor, R. L. (2008). Prioritizing climate change adaptation needs for food security in 2030. Science 319, 607–610. doi: 10.1126/science.1152339
Marambe, B., Punyawardena, R., Silva, P., Premalal, S., Rathnabharathie, V., Kekulandala, B., et al. (2015). “Climate, climate risk, and food security in Sri Lanka: need for strengthening adaptation strategies,” in Handbook of Climate Change and Agroecosystems: The Agricultural Model Intercomparison and Improvement Project (AgMIP), Vol. 2 (Berlin: Springer), 1759–1789. doi: 10.1007/978-3-642-38670-1_120
Menike, L. M. C. S., and Arachchi, K. A. G. P. K. (2016). Adaptation to climate change by smallholder farmers in rural communities: evidence from Sri Lanka. Procedia Food Sci. 6, 288–292. doi: 10.1016/j.profoo.2016.02.057
Mereu, V., Gallo, A., Trabucco, A., Carboni, G., and Spano, D. (2021). Modeling high-resolution climate change impacts on wheat and maize in Italy. Clim. Risk Manag. 33:100339. doi: 10.1016/j.crm.2021.100339
Nasrullah, M., Rizwanullah, M., Yu, X., Jo, H., Sohail, M. T., and Liang, L. (2021). Autoregressive distributed lag (ARDL) approach to study the impact of climate change and other factors on rice production in South Korea. J. Water Clim. Change 12, 2256–2270. doi: 10.2166/wcc.2021.030
Park, J. Y. (1992). Canonical cointegrating regressions. Econometrica 60, 119–143. doi: 10.2307/2951679
Pesaran, M. H., Shin, Y., and Smith, R. J. (2001). Bounds testing approaches to the analysis of level relationships. J. Appl. Econom. 16, 289–326. doi: 10.1002/jae.616
Phillips, P. C. B., and Hansen, B. E. (1990). Statistical inference in instrumental variables regression with I(1) processes. Rev. Econ. Stud. 57, 99–125. doi: 10.2307/2297545
Pickson, R. B., He, G., and Boateng, E. (2022). Impacts of climate change on rice production: evidence from 30 Chinese provinces. Environ. Dev. Sustain. 24, 3907–3925. doi: 10.1007/s10668-021-01594-8
Rathnayake, R., Sahibdeen, S., Udawela, K., Weebadde, C., Weerakoon, W., and Sooriyapathirana, S. (2020). Application of Pedimap: a pedigree visualization tool to facilitate the decisioning of rice breeding in Sri Lanka. Sci. Rep. 10:14255. doi: 10.1038/s41598-020-71260-y
Ratnasiri, S., Walisinghe, R., Rohde, N., and Guest, R. (2019). The effects of climatic variation on rice production in Sri Lanka. Appl. Econ. 51, 4700–4710. doi: 10.1080/00036846.2019.1597253
Ratnayake, S. S., Reid, M., Larder, N., Kadupitiya, H. K., Hunter, D., Dharmasena, P. B., et al. (2023). Impact of climate change on paddy farming in the village tank cascade systems of Sri Lanka. Sustainability 15:9271. doi: 10.3390/su15129271
Rayamajhee, V., Guo, W., and Bohara, A. K. (2021). The impact of climate change on rice production in Nepal. Econ. Disasters Clim. Change 5, 111–134. doi: 10.1007/s41885-020-00079-8
Samaraweera, W. G. R. L., Dharmadasa, R. A. P. I. S., Kumara, P. H. T., and Bandara, A. S. G. S. (2024). Evidence of climate change impacts in Sri Lanka – a review of literature. Sri Lanka J. Econ. Res. 11(2). doi: 10.4038/sljer.v11i2.205
Sarker, M. A. R., Alam, K., and Gow, J. (2014). Assessing the effects of climate change on rice yields: an econometric investigation using Bangladeshi panel data. Econ. Anal. Policy 44, 405–416. doi: 10.1016/j.eap.2014.11.004
Shin, Y., Yu, B., and Greenwood-Nimmo, M. (2013). Modelling Asymmetric Cointegration and Dynamic Multipliers in a Nonlinear ARDL Framework. Rochester, NY: SSRN Scholarly Paper. doi: 10.1007/978-1-4899-8008-3_9
Singh, S. (2020). Farmers' perception of climate change and adaptation decisions: a micro-level evidence from Bundelkhand region, India. Ecol. Indic. 116:106475. doi: 10.1016/j.ecolind.2020.106475
Solaymani, S. (2023). Impacts of environmental variables on rice production in Malaysia. World 4, 450–466. doi: 10.3390/world4030028
Stock, J. H., and Watson, M. W. (1993). A simple estimator of cointegrating vectors in higher order integrated systems. Econometrica 61, 783–820. doi: 10.2307/2951763
Suresh, K., Wilson, C., Khanal, U., Managi, S., and Santhirakumar, S. (2021). How productive are rice farmers in Sri Lanka? The impact of resource accessibility, seed sources and varietal diversification. Heliyon 7:e07398. doi: 10.1016/j.heliyon.2021.e07398
Tan, B. T., Fam, P. S., Radin Firdaus, R. B., Tan, M. L., and Gunaratne, M. S. (2021). Impact of climate change on rice yield in Malaysia: a panel data analysis. Agriculture 11:569. doi: 10.3390/agriculture11060569
Thevakaran, A., Suppiah, R., and Sonnadara, U. (2019). Trends in extreme rainfall events in Sri Lanka, 1961–2010. J. Natl. Sci. Found. Sri Lanka 47, 285–295. doi: 10.4038/jnsfsr.v47i3.9280
United States Department of Agriculture Foreign Agricultural Service (2023). USDA, Foreign Agricultural Service. Available online at: https://apps.fas.usda.gov/newgainapi/api/Report/DownloadReportByFileName?fileName=Grain%20and%20Feed%20Annual_New%20Delhi_Sri%20Lanka_03-27-2021 (accessed July 20, 2023).
Wang, W., Yuan, S., Wu, C., Yang, S., Zhang, W., Xu, Y., et al. (2021). Field experiments and model simulation based evaluation of rice yield response to projected climate change in Southeastern China. Sci. Total Environ. 761:143206. doi: 10.1016/j.scitotenv.2020.143206
Warsame, A. A., Sheik-Ali, I. A., Ali, A. O., and Sarkodie, S. A. (2021). Climate change and crop production nexus in Somalia: An empirical evidence from ARDL technique. Environ. Sci. Pollut. Res. 28, 19838–19850. doi: 10.1007/s11356-020-11739-3
World Bank (2021). Climate risk country profile: Sri Lanka and ADB. World Bank. Available online at: https://climateknowledgeportal.worldbank.org/sites/default/files/2021-09/15602-WB_Sri%20Lanka%20Country%20Profile-WEB.pdf (accessed November 16, 2023).
World Bank Climate Change Knowledge Portal (2023). World Bank Climate Change Knowledge Portal. Available online at: https://climateknowledgeportal.worldbank.org/ (accessed January 21, 2025).
Zhang, Q., Akhtar, R., Saif, A. N. M., Akhter, H., Hossan, D., Alam, S. M. A., et al. (2023). The symmetric and asymmetric effects of climate change on rice productivity in Malaysia. Heliyon 9:e16118. doi: 10.1016/j.heliyon.2023.e16118
Keywords: ARDL, climate change, rice production, NARDL, Sri Lanka
Citation: Samarasinghe BKDJR, Zhu Y, Abeynayake NR, Zeng X, Mathavan B, Wanninayake RWWMPK, Rasheed S and Bah AS (2025) Climate change and rice production in Sri Lanka: short-run vs. long-run symmetric and asymmetric effects. Front. Sustain. Food Syst. 9:1592542. doi: 10.3389/fsufs.2025.1592542
Received: 12 March 2025; Accepted: 16 April 2025;
Published: 09 May 2025.
Edited by:
Roberto Valdivia, Oregon State University, United StatesReviewed by:
Józef Ober, Silesian University of Technology, PolandFaten Derouez, King Faisal University, Saudi Arabia
Copyright © 2025 Samarasinghe, Zhu, Abeynayake, Zeng, Mathavan, Wanninayake, Rasheed and Bah. This is an open-access article distributed under the terms of the Creative Commons Attribution License (CC BY). The use, distribution or reproduction in other forums is permitted, provided the original author(s) and the copyright owner(s) are credited and that the original publication in this journal is cited, in accordance with accepted academic practice. No use, distribution or reproduction is permitted which does not comply with these terms.
*Correspondence: Yuchun Zhu, emh1eXVjaHVuQG53YWZ1LmVkdS5jbg==