 Weiguo Jiang
 Chen Chen
- School of Public Adiministration and Law, Hunan Agricultural University, Changsha, China
Under the dual goals of the “dual carbon” and digital rural development strategies, giving full play to the role of rural digitalization to enhance the carbon emission efficiency of agriculture is of great significance to the green and sustainable development of agriculture. Based on the panel data of 30 provinces in China from 2011 to 2022, dynamic spatial Durbin and threshold effect models were used to demonstrate the impact of rural digitalization on agricultural carbon emission efficiency. The results show that: (1) Both of the agricultural carbon emission efficiency and the level of rural digitalization in all provinces in China show a steady upward trend. During the study period, the agricultural carbon emission efficiency in the central region improved the fastest, as well as the rural digitalization level in the western region; (2) Rural digitalization has a significant positive promoting effect on agricultural carbon emission efficiency, and this promoting effect has a spatial spillover effect. Digital development in neighboring rural areas will also improve the carbon efficiency of agriculture in the region. The direct effect is the strongest in the central region, and the spillover effect of the eastern region is the most prominent; (3) The impact of rural digitization on agricultural carbon emissions efficiency has a threshold characteristic. With the improvement of rural digitalization, the promoting effect on agricultural carbon emissions efficiency is more significant. Among the four regions, the threshold value of the rural digital level is the lowest in the eastern region, while in the western region has the highest threshold value. The results of this study provide useful insights for promoting rural digital development, improving agricultural carbon emission efficiency, and promoting agricultural green development.
1 Introduction
According to the Food and Agriculture Organization (FAO) of the United Nations, the amount of greenhouse gases (GHGs) released from agricultural land exceeds 30% of the total global anthropogenic GHG emissions, which is equivalent to generating 15 billion tons of carbon dioxide per year (Huang et al., 2019). The agricultural carbon emission efficiency is not prominent compared with that of total industrial carbon emissions, but the source of agricultural carbon emissions is more complex, and agricultural carbon emission efficiency accompanied by the high growth of agricultural production has been increasing (Liu et al., 2024). It is predicted that global agricultural GHG emissions may increase by 58% in 2050, making it the most difficult carbon emission source to control (Gao et al., 2024; Zhang et al., 2024). Extreme weather triggered by greenhouse gas emissions has profoundly affected the survival and development of human beings and has become a major challenge common worldwide. Among them, the intensity of agricultural carbon emission efficiency has also gradually increased with the rapid development of agricultural production, becoming the second largest source of greenhouse gas emissions. On the other hand, the complexity of agricultural carbon emission sources, involving the use of agricultural machinery, fertilizer application, animal husbandry development, and other aspects, increases the difficulty of controlling carbon emission sources (Zheng et al., 2024). Therefore, a global consensus has been reached to mitigate climate change by reducing agricultural carbon emissions.
Since the reform and opening up, China has made remarkable achievements in agricultural development. According to statistics, China’s total grain output increased from 430.7 million tons in 2003 to 706.5 million tons in 2024, achieving 21 consecutive years of growth. In spite of this, the green development of China’s agriculture still faces serious challenges. In the process of the rapid development of agricultural modernization, the large consumption of fossil energy, the excessive use of pesticides, and the irrational use of agricultural waste have led to serious agricultural non-point source pollution and carbon emission (Zhang and Liu, 2024). As a traditional agricultural country, agriculture has now become the second largest source of greenhouse gas emission in China. Therefore, how to explore the low-carbon transformation and green development of agriculture under the background of “dual carbon” strategy has become an important issue facing the current society (Li et al., 2024).
Agricultural carbon emission efficiency (ACEE) refers to the ratio of the minimum carbon emission that can be realized by agricultural production activities to the actual carbon emission under the conditions of given expected output and input factors. The higher the actual carbon emission, the lower the agricultural carbon emission efficiency, which is closely related to agricultural production input factors and output. Under the framework of the “two-carbon” strategy, improving agricultural carbon emission efficiency is not only an inevitable requirement to achieve the goal of carbon peak carbon neutrality but also the core path to break the constraints of agricultural resources and environment and build a modern ecological agriculture system.
Research studies showed that although China’s total agricultural carbon emission efficiency has raised in a fluctuating trend, their growth rate has slowed down significantly. In recent years, it has even been on a downward trend, and agricultural carbon emission efficiency has been significantly improved in most provinces (Yao et al., 2024). However, FAO data show that China’s total agricultural carbon emission efficiency in 2019 was 782,839,100 tons, still the world’s largest agricultural carbon emission efficiency country. In this context, it is necessary to further improve the agricultural carbon emission efficiency to facilitate the low-carbon transformation of agricultural production.
At the same time, the Chinese government attaches great importance to the construction of digital countryside, has issued the “Digital rural Development Strategy Outline,” “Digital rural Development Action Plan (2022–2025)” and other policies, document No. 1 of the CPC Central Committee in 2023 also proposed to in-depth implementation of digital rural development actions, to promote the development of digital application scenarios. Rural digitalization refers to the process of systematically reconstructing agricultural production mode, rural governance mode, and farmers’ lifestyle through the deep integration of new generation information technology (such as big data, Internet of Things, artificial intelligence, and 5G) with agricultural and rural economy and society. Its core is to use data as a key production factor to promote the comprehensive digital transformation of rural infrastructure, industrial system, public services, and ecological protection and ultimately achieve the strategic goals of bridging the urban–rural digital divide, accelerating agricultural modernization and sustainable rural development. Through the deep integration of digital technology and agricultural and rural systems, rural digital development is reshaping the improvement path of agricultural carbon emission efficiency. As the core carrier of rural digitalization, the wide application of intelligent monitoring equipment and agricultural big data platform not only realizes the accurate control of farmland water and fertilizer, the optimization of agricultural machinery operation path, and the whole process management of waste resource utilization but also significantly reduces the energy consumption and greenhouse gas emission intensity per unit output through dynamic carbon emission monitoring and traceability analysis (Guo et al., 2022).
In view of improving the agricultural carbon emission efficiency, scholars have proposed that agricultural carbon trading markets can be established land-use change (Ryan and Tiffany, 1998) and reasonable setting of standard price of agricultural tax (Murray, 2004), so as to reduce agricultural non-point source pollution and improve agricultural carbon emission efficiency. In recent years, scholars have also begun to conduct in-depth studies on the impact of agricultural economic development (Khan et al., 2021; Huang et al., 2019), agricultural technology progress (Sun, 2022), and agricultural comprehensive development investment (Chu et al., 2024) on agricultural carbon emission efficiency and put forward targeted strategies to promote the improvement of agricultural carbon emission efficiency.
In view of the environmental effects of the application of digital technology, some scholars believe that the rapid development of digital economy will promote the increase in energy consumption such as electricity, thus leading to the growth of carbon emissions (Hamdi et al., 2014). Some other scholars hold the opposite view, believing that the application of digital technology can improve production efficiency and technological innovation level, enhance the public’s concern for the environment, and thus inhibit carbon emissions (Zhang et al., 2024). In addition, some scholars believe that the impact of digital technology on carbon emissions is non-linear, and the two show an inverted U-shaped relationship of “first increase and then decrease” (Li et al., 2024). Liu (2019) took the lead in introducing digitalization into the field of agricultural production, believing that digital development may reduce agricultural carbon emission efficiency. Tian et al. (2024) found through their research that digital development in agriculture and rural areas can significantly reduce the carbon emission level of grain cultivation, but at the same time, there are obvious spatial differences.
At present, research studies on rural digitalization and agricultural carbon emission efficiency mainly focus on the following three aspects: (1) Research on the development of rural digitalization and agricultural green transformation. One view holds that rural digitalization can promote the improvement of rural human capital by optimizing rural communication infrastructure and improving rural residents’ awareness of modern information technology, so as to further promote the wide application of green agricultural technology in agricultural production process (Lu et al., 2024a). Another view is that smart agriculture, precision agriculture, and other new agricultural development models based on digital technology have accelerated the flow of production factors such as labor, capital, and information technology and reconstructed the structure and spatial organization of rural production factors (Han et al., 2018; Qaim, 2020; Sun, 2022). It will help accelerate the transformation of agricultural production mode and promote the green transformation of agricultural development (Zhang et al., 2024). (2) Research on rural digitalization and agricultural green total factor productivity. Some scholars believe that rural digitalization can improve agricultural green total factor productivity and reduce agricultural input–output ratio by promoting agricultural scale management, alleviating resource factor mismatch, and promoting green technology progress (Liu et al., 2021; Lu et al., 2024a). At the same time, rural digitalization can also have a positive impact on the agricultural green total factor productivity in the surrounding areas through the spatial spillover effect. (3) Research on the development of modern agriculture and efficiency. Existing literature has analyzed the impact of modern agricultural development on agricultural carbon emission efficiency from the perspectives of agricultural mechanization degree, agricultural industry agglomeration, agricultural land management scale, and agricultural insurance (Guan et al., 2023; Sun, 2022). A basic consensus has been reached that technological progress has an important positive impact on agricultural carbon reduction. It can be seen from the existing studies that there are abundant studies on the impact of rural digitalization on the green development of agriculture and the impact of modern agriculture on agricultural carbon emission efficiency.
However, existing research studies on the relationship between rural digitalization (RUD) and agricultural carbon emission efficiency (ACEE) are still in the initial stage, and the spatial effect of rural digitalization on agricultural carbon emission efficiency has not been considered. In addition, most of the existing studies are based on a static perspective, ignoring the dynamic change of carbon emissions. Based on the panel data from 2011 to 2022, this study first calculated the rural digitization level and agricultural carbon emission efficiency and analyzed the change trend of the two during the study period. Then, based on the dynamic spatial econometric model, the impact of rural digitalization on agricultural carbon emission efficiency was analyzed. Then, a dynamic threshold effect regression model was constructed to analyze the non-linear impact of rural digitalization on agricultural carbon emission efficiency, aiming to provide scientific basis and theoretical reference for low-carbon agricultural development.
Therefore, the marginal contribution of this study is shown in the following aspects: First, the impact of rural digitalization on agricultural carbon emission efficiency is demonstrated through empirical analysis, which provides a new perspective for exploring the factors that may affect the green development of agriculture. Second, most studies focus on the impact of rural digital development on regional industrial economic development, while this study focuses on the environmental impact of rural digital development, which is conducive to expanding the scope of research on the impact of rural digital development. Third, the spatial Durbin model and threshold effect model were used to verify the spatial spillover and non-linear effects of rural digitalization on agricultural carbon emission efficiency, which is conducive to scientifically explaining the influence and characteristics of rural digitalization on agricultural carbon emission efficiency.
2 Theoretical analysis and research hypotheses
Digital technologies have successfully changed the agricultural carbon emissions landscape through infrastructure, structural optimization, technological innovation efficiency, and resource allocation effects. Agricultural carbon emission efficiency refers to the ratio between the minimum carbon emission that can be realized by agricultural production activities and the actual carbon emission under the given conditions of expected output and input factors. The greater the actual carbon emission, the lower the agricultural carbon emission efficiency, which is closely related to agricultural input and output factors (Chen et al., 2024). Under the framework of Cobb–Douglas production function, traditional agricultural production relies on the linear combination of labor, capital, and technology, while the intervention of digital technology breaks through this static paradigm and reshapes production logic through factor virtualization and network synergy (Oenema, 2020). As a new production factor, digital technology not only expands the production boundary in the form of independent multiplier but also reconstructs the function mechanism of traditional factors through data flow (Jin et al., 2024). They will affect the expected output and unexpected output of agriculture at the same time and then affect the efficiency of agricultural carbon emission. In addition, the digital economy is more likely to break through geographical space boundaries, and its impact on agricultural carbon emission efficiency will also spill over to other regions, forming a spatial spillover effect. Therefore, this study starts with the development of rural digitalization and builds a theoretical analysis framework on how rural digitalization affects agricultural carbon emission efficiency on the basis of the application status of digital technology.
2.1 Influence mechanism of rural digitalization on agricultural carbon emission efficiency
With the improvement of rural digitization level, digital elements have gradually become the key elements of rural production activities. They can optimize the original factor allocation structure on the basis of big data, promote the digital transformation of traditional agricultural production, improve the efficiency of agricultural resource utilization, change the extensive production mode, and improve the efficiency of agricultural carbon emissions. First of all, according to the Environmental Kuznets Curve (EKC), the extensive development of traditional agriculture leads to rising carbon emissions, whereas digital technologies such as smart agricultural machinery and agricultural IoT enable agricultural production to surpass the EKC turning point through precision fertilization, real-time monitoring, and resource optimization (Zhang et al., 2022; Wang et al., 2024b). This drives a “win–win” scenario where crop yields increase while carbon intensity decreases. Digital technology uses big data, Internet of things, and other technologies to carry out accurate research and judgment on other input factors in agricultural production activities, update agricultural data in real time through sensors, drones, climate monitoring, and other equipment, and help farmers make more scientific production decisions through intelligent algorithms (Zheng et al., 2024). Second, digital technology is conducive to the realization of modern agricultural management through intelligent agricultural machinery, the realization of automated farming, precision irrigation, scientific fertilization, and other agricultural production work and effectively avoid the risk of excessive land reclamation, land degradation, and waste of natural resources caused by excessive fertilizer (Yang et al., 2022). Therefore, the degree of rural digital development will drive the level of agricultural technology, along with the continuous improvement of agricultural production efficiency and the growth of agricultural economy. Through the interaction of various elements, agricultural production is moving toward green and sustainable development, gradually forming a green and low-carbon agricultural industry, creating new types of employment, increasing employment opportunities for rural labor, improving agricultural carbon emission efficiency, and forming a virtuous cycle.
Thus, Hypothesis 1 is proposed: Rural digital development can promote agricultural carbon emission efficiency.
2.2 Spatial spillover effects of rural digital on agricultural carbon emission efficiency
Digital technology is non-competitive and replicable, and digital innovation in core regions can radiate to neighboring regions through technology imitation, knowledge sharing, or industrial chain coordination. For example, after digital planting patterns are replicated across regions, the redundancy of agricultural inputs in multiple places can be reduced simultaneously (Lu et al., 2024a). At the same time, digital platforms break geographical barriers and promote the cross-domain flow of labor, capital, and other factors, such as developed regions through e-commerce networks to transmit low-carbon agricultural standards to less developed regions, forcing the latter to optimize production processes. In addition, carbon emissions are spatially related, and the transformation of energy structure caused by digitization in one place (such as the popularization of photovoltaic agriculture) can affect the carbon balance of surrounding areas through regional power networks or ecological compensation mechanisms (Guo et al., 2022). The research also shows that the strengthening effect of environmental regulation generated by the application of digital technology will form regional linkage governance through inter-governmental policy learning (Zhou et al., 2023).
In short, the impact of rural digitalization on agricultural carbon emission efficiency forms a spatial spillover through three dimensions of peer effect, learning effect, and diffusion effect: The peer effect is manifested as the “demonstration-imitation” cycle in the geographic neighboring regions. The digital technology leading regions form a visual emission reduction paradigm through shared platforms (such as the intelligent agricultural machinery cross-regional cooperation system), which promotes the technological replication and institutional benchmarking in the neighboring regions, and reduces the trial-and-error cost of low-carbon transition (Xiong and Zhou, 2024). The learning effect relies on the cross-regional knowledge network, and the implicit experience (such as the practice of digital soil testing formula) is coded and spread through the agricultural technology extension system, enterprise alliance, and other channels, while the explicit knowledge (such as AI bug warning algorithm) is cross-domain integration through the open data interface to improve the absorption capacity of global emission reduction technology (Lu et al., 2024b). The diffusion effect follows the “core-edge” level penetration logic, and digital infrastructure hub areas (such as national agricultural science and technology parks) radiate technical standards to the edge areas through industrial chain digitization (such as blockchain traceability system), while policy dividends are transmitted top-down through administrative levels (provincial-city-county), forming synergy on emission reduction scale.
On this basis, the Hypothesis 2 is proposed: Rural digitization has a spatial spillover effect on agricultural carbon emission efficiency.
2.3 Non-linear threshold characteristics of rural digitization on agricultural carbon emission efficiency
In the early stage of digitalization, due to weak infrastructure, lack of digital skills of farmers, and high cost of technology application, digital technology is difficult to deeply embed in the agricultural production system, resulting in its function of optimizing resource allocation and replacing high-carbon elements cannot be effectively released (Zhang et al., 2018). For example, due to the lack of equipment operation capacity or financial support, small-scale farmers are difficult to digest the fixed investment of intelligent agricultural machinery, remote sensing monitoring, and other technologies, and digitalization only stays in shallow applications such as information transmission, which cannot trigger substantial carbon reduction behavior (Zhou et al., 2023). With the increase in digitization level, the marginal cost of technology application decreases, and agricultural production entities can rely on digital platforms to integrate land, labor, and other factors, accurately match water and fertilizer needs, and optimize agricultural machinery scheduling, thus significantly reducing energy and chemical consumption per unit output (Song et al., 2022). In addition, after the digitalization level is improved, the data interoperability of the upstream and downstream of the agricultural industry chain is enhanced, which promotes the formation of a “technology-organization-market” collaborative carbon reduction mechanism, and further amplifies the emission reduction effect, which is shown in Figure 1. Therefore, Hypothesis 3 is proposed: There is a non-linear characteristic of the impact of rural digitization on the carbon emission efficiency of agriculture.
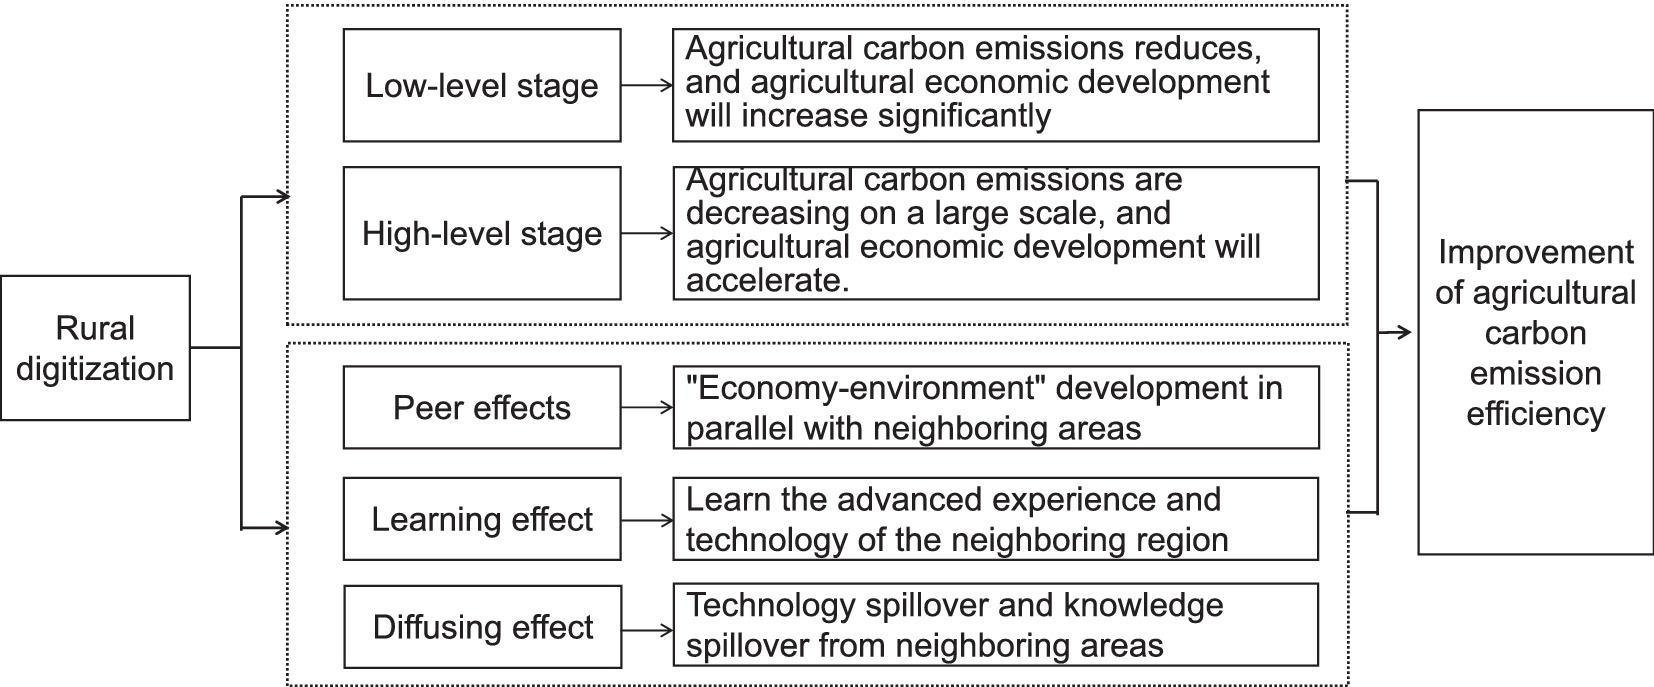
Figure 1. Influence mechanism of rural digitalization on agricultural carbon emission efficiency.
3 Variable selection, model construction, and data sources
3.1 Variable selection
3.1.1 The explained variable
Agricultural carbon emission efficiency (ACEE) is the explained variable in the empirical study. Agricultural carbon emission efficiency is commonly calculated by the Data Envelopment Analysis (DEA), to overcome the deficiency of neglecting the relaxation of input and output variables in the traditional DEA method. Based on research of Liu et al. (2021), the super-efficiency SBM model is used to effectively measure ACEE. Input and output indicators were selected based on the study of Chen et al. (2024), and an evaluation indicator system for agricultural carbon emission efficiency was established as shown in Table 1. Among them, the input indicators include agricultural fixed capital stock, crop sown area, primary industry employees, fertilizer application amount, pesticide use amount, agricultural film use amount, and agricultural machinery input. The agricultural fixed capital stock is calculated based on the research of Lu et al. (2024b). The desirable output indicator is the total output value of agriculture, forestry, animal husbandry, and fishery, and the undesirable output indicator is the agricultural carbon emission.
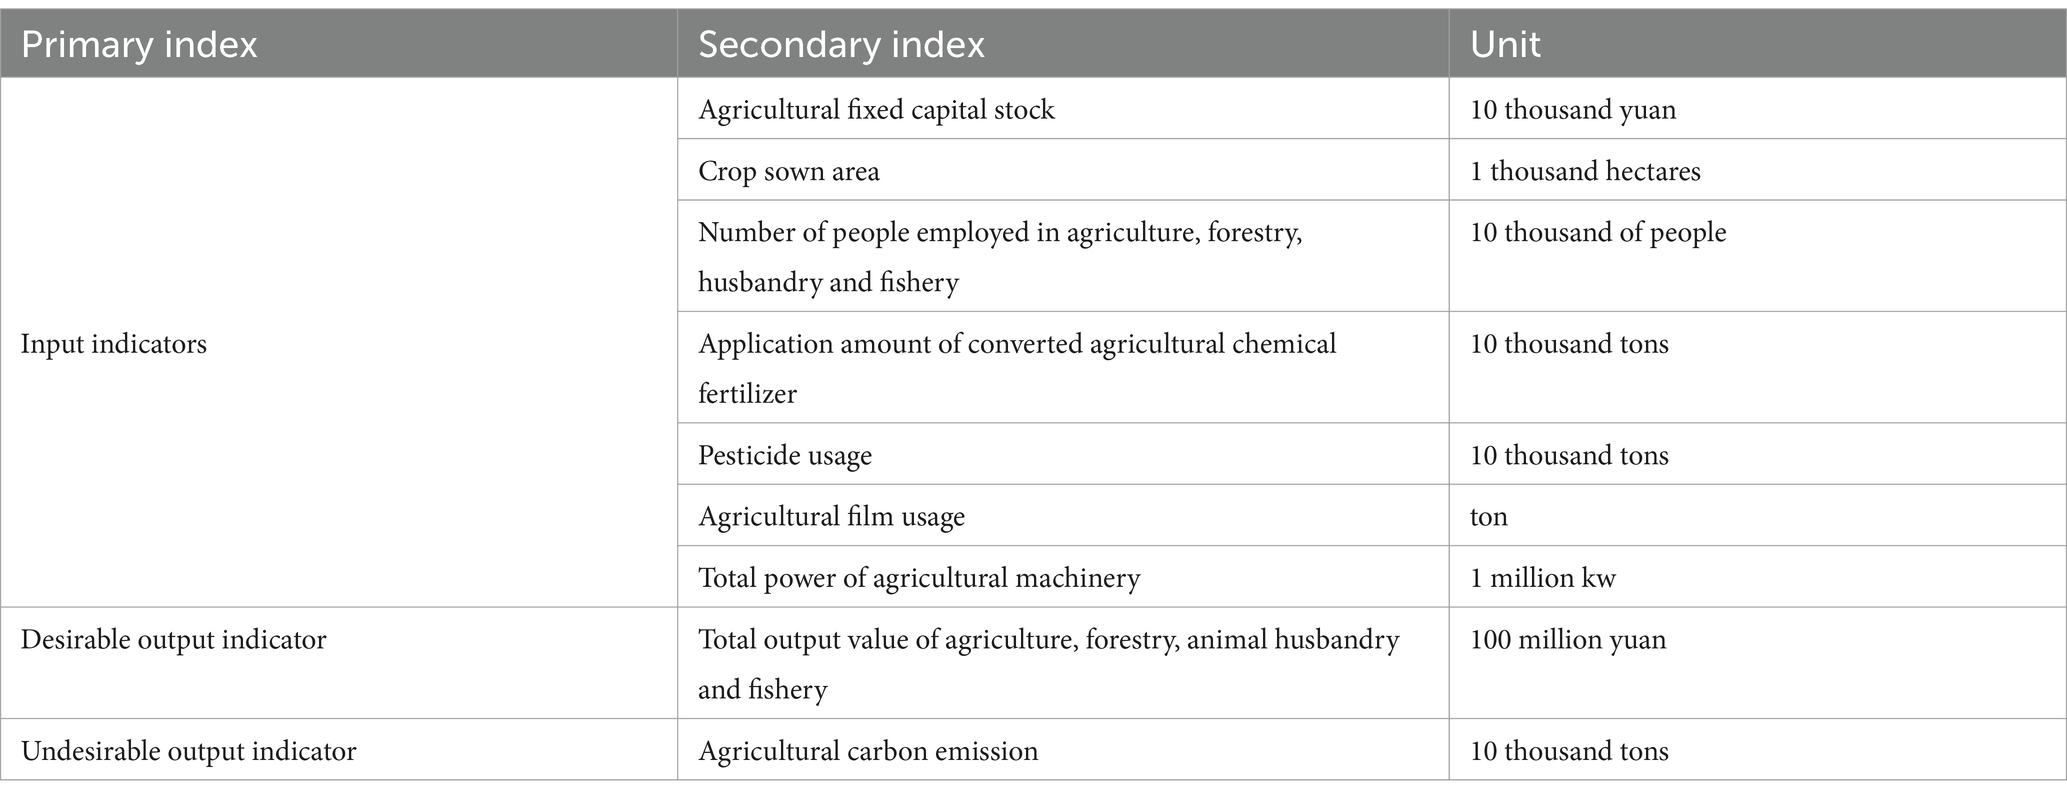
Table 1. Measuring indicators of CAEE.
The total amount of agricultural carbon emissions (CAE) was measured from three aspects, namely, agricultural land use, rice cultivation, and livestock and poultry farming, with reference to the study of Guan et al. (2023). Among them, the carbon emission measurement of agricultural land refers to the research results of Tian et al. (2024), including six carbon sources: chemical fertilizer, pesticides, agricultural film, agricultural diesel oil, tillage, and irrigation. The CH4 emissions generated by rice planting were considered, and the emission coefficient referred to Han et al. (2018) and was calculated for early, medium, and late rice. Carbon emissions from livestock and poultry breeding mainly include CH4 from animal intestinal fermentation and CH4 from fecal management and N2O gas. Due to the differences in the livestock and poultry feeding cycles, the average annual feeding amount must be corrected. According to the global warming potential results and coefficients reported by IPPC, two types of greenhouse gases, namely, CH4 and N2O, are converted to equal amounts of CO2 for subsequent analytical calculations.
In Equation 1, CA is the total agricultural carbon emissions. In Equation 1, CA is the total agricultural carbon emissions, CAi represents the carbon emissions of carbon source i, and ea. represents the activity level of carbon source if, represents the carbon emission coefficient of carbon source i.
3.1.2 The core explanatory variable
As explained in the introduction, rural digitalization refers to the process of systematic reconstruction of agricultural production mode, rural governance mode, and farmers’ lifestyle through the deep integration of a new generation of information technology with agricultural and rural economy and society. According to studies of Lu et al. (2024b), AUD is measured from the three dimensions of digital infrastructure, digital innovation level, and digital industry development, according to the logic of “development foundation–development power–development achievement.” The development of digital infrastructure is reflected the Internet penetration rate in rural areas, rural information technology equipment, and rural meteorological observation services. The digital innovation level is reflected by the information technology application in rural areas, the rural consumption of digital products and services, the rural digital finance, and the rural production investment. The digital industry development is reflected by the digitizing of rural production, the digitizing of rural circulation, the digitizing of rural operations, and the rural digital industry base. All the measuring indicators are shown in Table 2. On this basis, the entropy weight method is used to determine the weight of each index.
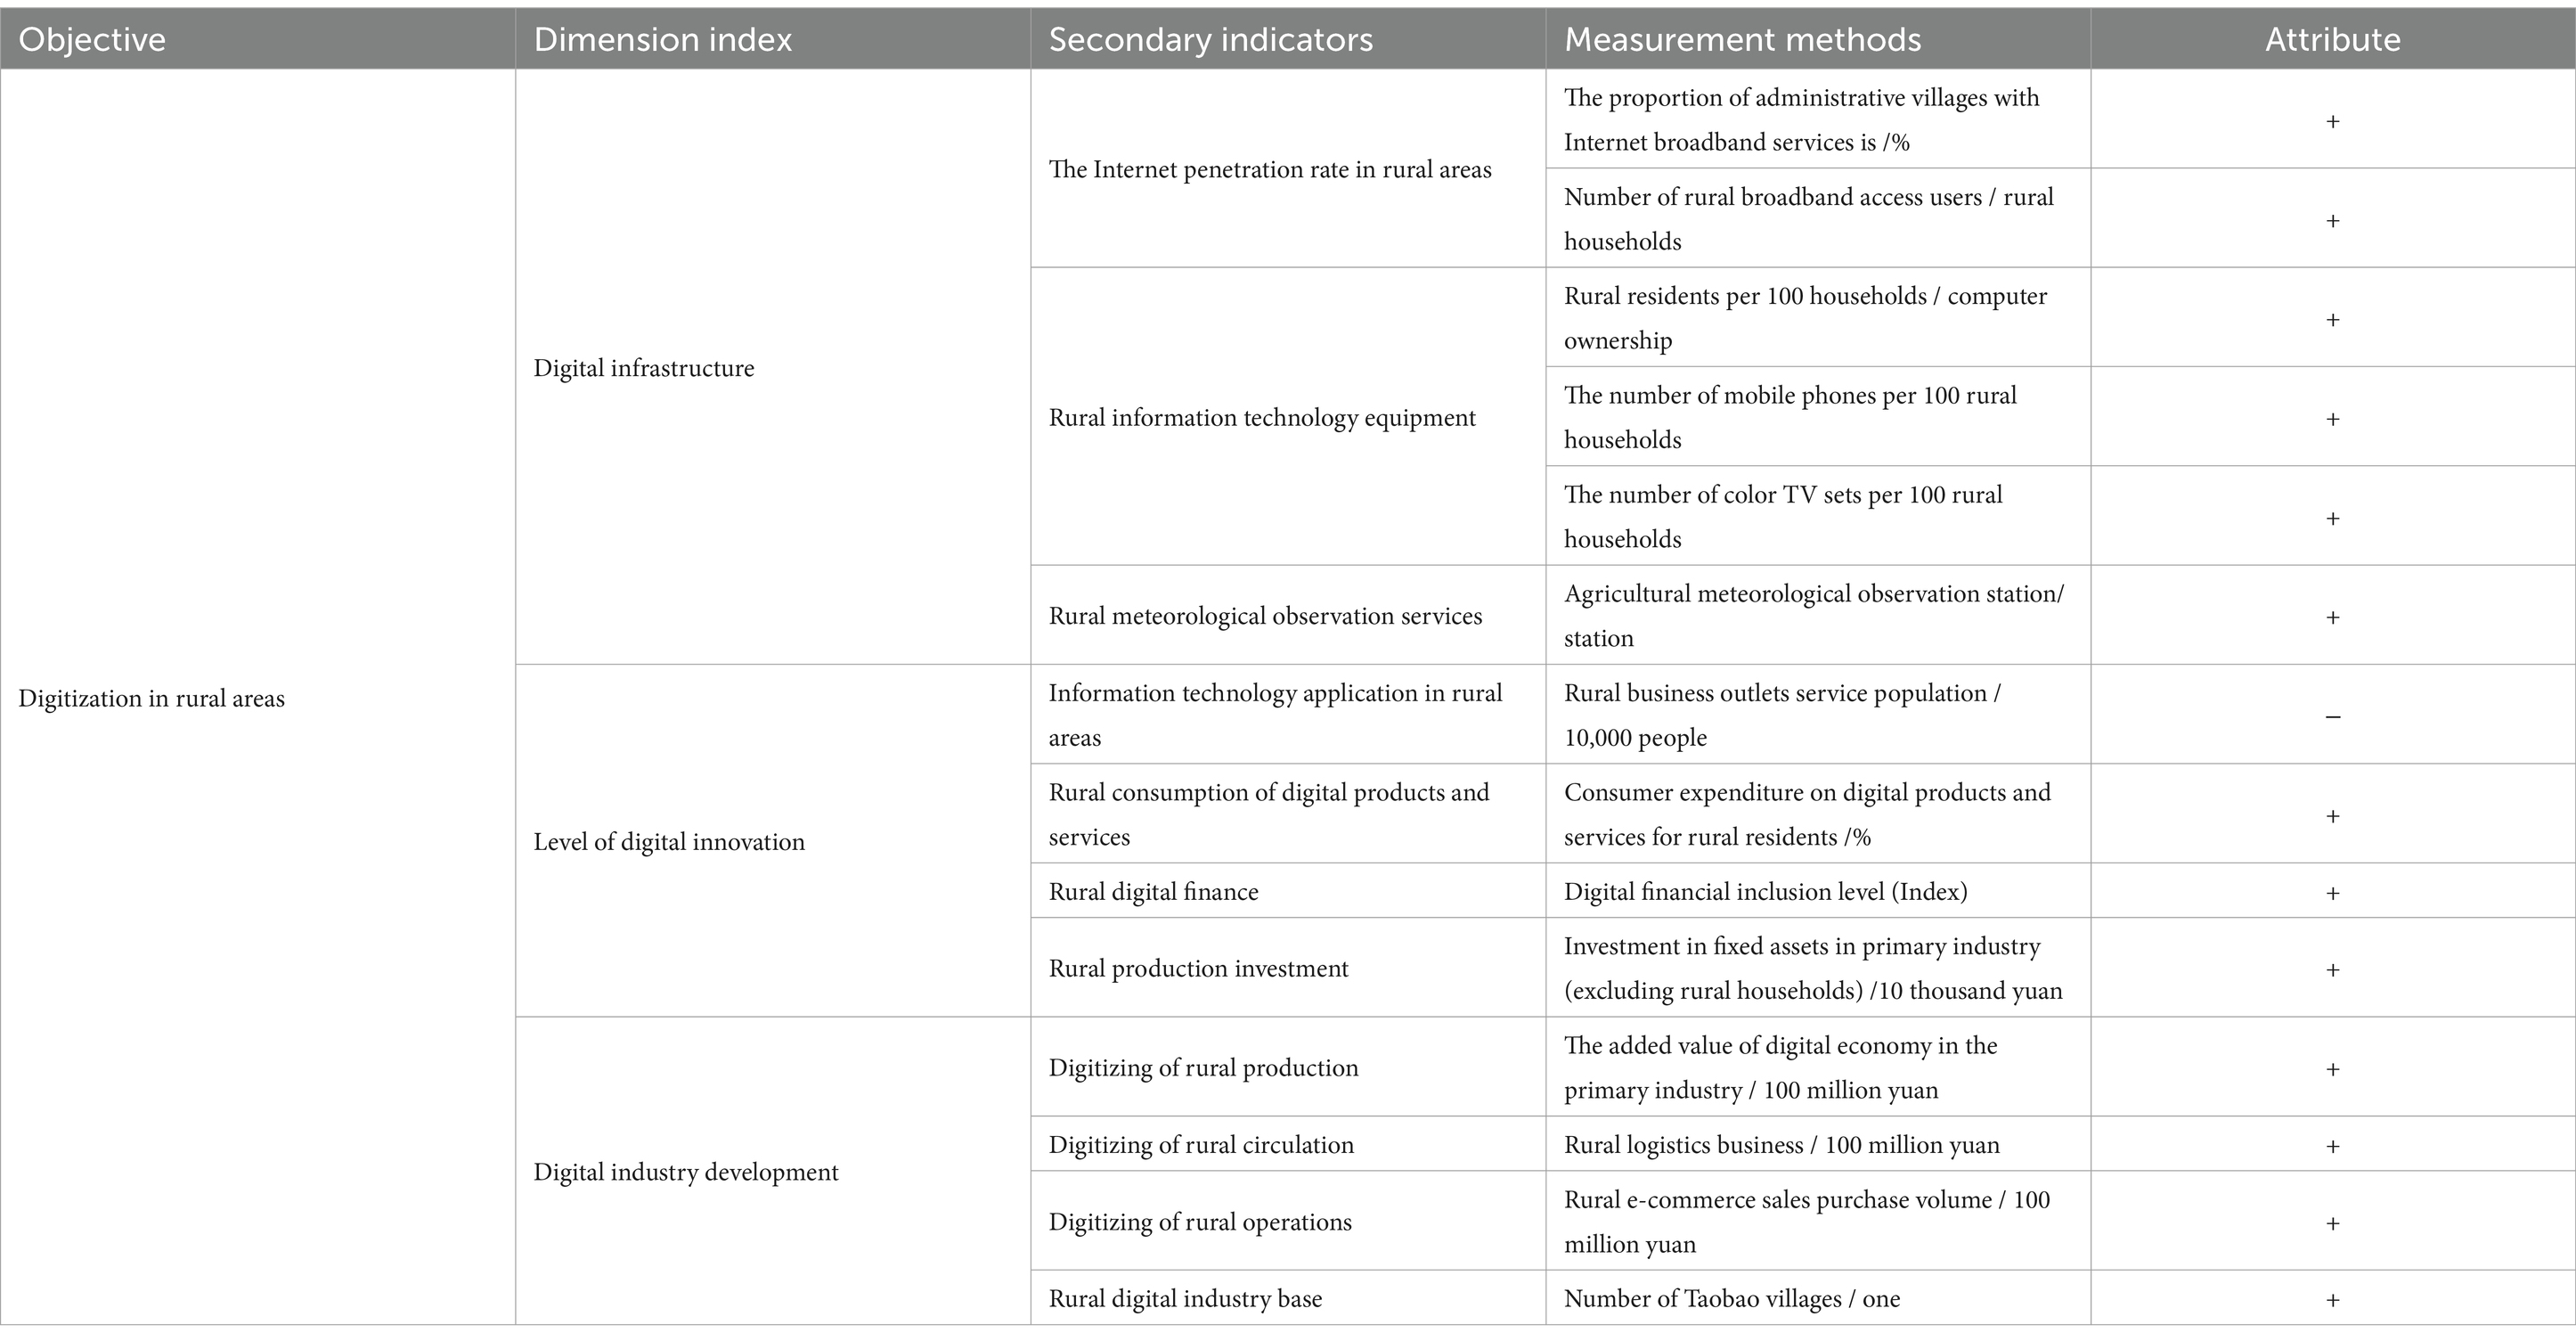
Table 2. Comprehensive evaluation index system of rural digitalization.
3.1.3 Control variables
Other variables affecting the ACEE were further controlled to alleviate the missing variable bias as much as possible. Control variables were selected as follows: ① The agricultural economic development level (pgdp) is expressed as the ratio of the added value of the primary industry to that of employees in the primary industry. ② Agricultural industrial structure (str), expressed as the ratio of the added value of the planting industry and animal husbandry to the added value of agriculture, forestry, animal husbandry and fishery, the planting industry, and animal husbandry, are the main sources of agricultural carbon emissions (Xu et al., 2022). ③ Agricultural financial support (afs) is expressed as the ratio of expenditure on agriculture, forestry, and water affairs to financial expenditure. External policy intervention by the government can affect carbon emissions (Wang et al., 2022). ④ Environmental regulation intensity (enr) is measured by the ratio of pollution control investment to GDP to reflect the local environmental regulation intensity as much as possible (Sun, 2022). ⑤ Rural human capital (edu) is measured by the average length of education in rural areas. In general, improving education can affect the marginal cost of emission reduction.
3.2 Global Moran’s I index
To better analyze the spatial spillover effect of rural digitization on agricultural carbon emissions, this study first uses the global Moran’s I index to measure the spatial autocorrelation of the rural digitization level and agricultural carbon emission efficiency. The calculation formula is as follows:
In the above (Equation 2) formula, I is the global Moran’s I index, Wij is the spatial weight matrix, X is the variable, which refers to RUD or ACEE, Xi and Xj refer to the values of the variables in the corresponding spatial units i and j, respectively, is the average of the variables, n is the total number of provinces, and i and j represent different provinces. The value range of the global Moran’s I index is [−1, 1]. When its value is greater than 0, it indicates that the variable has a positive spatial correlation. The closer the value is to 1, the more significant the spatial correlation. When the value of the Moran’s I index is less than 0, the variable has a negative spatial correlation, and the closer it is to −1, the more significant the spatial dispersion. When the value of the Moran’s I index is equal to 0, it indicates that the variable has spatial randomness.
3.3 Empirical models
3.3.1 Dynamic spatial Durbin model
The spatial Durbin model was constructed because there may be spatial dependence of both the explained variable ACEE and the explanatory variable RUD. Considering the time lag of the impact of rural digitization on agricultural carbon emissions, this study further constructed a Durbin model of dynamic space, for which the ACEE of lag one phase term is introduced in the model (ACEEi,t-1). To alleviate the possible endogeneity problems of the model, the model is constructed as follows:
In Equation 3, ACEEit and Xit represent the explained and explanatory variables (including control variables), respectively, and the subscripts i and t represent the province and year, respectively. ρ is the spatial correlation coefficient, Wij is the spatial weight matrix, β, , , and , the underestimated parameters, ui and vt represent the spatial and temporal effects, and εit represents the spatial error terms following an independent distribution. Two types of spatial weight matrices, namely, the geographic distance spatial matrix (W1) and the economic geographic nested spatial weight matrix (W2), are used for model estimation, while the economic geographic nested spatial weight matrix is used for robustness analysis.
3.3.2 Dynamic threshold effect model
According to the previous analysis, there may be a non-linear relationship between the impact of rural digitization (RUD) on agricultural carbon emissions (ACEE). At the same time, the rural digitization level should be considered the threshold variable. In view of the continuous characteristics of ACEE, ACEEi,t-1 is also added as an explanatory variable. Owing to the lack of a mature method of combining the spatial measurement model with the threshold regression model, the ordinary dynamic panel threshold regression model is finally established as follows:
In Equation 4, , , and are the threshold values, and , , and are the regression coefficients of different threshold intervals. I (·) is a schematic function, and the other variables explain the same function as Equation 3.
3.4 Data sources
Considering the availability of data, panel data for 30 provinces in China from 2011 to 2022 were used in this study (not involving Tibet, Hong Kong, Macao, and Taiwan). The data mainly come from the China Rural Statistical Yearbook, China Statistical Yearbook, China Monthly Statistical Bulletin of Agricultural Products Import and Export, China Statistical Yearbook of Population and Employment, and the provincial yearbooks of the corresponding years. The number of Taobao villages in each province comes from the report of Ali Research Institute. Some missing data were supplemented by interpolation method. The descriptive statistics for all the variables are shown in Table 3.
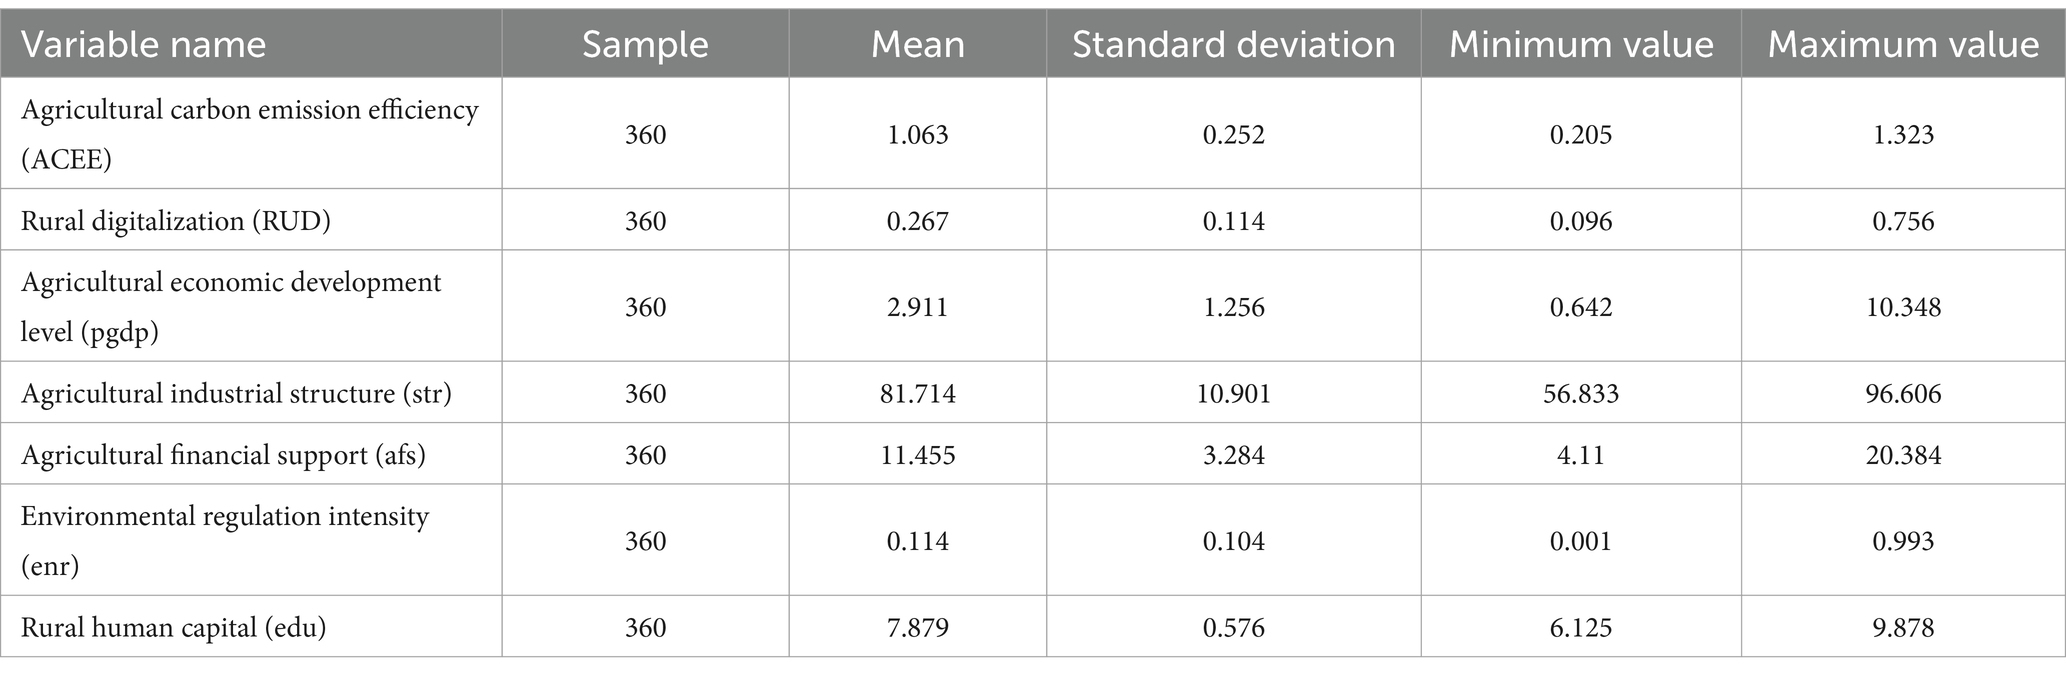
Table 3. Descriptive statistics of the variables.
3.5 Characteristics of ACEE and RUD in China
According to the results of the Super-SBM method to calculate the ACEE, the change trend of annual means ACEE in 30 provinces and four regions from 2011 to 2022 is shown in Figure 2. The annual mean of ACEE in the whole region fluctuated roughly between 0.968 and 1.192 from 2011 to 2022 and reached its maximum in 2022. In recent years, the central government has attached great importance to environmental protection, aiming at agricultural pollution, governments at all levels have formulated a series of control measures, so agricultural clean production technology has been effectively promoted. Overall, China’s ACEE showed an upward trend from 2011 to 2022, with an average annual growth rate of 1.650%. For four different regions, ACEE is greater than 1 in most years. The average annual growth rates of ACEE in eastern, central, western, and northeastern regions during the study period were 1.786, 1.859, 1.748, and 1.208%, respectively. As the core grain-producing region in China, the central area has become a key focus of national agricultural policies in recent years. For instance, high-standard farmland construction policies have significantly enhanced resource utilization efficiency and green technology efficiency by improving agricultural infrastructure, such as irrigation systems and soil quality, thereby making it the fastest-improving region in ACEE.
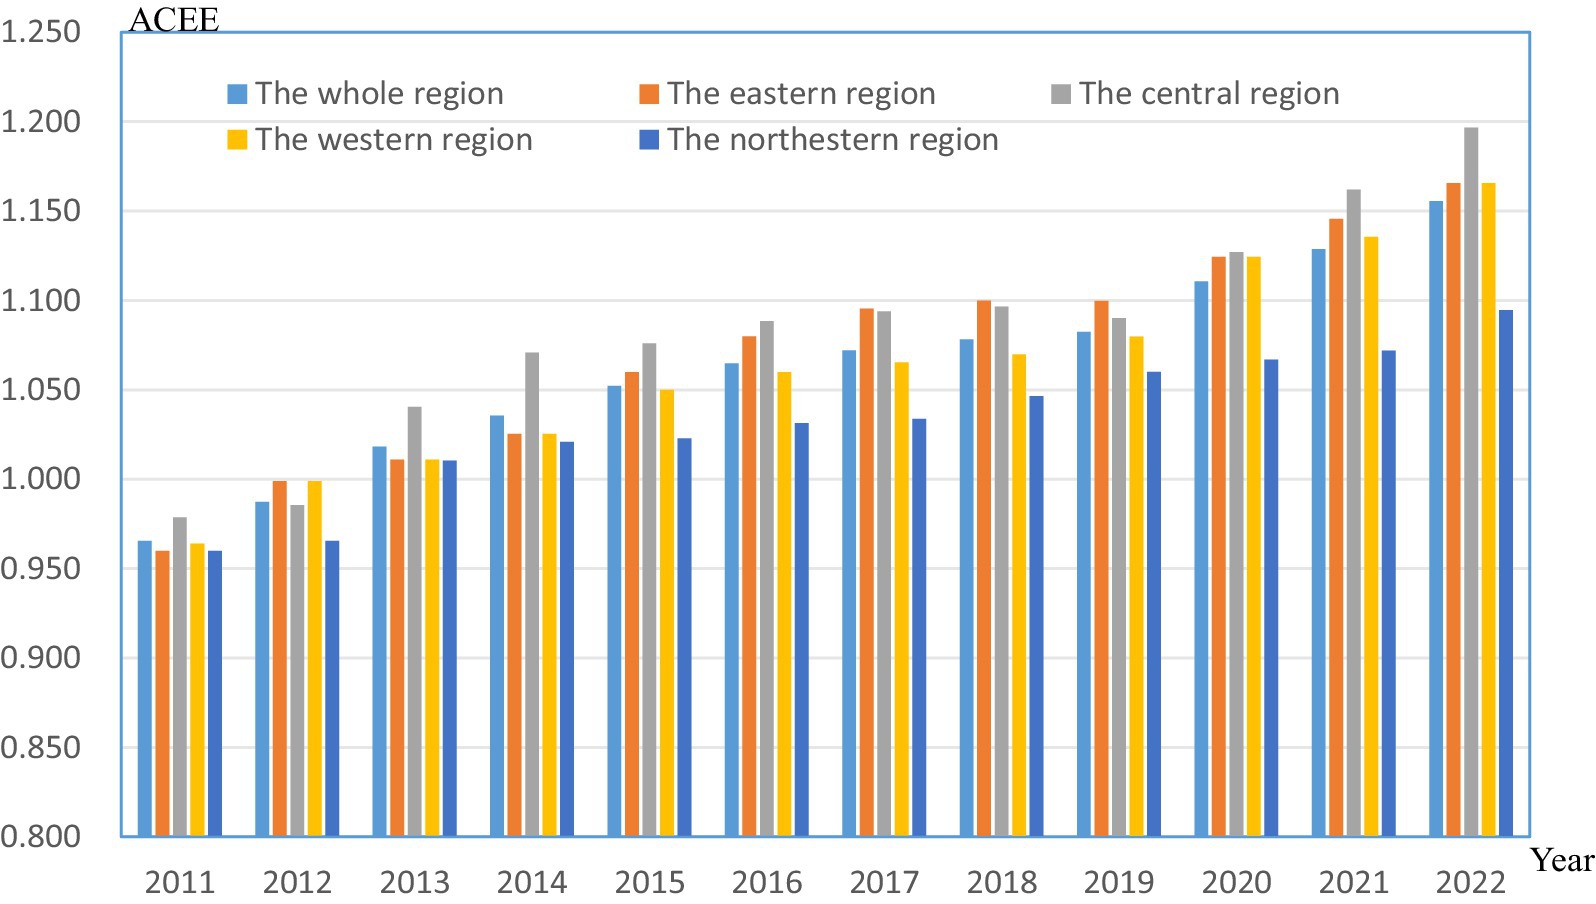
Figure 2. Development trend of ACEE in China from 2011 to 2022.
Meanwhile, RUD was measured with panel data based on entropy evaluation method. The results show that the mean value of RUD in eastern China is the highest, while the mean value of RUD in western China and Northeast China is relatively lower among the four regions. From Figure 3, it can be seen that the average of RUD in the eastern region is the highest among all regions over the study period. The annual average of RUD of the whole research region continuously improved over time, with average annual growth rates of 2.56%. The average annual growth rates of RUD in eastern, central, western, and northeastern region during the study period were 2.32, 2.43, 3.03, and 2.33%, respectively. The growth rate of RUD in western region is higher than that of other regions. The digitalization level of rural areas in the western region has improved the fastest, mainly benefiting from the dual drive of policy inclination and latecomer advantage: The national “rural revitalization” and “digital China” strategies give priority to the layout of the western region, through special funds to support new infrastructure (such as 5G base stations and optical fiber networks) and e-commerce logistics sinking; at the same time, its original digital foundation is weak, and the eastern and western cooperation mechanisms are superimposed to introduce eastern technical resources, promoting the rapid popularization of smart agriculture, distance education, and other applications and realizing leapfrog shortcomings.
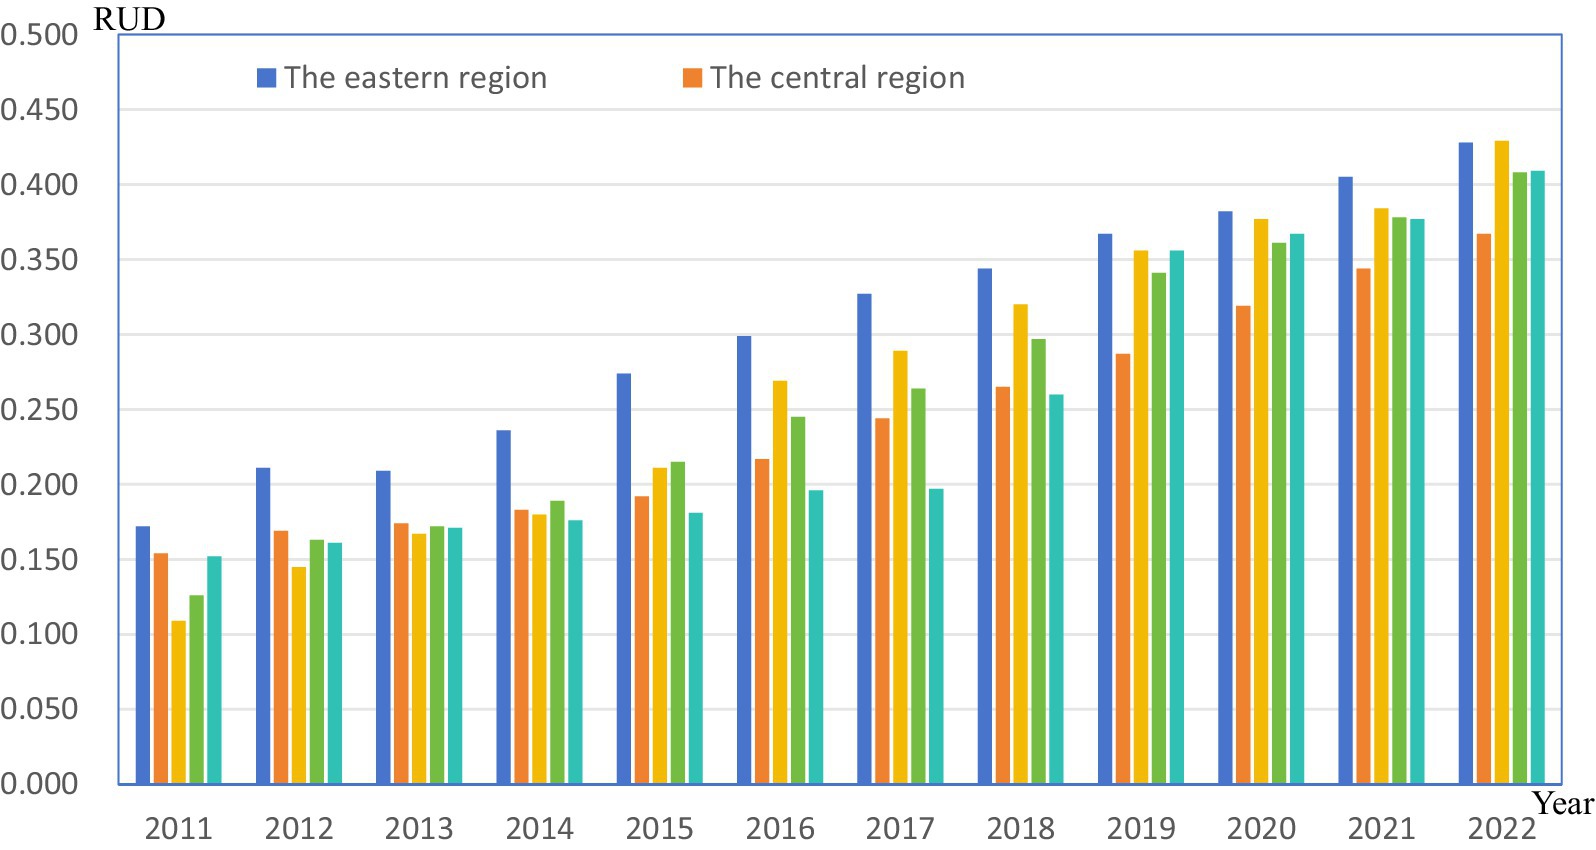
Figure 3. Development trend of RUD in China from 2011 to 2022.
4 Model estimation results and analysis
4.1 Spatial panel model estimation results and analysis
4.1.1 Global spatial auto-correlation test
According to the calculation, the global Moran’s I index values of rural digitization (RUD) and agricultural carbon emission efficiency (ACEE) over the years were significantly positive (Table 4), indicating a significant spatial correlation of RUD and ACEE. In terms of time, the mean values of the global Moran’s I index values of RUD and ACEE were increasing annually. Thus, the trend of spatial agglomeration of RUD and ACEE was constantly increasing.
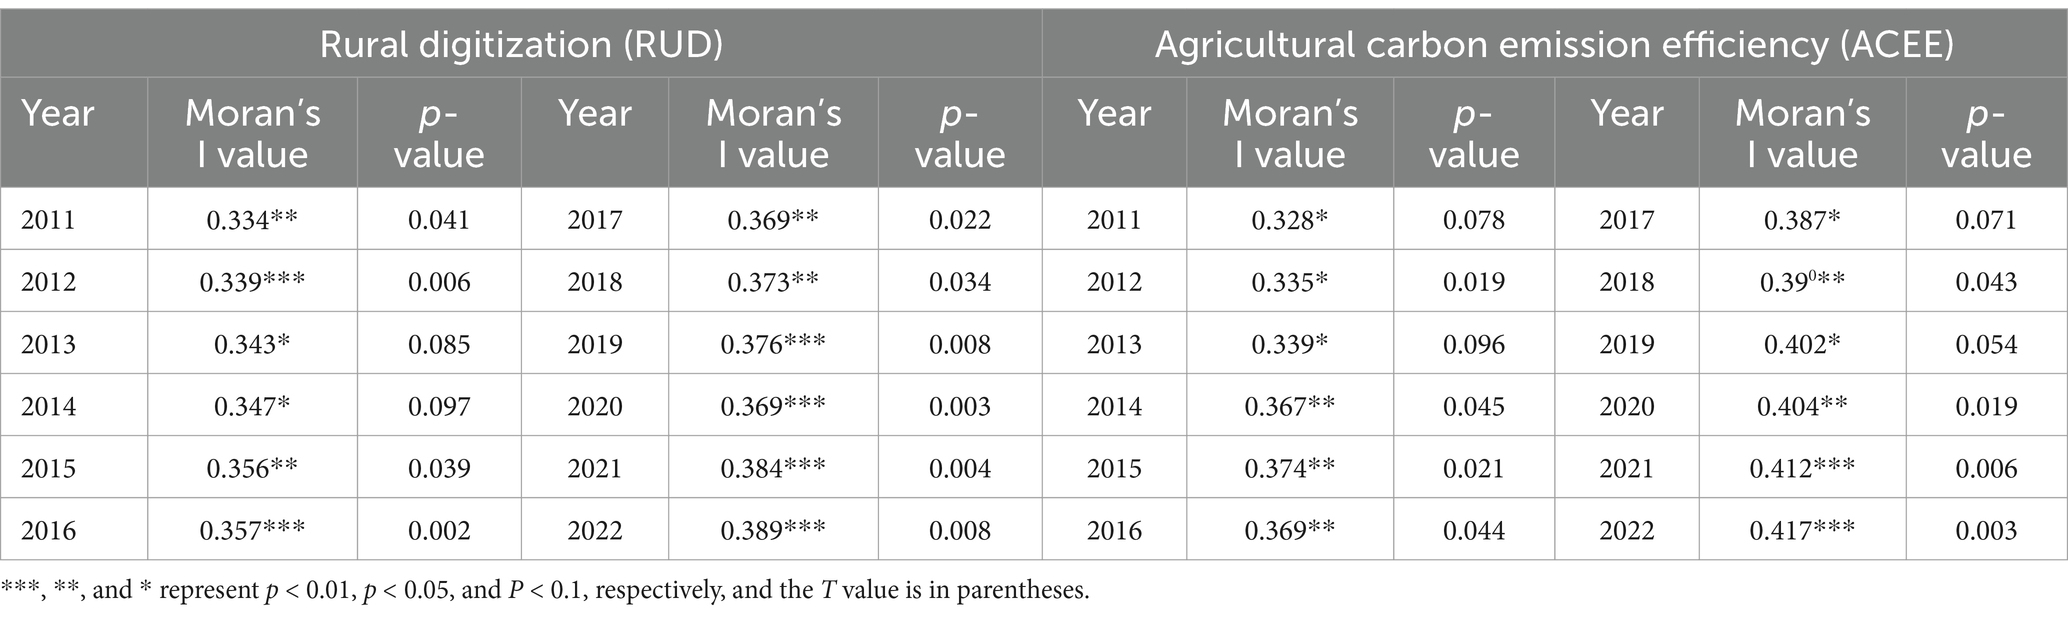
Table 4. Global Moran’s I values of RUD and ACEE from 2011 to 2012.
4.1.2 Identification of spatial econometric models
The above spatial auto-correlation test reveals that both the ACEE and RUD have strong spatially correlated characteristics; thus, spatial factors should be considered when studying their relationship. The appropriate space measurement model was then chosen according to Elhorst (2003): First, it has to judge whether the spatial econometric model is applicable. The test statistics for LM lag, robust LM lag, LM error, and robust LM error all passed the significance test, indicating that the null hypothesis that the SPM or SEM is not present can be rejected, where the spatial panel model is applicable. The Wald and LR statistics were then combined to determine which spatial model was more appropriate. The estimation with the SDM as the parent showed that both the Wald and the LR statistics passed the significance test, indicating that fitting the data via the SDM is more appropriate. A geographic distance spatial weight matrix was used for each test, and the results are shown in Table 5. For both types of spatial Durbin models, the Hausman test rejected the null hypothesis (p < 0.01); thus, the fixed effects model was more appropriate. Moreover, the two-way fixed Durbin model was selected for empirical analysis to avoid the influence of unobserved time changes on the estimated results.
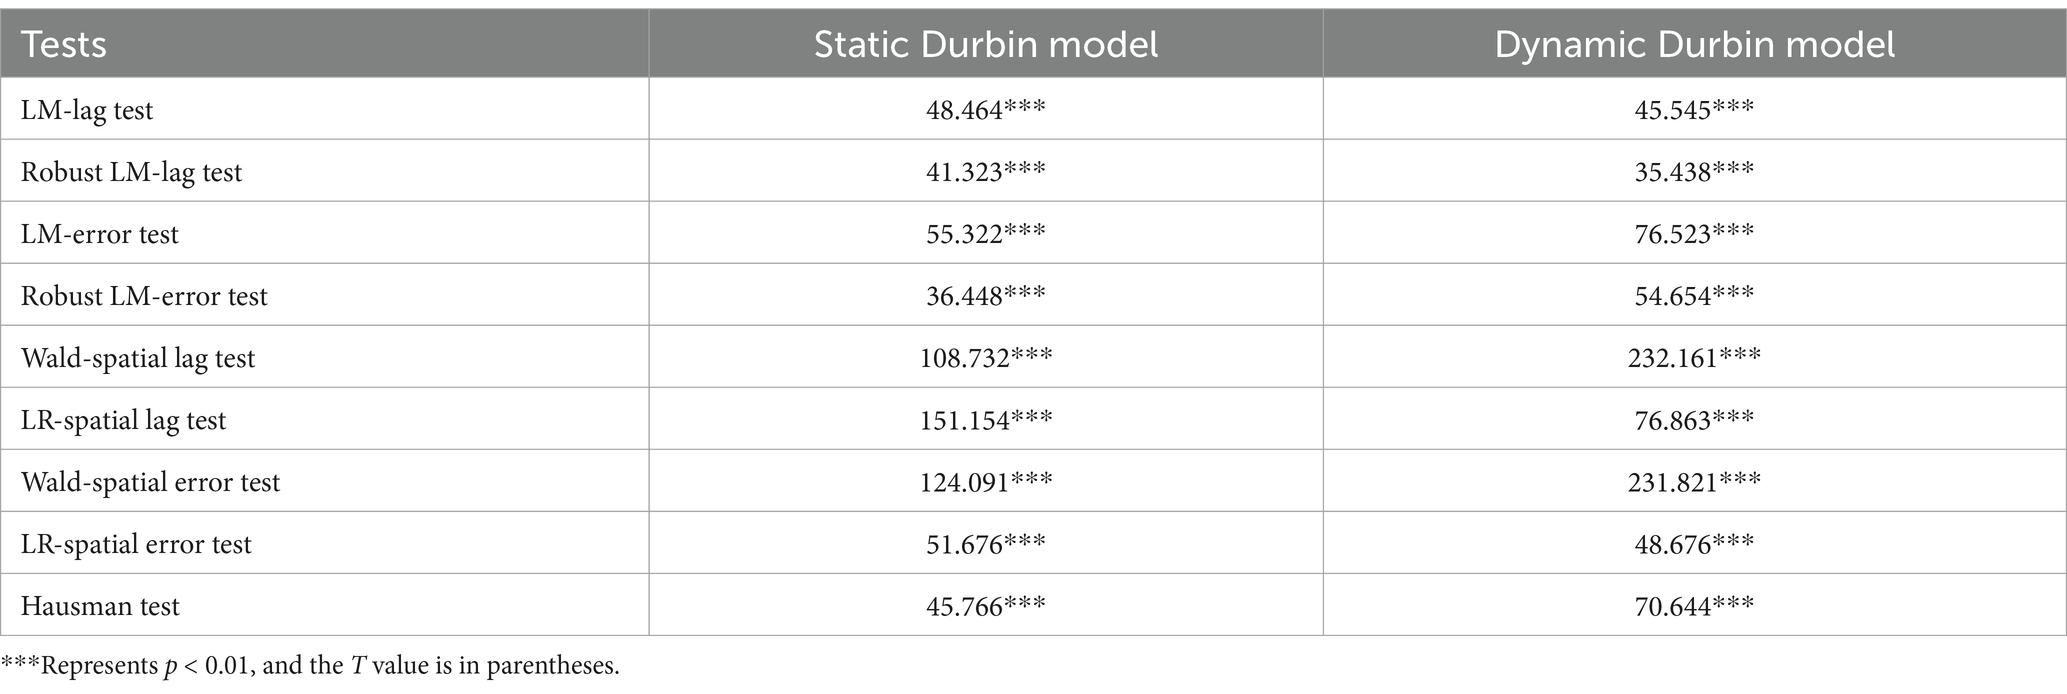
Table 5. Tests of spatial regression models.
4.1.3 Estimation results of the spatial Durbin model
4.1.3.1 Estimation results of the spatial Durbin model
Model estimation was performed on two types of spatial weight matrices, and the estimation results are shown in Table 6. The coefficients of RUD on ACEE in all the models were positive and passed the significance tests, indicating that the rural digitization had a significant positive effect on ACEE. The improvement of rural digital boosts the transformation of traditional agricultural production to digital production, improves the efficiency of the use of agricultural resources, changes the extensive production mode, and improves ACEE. Thus, the research hypothesis H1 was confirmed. The R2 value of model fitting indicates that the dynamic Durbin model has a greater degree of fit than the static Durbin model does, indicating that the dynamic Durbin model is better. Therefore, the fit degree of the dynamic Durbin model is greater than that of the static Durbin model, indicating that the dynamic Durbin model is better fit for estimation. This is mainly because the static Durbin model does not consider the dynamic influence of ACEE in the regression process, resulting in estimation errors. According to the regression results of the dynamic panel model, the coefficient of ACEEi,t-1 is positive (p < 0.01), fully indicating that the ACEE has a significant dynamic persistence characteristic. In addition, a comparison of the estimation results of different models reveals that the dynamic Durbin model, which is based on the geographic distance weight matrix, has the highest fit degree. Therefore, the results in Column 3 (Model 3) in Table 6 were analyzed here. The RUD coefficient of Model 3 was 0.137 (p < 0.01), which was lower than the estimated coefficient of the static Durbin model, indicating that the static model overestimated the promoting effect of RUD on ACEE. The spatial lag term coefficient (W*RUD) of RUD was significantly positive at the 5% confidence level, indicating the interaction of RUD between provinces and that local RUD affects the ACEE in its neighboring provinces. In conclusion, it can be seen that the promoting effect of RUD has a spatial spillover effect on ACEE, verifying Hypothesis H2.
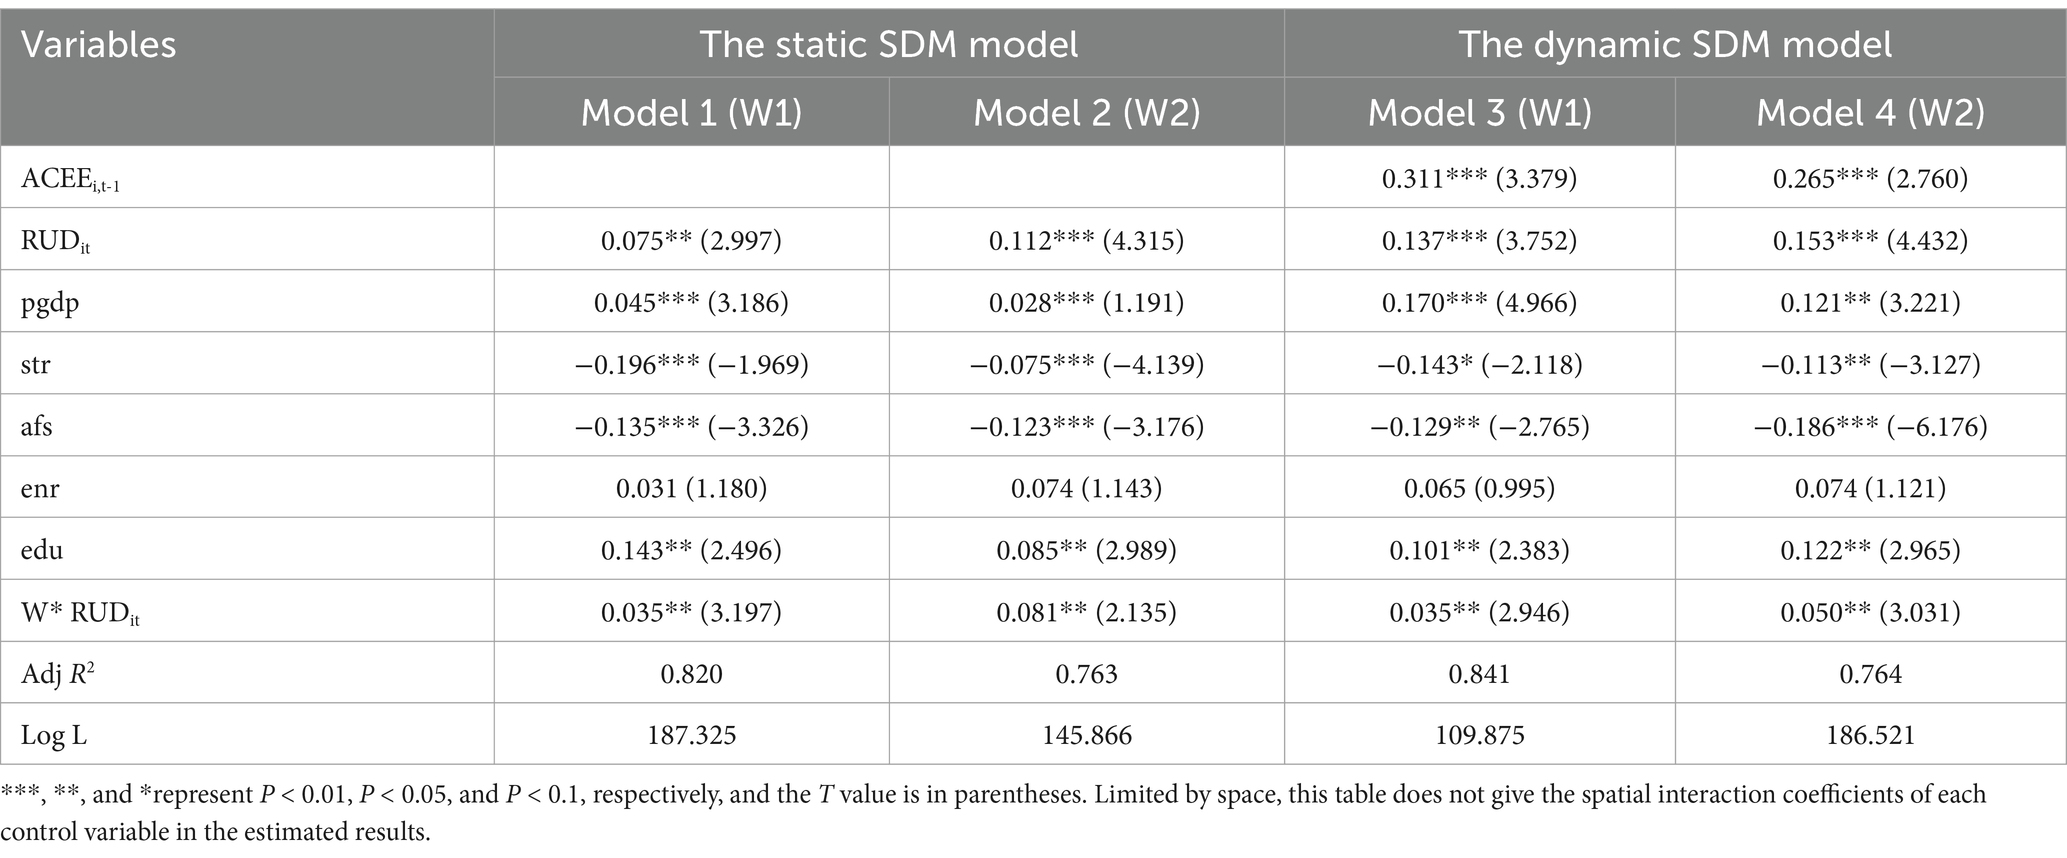
Table 6. Estimation results of spatial Durbin model.
In terms of control variables, the agricultural economic development level (pgdp), the environmental regulation (enr), and the agricultural technology investment (tech) all have significant positive effects on ACEE. The improvement of agricultural economic development will promote the allocation of agricultural resources, optimize the structure of agricultural production, and contribute to the upgrading of agricultural production technology, the improvement of resource utilization efficiency, and the promotion and application of energy saving and emission reduction technologies, thus promoting the improvement of ACEE. In addition, the higher the level of environmental regulation, the more local governments attach importance to farmers’ low-carbon production by introducing relevant emission reduction policies, providing green subsidies to farmers and other measures. Local governments guide farmers to cultivate the awareness of emission reduction and promote their green production from passive to active; this will improve agricultural green production efficiency and reduce agricultural carbon emissions. Meanwhile, the improvement in the level of human capital usually tend to lead to the adoption of a lower-carbon agricultural production mode, thus reducing carbon emissions.
The agricultural industrial structure (str) and the agricultural financial support (afs) have a significantly positive impact on ACEE. That may because the planting and breeding industries are the two main sources of agricultural carbon emissions. The increasing proportion of these two industries often results in greater agricultural carbon emissions, which is not conducive to the improvement of ACEE. The improvement of agricultural financial investment does not mean the improvement of agricultural financial investment efficiency. Specifically, when investing in agricultural production technology reform, the government will consider the cost first of all. When the technology is fully mature, it is usually cost-effective to put it into the market, so it is generally chosen to put it into application when the technology is relatively mature. However, in this process, some technologies with insufficient verification not only cannot achieve emission reduction after being put into use but also may lead to an increase in carbon emissions, or the government pays more attention to the development of agricultural economy and fails to strike a good balance between them and green development. As a result, more carbon emissions are generated, which is obviously not conducive to the improvement of ACEE.
4.1.3.2 Spatial effect decomposition
To accurately reflect the influence of each factor on ACEE, the total effects of the SDM model were decomposed into direct and indirect effects (Table 7). The direct effect is the influence of RUD on ACEE in the local region. Indirect effect, that is, spatial spillover effect, refers to the impact of RUD of neighboring areas on the ACEE of the local area.
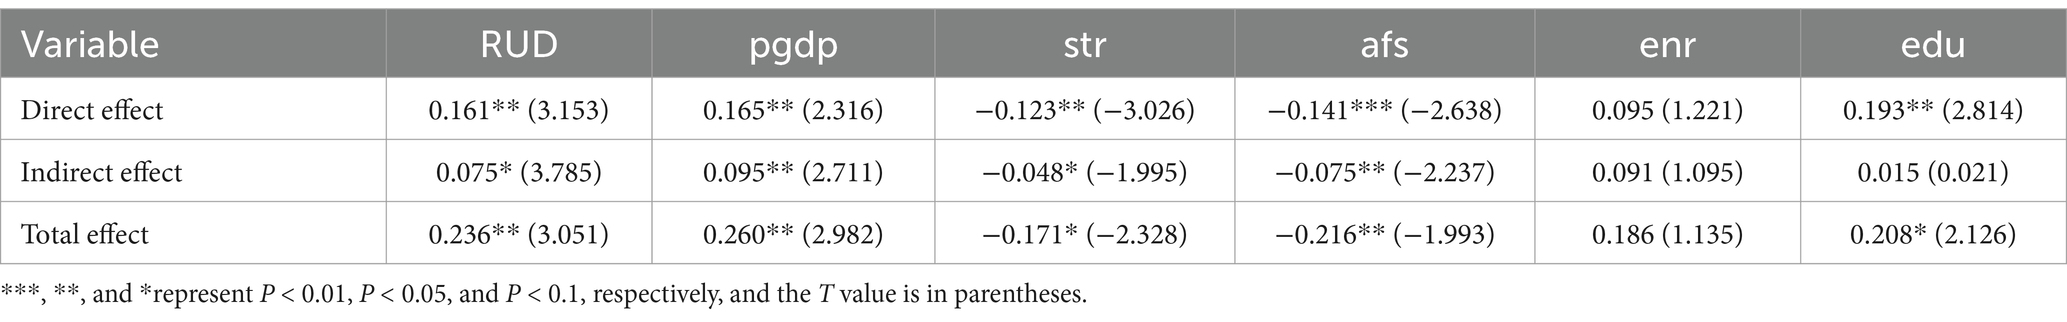
Table 7. Results of spatial effect decomposition.
The direct effect coefficient of RUD in Table 7 is 0.161 (p < 0.05), which is 0.008 lower than the value of 0.153 before the unbiased treatment in Table 6, indicating that the local rural digitization affects the surrounding provinces, reversing the province and decreasing agricultural carbon emission efficiency. The indirect effect of RUD was 0.075 (p < 0.1), which passed the significance test at the 10% level, indicating that RUD has a significant spatial spillover effect on ACEE. The possible reason is that with the improvement of the digitalization level in rural areas, digital agriculture and low-carbon ecological agriculture are gradually promoted, so farmers will steadily promote agricultural carbon reduction. At the same time, the low-carbon economic effect of external agriculture effectively drives the surrounding areas to learn from and follow suit. This has improved the digitalization level of the surrounding rural areas and improved the efficiency of agricultural carbon emissions in the surrounding areas.
4.1.4 Analysis of regional heterogeneity
Given the large differences between rural digitization and agricultural carbon emissions in different regions of China, the approach of Xu et al. (2022) is applied to divide the whole study area into eastern, central, western, and northeast regions for model estimation to test regional heterogeneity. The model estimation results are shown in Table 8. As shown in Table 8, the estimated results for each region are consistent with the results for the whole study area sample: The direct and spatial spillover effects of RUD on ACEE are significant, indicating that the above study results are relatively robust. For all four regions, the coefficients of ACEEi,t-1 are significantly positive, indicating that ACEEs of all regional are affected by the state of the previous stage. In addition, the coefficients of W*RUD in the eastern, central, and western regions are all significantly positive, indicating that local RUD has a spatial spillover effect on ACEE in its surrounding regions, whereas this effect is not significant in the northeast region.

Table 8. Estimation results by regions.
The spatial effects of different regions were then decomposed, and the results are shown in Table 9. The direct (local) effect of the central region is the strongest, with a coefficient of 0.253 (p < 0.05). This may be because the resource base of rural digital development in central China is relatively well, whereas the ACEE is not so high; thus, the marginal effect of rural digital development on the ACEE is more prominent. Regarding spatial spillover effect, the spillover effect of RUD on ACEE in the eastern region had a regression coefficient of 0.105 (p < 0.05), which was greater than the coefficients in other regions. That may because the eastern region has a quite good economic foundation and good infrastructure, and the information and factor flows operate conveniently and efficiently. Therefore, the spillover effect in the eastern region is more prominent. However, the spillover effect in northeast China is not significant, possibly because the local natural geography and climate conditions cause weak resource factor liquidity, which is not conducive to the spillover effect of digital carbon reduction in rural areas.
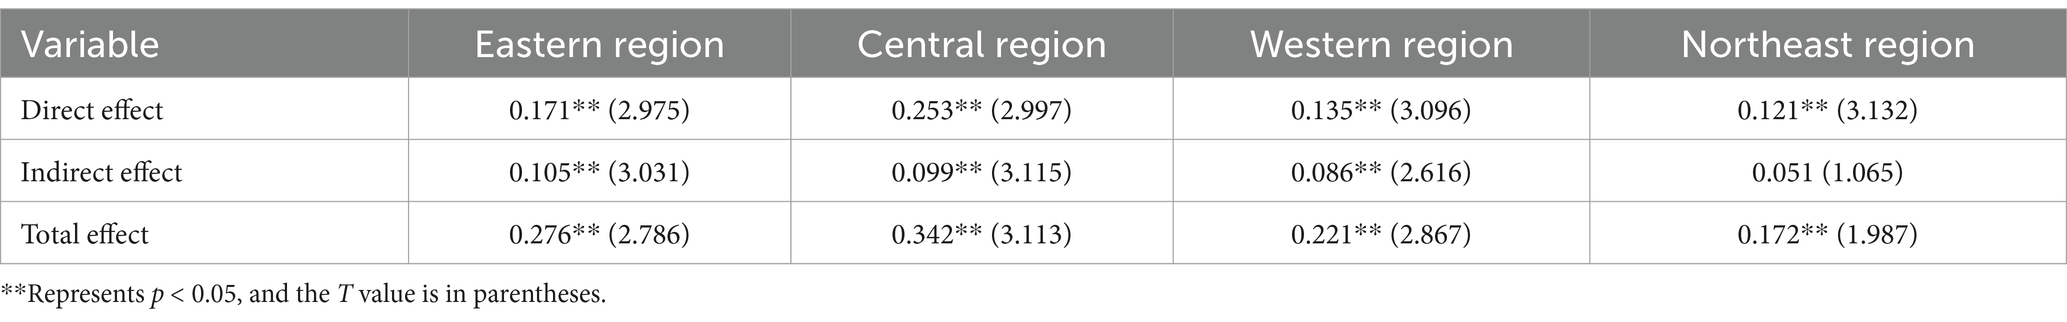
Table 9. Analysis of the spatial effects of the different regions.
4.1.5 Endogeneity test
To alleviate the possible endogenous problems of the model, the two-stage least square method of instrumental variables (IV-2SLS) was used for processing. Proximity to digital infrastructure hubs is selected as the instrumental variable, and the selection of the instrumental variable must meet the two conditions of correlation and exogeneity: First, rural digitalization is related to proximity to digital infrastructure hubs. Therefore, proximity to digital infrastructure hubs can represent the level of rural digitalization to a certain extent. The correlation conditions between instrumental variables and independent variables are satisfied. Second, proximity to digital infrastructure hubs does not directly affect the efficiency of agricultural carbon emissions, thus satisfying the exogenous conditions of instrumental variables. The results show that: in the first stage, instrumental variables are positively correlated with RUD, and the closer the distance to the digital infrastructure hub, the more conducive the subsequent RUD improvement; and in the second stage, the impact of rural digitization on ACEE was still significantly positive at 1% level, and all passed the validity test of instrumental variables.
4.2 Threshold effect test results and analysis
In this study, the threshold effect model was used to verify the non-linear effects of RUD on (ACEE). Based on Hansen (1999) framework, the threshold test adopts grid search method to iterate through all potential threshold values, preliminarily identifies threshold values based on the minimization of residual sum of squares (RSS), and calculates the significance level of threshold effect through 200 Bootstrap self-sampling. The results show (Table 10) that the F statistic of the single threshold model is 18.987, which is significant at 1% level (p = 0.003), and the corresponding threshold is 0.289, indicating that when the rural digitization index crosses this critical value, its mechanism of action on ACEE will undergo structural changes. However, both the double threshold (F = 3.210, p = 0.214) and the triple threshold failed the 10% significance test, which proved that there was only a single inflection point. Further combined with the explanation of economic significance, the threshold value of 0.289 corresponds to the critical level of 28.9% coverage of digital infrastructure in counties; at this time, the penetration rate of the synergy degree of agricultural data platform reaches the scale effect threshold, digital technology changes from “local pilot” to “global empowerment,” and the marginal emission reduction cost is significantly reduced.
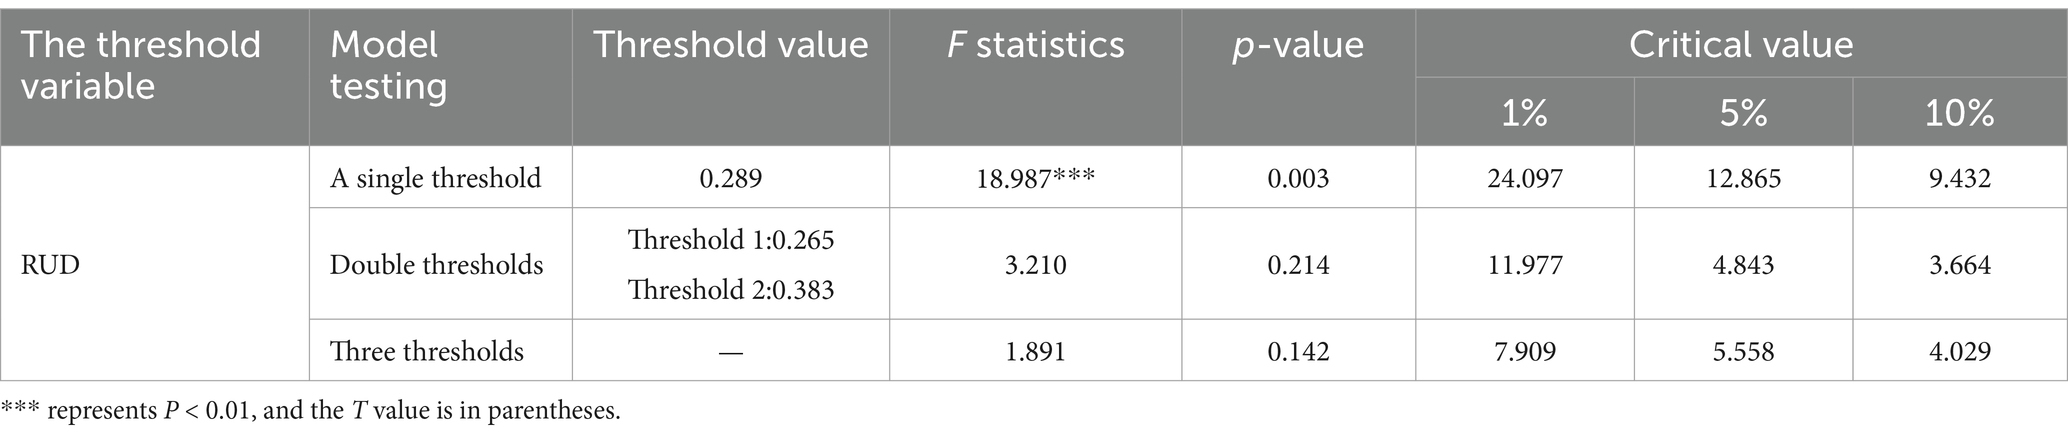
Table 10. Threshold characteristic test.
Since the threshold regression model contains the lag term of the explained variable, biased results will be obtained if the OLS method is used to estimate the threshold value regression model with the explained variable lag term. Therefore, the systematic generalized moment estimation method is used here, and the estimation results are shown in Table 11. When the RUD of the whole study area was less than or equal to the threshold value of 0.289, the regression coefficient of RUD was 0.104 (p < 0.05). When RUD exceeded 0.289, the regression coefficient of RUD was 0.171 (p < 0.05). This finding indicates that as the rural digitalization level (RUD) increases, its promoting effect on ACEE increases. This is mainly due to the continuous accumulation of digital production factors, the rapid increase in the use of internet users, the continual decrease in the marginal cost of farmers’ access to information, knowledge, and technology, and the decrease in the cost of farmers adopting green production technology; thus, carbon emissions in the agricultural production process are also reduced. Thus, carbon emission efficiency in the agricultural production process is promoted.
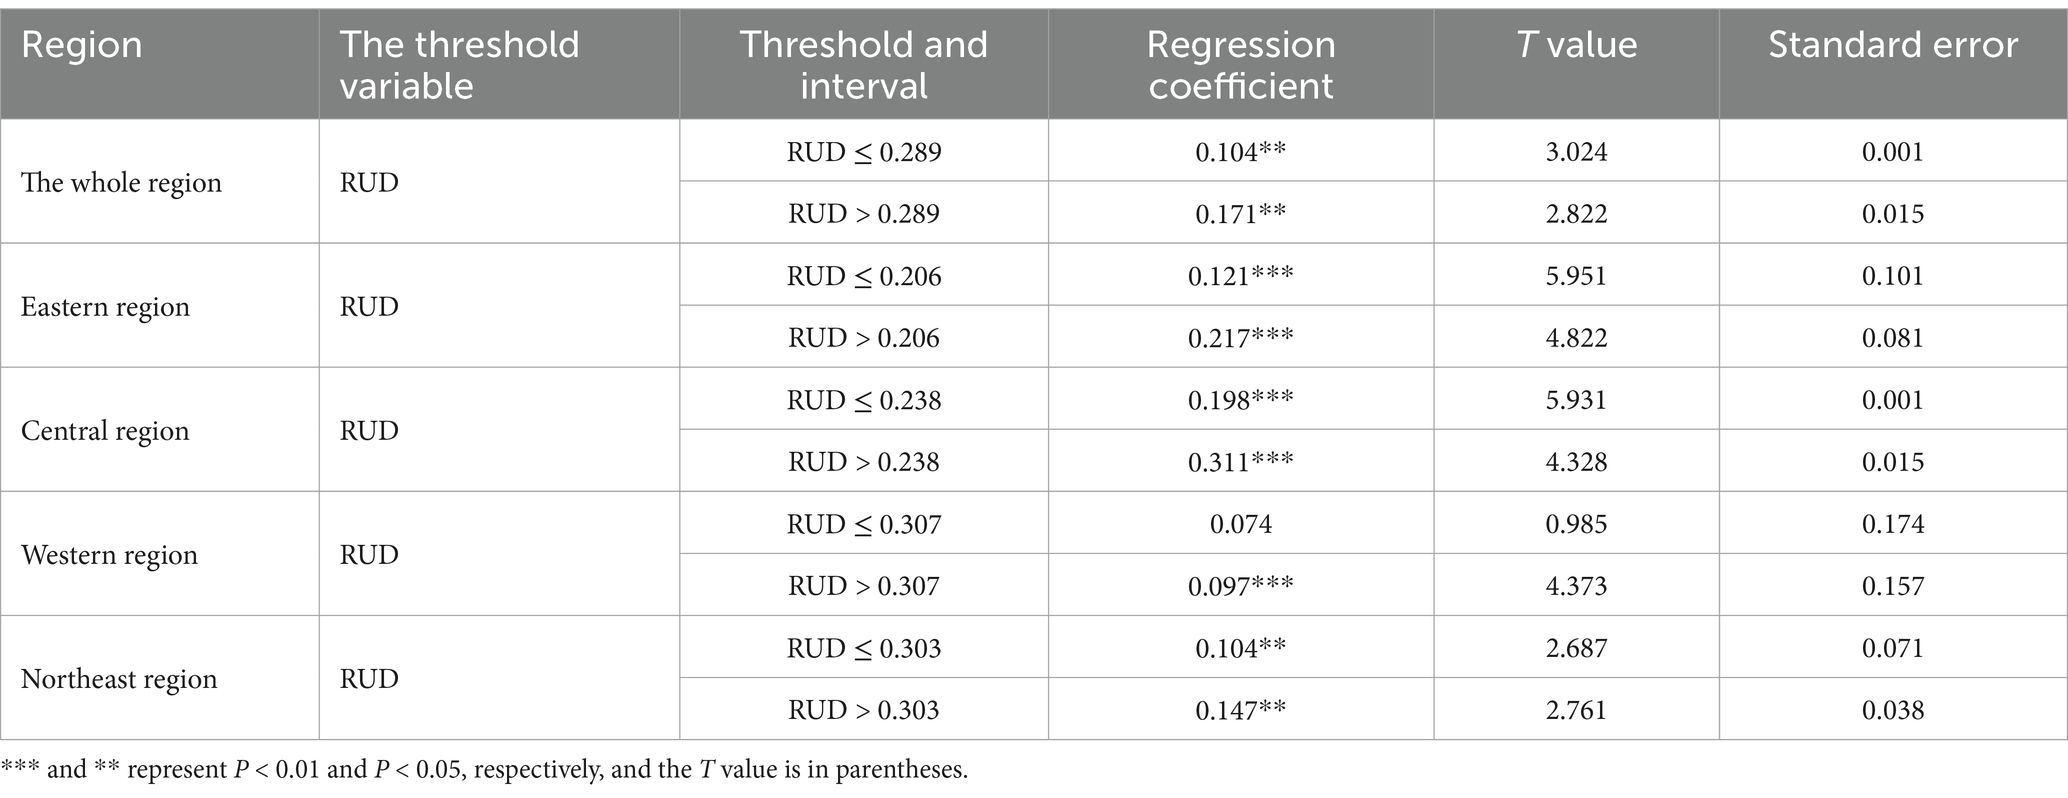
Table 11. Estimation results of dynamic threshold effect.
Moreover, the influence of different regions is estimated with the help of the dynamic threshold panel model, and the number and threshold values of different regions are determined. Each of the four regions had only one threshold value, as shown in Table 11. Among the four regions, the eastern region had the lowest threshold value (RUD = 0.206). When the RUD was less than the threshold, the coefficient of RUD was 0.121 (p < 0.01), and when the RUD exceeded the threshold, it climbed to 0.217 (p < 0.01). The eastern region has a high level of urbanization and economic development, the perfect digital infrastructure in rural areas, and the improvement of the rural digital level further highlights the agricultural ecological value and strengthens ecological awareness of agricultural producers. Therefore, they will earnestly practice agricultural, ecological, and environmental behavior and reduce the input of harmful substances. At this time, the positive effect of rural digitalization on the ACEE is enhanced. The threshold value of RUD in the western region was the highest (RUD = 0.307), but when the RUD was less than the threshold value, its influence coefficient was not significant. When the RUD exceeds the threshold value, its coefficient reaches 0.097 (p < 0.015). This finding indicates that if rural digital development in western China is at a low level, it cannot significantly improve ACEE; only when the RUD crosses the threshold and increases to a high level, it will have a significant promoting effect on the ACEE. This may be because the economies of most western regions are underdeveloped, the level of rural digital development is not high, and advanced agricultural technology is difficult to popularize. Thus, RUD did not significantly affect the ACEE at the beginning of the fusion. When RUD exceeds the threshold value of 0.621, agricultural producers realize that agricultural ecological capital creates more value, at which point agricultural carbon emissions become important and using harmful environmental factors in production is consciously reduced, ultimately improving the ACEE. Compared with that in the western region, the rural digitalization level in the central region has a stronger promoting effect on ACEE, perhaps because of the relatively high economic development level in the central region and good rural digital construction, which can support the low-carbon and green development of agriculture. Therefore, improving RUD is highly important for increasing ACEE.
5 Conclusion and implications
Based on data from 30 provinces and regions in China (excluding Hong Kong, Macao, Taiwan, and Tibet) from 2011 to 2022, this study examines the impact of rural digital development on agricultural carbon emissions with the help of a dynamic spatial Durbin model and threshold effect model and obtains the following conclusions: First, both agricultural carbon emissions (ACEE) and the level of rural digitization (RUD) have a significant spatial clustering feature. Therefore, the spatial Durbin model can better reveal the relationship between the two. Moreover, the dynamic sustainability of ACEE and the accumulation of ACEE in the early stage directly affect ACEE in the current and later periods. Therefore, the dynamic panel model can objectively reflect the actual development of ACEE and is beneficial for solving the endogeneity problem. Second, RUD has a spatial spillover effect on ACEE. As far as the whole study area is concerned, an increase in the degree of RUD can increase ACEE in the local area and has a certain promoting effect on ACEE in its surrounding regions, which is consistent with that of Wang et al. (2024a). By region, RUD of the central region has the strongest direct (local) effect on ACEE, whereas the eastern region has the greatest spillover effect. Third, there are threshold characteristics for the influence of RUD on ACEE, and there is only one threshold value in the whole region as well as in four different regions. This conclusion is different from the study of Wang et al. (2024a), whose study showed a double threshold effect of agriculture and tourism integration on agricultural eco-efficiency, and this difference may be due to the different scale of the study area. The promoting effect of RUD on ACEE increases significantly when RUD exceeds the threshold across the study area. This indicates that as RUD increases, its promoting effect on ACEE enhances. Among the four regions, the eastern region has the lowest threshold value, and the western region has the highest threshold value. Moreover, when the RUD in western China was lower than the threshold value, its impact on the ACEE failed the significance test. Only when it crosses the threshold value, does RUD have a significant effect on the improvement of ACEE. Therefore, improving RUD is the key way to fully realizing its role in improving ACEE.
The above research conclusions have the following implications for the role of RUD in reducing ACEE.
First, given the positive role of rural digitization in improving ACEE, the application and promotion of new technologies, new products, and new models in the field of digital agriculture should be increased in the future, and agricultural sensors and intelligent equipment should be included in the purchase subsidies of agricultural machinery as soon as possible. It is important to continue to promote the strategies of “broadband to the countryside” and “digital countryside,” achieve 4G or 5G network coverage in rural areas, and ensure basic information services for rural residents. It is necessary to establish digital economy demonstration villages and agricultural big data pilot counties to promote the transformation of digital achievements into real productivity as soon as possible.
Second, given the significant regional heterogeneity of the impact of rural digitalization on agricultural carbon productivity, dynamic and differentiated digital rural development strategies should be implemented in the future. For areas that have achieved good results in green and low-carbon agricultural development, we will further consolidate the dividend of digital carbon reduction and yield increase in rural areas, pay attention to technology diffusion, and help areas with low digitalization levels. The eastern region should continue to play a leading role in the demonstration of low-carbon agriculture, and the central and western regions should speed up the strengthening of weak spots, continuously develop ecological low-carbon agriculture, promote a comprehensive green transformation of agricultural development, narrow regional differences, and break the regional imbalance in the development of low-carbon agriculture.
Third, in view of the significant spatial spillover effect of rural digitalization on ACEE, efforts should be made to improve the inter-regional cooperation mechanism in the future, take advantage of digitalization to overcome the limitation of economic distance, build an integrated digital economy smart service platform, establish a large digital economy service database, and realize the sharing of data resources and platforms. Information disclosure and technology popularization of agricultural production environment will be strengthened.
The research limitations of this study mainly include the following two aspects: First, although this study has carried out a theoretical analysis of the influence mechanism, it has not been empirically tested due to the limited version of the study. The influence mechanism can be further tested through empirical analysis in the future; second, due to the limitation of data availability, this study adopts provincial panel data for research. The spatial scale of sample measurement is large, which may affect the accuracy of results. In the future, it can be quantitatively analyzed by using smaller scale sample data such as municipal panel data.
Note: The eastern region comprises 10 provinces: Beijing, Tianjin, Hebei, Shanghai, Jiangsu, Zhejiang, Fujian, Shandong, Guangdong, and Hainan; the central region consists of 6 provinces: Shanxi, Anhui, Jiangxi, Henan, Hubei, and Hunan; the western region comprises 11 provinces: Chongqing, Sichuan, Guizhou, Guangxi, Yunnan, Shaanxi, Inner Mongolia, Gansu, Ningxia, Qinghai, and Xinjiang; and the northeastern region consists of 3 provinces: Heilongjiang, Jilin, and Liaoning.
Data availability statement
The original contributions presented in the study are included in the article/supplementary material, further inquiries can be directed to the corresponding author/s.
Author contributions
WJ: Writing – original draft. CC: Writing – review & editing.
Funding
The author(s) declare that financial support was received for the research and/or publication of this article. This research was funded by the Scientific Research of Hunan Provincial Department of Education (Grant No. 23C0397).
Conflict of interest
The authors declare that the research was conducted in the absence of any commercial or financial relationships that could be construed as a potential conflict of interest.
Generative AI statement
The authors declare that no Gen AI was used in the creation of this manuscript.
Publisher’s note
All claims expressed in this article are solely those of the authors and do not necessarily represent those of their affiliated organizations, or those of the publisher, the editors and the reviewers. Any product that may be evaluated in this article, or claim that may be made by its manufacturer, is not guaranteed or endorsed by the publisher.
References
Chen, M., Xiao, H., Zhao, H., and Liu, L. (2024). The power of attention: government climate-risk attention and agricultural-land carbon emissions. Environ. Res. 251:118661. doi: 10.1016/j.envres.2024.118661
Chu, Y., Zhang, X., Guo, Y., Tang, L., Zhong, C., Zhang, J., et al. (2024). Spatial–temporal characteristics and driving factors’ contribution and evolution of agricultural non-CO2 greenhouse gas emissions in China: 1995–2021. Environ. Sci. Pollut. Res. 31, 19779–19794. doi: 10.1007/s11356-024-32359-1
Elhorst, J. P. (2003). Specification and estimation of spatial panel data models. Int. Reg. Sci. Rev. 26, 244–268. doi: 10.1177/0160017603253791
Gao, D., Zhi, Y., and Yang, X. (2024). Assessing carbon emission reduction benefits of the electrification transition of agricultural machinery for sustainable development: a case study in China. Sustain Energy Technol Assess 63:103634. doi: 10.1016/j.seta.2024.103634
Guan, N., Liu, L., Dong, K., Xie, M., and Du, Y. (2023). Agricultural mechanization, large-scale operation and agricultural carbon emissions. Cogent Food Agricul. 9:2238430. doi: 10.1080/23311932.2023.2238430
Guo, H., Gu, F., Peng, Y., Deng, X., and Guo, L. (2022). Does digital inclusive finance effectively promote agricultural green development? —a case study of China. Int. J. Environ. Res. Public Health 19:6982. doi: 10.3390/ijerph19126982
Hamdi, H., Sbia, R., and Shahbaz, M. (2014). The nexus between electricity consumption and economic growth in Bahrain. Econ. Model. 38, 227–237. doi: 10.1016/j.econmod.2013.12.012
Han, H., Zhong, Z., Wen, C., and Sun, H. (2018). Agricultural environmental total factor productivity in China under technological heterogeneity: characteristics and determinants. Environ. Sci. Pollut. Res. 25, 32096–32111. doi: 10.1007/s11356-018-3142-4
Huang, X., Xu, X., Wang, Q., Zhang, L., Gao, X., and Chen, L. (2019). Assessment of agricultural carbon emissions and their spatiotemporal changes in China, 1997–2016. Int. J. Environ. Res. Public Health 16:3105. doi: 10.3390/ijerph16173105
Jin, Y., Wang, X., and Wang, Q. (2024). The influence of agricultural insurance on agricultural carbon emissions: evidence from China’s crop and livestock sectors. Front. Environ. Sci. 12:1373184. doi: 10.3389/fenvs.2024.1373184
Khan, S. A. R., Ponce, P., and Yu, Z. (2021). Technological innovation and environmental taxes toward a carbon-free economy: an empirical study in the context of COP-21. J. Environ. Manag. 298:113418. doi: 10.1016/j.jenvman.2021.113418
Li, H., Xie, S., and Su, M. (2024). Does digital technology innovation promote low-carbon development in agriculture? A spatial econometric analysis based on 31 provinces in China. Environ. Sci. Pollut. Res. 31, 4478–4499. doi: 10.1007/s11356-023-31369-9
Liu, D., Zhu, X., and Wang, Y. (2021). China’s agricultural green total factor productivity based on carbon emission: an analysis of evolution trend and influencing factors. J. Clean. Prod. 278:123692. doi: 10.1016/j.jclepro.2020.123692
Liu, H. Q. (2019). Drive agricultural modernization with precision agriculture and accelerate the digital transformation of modern agriculture. Chin. J. Agricul. Resour. Regional Plan. 40, 1–6. doi: 10.7621/cjarrp.1005-9121.20190101
Liu, L., Zhang, L., Li, B., Wang, Y., and Wang, M. (2024). Can financial agglomeration curb carbon emissions reduction from agricultural sector in China? Analyzing the role of industrial structure and digital finance. J. Clean. Prod. 440:140862. doi: 10.1016/j.jclepro.2024.140862
Lu, S., Zhuang, J., Sun, Z., and Huang, M. (2024a). How can rural digitalization improve agricultural green total factor productivity: empirical evidence from counties in China. Heliyon 10:e35296. doi: 10.1016/j.heliyon.2024.e35296
Lu, Y., Wang, L., and Zhou, Z. (2024b). A study on the coupling coordination degree and temporal and spatial evolution of China's agricultural green development level and agricultural science and technology innovation capability. Agricult. Econom. Manag. 4, 90–104.
Murray, F. (2004). The role of academic inventors in entrepreneurial firms: sharing the laboratory life. Res. Policy 33, 643–659.
Oenema, O. (2020). Toward agriculture green development. Front. Agricul. Sci. Eng. 7, 110–111. doi: 10.15302/J-FASE-2019314
Qaim, M. (2020). Role of new plant breeding Technologies for Food Security and Sustainable Agricultural Development. Appl. Econ. Perspect. Policy 42, 129–150. doi: 10.1002/aepp.13044
Ryan, B., and Tiffany, D. G. (1998). Minnesota agricultural energy use and the incidence of a carbon tax. Minneapolis, MN, USA: Institute for Local Self Reliance.
Song, M., Zheng, C., and Wang, J. (2022). The role of digital economy in China’s sustainable development in a post-pandemic environment. J. Enterp. Inf. Manag. 35, 58–77. doi: 10.1108/JEIM-03-2021-0153
Sun, Y. (2022). Environmental regulation, agricultural green technology innovation, and agricultural green total factor productivity. Front. Environ. Sci. 10, 1–22. doi: 10.3389/fenvs.2022.955954
Tian, Y., Cai, Y., and Zhang, H. (2024). The impact of digital economy on agricultural carbon emission efficiency: A test based on threshold effect and spatial spillover effect. Agric. Tech. Econ. 5, 12–17. doi: 10.13246/j.cnki.jae.20240522.001
Wang, J., Yang, G., and Zhou, C. (2024a). Does internet use promote agricultural green development? Evidence from China. Int. Rev. Econom. Fin. 93, 98–111. doi: 10.1016/j.iref.2024.03.009
Wang, J., Zhou, F., Xie, A., and Shi, J. (2024b). Impacts of the integral development of agriculture and tourism on agricultural eco-efficiency: a case study of two river basins in China. Environ. Dev. Sustain. 26, 1701–1730. doi: 10.1007/s10668-022-02781-x
Wang, L., Tang, J., Tang, M., Su, M., and Guo, L. (2022). Scale of operation, financial support, and agricultural green Total factor productivity: evidence from China. Int. J. Environ. Res. Public Health 19:9043. doi: 10.3390/ijerph19159043
Xiong, W., and Zhou, P. (2024). Evaluation of agricultural green development level and analysis on spatial-temporal differences in the Yangtze River basin. Ecol. Econ. 40, 119–128.
Xu, L., Jiang, J., and Du, J. (2022). The dual effects of environmental regulation and financial support for agriculture on agricultural green development: spatial spillover effects and Spatio-temporal heterogeneity. Appl. Sci. 12:11609. doi: 10.3390/app122211609
Yang, T., Huang, X., Wang, Y., Li, H., and Guo, L. (2022). Dynamic linkages among climate change, mechanization and agricultural carbon emissions in rural China. Int. J. Environ. Res. Public Health 19:14508. doi: 10.3390/ijerph192114508
Yao, Y., Bi, X., Li, C., Xu, X., Lei, J., and Chen, J. (2024). A united framework modeling of spatial-temporal characteristics for county-level agricultural carbon emission with an application to Hunan in China. J. Environ. Manag. 364:121321.
Zhang, H., Zhang, J., and Song, J. (2022). Analysis of the threshold effect of agricultural industrial agglomeration and industrial structure upgrading on sustainable agricultural development in China. J. Clean. Prod. 341:130818. doi: 10.1016/j.jclepro.2022.130818
Zhang, L., Cai, C., Singh, K., and Zhong, K. (2024). Green technology innovation, trade deficit and carbon emission transfer in agriculture under the new “dual circulation” development pattern of China. Ecol. Indic. 159:111757. doi: 10.1016/j.ecolind.2024.111757
Zhang, N., Zhang, L., Zhao, H., Han, Y., and Duan, Y. (2018). Construction and application of evaluation index system for agricultural green development. Ecology Econom. 34, 21–24+46.
Zhang, Y., and Liu, Y. (2024). The impact of rural industrial integration on agricultural carbon emissions evidence from China provinces data. Sustainability 16:680. doi: 10.3390/su16020680
Zheng, X., Tan, H., and Liao, W. (2024). Spatiotemporal evolution of factors affecting agricultural carbon emissions: Empirical evidence from 31 Chinese provinces. Environ. Dev. Sustain, 1–35. doi: 10.1007/s10668-023-04337-z
Keywords: rural digitization, agricultural carbon emission efficiency, spatial spillover effect, threshold effect, China, impact
Citation: Jiang W and Chen C (2025) The impacts of rural digitization on agricultural carbon emission efficiency: evidence from 30 provinces in China over 2011–2022. Front. Sustain. Food Syst. 9:1593986. doi: 10.3389/fsufs.2025.1593986
Edited by:
Fuyou Guo, Qufu Normal University, ChinaReviewed by:
Xiao Yang, Krirk University, ThailandYongguang Zou, Huaqiao University, China
Yongkang Liang, Yan’an University, China
Copyright © 2025 Jiang and Chen. This is an open-access article distributed under the terms of the Creative Commons Attribution License (CC BY). The use, distribution or reproduction in other forums is permitted, provided the original author(s) and the copyright owner(s) are credited and that the original publication in this journal is cited, in accordance with accepted academic practice. No use, distribution or reproduction is permitted which does not comply with these terms.
*Correspondence: Chen Chen, Y2MyMDIzb2tAMTYzLmNvbQ==