 Duygu Cabuk Kok
 Seda Genc
 Yekta Goksungur
- 1Ege University, Engineering Faculty, Department of Food Engineering, Bornova, Izmir, Türkiye
- 2Yasar University, School of Applied Sciences, Department of Gastronomy and Culinary Arts, Bornova, Izmir, Türkiye
- 3Genc ve Naturel Food Industry Trade Inc., Balçova, İzmir, Türkiye
Apple juice production is an essential part of the global beverage industry with notable implications for sustainable development. However, the process generates significant exergy destruction and waste by-products. A systematic evaluation of process efficiency and valorization of by-products is necessary to support resource optimization and sustainability. This study applied exergy analysis to assess the sustainability of apple juice production processes. Two common methods were examined: aseptic filling and glass bottle filling. Exergy destruction, energy efficiency, and exergy efficiency were calculated for each stage. Additionally, the by-product apple pomace was processed into value-added products (apple jam and dietary fiber) to evaluate the impact on overall system efficiency. Sankey-Grassmann diagrams were used to visualize exergy flows. The total exergy destruction was 608.15 kW for aseptic filling and 538.27 kW for glass bottle filling. Energy efficiencies were determined as 80.8% and 98.8%, while exergy efficiencies were 58.9% and 59.9%, respectively. The mixing tank caused the highest exergy destruction (307.1 kW), followed by the second pressing stage (80.82 kW) and the cooling-1 stage (75.97 kW). When apple pomace was valorized, the exergy efficiency of aseptic filling increased to 82.5% (jam) and 72.4% (dietary fiber), while glass bottle filling improved to 83.5% (jam) and 73.4% (dietary fiber). The findings highlight the crucial role of chemical exergy in evaluating process sustainability. Valorization of apple pomace into jam and dietary fiber significantly improves exergy efficiency while reducing waste. This approach enhances resource utilization, decreases environmental burden, and supports the transition toward a more sustainable beverage production model.
1 Introduction
Apple is among the most widely cultivated and consumed fruits globally (Smith and Lal, 2022). Historically significant in agricultural and economic contexts, apples are used as fresh fruit and in processed products (Brown, 2012). Their nutritional value, taste, and health benefits are key factors driving their popularity among consumers (Vallée Marcotte et al., 2022). According to the 2023 data, China is the largest apple producer globally, accounting for nearly 50% of the World's apple production, followed by the United States, Turkey, Poland, and India. Turkey is a significant player in global apple production, with a reported output of ~4.6 million tons in 2023 (FAO, 2023).
Among processed apple products, apple juice is one of the most preferred. Its natural composition, high nutritional value, and ease of storage make apple juice a key commercial product in both local and international markets (Garcia-Garcia et al., 2021). The global apple juice market was valued at ~$17 billion in 2022 and is projected to grow steadily, driven by increasing demand for natural and health-focused beverages (Mordor Intelligence, 2025). China dominates the market regarding apple juice production, contributing over 30% of the global apple juice supply. At the same time, countries like Poland, Germany, and the United States play key roles in production and export (Statista, 2023).
Sustainability in food production is increasingly emphasized, addressing environmental concerns through waste management, energy efficiency, water conservation, and sustainable raw material sourcing. Energy and exergy analyses are essential methodologies for evaluating the efficiency and sustainability of processes within the industry. Energy analysis focuses on the quantity of energy consumed, while exergy analysis assesses both the quantity and quality of energy, identifying irreversibilities and potential improvements in processes. Exergy analysis evaluates the efficiency of energy utilization in a system, considering both the quantity and quality of energy (Zalazar-Garcia et al., 2022). This enables more precise identification of energy losses and inefficiencies in processes. In energy-intensive processes, exergy analysis helps pinpoint areas of significant energy loss, offering recommendations for improvements (Brown, 2012). This approach not only optimizes energy consumption but also supports the sustainable use of natural resources (Smith and Lal, 2022).
Exergy analysis plays a critical role in tackling energy and resource inefficiencies in the food processing industry, particularly in apple juice production. The process involves multiple energy-intensive stages, including washing, milling, pressing, pasteurization, and evaporation, each contributing to significant exergy destruction. Apple pomace, a by-product of juice extraction, can be converted into biogas, minimizing waste and reducing carbon emissions, while energy-efficient technologies and water recycling systems in processing plants significantly lower resource consumption. By identifying stages with high irreversibilities and energy losses, exergy analysis provides a framework for optimizing thermal processes, enhancing energy efficiency, and minimizing environmental impacts. Integrating sustainable practices and leveraging exergy analysis not only mitigates environmental impact but also ensures long-term economic and social benefits. As global energy resources become increasingly constrained and sustainability targets more pressing, exergy analysis serves as a vital tool for achieving cleaner production practices, bridging knowledge gaps, and positioning the industry as a model for sustainable and energy-efficient food manufacturing.
However, only a few studies in the literature have examined the second law efficiency of the apple juice process, and these primarily focus on the agriculture of apples and have a very narrow scope within apple juice production. The study conducted by Yildizhan et al. (2021) applies a thermodynamic perspective to assess the environmental impacts of energy consumption in apple production. the research offers insights into how integrating renewable energy sources can influence the sustainability and environmental footprint of apple production processes. On the other hand, a comprehensive analysis of the apple juice production process through energy flow modeling and life cycle assessment (LCA) was investigated by Khanali et al. (2020) using bio-fertilizers and biological control approaches in the agricultural production step as well as implementing renewable energy technologies in the juicing step could potentially mitigate the environmental burdens of apple juice production. The environmental impact of apple juice production, including waste management and resource utilization, is an essential consideration in exergy analysis. The study by Ploscutanu et al. (2019) discusses the potential for revalorizing apple pomace and other by-products from juice production, which can contribute to a more sustainable production cycle. This aligns with the principles of exergy analysis, which advocate for minimizing waste and maximizing the utility of all resources involved in the production process.
This study approaches the valorization of organic waste generated in the food industry not merely as a waste disposal strategy, but as a holistic and sustainable practice aligned with the principles of the circular economy, aiming to retain resources within the system. The circular economy is a systemic transformation model that seeks to preserve the economic value of products, materials, and resources for as long as possible, while minimizing waste generation and reducing environmental impacts (European Commission, 2020; UNEP, 2024). This approach prioritizes the reuse of waste as a resource within the production–consumption cycle, reducing the need for landfill, enhancing material circularity, and conserving natural resources (FAO, 2023; Fetting, 2020).
A concrete example of this transformation is the conversion of organic waste from food production, particularly apple pomace, which contains high levels of nutritional and functional compounds, into value-added products (Kauser et al., 2024; Cemeroglu, 2019). In this context, the present study demonstrates that transforming apple pomace, a by-product of apple juice processing, into both a traditional food product (jam) and a functional food additive (dietary fiber) helps reduce overall system waste, improve resource efficiency, and minimize environmental impact (Muslu Can et al., 2024; Vaez et al., 2023).
In this regard, the study directly aligns with Sustainable Development Goal (SDG) 12 of the United Nations: “Responsible Consumption and Production.” It also contributes to the targets of the European Union's 2020 Circular Economy Action Plan and the European Green Deal, which prioritize the conversion of waste into resources and the mitigation of environmental impacts (European Commission, 2020; Fetting, 2020; EPA, 2025).
The objective of this study is to assess the sustainability of the apple juice production line using exergy analysis by evaluating processes such as washing, grinding, enzymatic treatment, pressing, aroma recovery, clarification, filtration, evaporation, cooling, mixing, deaeration, homogenization, pasteurization, and filling. Additionally, the study aims to calculate the exergy efficiency and destruction rate of each component, as well as the overall system, to identify inefficiencies and evaluate performance from a sustainability perspective.
To fulfill the stated aim and achieve the corresponding objectives, the study formulates the following set of research questions (RQs), which serve to frame the thermodynamic assessment, guide the exergy-based evaluation of the apple juice production system, and explore the broader implications of waste valorization within a circular economy framework.
1. What are the energy- and exergy-efficiency profiles of each unit operation in an industrial apple-juice production line (washing, grinding, enzymatic treatment, pressing, aroma recovery, clarification, filtration, evaporation, cooling, mixing, deaeration, homogenization, pasteurization, and filling)?
2. Which unit operations contribute most to total exergy destruction, and what physical or chemical mechanisms drive these irreversibilities?
3. How does valorizing apple-pomace waste into (i) apple-jam and (ii) dietary-fiber products alter overall system exergy efficiency and waste-to-resource ratios?
4. What combinations of process parameters (e.g., filling technology, heat-transfer conditions) minimize exergy destruction while maintaining product quality and food-safety standards?
5. How do the thermodynamic improvements achieved translate into environmental-performance indicators such as greenhouse-gas (GHG) abatement, material circularity, and resource savings?
To address the research questions, the present study applies first- and second-law thermodynamic analyses to a full-scale apple juice production line, quantifying exergy flows at each processing stage and assessing the improvements achieved through the valorization of apple pomace into value-added products. Section 2 provides a critical review of the literature related to exergy analysis in food processing, waste valorization strategies, and the integration of circular economy principles in agri-food systems. Section 3 outlines the system description, including plant layout, operational conditions, and thermodynamic modeling approach. Section 4 presents detailed mass, energy, and exergy balances, supported by Sankey–Grassmann diagrams to visualize exergy destruction across unit operations. Section 5 evaluates the impact of waste valorization scenarios on overall exergy efficiency and environmental performance. Finally, Section 6 summarizes the key managerial implications, highlights limitations, and outlines future research directions.
2 Literature review
In the food industry, pasteurization, drying, cooling, and packaging often involve high energy consumption, making these analyses essential for optimization. Studies show that exergy efficiency in food processing is generally lower than energy efficiency, highlighting significant room for improvement (Dincer and Cengel, 2001). Numerous studies have employed this approach as a measurement tool for processes such as yogurt production, potato crisp frying, sugar factories and vegetable oil refineries, milk pasteurization, wine production, and fruit juice processing (Oztuna Taner, 2024; Taner and Sivrioglu, 2015; Sulaiman et al., 2012; Genc et al., 2017; Waheed et al., 2008; Genc and Hepbasli, 2015; Yildirim and Genc, 2017; Khorasanizadeh et al., 2021). A study on a dairy plant producing yogurt conducted by Oztuna Taner (2024), utilized energy and exergy analyses to enhance process efficiency, revealing an energy efficiency of 63.3% and highlighting areas for optimization. Similarly, exergy analysis has been applied to sugar factories and vegetable oil refineries, providing insights into energy consumption patterns and guiding process improvements (Taner and Sivrioglu, 2015; Sulaiman et al., 2012). Genc et al. (2017) conducted a comprehensive exergy analysis of a red wine production line to assess its thermodynamic efficiency and sustainability. They reported that the overall exergy efficiency of the system indicated that a significant portion of the input energy is lost due to irreversibilities in the process. A study conducted on an orange juice manufacturing plant in Nigeria revealed that the pasteurization process was the most energy-intensive. The exergy analysis indicated that the pasteurizer was responsible for over 90% of the system's inefficiencies (Waheed et al., 2008). Another research focused on an industrial-scale orange juice production plant in Iran. The plant consisted of four main lines: steam generation, above-zero refrigeration, mixing, and pasteurization. Within this line, the boiler and compressor had the highest contribution to exergy destruction, accounting for 89% of the losses. The study recommended improvements such as thermal insulation for the ice-water tank and the use of variable speed drives for pumps to enhance efficiency (Khorasanizadeh et al., 2021). The application of these analyses enables the identification of energy losses and the development of strategies to reduce waste, improve energy utilization, and enhance overall process sustainability in the food industry (Zisopoulos et al., 2017).
A significant portion of previous studies in the food sector has focused on drying processes. Kirmizikaya and Çinar (2018) reported that 66% of energy–exergy studies in food processing dealt with drying, while only a small proportion examined pasteurization (6%) and evaporation (4%). For example, Sabanci and Içier (2022) reported an energy efficiency of 86% and an exergy efficiency of 53% for ohmic-assisted vacuum drying of orange pomace. Similarly, Torshizi et al. (2020) reported a maximum exergy efficiency of 59.46% in citrus juice drying under different voltage gradients.
In thermal processes such as pasteurization and evaporation, significant exergy losses have been observed, especially in heat exchangers. Yildirim and Genc (2015) reported 71% energy and 56% exergy efficiency in a geothermal-assisted milk pasteurization system and highlighted the need for improvements in the absorber unit. Soufiyan et al. (2016), in their comparison of evaporator systems for tomato paste production, showed that the highest losses occurred in the steam generation unit. Singh et al. (2019) calculated 88% energy and 66% exergy efficiency in cream pasteurization.
Similar findings have been reported in industrial-scale studies. Genc and Hepbasli (2015) calculated an overall exergy efficiency of only 0.35% in a french fries production line, with the highest destruction occurring in the combustion unit. Khorasanizadeh et al. (2021) found that the boiler and compressor systems accounted for 89% of total exergy destruction in an industrial orange juice processing plant. Rebolledo-Leiva et al. (2024) emphasize the importance of integrating energy, environmental, and economic assessments in food processing systems.
In the food industry, waste management is considered a key component in ensuring environmental sustainability and resource efficiency (UNEP, 2024; FAO, 2023). In particular, the environmentally sound valorization of organic waste not only creates ecological benefits but also generates economic value. In this context, the circular economy has become a cornerstone of sustainable development by being integrated into production and consumption systems (European Commission, 2020; Fetting, 2020). Circular economy practices are materialized through the transformation of by-products into animal feed, biogas, compost, bioplastics, or functional food additives, thereby supporting local development and contributing to the reduction of environmental pressures (Kauser et al., 2024).
In this regard, apple pomace, which is commonly treated as a low-value waste in apple juice production, emerges as a valuable biomass due to its high levels of pectin, dietary fiber, phenolic compounds, and antioxidants (Cemeroglu, 2019; Kauser et al., 2024). Studies in the literature have shown that this by-product can be converted into a wide range of products, including jam, marmalade, probiotic foods, functional flours, bioethanol, and biogas (Demirkol, 2021; Vaez et al., 2023; Duggan et al., 2025). Naturally extracted pectin from apple pomace can be used as a gelling agent in jams and marmalades, and as a source of fiber and polyphenols in probiotic products, offering added functional value (Sharma et al., 2016; Costa et al., 2022).
However, such waste valorization should be examined not only at the product level but also from a process perspective. In this regard, energy and exergy analyses serve as key tools for assessing the thermodynamic efficiency of production systems. While energy analysis accounts for the input–output balance of energy in the system, exergy analysis provides a measure of irreversibility and quality degradation, allowing identification of areas for improvement (Çengel et al., 2019).
Nevertheless, a significant gap remains in the literature: very few studies have investigated the impact of waste valorization on energy and exergy efficiency at the system level. While most studies examine product development or process efficiency separately, holistic approaches combining both are limited. Therefore, this study examining the conversion of apple pomace into both a traditional product (jam) and a functional ingredient (dietary fiber) aims to address this gap by evaluating not only circular economy practices but also their effects on thermodynamic performance.
3 Materials and methods
3.1 System description
3.1.1 General description of the apple juice production process
The production of apple juice involves several essential steps, each requiring specific energy inputs. The process begins with washing to remove dirt, debris, and pesticides and sorting the apples. Next, the apples are ground into mash followed by an enzymatic treatment. Then it is pressed to extract the juice. After the aroma recovery and clarification steps, the extracted juice is filtered to eliminate any remaining solid particles and, evaporated to reduce its volume. The concentrated juice is cooled and mixed with aroma and water. The juice is deaerated and homogenized. Pasteurization follows, during which the juice is heated to destroy harmful microorganisms and prolong its shelf life. Finally, the juice is cooled and carefully packaged into bottles or cartons, ready for distribution. A simplified diagram of the apple juice production process is presented in Figure 1.
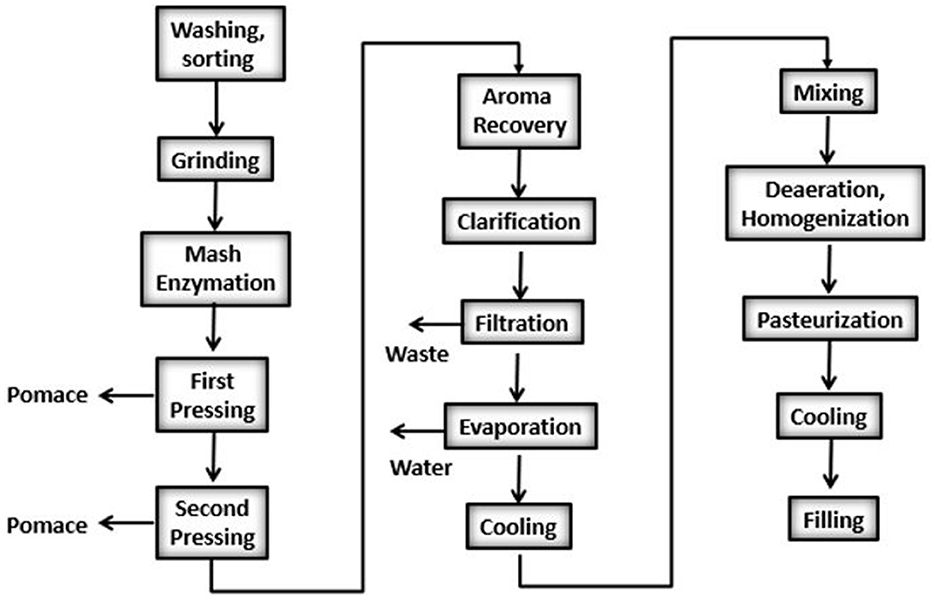
Figure 1. Simplified flow diagram of an apple juice production process.
Each stage of apple juice production involves significant energy demands. For example, grinding and pressing require mechanical energy, and pasteurization involves substantial heat application. Although these processes are essential for producing safe and high-quality apple juice, inefficient energy use can lead to notable environmental impacts. A thorough understanding of energy consumption at each stage is vital for identifying inefficiencies, reducing waste, and enhancing the overall sustainability of apple juice production.
The data used in this study were obtained from an industrial-scale fruit juice factory operating in the Aegean Region of Türkiye. This facility directly provided information and data related to the apple juice production process. The production process was monitored on-site, and all data were measured directly during actual operations; none were simulated or extracted from the literature. The study evaluated two different apple juice production methods, covering the entire production chain from raw material procurement to packaging in aseptic cartons and glass bottles. Additionally, the apple pomace generated during the second pressing stage of concentrate production was valorized into value-added products such as apple jam and dietary fiber. The apple jam production process was designed based on the framework proposed by Sharma et al. (2016), while dietary fiber production followed the methodology outlined by Demirkol (2021). Energy consumption, efficiency, and product output were analyzed through detailed thermodynamic calculations performed using Microsoft Excel.
3.1.2 System boundaries and description
As shown in Figure 2, the apple juice production process begins with (I) washing, elevator, and sorting, where apples (Stream 1) are cleaned, sorted, and prepared for processing. Next, the sorted and washed apples (Stream 2) are (II) ground into mash (Stream 3), followed by (III) mash enzymation, where pectolytic enzymes (Stream 23) are added to break down cell walls and improve juice extraction. The mash (Stream 4) then undergoes (IV) first pressing, extracting the primary juice (Stream 24) and leaving behind pomace (Stream 5). The remaining mash proceeds to (IV) second pressing, which extracts additional juice (Stream 6) and generates additional pomace (Stream 25) as a byproduct. The process continues with (VI) aroma recovery, where volatile compounds (Stream 26) are collected to enhance flavor, and the juice moves to (VII) clarification tanks, where suspended solids (Stream 30) are removed through sedimentation. The clarified juice (Stream 8) is further refined through (VIII) coarse filtration and (IX) kieselguhr filtration to ensure clarity. The filtered juice (Stream 10) is then concentrated in (X) evaporation, where water (Stream 32) is removed to produce apple juice concentrate (Stream 11). The concentrate is subsequently (XI) cooled to create cooled apple concentrate (Stream 12). After cooling, the concentrate is sent to (XII) a mixing tank, where it is blended with water (Stream 33) and aroma (Stream 34) for uniformity, producing reconstituted apple juice (Stream 13). This juice is further treated through (XIII) deaeration and homogenization, where dissolved air is removed, and the texture is stabilized, followed by (XIV) pasteurization, where the juice (Stream 15) is heat-treated to eliminate microorganisms and extend shelf life. After pasteurization, the juice is rapidly (XV) cooled-1 for aseptic filling (Stream 16) or further (XVII) cooled-2 for glass bottle filling (Stream 18). The final steps involve (XVI) aseptic filling into sterilized cartons (Stream 17) or (XVIII) glass bottle filling (Stream 19), completing the apple juice production process (Figure 2).
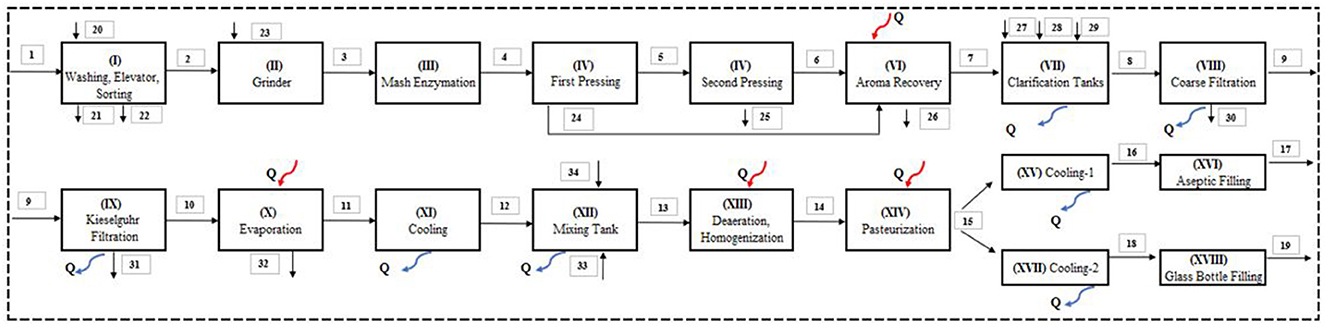
Figure 2. Schematic of the system of apple juice production process with the aseptic filling process and glass bottle filling process.
Figure 3 illustrates a schematic diagram of the considered system of an apple jam production process. The byproduct pomace (Stream 25) from the second pressing is utilized for apple jam production. In the jam production process, pomace is sent to (XIX) cleaning, where impurities are removed, resulting in cleaned pomace (Stream 35) and waste (Stream 40). The cleaned pomace is then (XX) diluted with water (Stream 41) to create diluted pomace (Stream 36), which proceeds to (XXI) boiling, where it is heated to concentrate the mixture, releasing water vapor (Stream 42) and producing boiled pomace (Stream 37). In mixture preparation (XXII), sugar (Stream 43) is added to the boiled pomace to form the jam base (Stream 38), which is then packaged in (XXIII) filling, resulting in the final apple jam (Stream 39) (Figure 3).
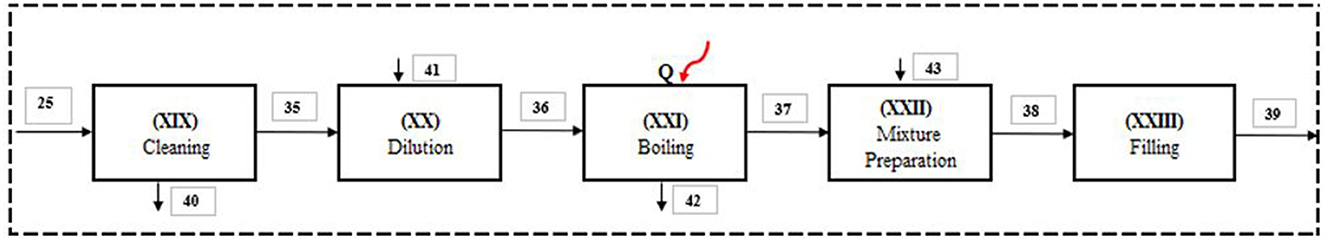
Figure 3. Schematic of the system of jam production process from apple pomace.
Figure 4 highlights the dietary fiber production process. The process begins with (XXIV) drying, where apple pomace (Stream 25), obtained from the apple juice production process, is dried to reduce its moisture content. This results in dried pomace (Stream 44) and water vapor (Stream 60). The dried pomace is then subjected to (XXV) grinding, where it is ground into smaller particles (Stream 45). Following this (XXVI), cold storage ensures the pomace is stored under suitable conditions (Stream 46) to maintain its quality. In the (XXVII) chemical addition for analysis step, chemicals such as hexane (Stream 61) and phosphate buffer solution (Stream 62) are added to the stored pomace, producing chemically treated pomace (Stream 47). This processed pomace is then subjected to heating (XXVIII) (Stream 48) to promote chemical reactions and fiber extraction, while water vapor (Stream 64) is released as heat loss. The process continues with (XXIX) incubation and pH adjustment, where solutions like 1 M HCl (Stream 65) and pepsin solution (Stream 66) are added to adjust the pH and optimize enzymatic activity. This results in pH-adjusted pomace (Stream 49).
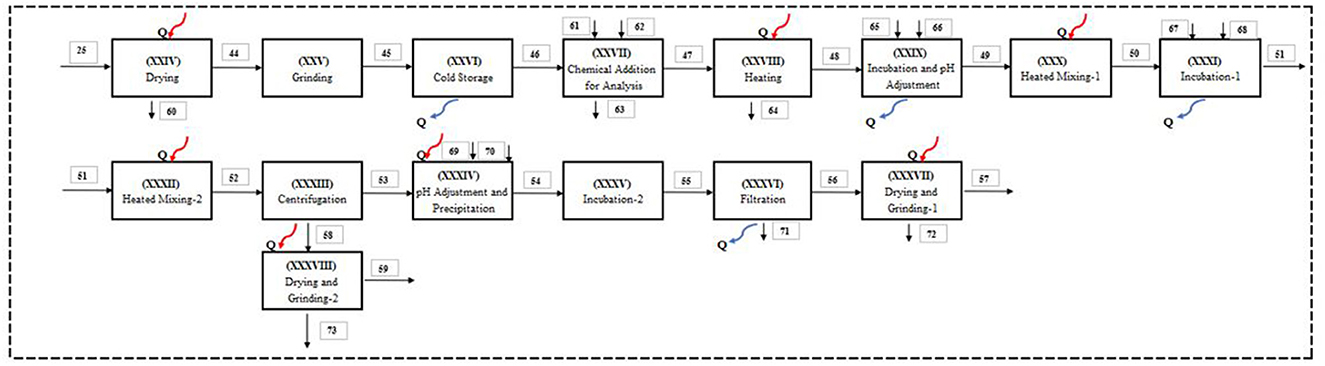
Figure 4. Schematic of the system of dietary fiber production process from apple pomace.
The pH-adjusted pomace is then processed in (XXX) heated mixing-1, where it undergoes mixing and heating (Stream 50). This is followed by (XXXI) incubation-1, where additional solutions such as 6 M NaOH (Stream 67) and pancreatin solution (Stream 68) are added to extract soluble fibers, producing incubated pomace (Stream 51). The mixture undergoes (XXXII) heated mixing-2 (Stream 52) to enhance fiber extraction, followed by (XXXIII) centrifugation, which separates water-soluble dietary fibers (Stream 57) from residues (Stream 53). The residues from centrifugation are treated in (XXXIV) pH adjustment and precipitation, where solutions like ethanol (Stream 70) and 1 M HCl (Stream 69) are used to precipitate fibers, producing precipitated fractions (Stream 58).
The precipitated fractions are further processed through (XXXV) incubation-2 (Stream 55) and (XXXVI) filtration, which separates water-insoluble dietary fibers (Stream 59) from wastewater (Stream 71). Finally, the water-soluble dietary fibers are subjected to (XXXVII) drying and grinding-1, resulting in the final product (Stream 57), while the water-insoluble dietary fibers are processed through (XXXVIII) drying and grinding-2, yielding the final product (Stream 59). This process effectively converts apple pomace into valuable dietary fibers, minimizing waste and maximizing resource utilization (Figure 4).
3.2 Process modeling
The fundamental mass, energy, and exergy balance equations are applied to the system of interest to determine exergy destruction and efficiencies, assuming a steady-state and steady-flow process. In general, the mass balance equation is explained in the rate form as (Başaran et al., 2021; Çengel et al., 2019; Genc et al., 2017)
The general energy balance can be expressed as the total energy input equals to the total energy output
with all energy terms it becomes
The general exergy balance equation is defined in the rate form as
or
where
Exergy can be classified into physical and chemical exergy. In this study, both physical and chemical exergy have been taken into account in all steps of the process.
The specific physical exergy of stream is calculated by using Equation 7.
where the specific enthalpies of streams are computed by the formula
where 0 denotes the reference environment of the system (T0 = 25°C, P0 = 1 atm).
The specific entropies of the streams are calculated as;
The specific chemical exergy of stream is calculated by using Equation 10.
The composition of streams used in the calculation of specific heat and chemical exergy is tabulated in Table 1 (Genc et al., 2017).
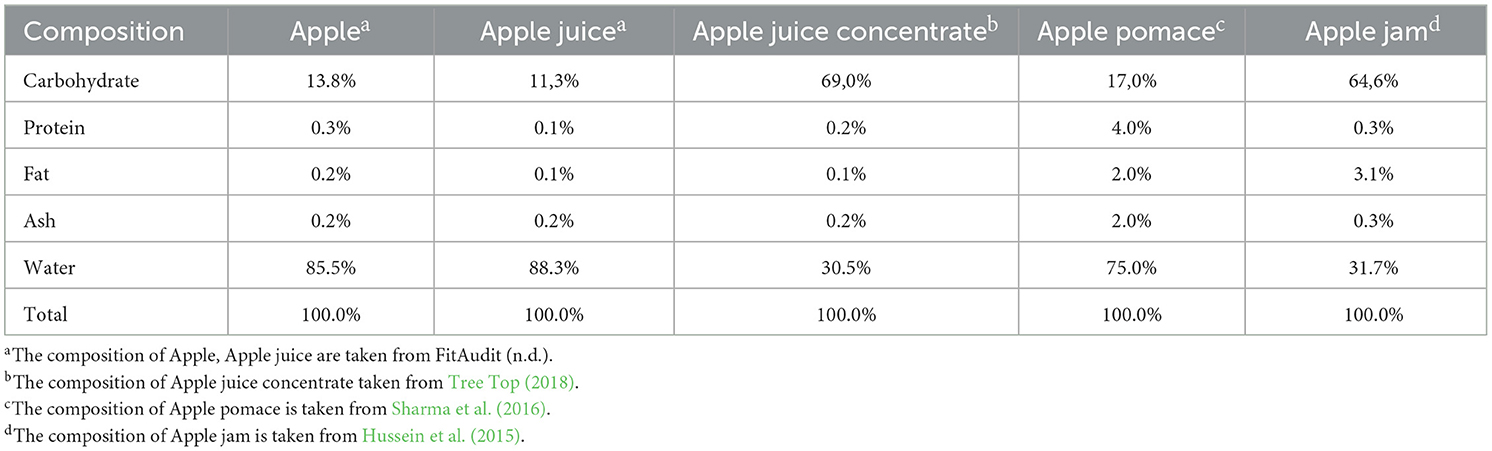
Table 1. The compositions used in the calculation of specific heat and chemical exergy.
The specific heat capacities of streams based on their composition (given in Table 2) are computed according to Equation 11
The specific chemical exergy of the stream will be calculated using Equation 12
In Equation 12, xi is the mass fraction of ingredients found in stream composition, and is specific chemical exergy. If two or more streams are incorporated, exergy is destructed and defined as in Equation 13.
where Nt is total mole number of stream and R and T0 are universal gas constant and reference temperature, respectively and ak is the activity of ingredient k, which is proportional to the mole fraction of this ingredient in the total mixture and the activity coefficient is assumed to be 1 as the streams are assumed as ideal solution (Szargut et al., 1988).
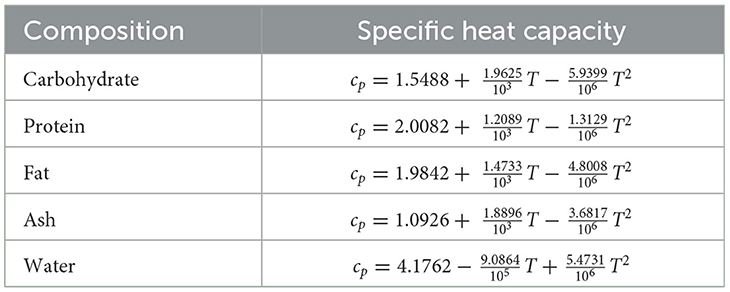
Table 2. Specific heat capacities of streams depending on composition and temperature (°C).
The specific chemical exergy , heat capacity (cp) and molecular weight (Mw) values of the ingredients used for calculations are tabulated in Table 3.
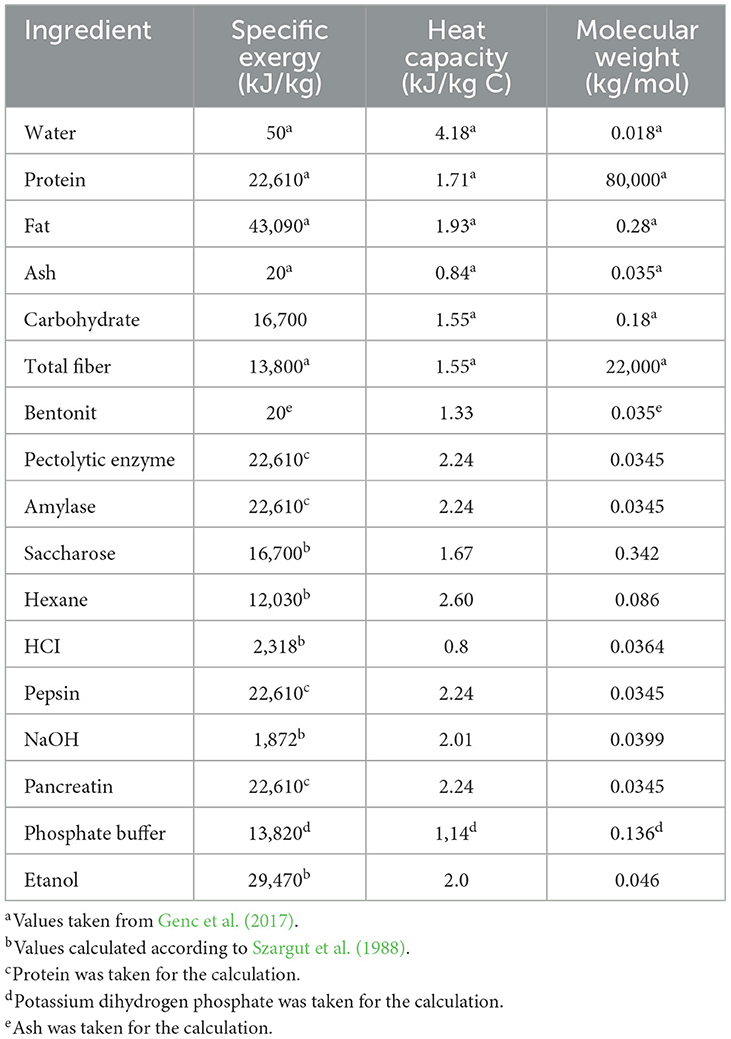
Table 3. Specific chemical exergy (), heat capacity (cp), and molecular weight (Mw) values of components used in calculations.
The energy efficiency of the overall system is defined by the formula as follows:
Additionally, the exergy efficiency of the overall system is determined as the ratio of the exergy of product over the exergy of fuel (Equation 15).
The mass, energy, and exergy balance equations of the apple juice production processes (based on the system components shown in Figure 2), along with the exergy efficiency of each component calculated as the ratio of the exergy of the product to the exergy of the fuel, are presented in Table 4.
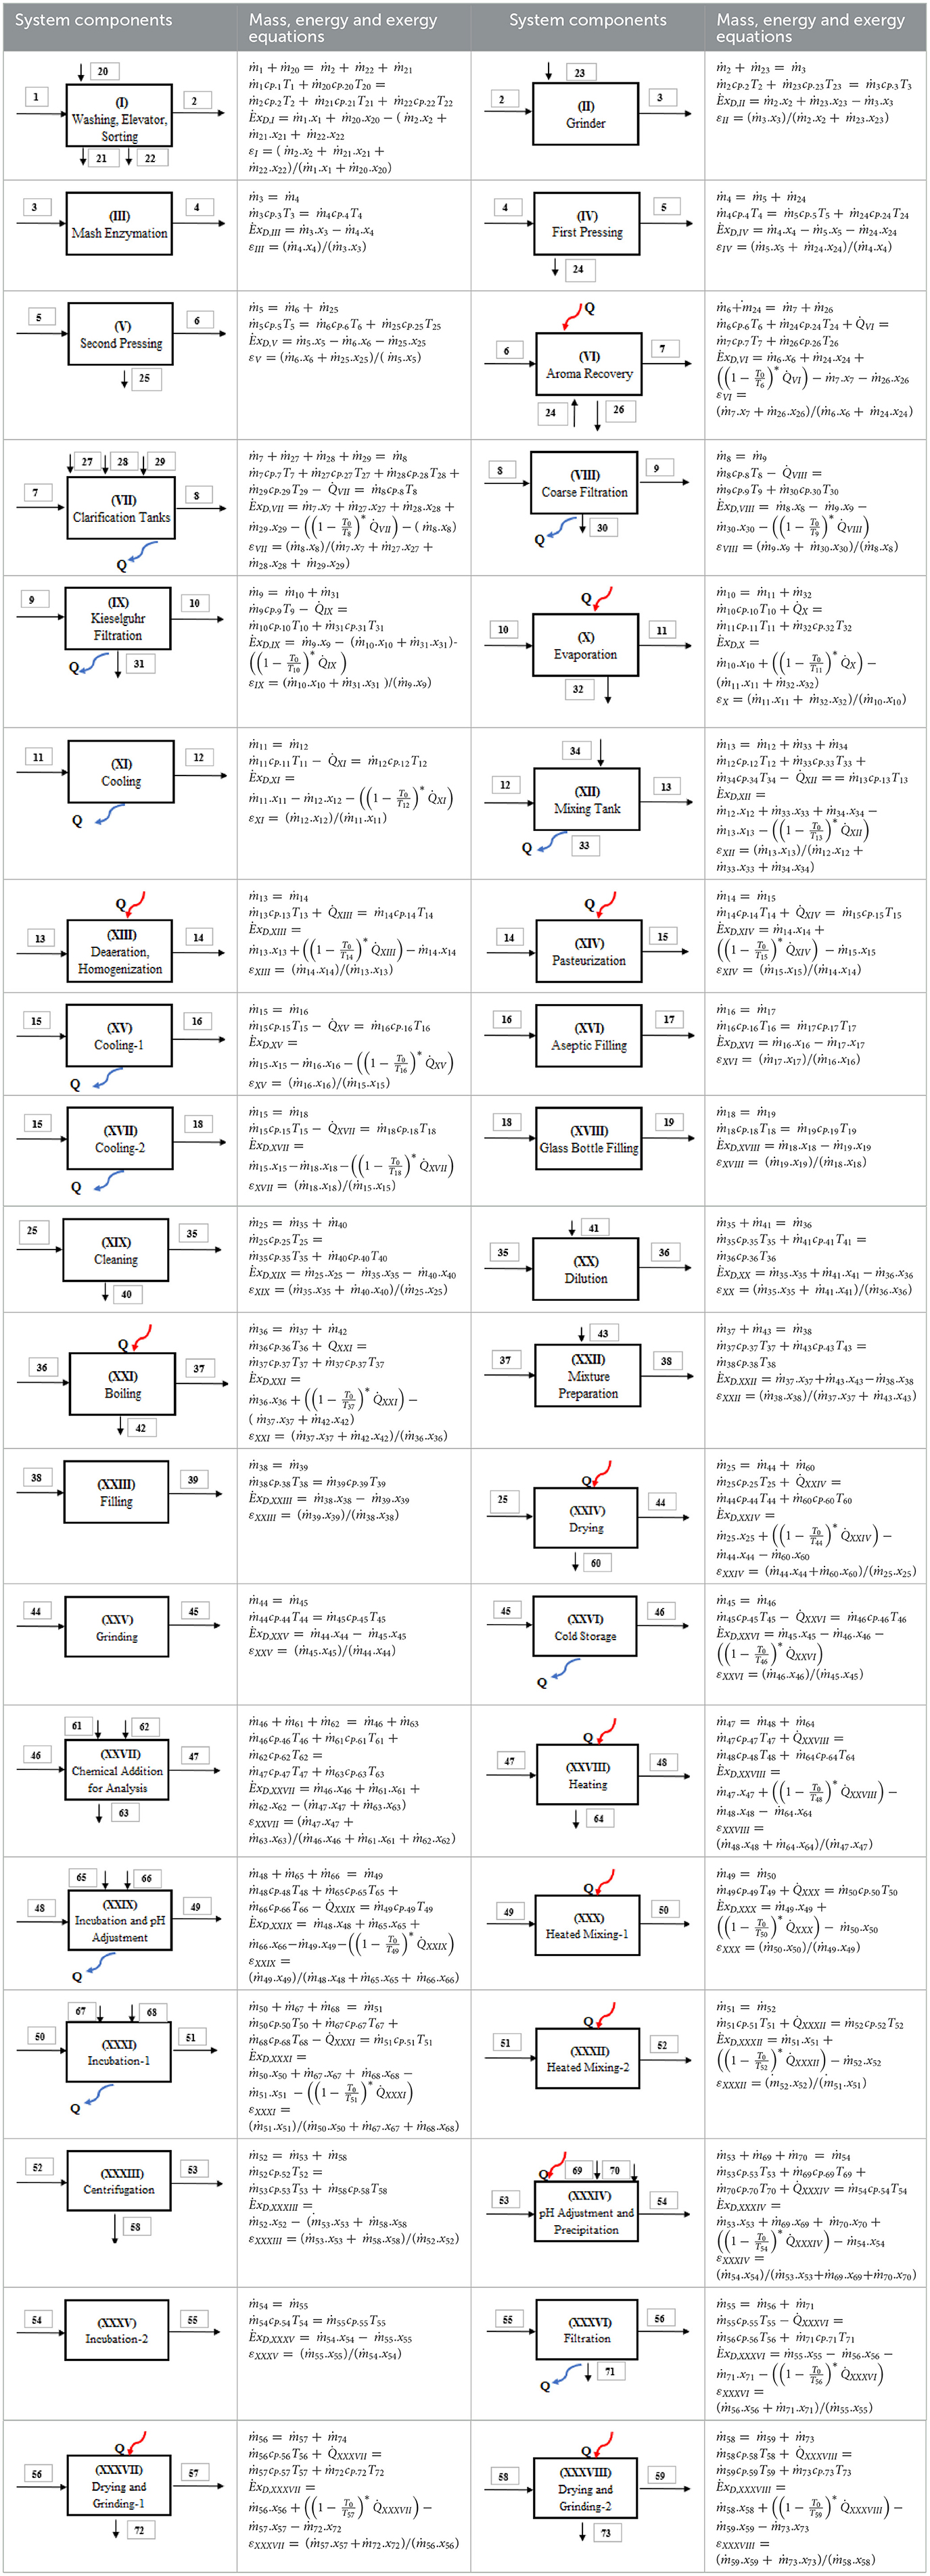
Table 4. The mass energy and exergy equations of the components of the whole process.
3.3 Data used and assumptions made
The apple juice production process described in Section 3.1 is evaluated using the first and second law analyses, while the model outlined in Section 3.2 is applied to this system. The primary data for this study were obtained from an apple juice factory and literature sources and were modeled based on the assumptions detailed below. Using these data, enthalpy and entropy values were calculated in Microsoft Excel following the formulas presented in Equations 8 and 9 (Syahrul et al., 2002). The input and output streams for each operation are summarized in Table 5. The thermodynamic properties of all streams (including apple, apple pomace, apple juice, and water), as depicted in Figure 2, are determined, and the results are presented in Table 6 as a sample case.
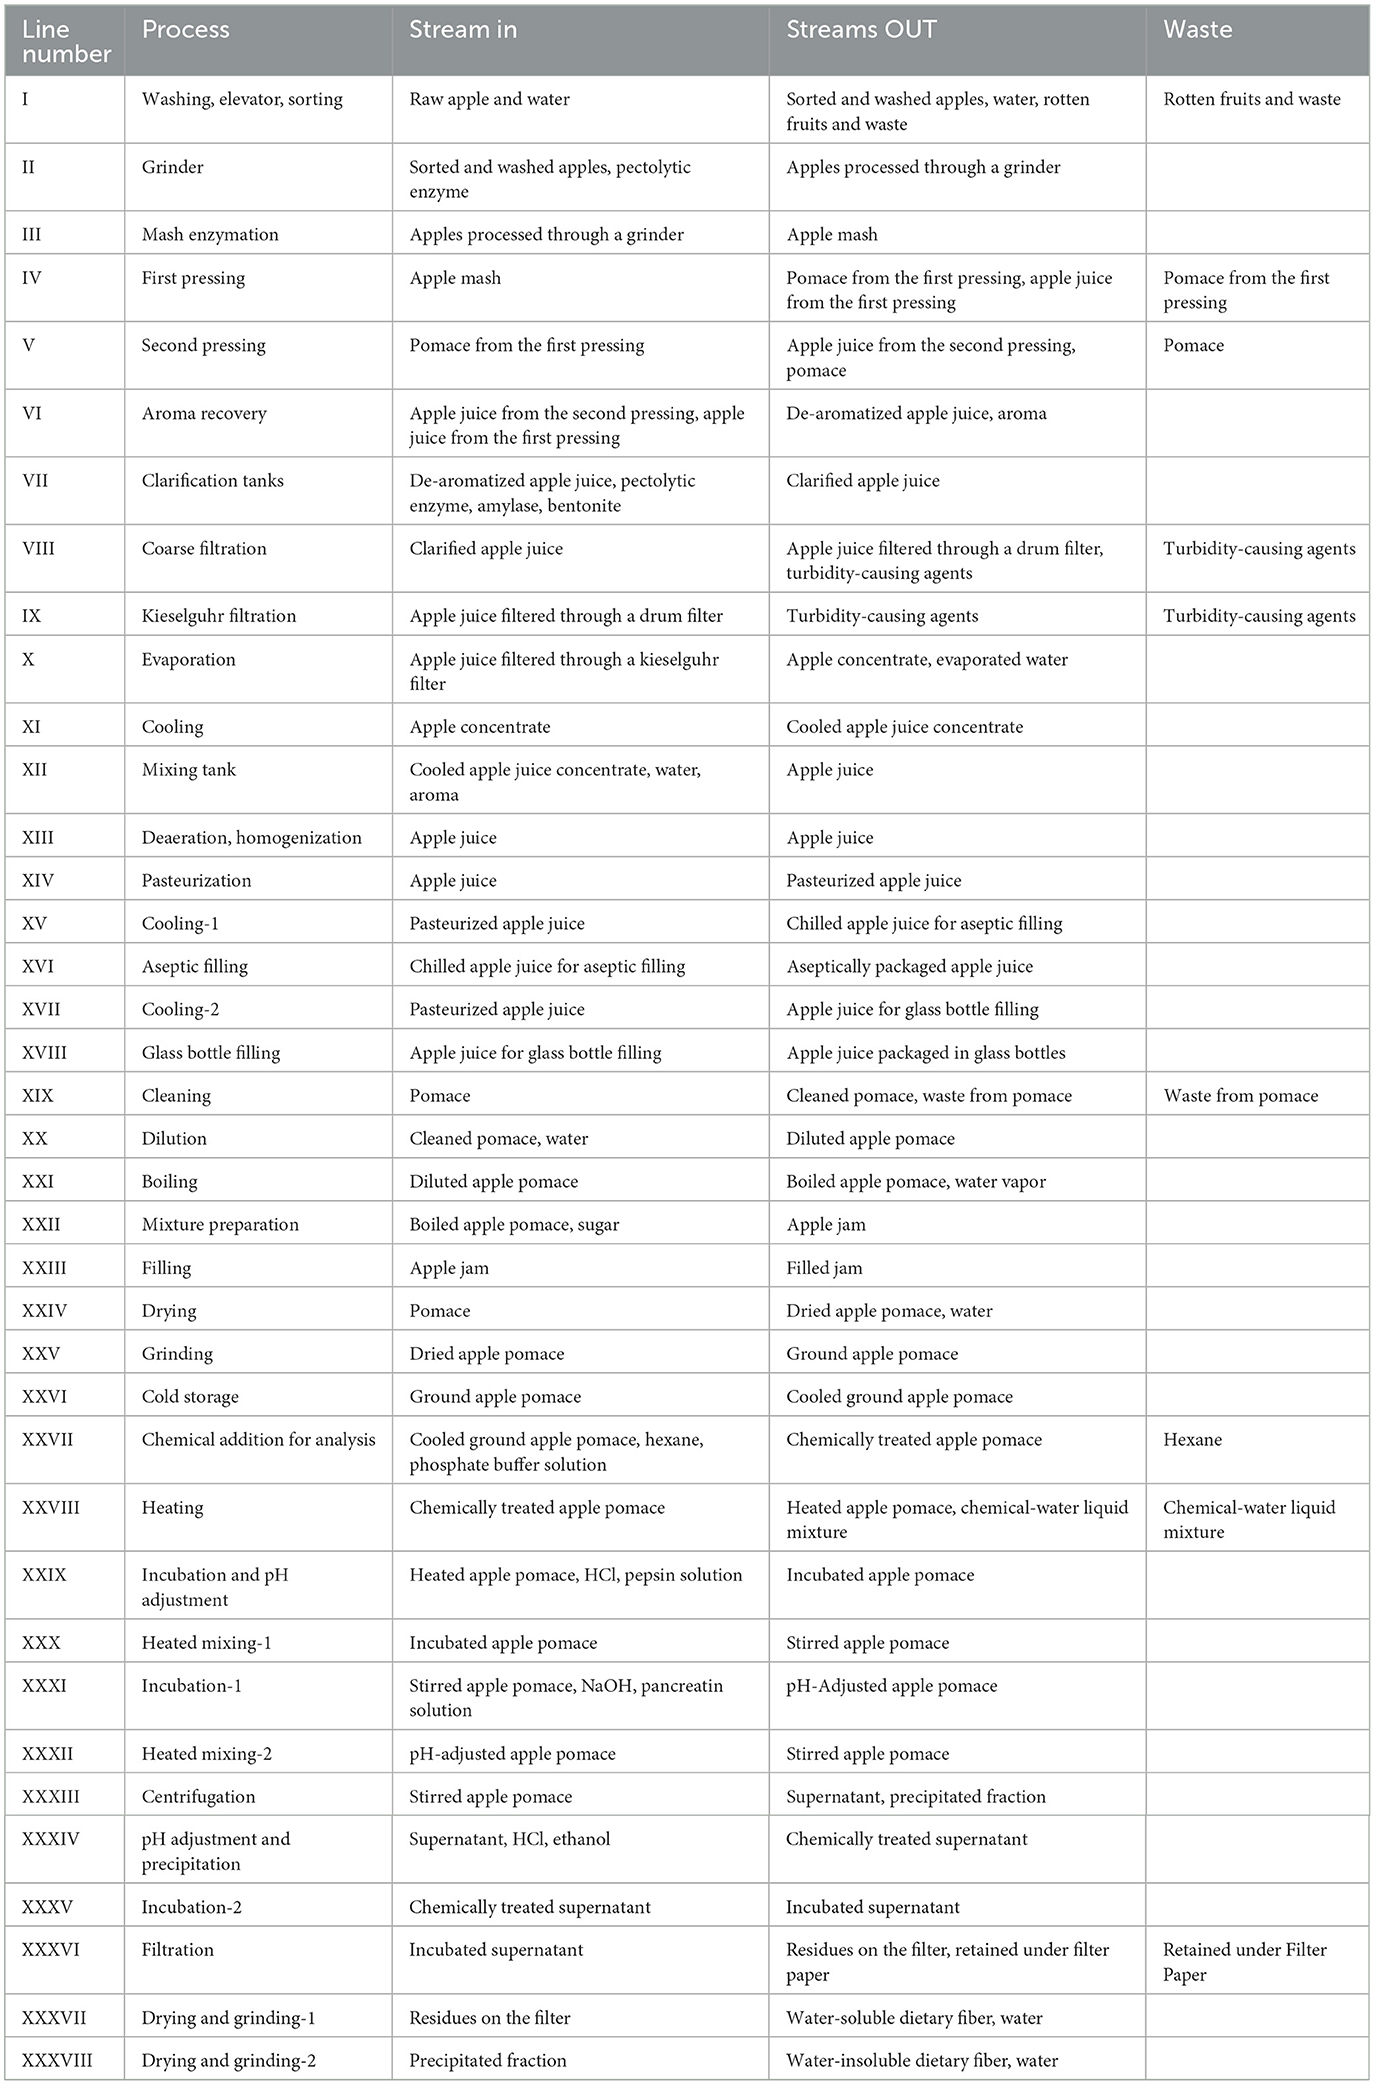
Table 5. Definition of streams used in the system.
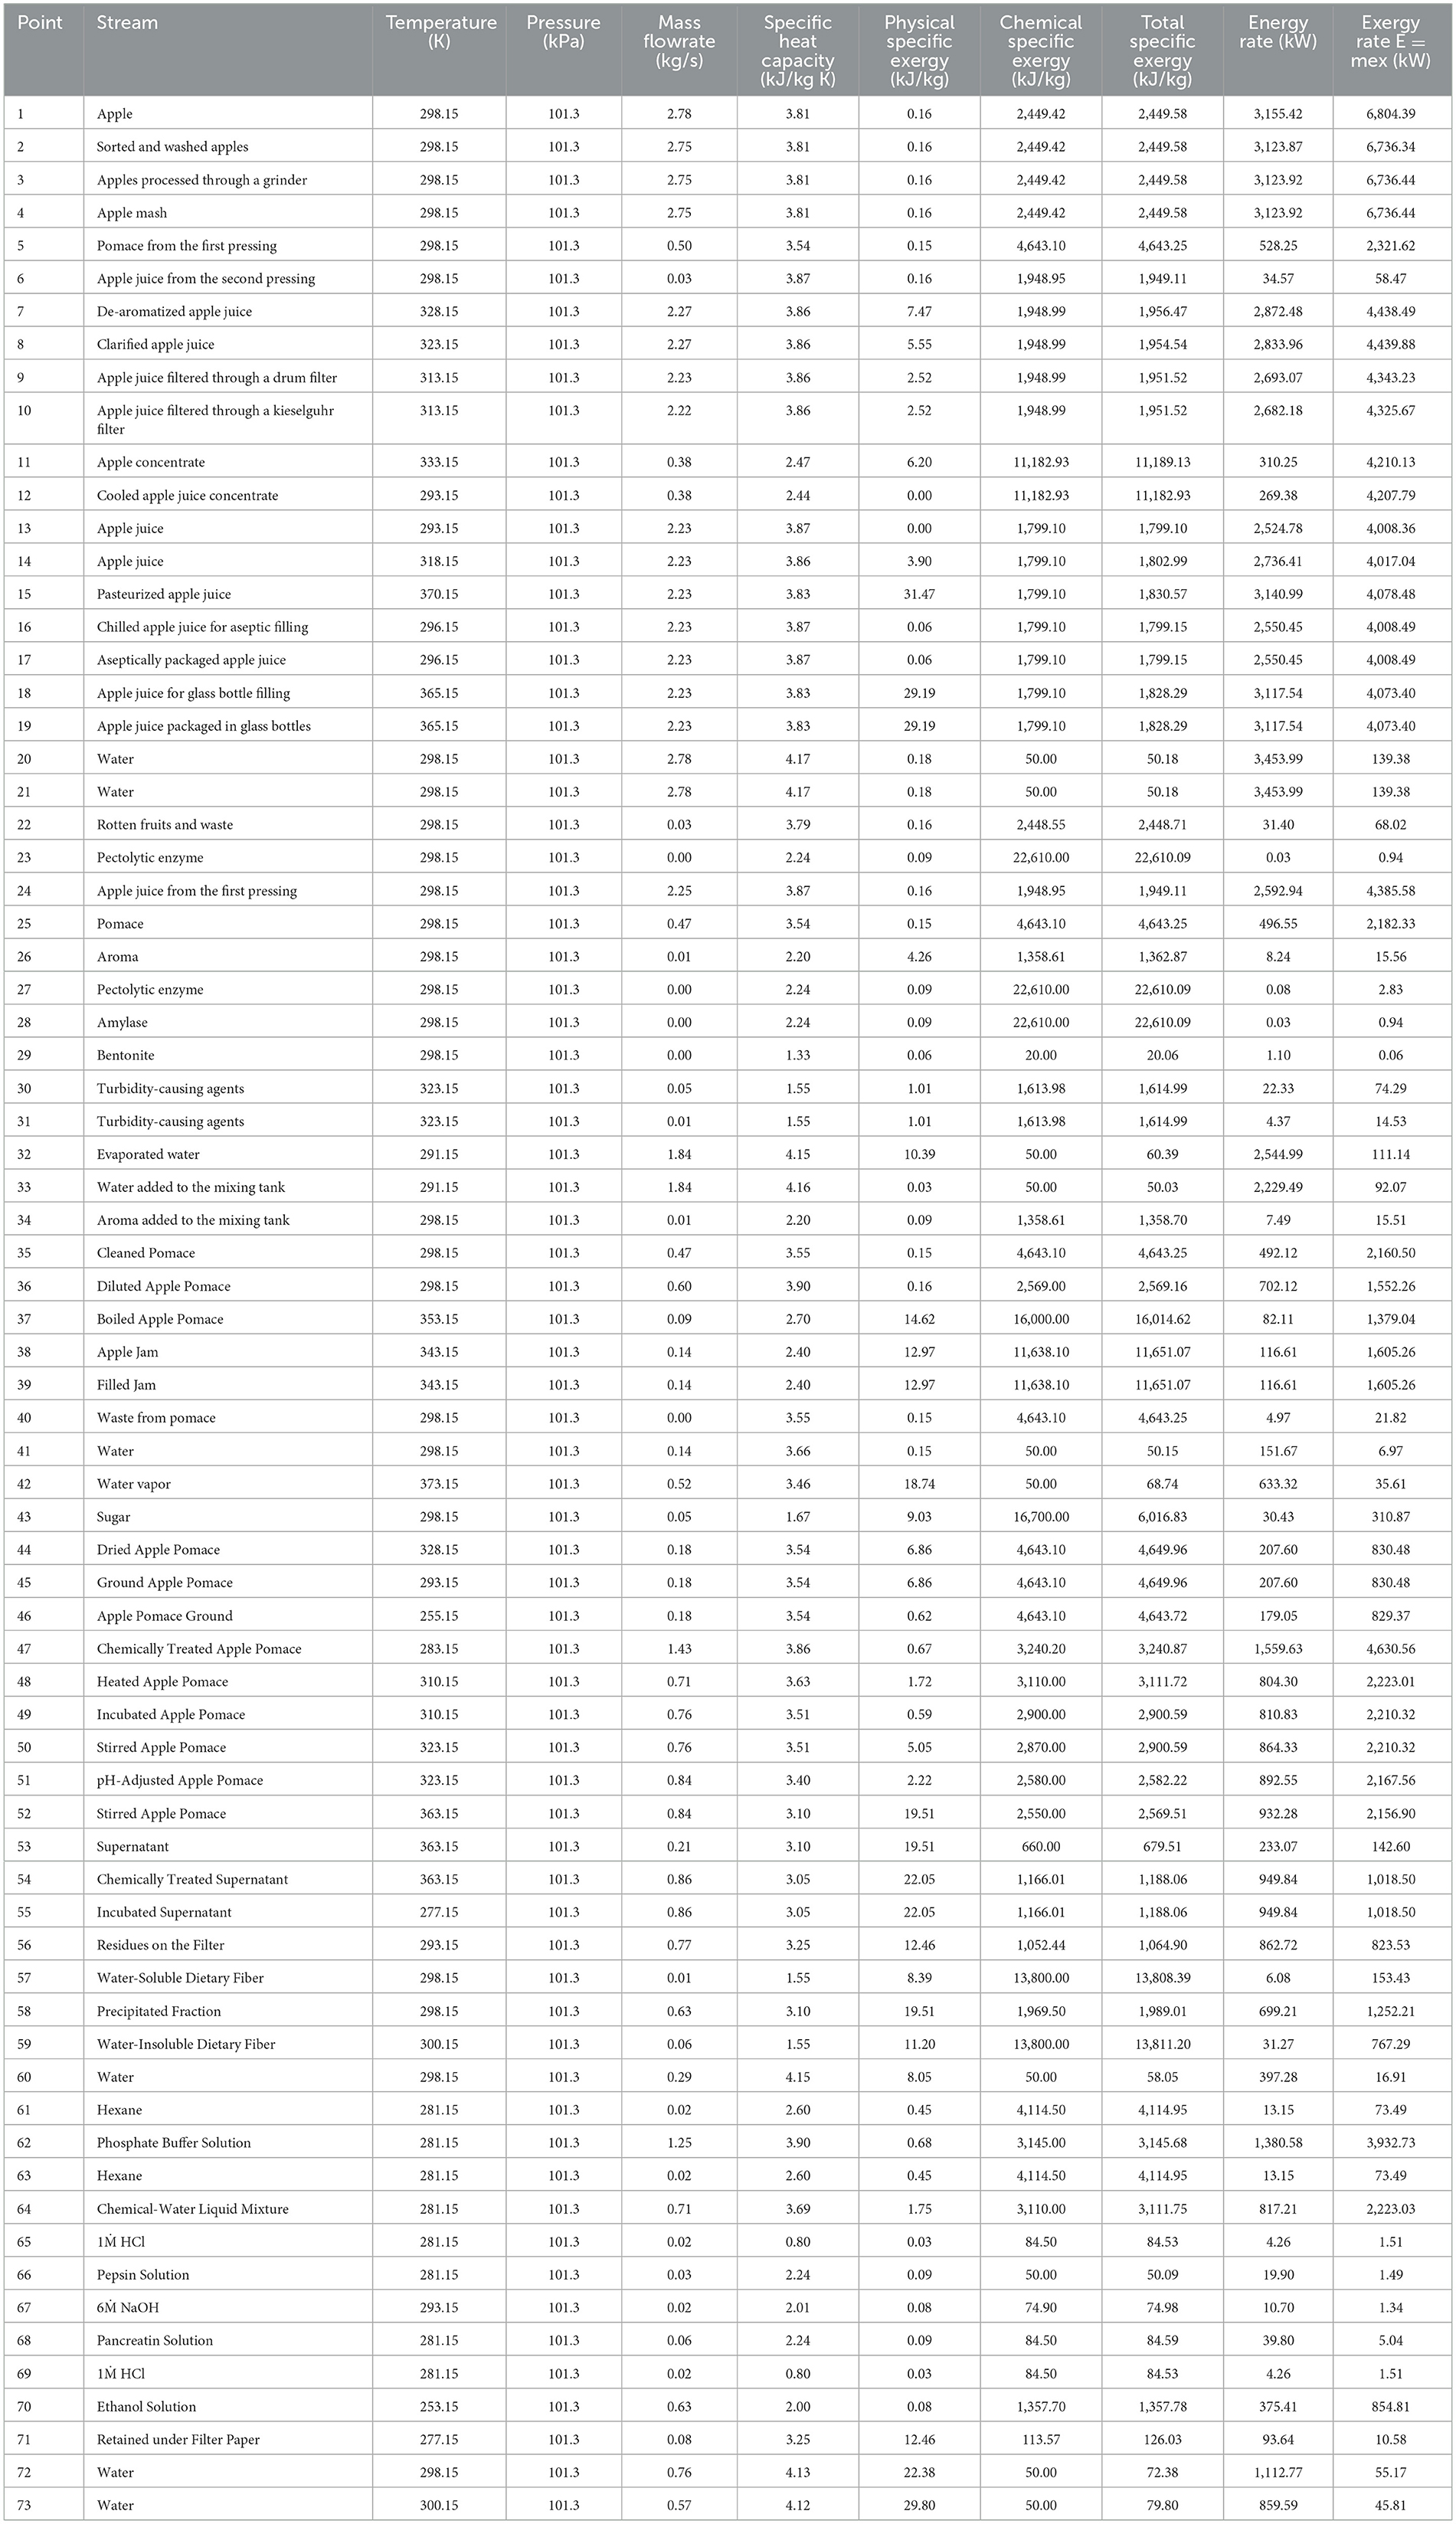
Table 6. Thermodynamic properties of the system at operating conditions (Tref =298.15 K, Pref = 101.325 kPa).
The main components of the system are apple, apple juice, apple juice concentrate, apple pomace, and apple jam. Their composition and percentages are adopted from the references (FitAudit, 2024; Tree Top, 2018; Sharma et al., 2016; Hussein et al., 2015) as shown in Table 1.
3.3.1 Assumptions
In this study on the processing of apple pomace, energy and exergy analyses were carried out under specific assumptions. All processes were evaluated under steady-state conditions, thereby neglecting time-dependent variations. Kinetic and potential energy changes were considered negligible due to low flow velocities and minimal height differences, assuming limited impact on system performance. Ambient reference conditions were taken as constant, with an environmental temperature of 25 °C and pressure of 1 atm. These assumptions were adopted to ensure standardization in exergy calculations. Although specific processes, such as pasteurization, may involve transient behaviors, the steady-state assumption was applied based on the fact that these processes are typically operated under stable conditions in industrial practice. The system boundaries include all main production steps from the initial processing of apple pomace to the final production of jam and dietary fiber. Auxiliary operations (e.g., storage, transportation, and administrative activities) were excluded. This framework allowed the thermodynamic analyses to focus solely on the core processing stages.
The following assumptions are made for the exergy analysis of the system.
(a) All processes are steady state and steady flow with negligible potential and kinetic energy effects.
(b) The directions of heat transfer to the system and work transfer from the system are positive.
(c) The pressure and heat losses in the pipelines and the system components such as grinding, mash enzymation, pressing, and filling are ignored.
(d) The mass flow rate of apple is assumed as 10 tons/h at the process entrance.
(e) The temperature of the apple entering the washing is 25°C.
(f) The reference state temperature and pressure values are 298.15 K and 101.325 kPa, respectively.
(g) The streams are assumed as ideal solution.
3.4 Economic feasibility analysis
This study presents an economic feasibility assessment of two valorization pathways for apple pomace: apple jam production and dietary fiber extraction. Both scenarios were evaluated based on a daily processing capacity of 1.69 tons of apple pomace. Input materials, energy use, labor, equipment investment, and operating costs were quantified using market data and real-time sources accessed in July 2025. Financial indicators such as payback period, Net Present Value (NPV), and Internal Rate of Return (IRR) were calculated using a discounted cash flow (DCF) methodology adapted from Ahmad et al. (2025).
3.4.1 Apple jam production
In the first scenario, 1.69 tons of apple pomace were utilized daily to produce ~500 kg of bottled apple jam. The primary raw material inputs included 190 kg of sugar and 1 ton of water, resulting in a daily raw material cost of ~$219. Additional operating costs included energy consumption ($15/day), labor ($26/day), and packaging and filling expenses ($13/day). The production line was assumed to include cooking vessels, mixers, and filling and packaging systems. The total capital investment required for equipment and installation was estimated at $25,640. The economic analysis considered 300 operating days per year and focused on key profitability metrics such as payback period, NPV (over 5 years at a 10% discount rate), and IRR.
3.4.2 Dietary fiber extraction
In the second scenario, dietary fibers were extracted from the same amount of apple pomace using enzymatic and solvent-based methods. The process involved chemical agents including n-hexane, phosphate buffers, pepsin, pancreatin, NaOH, HCl, ethanol, and process water, with a total daily chemical cost of ~$9,842. Additional operational expenses, including energy, labor, and consumables, amounted to $102/day. The process yielded about 40 kg of soluble fiber and 200 kg of insoluble fiber per day. Product pricing was assumed at $5.85 and $49.5/kg, respectively. The required investment for the extraction infrastructure—comprising reactors, filtration units, drying systems, and packaging lines—was estimated at $46,154. Economic performance indicators were calculated based on 300 working days annually.
3.5 Sustainability indicators
To evaluate the environmental performance of the apple juice production system, three sustainability indicators—GHG abatement, material circularity, and resource saving—were calculated based on the specific chemical exergy of the input and output streams. The baseline scenario involved juice extraction and aseptic packaging, where apple pomace was discarded. Alternative valorization strategies included using pomace to produce dietary fiber and apple jam, thereby enhancing the system's exergy efficiency and reducing environmental impacts. The calculation formulas for the sustainability indicators are provided below.
The greenhouse gas abatement percentage is defined as the relative increase in exergy efficiency of a given scenario compared to the baseline.
Where εex, scenario is the exergy efficiency of the studies scenario, and εex, baseline is the exergy efficicency of the baseline scenario.
Material circularity indicates the percentage of the by-product mass valorized relative to the total amount of generated pomace:
Where, ṁvalorized product is the mass flow of by-product valorized (jam, dietary fiber) and ṁpomace is the total mass flow of generated pomace.
Resource saving (RS), based on exergy, was calculated to assess the potential advantages of transforming apple pomace into value-added products compared to traditional jam and dietary fiber manufacturing. The RS indicator was determined by comparing the exergy rate of the input raw material (fresh apples) with the exergy of the final product(s), taking into account the avoided waste and the potential for valorizing apple pomace. This method allows for evaluating resource efficiency improvements gained through by-product valorization.
Equations 16, 17, and 18 were adapted from Dincer and Rosen (2012), Krausmann et al. (2017), Cornelissen (1997), and Putra et al. (2023), respectively, to quantify GHG abatement, material circularity, and resource saving within the exergy-based sustainability assessment framework.
4 Results
As part of the case study, the stream name, temperature, pressure, specific heat capacity, mass flow rate, specific physical and chemical exergy rates, and total exergy rate for the streams are presented. Additionally, the energy and exergy rates, along with the corresponding stream numbers identified in Figure 2 are detailed in Table 6.
Table 7 illustrates the heat transfer rates of the system components, calculated based on the reference environment conditions (T0 = 298.15 K, P0 = 101.325 kPa).
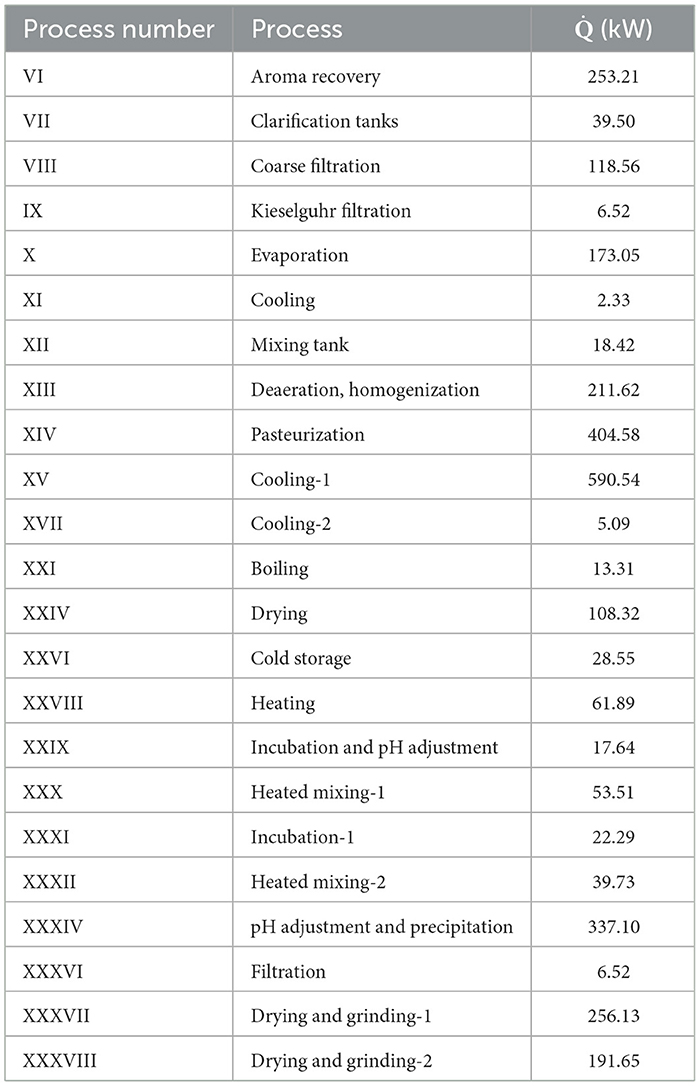
Table 7. Heat transfer rate (kW) of the system at operating conditions (Tref = 298.15 K, Pref = 101.325 kPa).
The overall performance metrics for the aseptic filling and glass bottle process lines are depicted in Figure 5. The general energy efficiencies of apple juice production for the carton aseptic filling and glass bottle filling process lines are 80.8 and 98.8%, respectively. Similarly, the overall exergy efficiencies for these production systems are determined to be 58.9 and 59.9%, respectively.
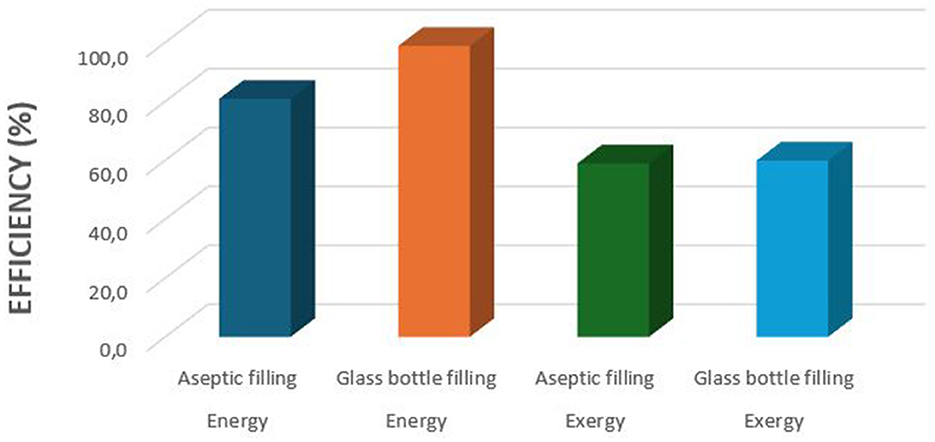
Figure 5. Energy and exergy efficiencies of carton aseptic and glass bottle process lines.
In Figures 6, 7, the left side of the diagrams shows the overall exergy of each process step in kW. In contrast, the right side of the diagrams shows the distribution of the exergy in, exergy out, and exergy destruction terms in the total exergy flows in kW. The exergy flow distribution in the apple juice production process, including both aseptic filling and glass bottle filling stages, is presented through Sankey-Grassman Diagrams (Figures 6, 7).
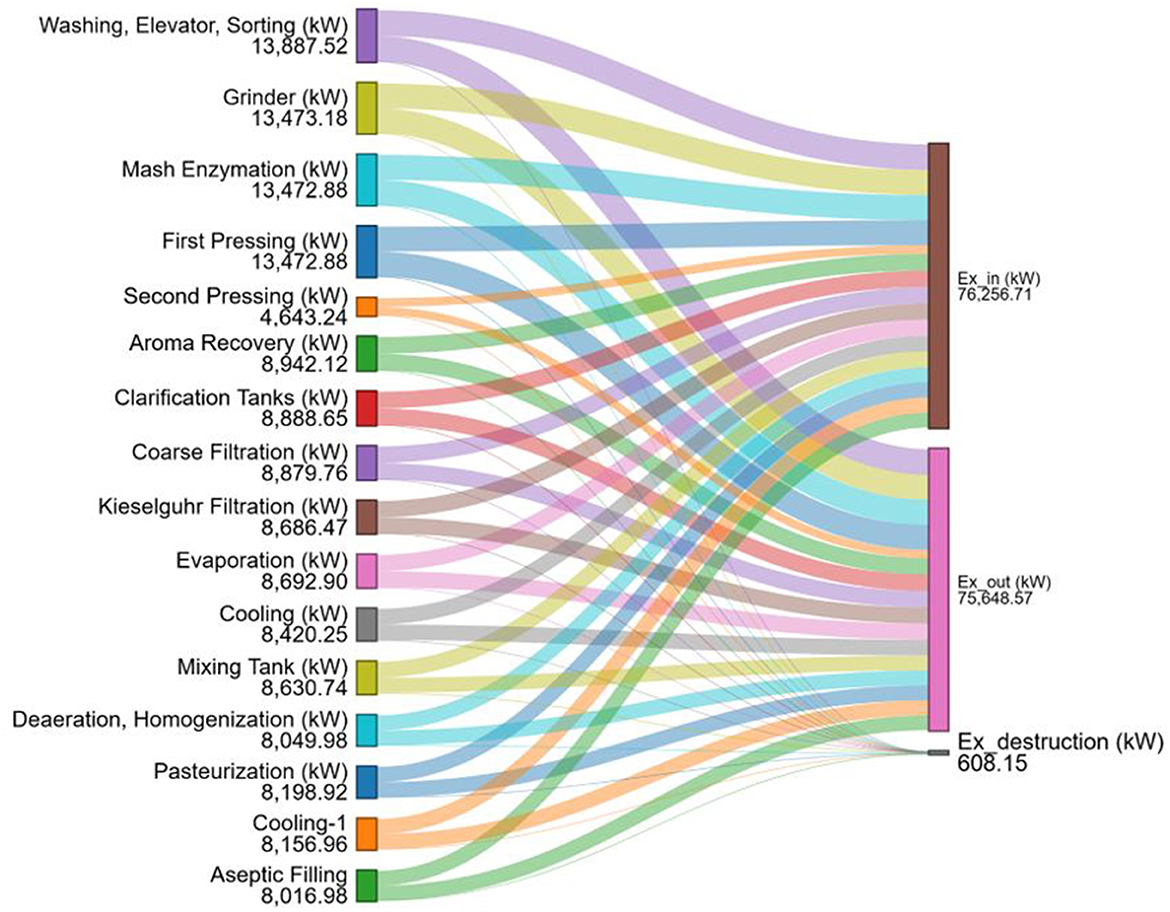
Figure 6. The detailed distribution of total exergy flow for apple juice production with aseptic filling section steps by Sankey-Grassman diagrams.
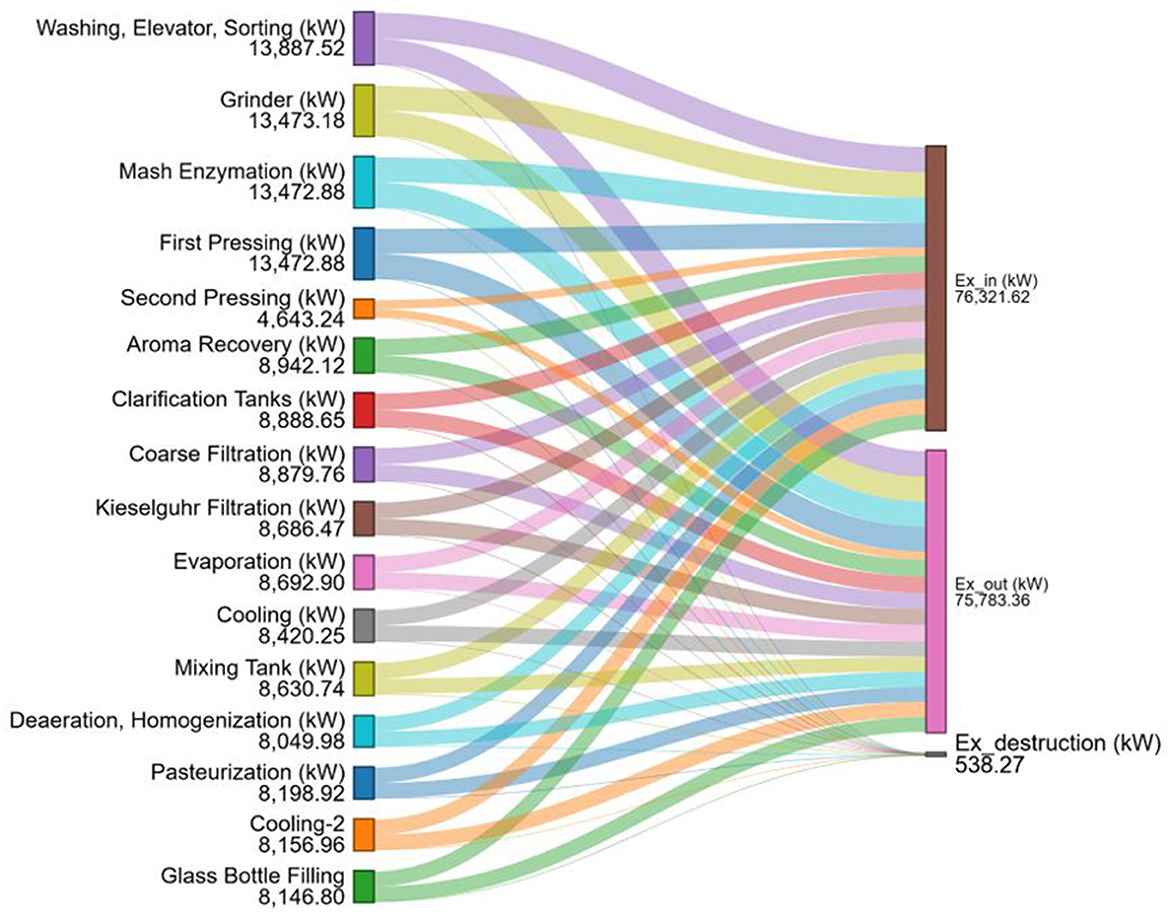
Figure 7. The detailed distribution of total exergy flow for apple juice production with glass bottle filling section steps by Sankey-Grassman diagrams.
Sankey–Grassmann diagram illustrating the exergy flow and destruction across individual unit operations in the apple juice production process with aseptic filling (Figure 6). The highest exergy destruction occurs in the mixing tank, 307.01 kW, followed by the second pressing, 80.82 kW, and Cooling-1, 75.97 kW. Sankey–Grassmann diagram illustrating the distribution of total exergy flow and destruction across the unit operations involved in the apple juice production process with glass bottle filling (Figure 7). The most significant exergy destruction is observed in the mixing tank, 307.01 kW, followed by the second pressing, 80.82 kW, and the first pressing, 29.24 kW. The high exergy destruction in the mixing tank is attributed to changes in the chemical composition, resulting in a product with a higher water content. In the second pressing stage, exergy destruction occurs due to the disposal of apple pomace as waste, which prevents its further utilization. For the cooling-1 process, the significant exergy destruction is due to the high rate of heat transfer. The exergy destruction was calculated as 608.15 kW for the aseptic filling process and 538.27 kW for the glass bottle filling process.
Moreover, as shown in Figure 8, the second pressing stage exhibits the lowest exergy efficiency at 2.5%, followed by the first pressing stage with an efficiency of 65.1%, as identified in the analysis.
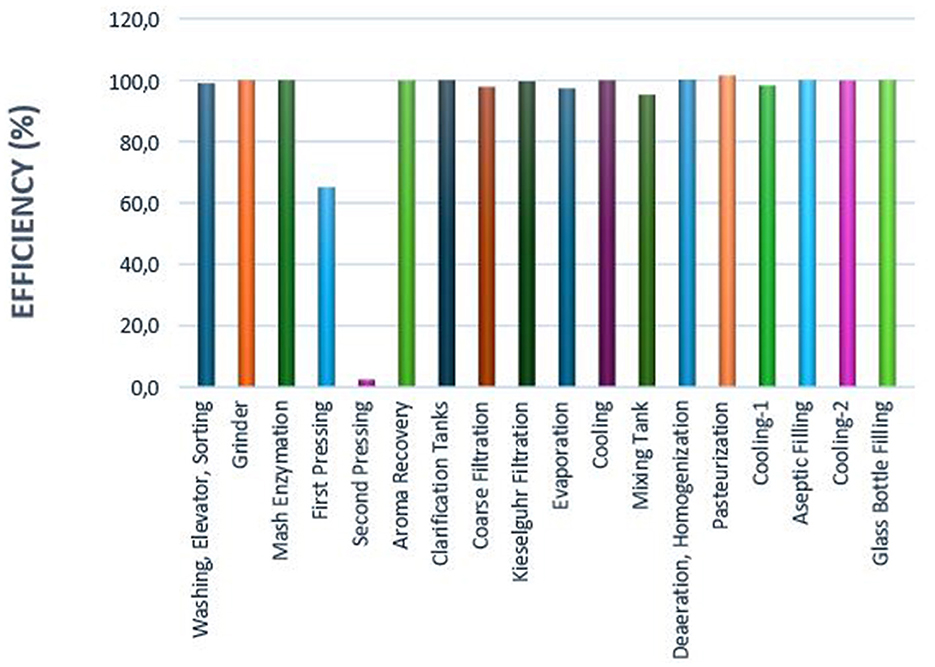
Figure 8. Exergy efficiencies of process steps in different production lines of apple juice production.
Due to the very low exergy efficiency of the second pressing stage, two additional products were derived from the apple pomace waste: apple jam, and dietary fiber, as illustrated in Figures 3, 4, respectively. The detailed distribution of total exergy flow for the jam production process from the apple pomace section steps by Sankey-Grassman Diagrams is shown in Figure 9. The total exergy destruction for the apple jam production process from apple pomace was calculated as 839.73 kW. The dilution stage exhibits the highest exergy destruction, 615.21 kW, followed by boiling, 139.87 kW, and mixture preparation, 84.65 kW, indicating these steps as significant sources of irreversibility.
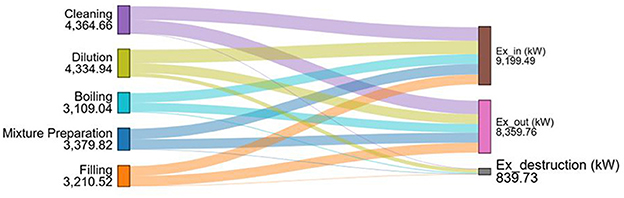
Figure 9. The detailed distribution of total exergy flow for jam production process from apple pomace section steps by Sankey-Grassman diagrams.
Furthermore, the exergy efficiencies at different process stages involved in producing apple jam from the apple pomace waste generated in the second pressing are presented in Figure 10. According to the results, the lowest exergy efficiencies were observed in the dilution and boiling stages, at 71.9 and 88.8%, respectively (Figure 10).
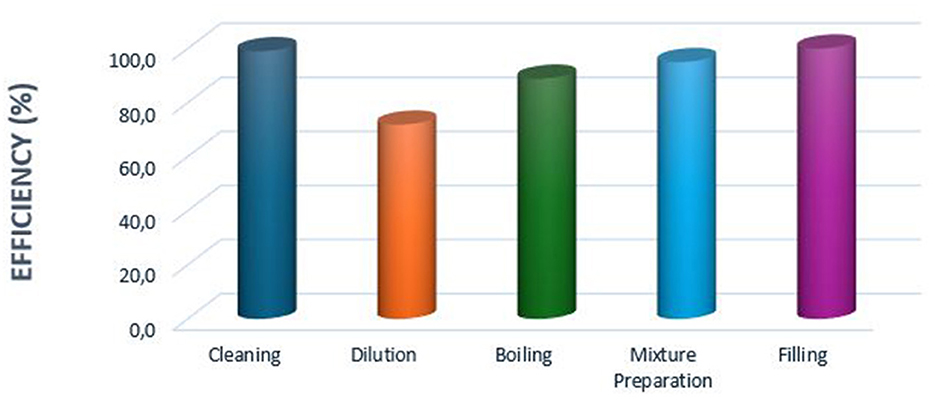
Figure 10. Exergy efficiencies of process steps in different production lines of apple jam production from apple pomace.
The exergy flow for all production stages of the dietary fiber production process from apple pomace is presented in Figure 11. If the apple pomace waste is utilized to produce dietary fiber, the total exergy destruction for the dietary fiber production process is calculated as 3,888.8 kW, as shown in Figure 11. Furthermore, the highest exergy destructions were identified in the drying, centrifugation, drying and grinding-1, and drying and grinding-2 stages, with values of 1,346.48, 762.09, 658.45, and 476.06 kW, respectively. These operations are identified as the main sources of thermodynamic irreversibility within the system. Conversely, units such as grinding, incubation-2, and cold storage demonstrate negligible or zero exergy destruction, indicating near-reversible behavior.
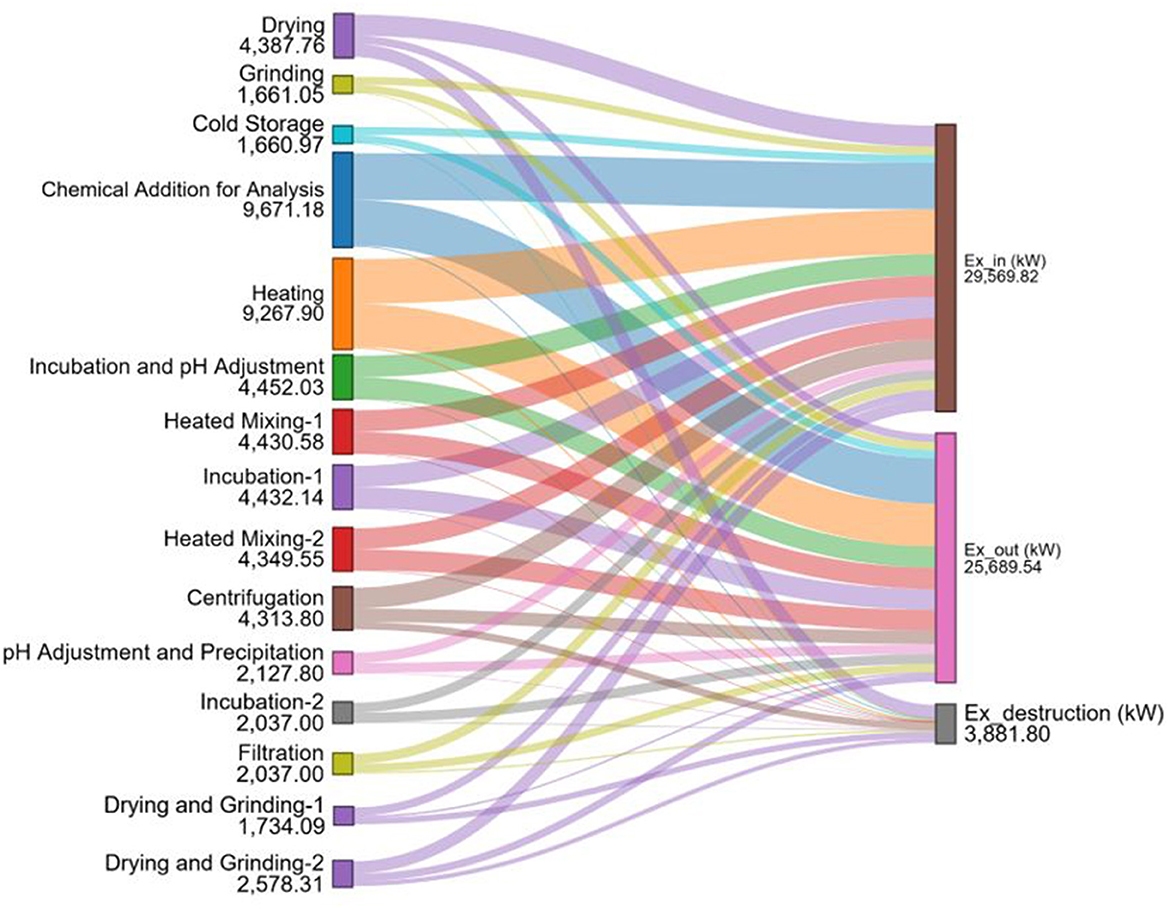
Figure 11. The detailed distribution of total exergy flow for dietary fiber production process from apple pomace section steps by Sankey-Grassman diagrams.
The lowest exergy efficiencies were found in the drying and grinding-1, drying, heating, and centrifugation stages, with values of 18.6, 38.1, 48.0, and 64.7%, respectively (Figure 12).
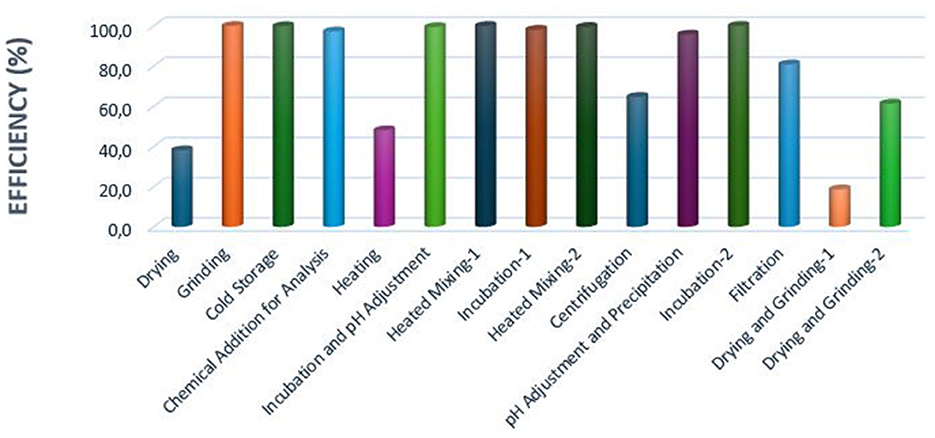
Figure 12. Exergy efficiencies of process steps in different production lines of dietary fiber production from apple pomace.
As illustrated in Table 8, when apple jam is produced from the apple pomace generated during apple juice production using the aseptic filling method, the exergy efficiency increases from 58.9 to 82.5%. When apple juice is produced using the glass bottle filling method, the exergy efficiency is observed to increase from 59.9 to 83.5%. Furthermore, utilizing apple pomace from the aseptic filling process for dietary fiber production improves the system's overall exergy efficiency, raising it from 58.9 to 72.4%. Similarly, when apple juice is produced using the glass bottle filling method, the overall exergy efficiency increases from 59.9 to 73.4%.
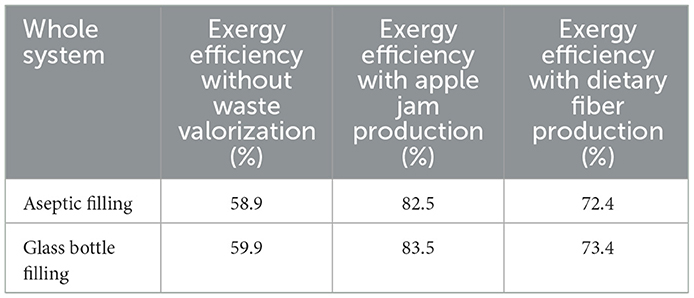
Table 8. The exergy efficiency of the whole system without and with waste valorization.
A sensitivity analysis was conducted to evaluate how variations in selected input parameters influence the exergy destruction rate in the apple juice production process. The analysis was performed separately for aseptic filling and glass bottle filling systems, where exergy destruction was assessed as a function of key process variables. In this study, the change in exergy destruction of the entire system was calculated based on changes in feed temperature and apple input flow rate.
The results show that as the feed temperature increases from 15 to 35°C, the total exergy destruction rises in both aseptic and glass bottle filling systems. For the aseptic filling setup, exergy destruction increases from 563.19 kW at 15°C to 647.97 kW at 35°C, demonstrating a clear upward trend (Figure 13). A similar, though less pronounced, increase occurs in the glass bottle filling system, where exergy destruction ranges from 530.02 to 543.78 kW over the same temperature span. This pattern indicates that higher processing temperatures lead to greater irreversibilities, especially in the aseptic process, probably due to increased thermal energy input and more complex control systems.

Figure 13. Impact of feed temperature on total exergy destruction in aseptic and glass bottle filling processes.
The impact of daily apple input mass on exergy destruction is more substantial than that of temperature. In both filling systems, exergy destruction steadily increases as input mass grows. For aseptic filling, the destruction rate rises from 119.8 kW at 1 ton/day to 1122.77 kW at 20 tons/day. Likewise, in the glass bottle filling process, exergy destruction increases from 112.81 to 1134.94 kW over the same range (Figure 14). The sharp rise emphasizes the direct relationship between process scale and energy losses. It also points to the need for optimizing operational parameters at larger scales to reduce exergy destruction.
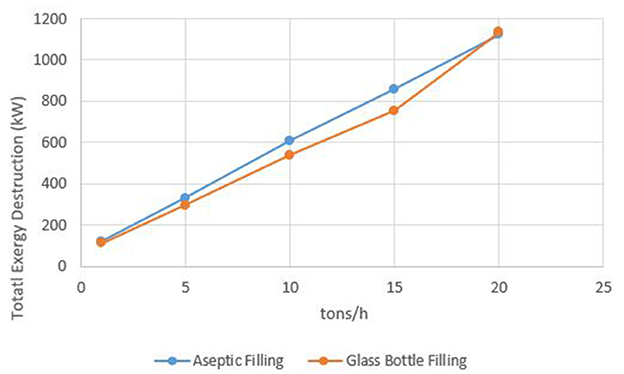
Figure 14. Impact of daily apple intake mass on total exergy destruction in aseptic and glass bottle filling processes.
In this study, an economic feasibility assessment was performed based on a daily production scenario where 500 kg of bottled apple jam is produced from 1.69 tons of apple pomace. The primary raw material inputs include ~190 kg of sugar and 1 ton of water, with a total raw material cost of around $219 per day. Additional daily operating expenses, including energy consumption ($15), labor ($26), and packaging and filling ($13), total ~$54. Consequently, the total daily cost of production is estimated at $273.
Given a market price of ~$5.13 per kilogram of jam (equivalent to 200 TL/kg), the total daily revenue reaches $2,565. This yields a net daily profit of ~$2,292. When extrapolated over 300 operating days, the annual profit reaches roughly $687,600 (Table 9).
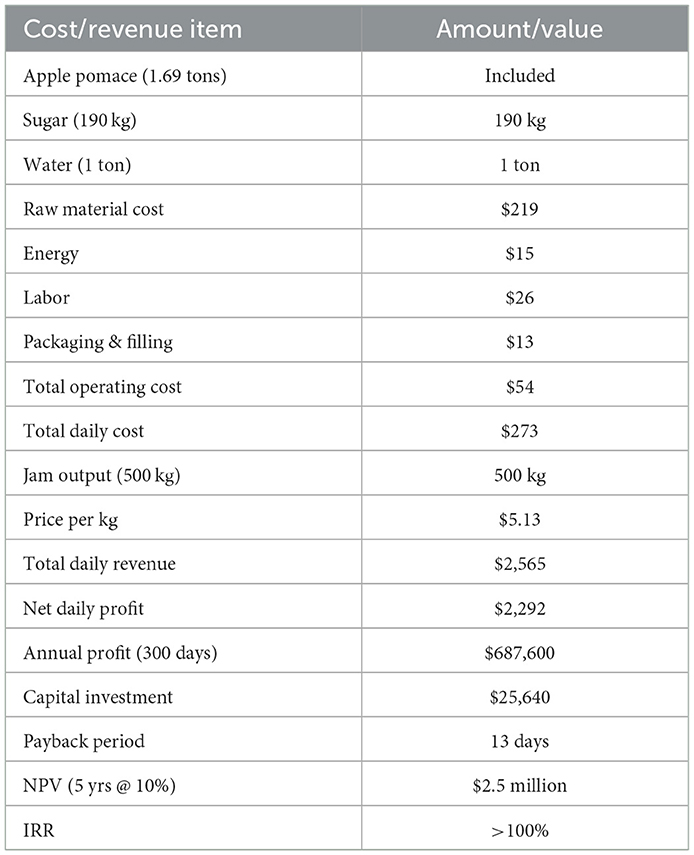
Table 9. Economic feasibility assessment of apple jam production from apple pomace.
The estimated capital investment for equipment and installation including cooking vessels, mixers, filling and packaging systems, and infrastructure is ~$25,640. Based on these figures, the payback period is exceptionally short, around 13 days (0.037 years). The Net Present Value (NPV), calculated over a 5 years period at a 10% discount rate, is ~$2.5 million. The Internal Rate of Return (IRR) exceeds 100%, confirming that valorising apple pomace into jam is not only environmentally beneficial but also economically attractive.
In a complementary scenario, dietary fiber is extracted from the same amount of apple pomace (1.69 tons) using enzymatic and solvent-based processes. The total cost of chemicals including n-hexane, phosphates, pepsin, pancreatin, NaOH, HCl, ethanol, and process water amounts to ~$9,842 per day, with an additional $102 allocated to daily operational expenses such as energy, labor, and consumables, resulting in a total daily cost of $9,944 (Table 10). This process yields around 40 kg of soluble and 200 kg of insoluble dietary fiber daily. To achieve a modest 2% profit margin, the products are assumed to be sold at $5.85 and $49.5/kg, respectively, generating a total revenue of $10,137 per day. This corresponds to a daily profit of ~$193 and an annual profit of $57,900 over 300 operating days. The required investment for dietary fiber production infrastructure comprising extraction reactors, filtration systems, drying and packaging lines, and automation is estimated at $46,154. Under these conditions, the payback period is ~9.5 months, with a 5-year NPV of $179,500 to $205,000 and an IRR ranging from 24 to 28%, highlighting the strong economic potential of this valorisation route as well.
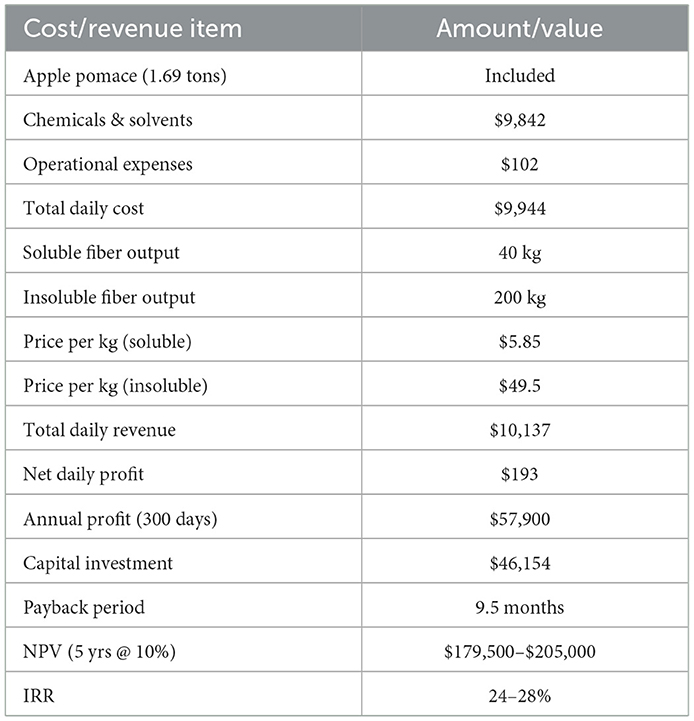
Table 10. Economic feasibility assessment of dietary fiber extraction from apple pomace.
Figure 15 presents the calculated sustainability indicators—exergy efficiency, GHG abatement, material circularity (MC), and resource saving—for six alternative scenarios of apple juice production, combining packaging types (aseptic vs. glass) and pomace valorization strategies (none, jam, and dietary fiber).
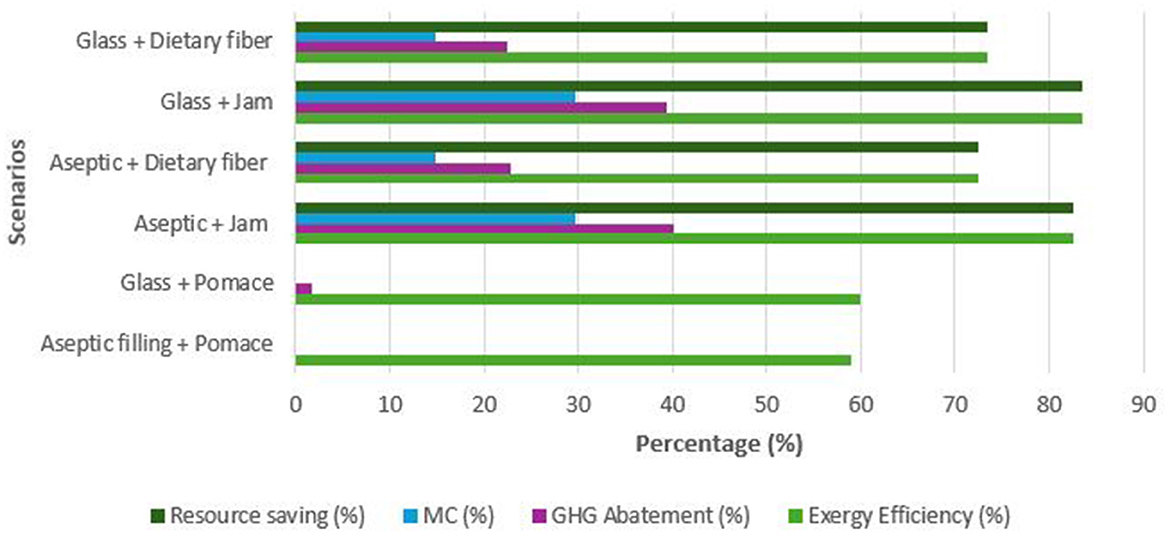
Figure 15. Comparison of sustainability indicators in apple juice processing scenarios.
The baseline scenario, Aseptic filling + Pomace, showed the lowest exergy efficiency (58.90%) and scored zero in all three sustainability indicators, as pomace was discarded. Slight improvement was observed in the Glass + Pomace scenario, with exergy efficiency increasing to 59.90% and a minor GHG abatement of 1.70%, but with no material circularity or resource saving achieved.
Valorization of apple pomace significantly enhanced system performance. The Aseptic + Jam scenario reached an exergy efficiency of 82.50%, with the highest GHG abatement (40.07%), MC (29.79%), and resource saving (82.50%) among the aseptic-based options. A similar trend was observed for the Glass + Jam scenario, which had the highest overall exergy efficiency (83.50%), high GHG abatement (39.40%), and resource saving (83.46%).
Dietary fiber valorization scenarios yielded moderate improvements. Exergy efficiencies were 72.40 and 73.40% for the aseptic and glass packaging cases, respectively. Material circularity was 14.89% in both cases, with GHG abatement rates of around 22.5% and resource savings of approximately 72–73%.
5 Discussion
The results of this study provide significant insights into the energy and exergy efficiencies of apple juice production and its by-product utilization, demonstrating the potential for improving sustainability across various stages of the production process. The findings of the general exergy efficiencies for the carton aseptic filling (58.9%) and glass bottle filling processes (59.9%) align with previous studies in food and beverage processing. For instance, Genc et al. (2017) highlighted similar inefficiencies in the exergy performance of red wine production, with substantial losses attributed to thermal processes such as pasteurization and evaporation. This comparison emphasizes that thermal stages in fruit juice and beverage production are consistently among the most energy-intensive and exergy-destructive steps. The exergy destruction in the mixing tank (307.1 kW) represents the highest contributor to inefficiency, surpassing values reported in studies like those by Khorasanizadeh et al. (2021) on orange juice production, where heating and concentration stages were identified as critical points for exergy losses. This highlights the importance of optimizing mixing and similar operations in high-viscosity and multi-phase systems to reduce irreversibilities.
The study's findings regarding the utilization of apple pomace for producing apple jam and dietary fiber highlight significant improvements in exergy efficiency. Exergy efficiency improvements in the aseptic filling process (from 58.9 to 72.4% with dietary fiber production and 82.5% with apple jam production) and the glass bottle filling process (from 59.9 to 73.4% and 83.5%, respectively) underline the importance of integrating waste valorization practices. These findings are consistent with Sharma et al. (2016) and Demirkol (2021), who reported that by-product utilization not only minimizes waste but also enhances the overall sustainability of fruit processing systems.
The lowest exergy efficiencies observed in the dietary fiber production process such as 18.6% for drying and grinding mirror similar challenges identified in studies like Yildizhan et al. (2021) on renewable energy integration in food systems. Drying, in particular, remains a highly energy-intensive process, and inefficiencies in heat transfer mechanisms are often the root cause of exergy destruction. Innovative drying techniques, such as solar drying or hybrid systems, could be explored to mitigate these losses.
The general energy efficiencies for the aseptic filling (80.8%) and glass bottle filling (98.8%) processes are relatively high, showcasing effective energy management in comparison to traditional processes in the literature. For instance, Nasiri and Aghbashlo, 2023 reported energy efficiencies of 75–85% for similar fruit juice processes, indicating that the studied system performs competitively, particularly in the glass bottle line. However, the discrepancy between energy and exergy efficiencies points to opportunities for further thermodynamic optimization, particularly in addressing irreversibilities.
The findings regarding the dilution (71.9%) and boiling (88.8%) stages in apple jam production, as well as the drying and heating stages in dietary fiber production, are consistent with existing literature that identifies thermal and phase-change processes as critical points for energy loss. Research by Sabanci and Icier (2020) on fruit concentrate production also underscores the need for energy recovery systems and process integration to improve efficiencies in such stages.
According to Kirmizikaya and Çinar (2018), energy efficiency in food processing typically ranges between 70 and 90%, while exergy efficiency varies between 35 and 65%. In the dairy and beverage sector, Kor Simsek and Icier (2024) reported exergy efficiencies ranging from 52.57 to 55.90% for whole milk production lines and as low as 47.39% for more complex products such as milk coffee. In fruit juice processing, Balkan et al. (2005) found energy efficiency to be around 85% in triple-effect evaporator systems used for orange juice concentrate production. In a case study from a juice processing plant in Nigeria, Waheed et al. (2008) reported that the pasteuriser unit accounted for the highest exergy destruction at 90.09%, followed by the packaging unit with 6.60%, while other units contributed less than 3% combined. In the context of wine production, Collectively, these findings underscore the significant thermodynamic inefficiencies caused by thermal operations and auxiliary systems such as steam generation and pasteurization. In comparison, the energy efficiency of 98.8% obtained for the glass bottle filling line in the present study, within the defined system boundaries and assumptions, is remarkably high. When benchmarked against literature data, this result highlights the strong energy management performance of the system and confirms the reliability of the analysis.
Sustainability indicators highlight the significant potential of by-product valorization strategies to improve the sustainability of apple juice production. Discarding pomace, as in the baseline scenario, leads to considerable exergy destruction and a complete absence of circularity or resource recovery (Putra et al., 2023). Merely switching from aseptic to glass packaging, without valorization, provides minimal sustainability gains, indicating that packaging type alone is not sufficient to reduce environmental burdens (Dincer and Rosen, 2012).
Conversely, valorization strategies such as jam and dietary fiber production from pomace contribute markedly to all sustainability indicators. Among these, jam production proved to be the most beneficial in both packaging systems. This is attributed to its higher mass yield and higher chemical exergy content, which directly increases material circularity and exergy efficiency (Cornelissen, 1997; Putra et al., 2023).
Although dietary fiber valorization is slightly less impactful compared to jam, it still offers substantial benefits over pomace disposal. The material circularity values reflect the proportional use of pomace in the valorized outputs, while the resource saving indicator underscores the systemic value of transforming waste into value-added products (Hauschild et al., 2018).
Interestingly, while the Glass + Jam scenario achieved the highest overall performance, the difference compared to its aseptic counterpart is relatively small. This suggests that the choice of valorization pathway plays a more decisive role than the packaging material in improving sustainability outcomes (Krausmann et al., 2017; De Wit et al., 2018).
In conclusion, incorporating by-product valorization into juice processing systems is essential for achieving circularity and reducing environmental impacts. Future system optimizations should focus on maximizing valorized product yields and exploring combinations of multiple valorization streams to enhance performance further (Dincer and Rosen, 2012; Putra et al., 2023).
6 Conclusions
Exergy analysis enables the identification of energy losses and inefficiencies by evaluating the thermodynamic efficiency of energy use, from raw material acquisition to the final product's delivery to end-users (Wang, 2014). The exergy analysis of apple juice production is an emerging field that seeks to optimize energy consumption and enhance sustainability within the food processing industry. Exergy, which refers to the maximum useful work possible during a process, provides a comprehensive framework for evaluating energy efficiency and material flows in food production systems.
This study examines the main processes and stages involved in apple juice production. While thermal analysis, based on the first law of thermodynamics, has traditionally been used to evaluate energy performance, recent research highlights the growing importance of exergy analysis in identifying inefficiencies. Using operational data from the literature, energy and exergy analyses were applied to the apple juice production process. The production stages were categorized into two main methods: aseptic filling and glass bottle filling. Additionally, apple pomace, a byproduct of the process, was utilized to produce dietary fiber and apple jam, demonstrating its potential to enhance sustainability.
The key findings of this study are summarized below:
a) The total exergy destructions for the aseptic filling process, glass bottle filling process, apple jam production from waste pomace, and dietary fiber production processes were calculated as 608.15, 538.27, 839.73, and 3,881.8 kW, respectively.
b) The general energy efficiencies of apple juice production in the carton aseptic filling and glass bottle filling process lines are determined as 80.8 and 98.8% respectively. The related general exergy efficiencies for these production systems are determined as 58.9 and 59.9% respectively.
c) The analysis indicates that the highest exergy destruction occurs in the mixing tank with 307.1 kW, followed by the second pressing stage with 80.82 kW and the cooling-1 process with 75.97 kW.
d) In the apple jam production process, the results indicate that the dilution and boiling stages exhibited the lowest exergy efficiencies, with values of 71.9 and 88.8%, respectively.
e) In the production of dietary fiber from apple pomace, the lowest exergy efficiencies were found in the drying and grinding-1, drying, heating, and centrifugation stages, with values of 18.6, 38.1, 48.0, and 64.7%, respectively.
f) During the aseptic filling process, the exergy efficiency increases from 58.9 to 72.4% for dietary fiber production and 82.5% for apple jam production.
g) In apple juice production using the glass bottle filling process, exergy efficiency increases from 59.9 to 73.4% with dietary fiber production, and to 83.5% with apple jam production.
Analysis of the apple juice production process reveals that chemical exergies have a more significant impact compared to physical exergies. The findings highlight the importance of maximizing the efficient use of all materials to achieve improved exergy performance. Repurposing waste streams, such as apple pomace, plays a critical role in enhancing sustainability. To further enhance exergy efficiency, future research should prioritize the development of innovative, value-added products from apple pomace. Moreover, conducting life cycle assessments to evaluate the environmental impacts of production processes is essential for achieving more sustainable outcomes. Future research and technological innovations are necessary to optimize these processes and transition to more energy-efficient systems. Also, the economic feasibility of implementing such improvements, as well as their scalability across diverse production facilities, should be explored.
Data availability statement
The original contributions presented in the study are included in the article/supplementary material, further inquiries can be directed to the corresponding author.
Author contributions
DC: Visualization, Formal analysis, Writing – original draft, Resources, Data curation, Investigation. SG: Writing – review & editing, Project administration, Methodology, Writing – original draft, Supervision, Conceptualization. YG: Conceptualization, Project administration, Writing – review & editing, Methodology, Supervision.
Funding
The author(s) declare that no financial support was received for the research and/or publication of this article.
Acknowledgments
The authors would like to thank the reviewers for their valuable comments and suggestions, which helped improve the quality of the manuscript.
Conflict of interest
SG was employed by Genc ve Naturel Food Industry Trade Inc.
The remaining authors declare that the research was conducted in the absence of any commercial or financial relationships that could be construed as a potential conflict of interest.
Generative AI statement
The author(s) declare that no Gen AI was used in the creation of this manuscript.
Any alternative text (alt text) provided alongside figures in this article has been generated by Frontiers with the support of artificial intelligence and reasonable efforts have been made to ensure accuracy, including review by the authors wherever possible. If you identify any issues, please contact us.
Publisher's note
All claims expressed in this article are solely those of the authors and do not necessarily represent those of their affiliated organizations, or those of the publisher, the editors and the reviewers. Any product that may be evaluated in this article, or claim that may be made by its manufacturer, is not guaranteed or endorsed by the publisher.
References
Ahmad, N., Hosseini, T., and Zhang, L. (2025). Process design and techno-economic analysis for the production of furfural from catalytic fast pyrolysis of sugarcane biomass. Chem. Eng. Res. Design 219, 306–321. doi: 10.1016/j.cherd.2025.06.017
Balkan, F., Colak, N., and Hepbasli, A. (2005). Performance evaluation of a triple-effect evaporator with forward feed using exergy analysis. Int. J. Energy Res. 29, 455–470. doi: 10.1002/er.1074
Başaran, A., Yilmaz, T., Azgin, S. T., and Çivi, C. (2021). Comparison of drinking milk production with conventional and novel inductive heating in pasteurization in terms of energetic, exergetic, economic, and environmental aspects. J. Clean. Prod. 317:128280. doi: 10.1016/j.jclepro.2021.128280
Brown, S. (2012). “Apple,” in Fruit Breeding. Handbook of Plant Breeding, Vol 8, eds M. Badenes and D. Byrne (Boston, MA: Springer). doi: 10.1007/978-1-4419-0763-9_10
Cemeroglu, B. S. (2019). Meyve ve Sebze Işleme Teknolojisi, Cilt 1 (8. Baski). Ankara: TLB Yayinlari, 707 (in Turkish).
Çengel, Y. A., Boles, M. A., and Kanoglu, M. (2019). Thermodynamics: An Engineering Approach, 10th Edn. New York, NY: McGraw-Hill Education.
Cornelissen, R. L. (1997). Thermodynamics and Sustainable Development: The Use of Exergy Analysis and the Reduction of Irreversibility (Doctoral dissertation). University of Twente, Enschede, The Netherlands.
Costa, J. M., Ampese, L. C., Ziero, H. D. D., Sganzerla, W. G., and Forster-Carneiro, T. (2022). Apple pomace biorefinery: Integrated approaches for the production of bioenergy, biochemicals, and value- added products – an updated review. J. Environ. Chem. Eng. 10:108358. doi: 10.1016/j.jece.2022.108358
De Wit, M., Hoogzaad, J., Ramkumar, S., Friedl, H., and Douma, A. (2018). The Circularity Gap Report 2018. Amsterdam: Circle Economy.
Demirkol, M. (2021). Isolation of Dietary Fibers From Fruit Juice Processing Waste and Their Use in Yogurt Production (PhD dissertation). Ordu University, Ordu, Turkey.
Dincer, I., and Cengel, Y.A. (2001). Energy, entropy and exergy concepts and their roles in thermal engineering. Entropy 3, 116–149. doi: 10.3390/e3030116
Dincer, I., and Rosen, M. A. (2012). Exergy: Energy, Environment and Sustainable Development, 2nd Edn. Amsterdam: Elsevier.
Duggan, J., Yu, L., Fitter, S., Kumorkiewicz-Jamro, A., Vandyke, K., Bulone, V., et al. (2025). Apple pomace polyphenols extracted by deep eutectic solvent ameliorate lipopolysaccharide-induced inflammation in RAW264.7 murine macrophages and human monocyte-derived macrophages. ACS Food Sci. Technol. 5, 1354–1364. doi: 10.1021/acsfoodscitech.4c00932
EPA (2025). National Strategy for Reducing Food Loss and Waste and Recycling Organics. Available online at: https://www.epa.gov/circulareconomy/national-strategy-reducing-food-loss-and-waste-and-recycling-organics (accessed May 15, 2025).
European Commission (2020). A New Circular Economy Action Plan: For a Cleaner and More Competitive Europe. Available online atat: https://eur-lex.europa.eu/resource.html?uri=cellar:9903b325-6388-11ea-b735-01aa75ed71a1.0017.02/DOC_1&format=PDF (accessed May15, 2025).
FAO (2023). Food and Agriculture Organization of United States. Available online at: https://www.fao.org/faostat/en/#data/QCL (accessed February 10, 2025).
Fetting, C. (2020). The European Green Deal. ESDN Report. Available online at: https://www.esdn.eu/fileadmin/ESDN_Reports/ESDN_Report_2_2020.pdf (accessed May 15, 2025).
FitAudit (2024). Nutritional Composition of Apples and Apple Juice. Available online at: https://fitaudit.com/food (accessed January 6, 2024).
Garcia-Garcia, G., Azanedo, L., and Rahimifard, S. (2021). Embedding sustainability analysis in new food product development. Trends Food Sci. Technol. 108, 236–244. doi: 10.1016/j.tifs.2020.12.018
Genc, M., Genc, S., and Goksungur, Y. (2017). Exergy analysis of wine production: Red wine production process as a case study. Appl. Therm. Eng. 117, 511–521. doi: 10.1016/j.applthermaleng.2017.02.009
Genc, S., and Hepbasli, A. (2015). Performance assessment of a potato crisp frying process. Drying Technol. 33, 865–875. doi: 10.1080/07373937.2014.994066
Hauschild, M. Z., Rosenbaum, R. K., and Olsen, S. I. (2018). Life Cycle Assessment: Theory and Practice. Cham: Springer.
Hussein, A. M. S., Kamil, M. M., Hegazy, N. A., Mahmoud, K. F., and Ibrahim, M. A. (2015). Utilization of some fruits and vegetables by-products to produce high dietary fiber jam. Food Sci. Qual. Manag. 37, 39–45.
Kauser, S., Murtaza, M. A., Hussain, A., Imran, M., Kabir, K., Najam, A., et al. (2024). Apple pomace, a bioresource of functional and nutritional components with potential of utilization in different food formulations: a review. Food Chem. Adv. 4:100598. doi: 10.1016/j.focha.2023.100598
Khanali, M., Kokei, D., Aghbashlo, M., Nasab, F. K., Hosseinzadeh-Bandbafha, H., and Tabatabaei, M. (2020). Energy flow modeling and life cycle assessment of apple juice production: recommendations for renewable energies implementation and climate change mitigation. J. Clean. Prod. 246:118997. doi: 10.1016/j.jclepro.2019.118997
Khorasanizadeh, Z., Nasiri, F., and Faraji Mahyari, K. (2021). A detailed thermodynamic assessment and exergetic performance analysis of an industrial-scale orange juice production plant. Int. J. Exergy 35, 291–326. doi: 10.1504/IJEX.2021.115896
Kirmizikaya, E. S., and Çinar, I. (2018). Application of Energy and Exergy Analyses in Food Industry, 157–160. Available online at: https://www.researchgate.net/publication/352771648 (accessed July 26, 2025). (in Turkish).
Kor Simsek, G., and Icier, F. (2024). Exergo-economic approach for comprehensive evaluation of the performance of industrial-scale milk and coffee beverage process lines. Food Bioprod. Process. 147, 148–161. doi: 10.1016/j.fbp.2024.06.007
Krausmann, F., Schandl, H., Eisenmenger, N., Giljum, S., and Jackson, T. (2017). Material flow accounting: measuring global material use for sustainable development. Ann. Rev. Environ. Resour. 42, 647–675. doi: 10.1146/annurev-environ-102016-060726
Mordor Intelligence (2025). Available online at: https://www.mordorintelligence.com/industry-reports/global-juices-market (accessed February 10, 2025).
Muslu Can, A., Yildirim, R. M., and Karadag, A. (2024). The properties of pectin extracted from the residues of vinegar-fermented apple and apple pomace. Fermentation 10:556. doi: 10.3390/fermentation10110556
Nasiri, F., and Aghbashlo, M. (2023). Exergy-based sustainability analysis of food production systems. Planet. Sustain. 1, 19–44. doi: 10.46754/ps.2023.07.003
Oztuna Taner, O. (2024). Enhancement of the energy and exergy analysis capabilities of the yoghurt process: a case study of the dairy industry. Front. Sustain. Food Syst. 8:1450653. doi: 10.3389/fsufs.2024.1450653
Ploscutanu, G., Elisei, A., and Buzia, O. D. (2019). Nutraceutical properties of apples and derived products (pomace, seeds, peels). Rev. Chim. 70, 934–939. doi: 10.37358/RC.19.3.7034
Putra, N. R., Rizkiyah, D. N., Abdul Aziz, A. H., Che Yunus, M. A., Veza, I., Harny, I., et al. (2023). Waste to wealth of apple pomace valorization by past and current extraction processes: A review. Sustainability 15:830. doi: 10.3390/su15010830
Rebolledo-Leiva, R., Estévez, S., Hernández, D., Feijoo, G., Moreira, M.T., and González-García, S. (2024). Apple pomace integrated biorefinery for biofuels production: a techno-economic and environmental sustainability analysis. Resources 13:156. doi: 10.3390/resources13110156
Sabanci, S., and Icier, F. (2020). Enhancement of the performance of sour cherry juice concentration process in vacuum evaporator by assisting ohmic heating source. Food Bioprod. Process. 122, 269–279. doi: 10.1016/j.fbp.2020.05.007
Sabanci, S., and Içier, F. (2022). Evaluation of an ohmic assisted vacuum evaporation process for orange juice pulp. Food Bioprod. Process. 131, 156–163. doi: 10.1016/j.fbp.2021.09.009
Sharma, R. R., Sharma, S., Sanikommu, V. R. R., and Krishna, K. R. (2016). Enjoying value added products from apple pomace. Ind. Hortic. 61, 17–19.
Singh, G., Singh, P. J., Tyagi, V. V., Barnwal, P., and Pandey, A. K. (2019). Exergy and thermoeconomic analysis of cream pasteurisation plant. J. Therm. Anal. Calorim. 137, 1381–1400. doi: 10.1007/s10973-019-08016-y
Smith, M., and Lal, P. (2022). Environmental and economic assessment of hard apple cider using an integrated LCA-LCC approach. Sustain. Prod. Consum. 32, 282–295. doi: 10.1016/j.spc.2022.04.026
Soufiyan, M. M., Dadak, A., Hosseini, S. S., Nasiri, F., Dowlati, M., Tahmasebi, M., et al. (2016). Comprehensive exergy analysis of a commercial tomato paste plant with a double-effect evaporator. Energy 111, 910–922. doi: 10.1016/j.energy.2016.06.030
Statista (2023). Available online at: https://www.statista.com/outlook/cmo/non-alcoholic-drinks/juices/apple-juice/worldwide (Accessed February 2, 2025).
Sulaiman, M. A., Oni, A. O., and Fadare, D. A. (2012). Energy and exergy analysis of a vegetable oil refinery. Energy Power Eng. 4, 358–364. doi: 10.4236/epe.2012.45047
Syahrul, S., Hamdullahpur, F., and Dinçer, I. (2002). Exergy analysis of fluidized bed drying of moist particles. Exergy 2, 87–89 doi: 10.1016/S1164-0235(01)00044-9
Szargut, J., Morris, D. R., and Steward, F. R. (1988). Exergy Analysis of Thermal, Chemical, and Metallurgical Processes. New York, NY: Hemisphere Publishing.
Taner, T., and Sivrioglu, M. (2015). Energy–exergy analysis and optimisation of a model sugar factory in Turkey. Energy 93, 641–654. doi: 10.1016/j.energy.2015.09.007
Torshizi, M. V., Azadbakht, M., and Kashaninejad, M. (2020). Application of response surface method to energy and exergy analyses of the ohmic heating dryer for sour orange juice. Fuel 278:118261. doi: 10.1016/j.fuel.2020.118261
Tree Top, Inc. (2018). Apple Juice Concentrate Product Data Sheet. Available online at: https://www.treetop.com (accessed January 6, 2024).
UNEP (2024). Global Waste Management Outlook 2024. Available online at: https://www.unep.org/resources/global-waste-management-outlook-2024 (accessed April 30, 2025).
Vaez, S., Karimi, K., Denayer, J. F. M., and Kumar, R. (2023). Evaluation of apple pomace biochemical transformation to biofuels and pectin through a sustainable biorefinery. Biomass Bioenergy 172:106757. doi: 10.1016/j.biombioe.2023.106757
Vallée Marcotte, B., Verheyde, M., Pomerleau, S., Doyen, A., and Couillard, C. (2022). Health benefits of apple juice consumption: a review of interventional trials on humans. Nutrients 14:821. doi: 10.3390/nu14040821
Waheed, M. A., Jekayinfa, S. O., Ojediran, J. O., and Imeokparia, O. E. (2008). Energetic analysis of fruit juice processing operations in Nigeria. Energy 33, 35–45. doi: 10.1016/j.energy.2007.09.001
Wang, L. (2014). Energy efficiency technologies for sustainable food processing. Energy Efficiency 7, 791–810. doi: 10.1007/s12053-014-9256-8
Yildirim, N., and Genc, S. (2015). Thermodynamic analysis of a milk pasteurization process assisted by geothermal energy. Energy 93, 1–10. doi: 10.1016/j.energy.2015.08.003
Yildirim, N., and Genc, S. (2017). Energy and exergy analysis of a milk powder production system. Energy Conv. Manag. 149, 698–705. doi: 10.1016/j.enconman.2017.01.064
Yildizhan, H., Taki, M., Özilgen, M., and Gorjian, S. (2021). Renewable energy utilization in apple production process: a thermodynamic approach. Sustain. Energy Technol. Assess. 43:100956. doi: 10.1016/j.seta.2020.100956
Zalazar-Garcia, D., Scenna, N. J., Mussati, M. C., and Mussati, S. F. (2022). Exergy, energy, and sustainability assessments applied to RSM optimization of integrated convective-air drying of blueberries. Sustain. Energy Technol. Assess. 49:101777. doi: 10.1016/j.seta.2021.101777
Zisopoulos, F. K., Rossier-Miranda, F. J., van der Goot, A. J., and Boom, R. M. (2017). The use of exergetic indicators in the food industry - a review. Crit. Rev. Food Sci. Nutr. 57, 197–211. doi: 10.1080/10408398.2014.975335
Nomenclature
Keywords: apple juice, exergy analysis, sustainability, food processing, waste valorization
Citation: Cabuk Kok D, Genc S and Goksungur Y (2025) Evaluation of energy and exergy analysis of apple juice production and waste valorization processes. Front. Sustain. Food Syst. 9:1594745. doi: 10.3389/fsufs.2025.1594745
Received: 16 March 2025; Accepted: 02 September 2025;
Published: 01 October 2025.
Edited by:
Cristina Rocha, University of Minho, PortugalReviewed by:
Hebatullah Ali Yusuf, Alexandria University, EgyptAdnan Mukhtar, National Institute of Food Science and Technology, Pakistan
Copyright © 2025 Cabuk Kok, Genc and Goksungur. This is an open-access article distributed under the terms of the Creative Commons Attribution License (CC BY). The use, distribution or reproduction in other forums is permitted, provided the original author(s) and the copyright owner(s) are credited and that the original publication in this journal is cited, in accordance with accepted academic practice. No use, distribution or reproduction is permitted which does not comply with these terms.
*Correspondence: Seda Genc, c2VkYS5nZW5jQHlhc2FyLmVkdS50cg==